
Abstract
Civil or government organizations base human settlement transformation decisions on limited and sparse data. However, broader and denser information is necessary. Camera and LiDAR data processing is a more effective, automatic, and affordable method to fully characterize the morphological structure of human settlements. This work presents a system for estimating metrics about relevant morphological characteristics of human settlements using LiDAR data. We provide a quantitative analysis of these metrics obtained in the city of Cali, Colombia. Additionally, we enable the automatic calculation of urban metrics such as the street canyon ratio, which relates building height to street width, a metric highly correlated with air quality. Moreover, we extrapolate findings from existing literature to compare our results and understand how indirectly measured variables, such as thermal sensation and perceived beauty of the environment, might behave Our system can potentially be used by civil and government organizations to develop informed and precise urban planning and transformation strategies, including land use zoning, infrastructure development, and addressing issues related to housing, transportation, and environmental sustainability.
Introduction
In 2015, it was estimated that approximately 54% of the world’s population lives in cities and that 25% of this population built their residences in informal settlements Jones (2017). By 2020, nearly one billion people were inhabiting informal settlements Salazar Miranda et al. (2022). It is expected that by 2050, 70% of the world’s population will live in cities and that unless radical changes are made, around three billion people will live in informal settlements. According to Schwab (2018), in Latin America, informal settlements are developed through self-help and self-building initiatives by individuals, but they are also formed by public intervention. This characteristic usually makes that human settlements in Latin American cities are a combination of formal and informal socio-spatial strategies. These human settlements play a crucial role in shaping the way societies grow. They influence how people live and interact with each other and, ultimately, the standard of living. Civil or government organizations’ primary objective is to ensure the planned, sustainable, and equitable development of settlements that provide a high quality of life for their residents. However, achieving this requires a detailed consideration of a plethora of aspects, including the morphology of these human settlements. The layout of streets and pathways can affect the ease of movement within a settlement. Well-designed, walkable neighborhoods with easy access to essential services, public transportation, and recreational areas contribute to a higher quality of life by promoting physical activity, reducing congestion, and fostering social interactions (Baobeid et al., 2021).
Especially in developing countries, civil and government organizations often lack access to rich, detailed and trustworthy descriptions of their cities. As a result, they tend to make human settlement transformation decisions based on limited available information. The Inter-American Development Bank (IDB) recognizes the lack of available information when carrying out urban planning in low-income countries, in particular, the absence of up-to-date digital maps of existing urban structures. As a way to contribute to solving this issue, IDB’s Housing and Urban Development Division has developed the Open Urban Planning Toolbox Patricio Zambrano (Barragan et al., 2020). The toolbox provides multiple ways to characterize the morphology of human settlements, one of which generates a building map from satellite images. This information is useful for obtaining high-level metrics, such as the location of non- planned or informal areas, or even individual building locations; however, detailed metrics obtained from a person- view perspective are also needed to fully characterize the morphology of human settlements. Camera and LiDAR data processing is a more effective, detailed, and affordable method to fully characterize the morphological structure of human settlements (Wang et al., 2019).
Informal settlements are characterized by a combination of concentrated poverty, insecurity, low housing quality and governmental neglect (Snyder et al., 2014). In terms of morphology, these settlements are characterized by an in- homogeneity in housing construction (Stasolla and Gamba, 2008). It is mentioned by Snyder et al. (2014) that urban informal settlements are often under-recognized in national and regional surveys. Given this condition, in this paper, we focus on exploring the morphology of the informal urban neighborhood of Siloe´ in the city of Santiago de Cali using the LiDAR information collected by our system. The rest of this paper is organized as follows. After discussing related work in Section II, we describe some of the most relevant morphological aspects of human settlements in Section III. In Section IV, we thoroughly examine our system’s underlying structure and the seamless integration of sensors. Section V presents the systematic procedures we use for data collection and analysis of variables. In Section VI, we present the findings derived from our collected data. Finally, Section VII encapsulates conclusions and insights drawn from our study and outlines potential directions for future research.
Related work
City Information Modeling (CIM) is a comprehensive and data-driven approach that parallels Building Information Modeling (BIM) principles but is tailored for urban environments. CIM involves creating digital representations of entire cities or urban areas, integrating diverse data sources and information to facilitate holistic urban planning, design, operation, and management (Souza and Bueno, 2022).
The morphological intricacies and irregularities found in informal settlements create challenges for traditional methods used in morphological analysis and mapping. Approaches based on data collection from a top-down perspective using elements such as high-resolution satellite images or aerial photography prove insufficient due to occlusions or low resolution, limiting the capacity to conduct a detailed study of such settlements (Gevaert et al., 2017). Considering this situation, observational or ethnographic data collection is an ideal option. However, this approach is hindered by its high cost and limitations in the scope of resulting analyses, often focusing just on limited geographical areas (Cavalcanti, 2017).
Accurate 3D data like LiDAR is crucial for urban planning. Mobile laser scanning (MLS) data, precise and dense, is gaining urban application traction. It can foster applications such as transportation infrastructure mapping, building information modeling, utility surveying and mapping, vegetation inventory, and autonomous vehicle navigation (Wang et al., 2019; Gonzalez-Barbosa et al., 2022; Fan et al., 2023). Therefore, our work builds on the CIM concept and a selection of works where the use of LiDAR data is leveraged for urban morphology analysis (Yang, 2019; Salazar Miranda et al., 2022; Zhou et al., 2022).
The work in Salazar Miranda et al. (2022) delves into a practical and readily accessible solution to address these challenges, making significant advancements in the study of informal settlements. They introduced a methodology using LiDAR data to analyze the morphology of informal settlements, with Rio de Janeiro’s Rocinha as a case study. The analysis operates on global and local scales, revealing differences and commonalities in street morphology. The approach offers high-resolution morphological maps, informing urban planning on issues such as crowding, safety, and accessibility. The method’s automation enables scalability for assessing entire settlements, leveraging LiDAR scanners tripod-mounted. Here underlies one of the great differences of our work, as mentioned by Miranda et al., the data collection was performed by an operator carrying the data collection system, having a total of 22 survey points where 750,000 points per second were recorded, suggesting the use of a high-density sensor. The literature, as discussed in Gonza´lez-Collazo et al. (2024), shows that for 3D urban reconstruction tasks, high-density LiDAR sensors are used, which allows to obtain more information of the environment in a single sample. In our work we make use of a low-density LiDAR that captures approximately 300,000 points per second. The data acquisition system is installed on the roof of a vehicle. Low-cost sensors are incorporated into this system to estimate the movement of the vehicle, see Figure 1. We employ innovative techniques such as LIO (LiDAR Inertial Odometry) that efficiently handle sequential LiDAR scans with IMU measurements for the 3D reconstruction. Architecture diagram. Our system’s information flow involves two sub-systems. The first records data from IMU and GNSS sensors and forwards it to the second sub-system, which also gathers data from VLP-16 and Chamaleon3 sensors. Image information was stored but not processed for map creation using the SLAM algorithm.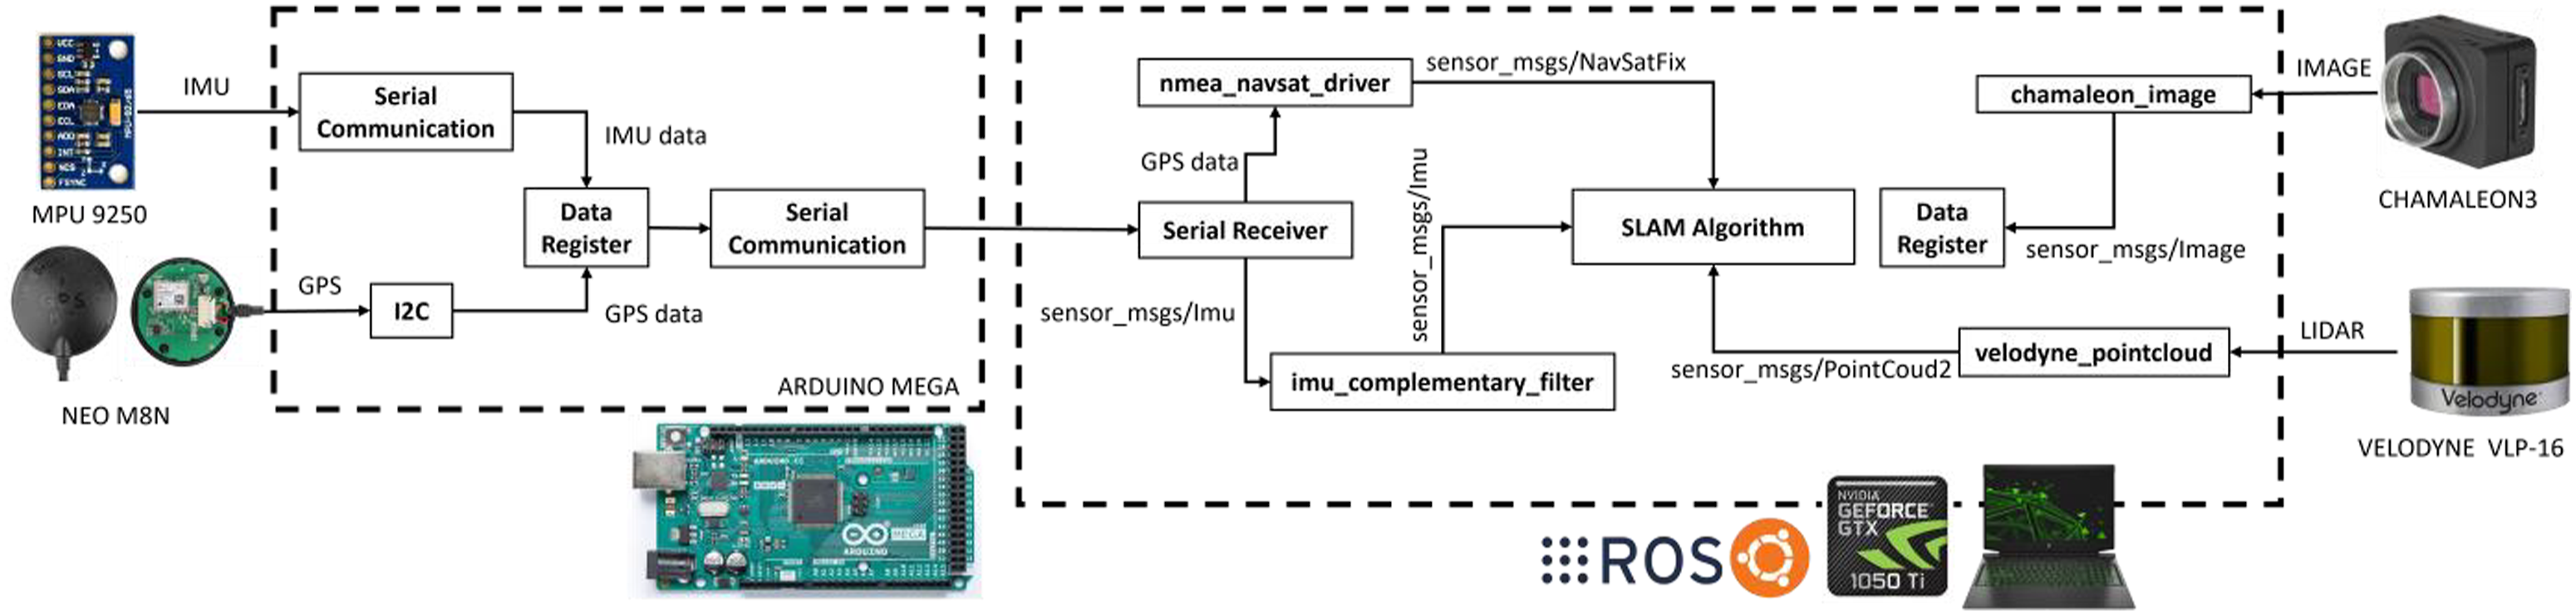
Tree detection using LiDAR information is of interest in different fields due to its usefulness to extract relevant information from their morphology. Su et al. (2021) uses a LiDAR backpack system to register forests and extract tree metrics such as diameter at breast height (DBH) and leaf area density (LAD) using the open-source Python library Forest3D. In urban environments, the information of trees and green areas is associated with the aesthetics, comfort and thermal sensation of the spaces. The work in Hu et al. (2022) used the canopy line, obtained from LiDAR scans, to represent the physical esthetic beauty of street trees. They leverage the geometric richness and accuracy of LiDAR data and the appearance-rich nature of image data. The authors underscore the significance of the green volume (GV) indicator and its correlation with human perception of a street. For this purpose, they employed a high-resolution laser scanner, the VUX-1HA (5 mm), in conjunction with commercial software named LIDAR360 for the segmentation process. Similarly, our approach introduces innovation by utilizing the GV, but we correlate it with the comfort that tree shade can provide to humans. On the contrary, we employ a Velodyne laser scanner with an accuracy range of just 3 cm. This level of precision significantly decreases the point cloud density compared to what can be achieved with a VUX-1HA, thereby presenting an additional challenge to the segmentation task.
The contribution of our work is summarized as follows: Exploration of the use of low-density LiDAR (16- layer) together with low-cost sensors to obtain 3D reconstructions of large urban environments. The proposal of a framework for the morphological analysis of urban spaces from the extraction of metrics that allows the understanding and characterization of such morphology from its point cloud 3D map. The exploration of classical point cloud processing methods (automatic, semi-automatic, and manual) to obtain the information related to the metrics that allow to understand the morphology of the urban scenery.
Describing the morphology of human settlements
This section elaborates on the primary factors that characterize the morphology of human settlements, including streets, facades, and trees. It’s important to note that we will only consider static objects, excluding pedestrians and vehicles.
Streets
The street is an essential component of urban environments, serving numerous crucial functions. A well- designed street should incorporate a complete infrastructure, including travel lanes, islands, bike lanes, and sidewalks, ensuring comprehensive functionality and safety in urban landscapes. However, in our study, our primary focus centers on its pivotal role as a conduit for circulation. The seminal work by Moudon (1987) has elucidated a multitude of activities, with an emphasis on ensuring the secure movement of pedestrians and various vehicular types, including public transport and emergency vehicles.
Within this context, the width of the street, and by extension, the individual lane widths within it, assume paramount importance, becoming a critical and nuanced facet of their design. Per the findings of Sadik-Khan (2012), within urban areas, lane widths of 3 m prove to be conducive to enhancing street safety while maintaining optimal traffic flow. In contrast, avoid lanes wider than 3.4 m, as they can lead to unintentional speeding and heighten the severity of accidents.
Besides the width of the street, street elevation is also a crucial factor since suburban settlements typically arise in higher elevations of the city. As detailed by Salazar Miranda et al. (2022), the constant changes in elevation within these settlements present a significant challenge for the elderly population. A study conducted in Japan by Kitayuguchi et al. (2021) demonstrates that adults living in areas with a high degree of land slope have a higher fall incidence rate than those living in flat areas.
Facades
Outdoor thermal comfort (OTC) is an increasingly important consideration in urban planning. In tropical urban areas like the city of Cali, the interaction of pedestrians in street canyons is more common, which can significantly raise temperatures and hurt residents’ health. In addition to the meteorological factors specific to the area, wind speed is the most influential parameter in OTC.
Muniz-Ga¨al et al. (2020) in a study conducted in the city of Campinas, Brazil, which shares a climate similar to Cali (classified as Cwa), found that in street canyons with a high height-to-width ratio (H/W), wind speed increases significantly, in addition to creating shaded areas due to the configuration of the buildings, thereby improving outdoor thermal comfort. It’s worth noting that an aspect ratio of H/W <0.5 is considered low, H/W = 1.0 is regular, and an H/W >2.0 is considered high in this classification.
There is a similar study conducted in Sydney, Australia by Abdollahzadeh and Biloria (2021), which found that apart from the aspect ratio (H/W) factor, it is necessary to take into account the height-to-length ratio (L/H) and the gaps between buildings. However, in contrast to these findings, authors in [1] proved that an increase in the building height- to-length ratio (L/H) did not have a significant effect on thermal comfort, nor did the presence or absence of gaps between buildings.
Thus, in this study, we will only use the H/W ratio, as this factor is the most relevant in the configuration of street canyons to enhance thermal comfort in tropical urban environments like Cali.
Trees
One of the most effective strategies for enhancing the urban thermal environment is the implementation of tree planting along streets.
In a study conducted in Changchun City, China, researchers examined not only the effects of urban trees on the urban thermal environment but also assessed how urban trees influenced human thermal comfort and psychological factors. They discovered that streets with higher tree canopy coverage provide greater thermal comfort while reducing heat stress. Rasmussen (2004) mentions that human behavior can be modified in the presence of trees. Similarly, Cox et al. (2017) studies how the presence of green areas has a positive impact on the reduction of diseases such as depression and stress and anxiety factors.
Furthermore, Smart et al. (2020) conducted a study examining tree density in five capital cities: Buenos Aires, Paris, Washington, Ottawa, and Stockholm. The study found that cities in warmer climate zones (Cfa/Cfb) exhibited higher tree densities (an average of 7 trees per 100 m) compared to cities in cooler climate zones (Dbf), which had an average of two trees per 100 m.
Architectural framework and sensor integration
In this section, we present the architecture of the proposed data capture system. We begin by detailing the information flow across its diverse components and the preprocessing steps involved. Subsequently, we take a closer look at the hardware construction of the system, accompanied by an overview of the sensor components that make up its integrated framework.
Figure 1 illustrates the information flow within each component of our system. Our module comprises two distinct sub-systems. The former, an embedded system, records data from the IMU and GNSS sensors, obtaining this information through serial communication and I2C channels. This system then transmits the recorded data via serial communication to the latter sub-system, which, in addition to receiving data from the first sub-system, also receives data from the VLP-16 and Chamaleon3 sensors.
In our experimental setup, we utilize a computer equipped with an NVIDIA GTX 1050Ti Mobile graphics card, 16 GB of RAM, running the Ubuntu 20.04 operating system, and powered by the ROS Noetic Ninjemys middleware.
We process data from the IMU through a ROS node that employs the filtering algorithm proposed by Roberto G. Valenti et al. (2015). This filtering process helps reduce measurement errors originating from the sensor.
For satellite positioning information, a separate ROS node processes NMEA sentences and publishes this information as ROS messages.
Our system obtains data from LiDAR and camera sensors through drivers provided by ROS. These drivers publish as ROS messages this data within the ROS environment. Lastly, we record and process all this data within the SLAM algorithm to create maps.
Methodological approach to data collection and variable analysis
In this section, we delve into the intricacies of our research methodology, focusing on the fundamental processes of data acquisition, the variables central to our study, and the metrics employed to glean meaningful insights. The meticulous design of our methodology ensures a thorough understanding of the data collection process as well as the essential factors under examination.
Data acquisition
We conducted outdoor environment reconstruction by installing the system on a vehicle, as illustrated in Figure S2. Data collection took place within the Siloe´ neighborhood in Santiago de Cali
1
, covering a distance of approximately two km with an average speed of 15 Km/h and a maximum speed of 37 Km/h. To perform the reconstruction, we evaluated multiple SLAM state-of-the-art algorithms. We compared the obtained map with satellite imagery through visual analysis, ultimately confirming that the LIO-SAM algorithm proposed by Shan et al. (2020) delivered the best results. The reconstruction obtained is shown in Figure 2. Siloe´’s 3D map. Overlay of the reconstructed map and the satellite image of this space.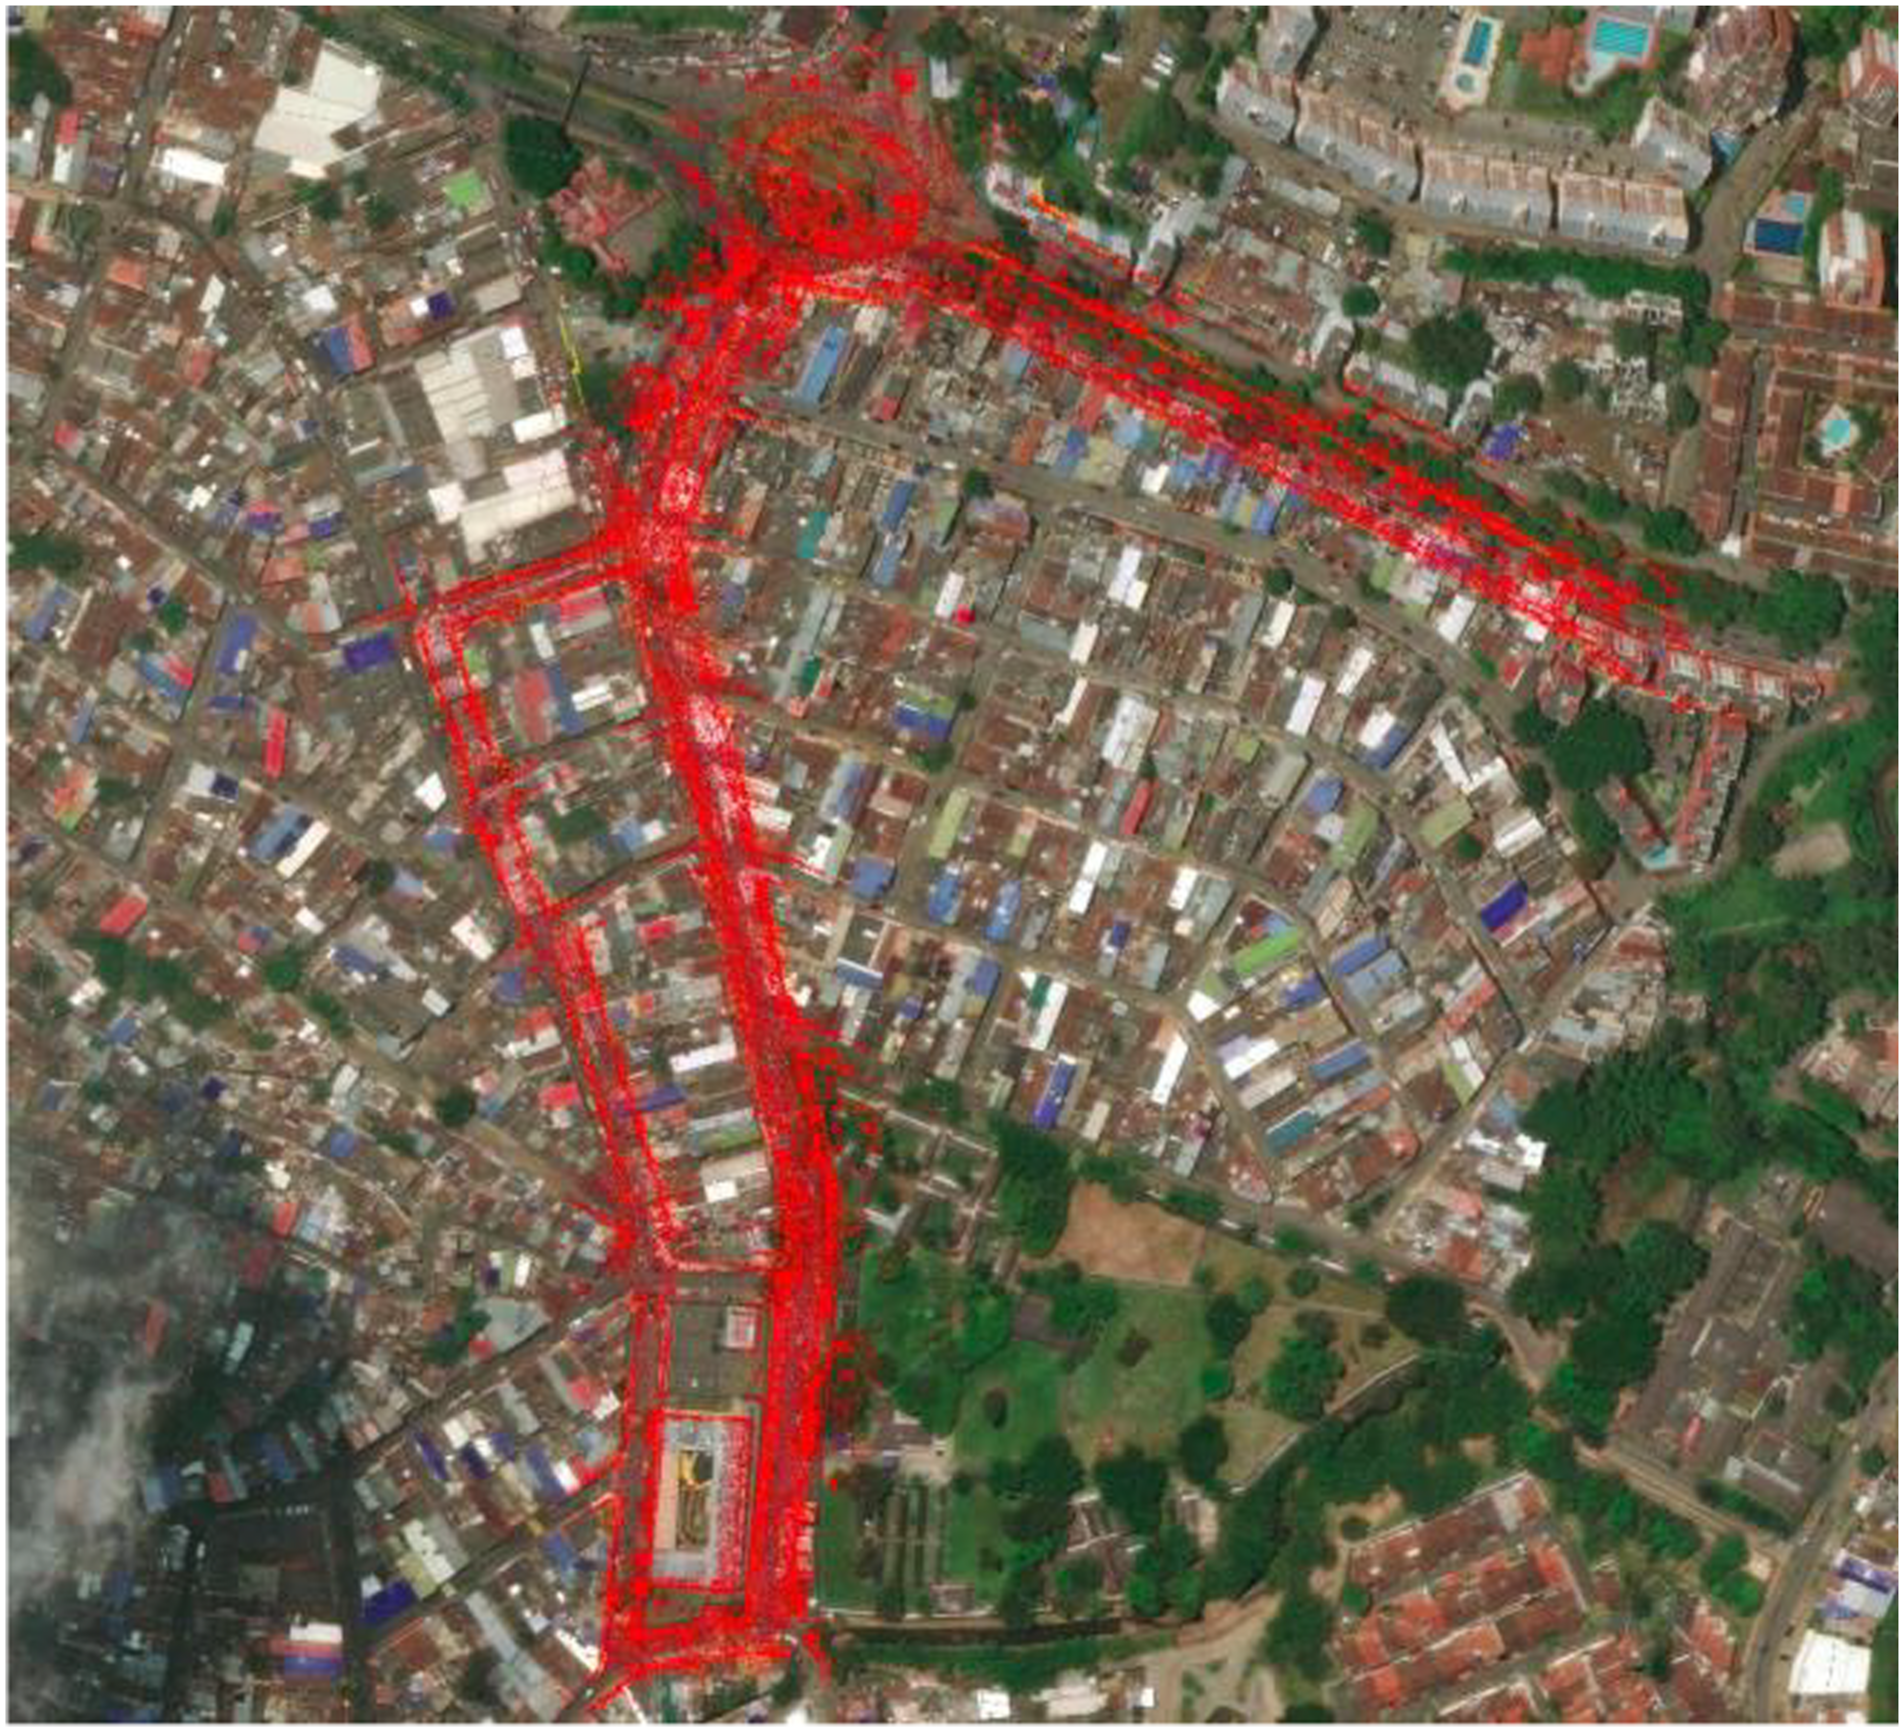
Automated morphology metric calculation
Once the comprehensive map is acquired, we partition it into distinct scenes using the Point Cloud Library (PCL). This segmentation aims to logically group the data, effectively capturing the information about individual city blocks. To achieve this, we utilize a manually adjustable box filter, carefully configured to encapsulate pertinent data for every distinct city block.
We establish a cohesive ensemble of scene components that together constitute the whole settlement. Subsequently, we proceed to delineate the specific attributes of each scene component and elucidate their spatial interconnections via a suite of metrics derived from the morphological descriptors expounded upon in the preceding section.
This section explains how to measure the morphological features of individual scene components.
Streets
Points that belong to streets are also segmented out and width histograms along each street segment are estimated.
Street width (SW)
The process involves extracting the ground elements from the segmented scenes as illustrated in Figure 3. For this purpose, we leverage a progressive morphological filter provided by the PCL library. This filter serves a dual role: not only does it eliminate lidar data corresponding to buildings, vehicles, and trees, but it also effectively removes other non- ground objects of varying sizes. We follow a systematic procedure to determine street widths: First, we set up a box filter with dimensions of 3 × 20 × 3 m. Afterward, we apply this filter to each pose, isolating points within the designated box. Following this, we shift the filtered points to an origin position of (0, 0, 0). Then, a projection is conducted onto the y-axis, transforming each point to the form (0, y, 0), where “y” represents the y-coordinate value after the transformation. The next step involves identifying the minimum and maximum y-axis values within this point cloud projection. We interpret the calculated distance between these two extremities as the street width. Further details of the algorithm can be found in Algorithm S1 from the Supplementary Material. Street width (SW). Example of the results obtained for the street width estimation. In orange, the points obtained from the ground segmentation. In pink, the street width estimation for a particular vehicle location.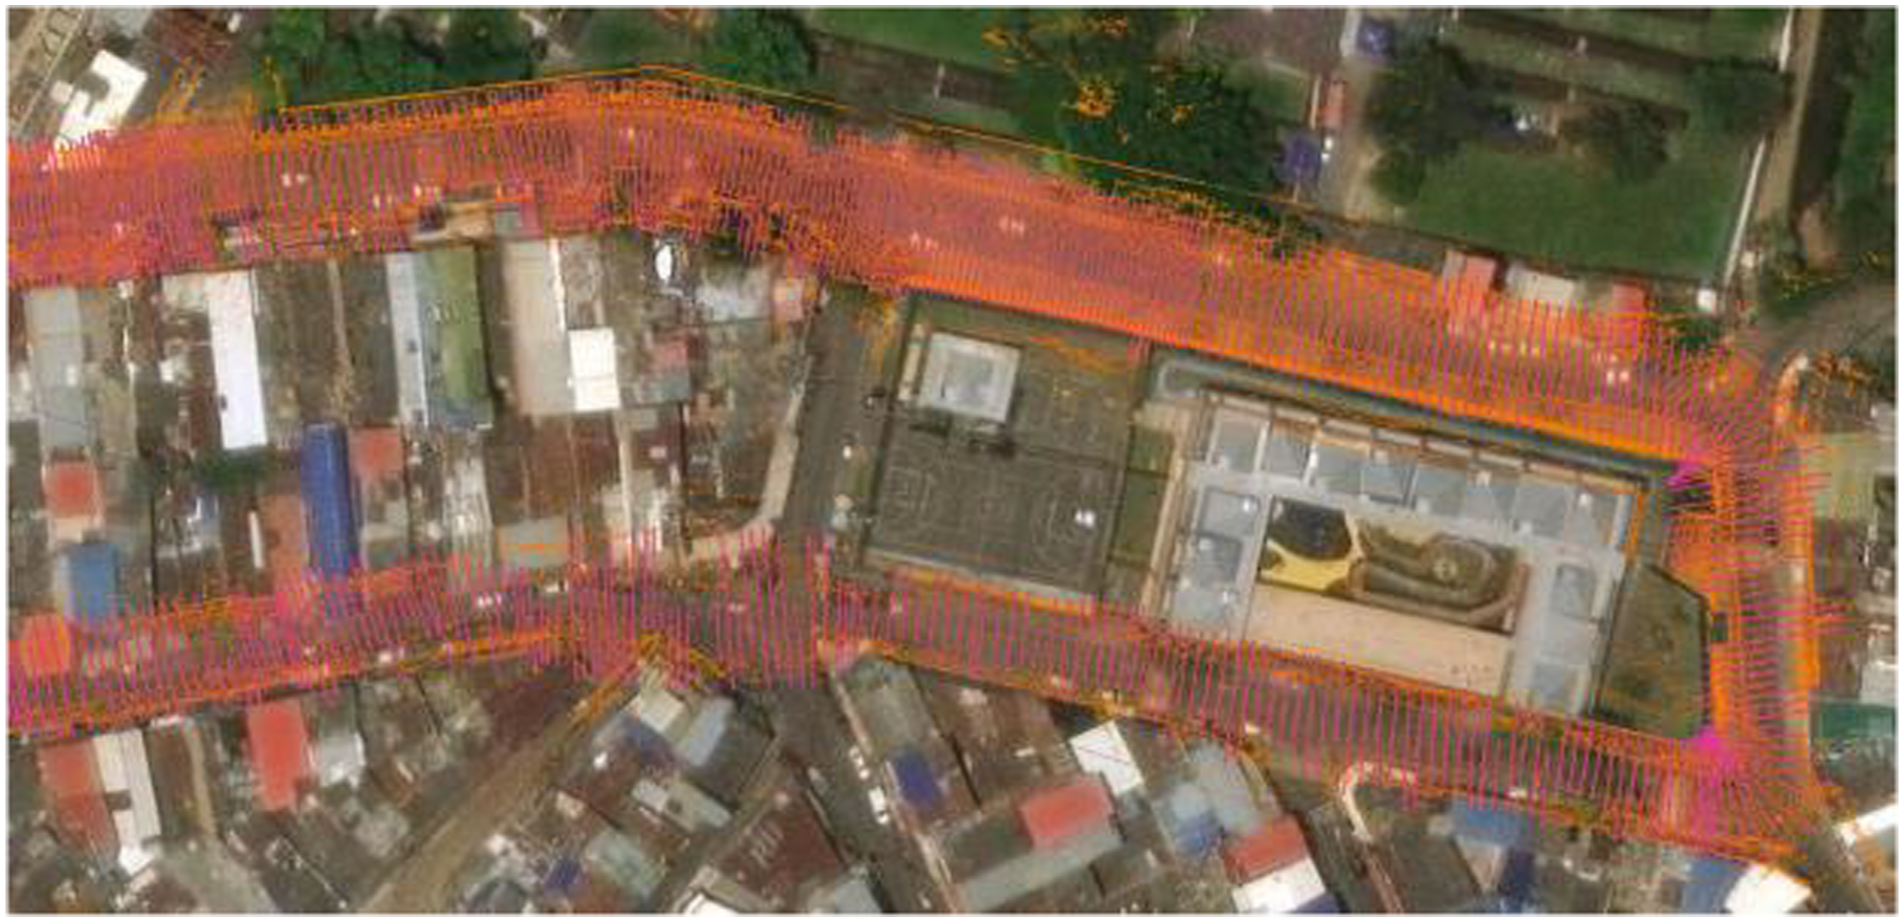
Street elevation (SE)
From the Z-height measurement information of the vehicle pose estimated by the localization and mapping algorithm, we calculated the slope angle of the terrain for each of the scenes from the slope obtained by the linear regression model that fits the measurement distribution. Each of the height measurements obtained from the vehicle poses in the scene is referenced relative to the first pose of the vehicle present in the scene (Figure 4). Street elevation (SE). Total street elevation change in scene 10. In pink, the trajectory made by the vehicle, the estimated poses of the vehicle are the blue dots. The height variation of the scene ∆t estimated by the linear regression model is presented.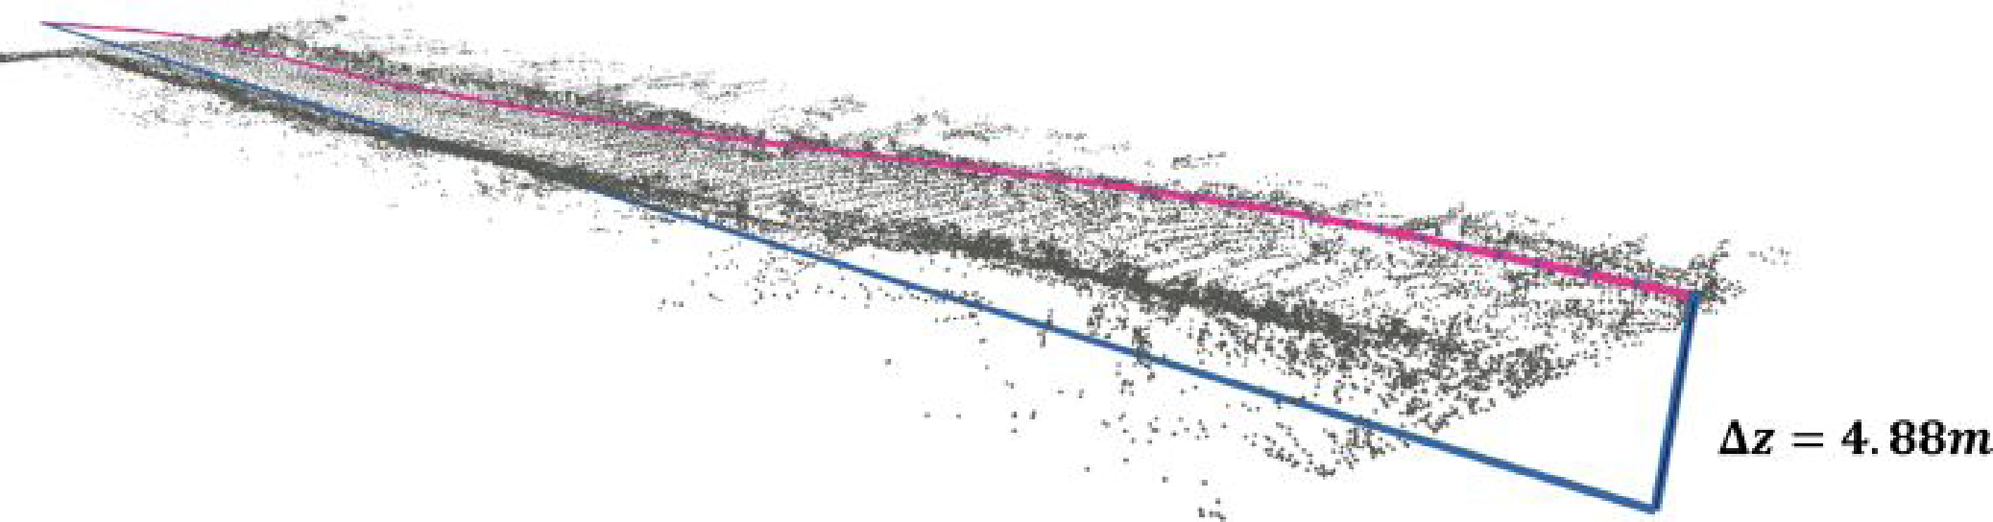
Sidewalks
To obtain accurate representations of side- walks within our scenes, we systematically fine-tuned the Statistical Outlier Removal (SOR) 2 filter parameters through a manual testing process. The most promising results emerged when we utilized mean values of µ = 100 and µ = 80 combined with deviations of σ = 1.0 and σ = 1.2.
After successfully isolating the ground points corresponding to the sidewalks from the overall scene data, we identified the individual sidewalk segments. To achieve this, we executed a procedure akin to the one employed to determine street width. We utilized a box filter that traversed the range of vehicle poses, shifting the filtered points to the origin (0, 0, 0). Subsequently, we partitioned the sidewalks based on their respective +y and y measurements.
To enhance the accuracy of the enclosed area in each sidewalk segment, we performed convex hull calculations (Figure 5). Street and sidewalk segmentation example for scene 5. The street segmentation is shown in pink and the sidewalk segmentation in orange.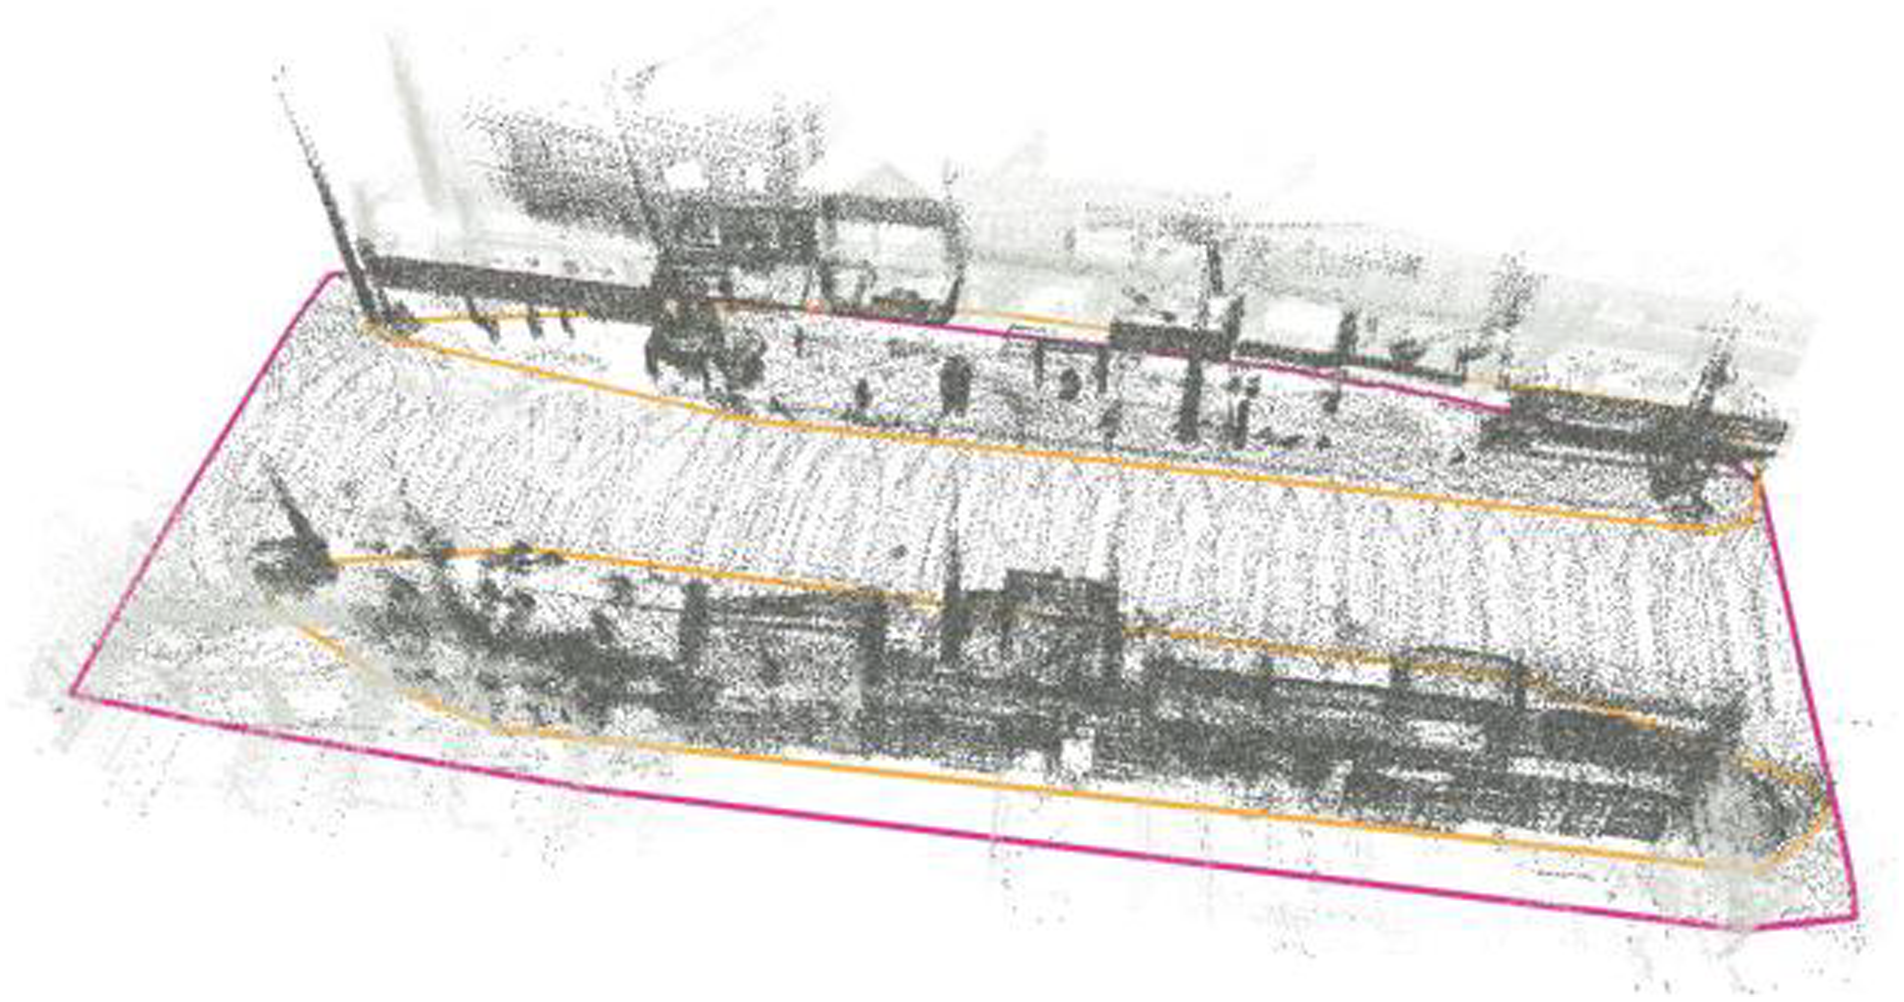
Height facades (HF)
In order to characterize facades, points belonging to buildings were clustered. To obtain its segmentation, the left side +y and right side y of the street were defined from the vehicle pose. Similar to the procedure performed to obtain the width of the street. Once the scene was divided into right and left, a plane model perpendicular to the ground was used to filter the points corresponding to the facades (Figure 6). The divided scene was projected on its corresponding plane. Subsequently, on the projected point cloud, its maximum height was evaluated at intervals spaced between 1m 3 m. Further details of the algorithm can be found in Algorithm S2 from the Appendix. Height facades (HF). Facade height measurement demonstration for one of the sides of the street in scene 6. In orange, the measurement points established for this profile and their length from their maximum point in height with respect to the base are shown. The contour formed by these points is shown in pink.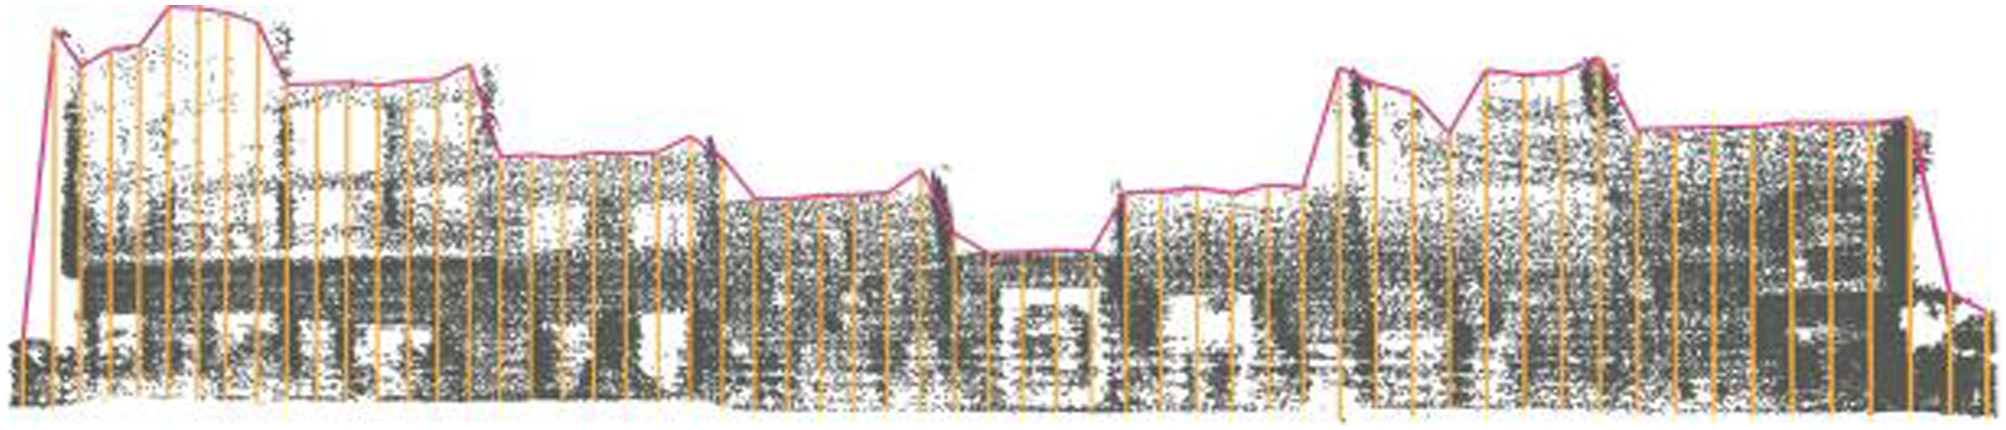
Trees
Scene description.
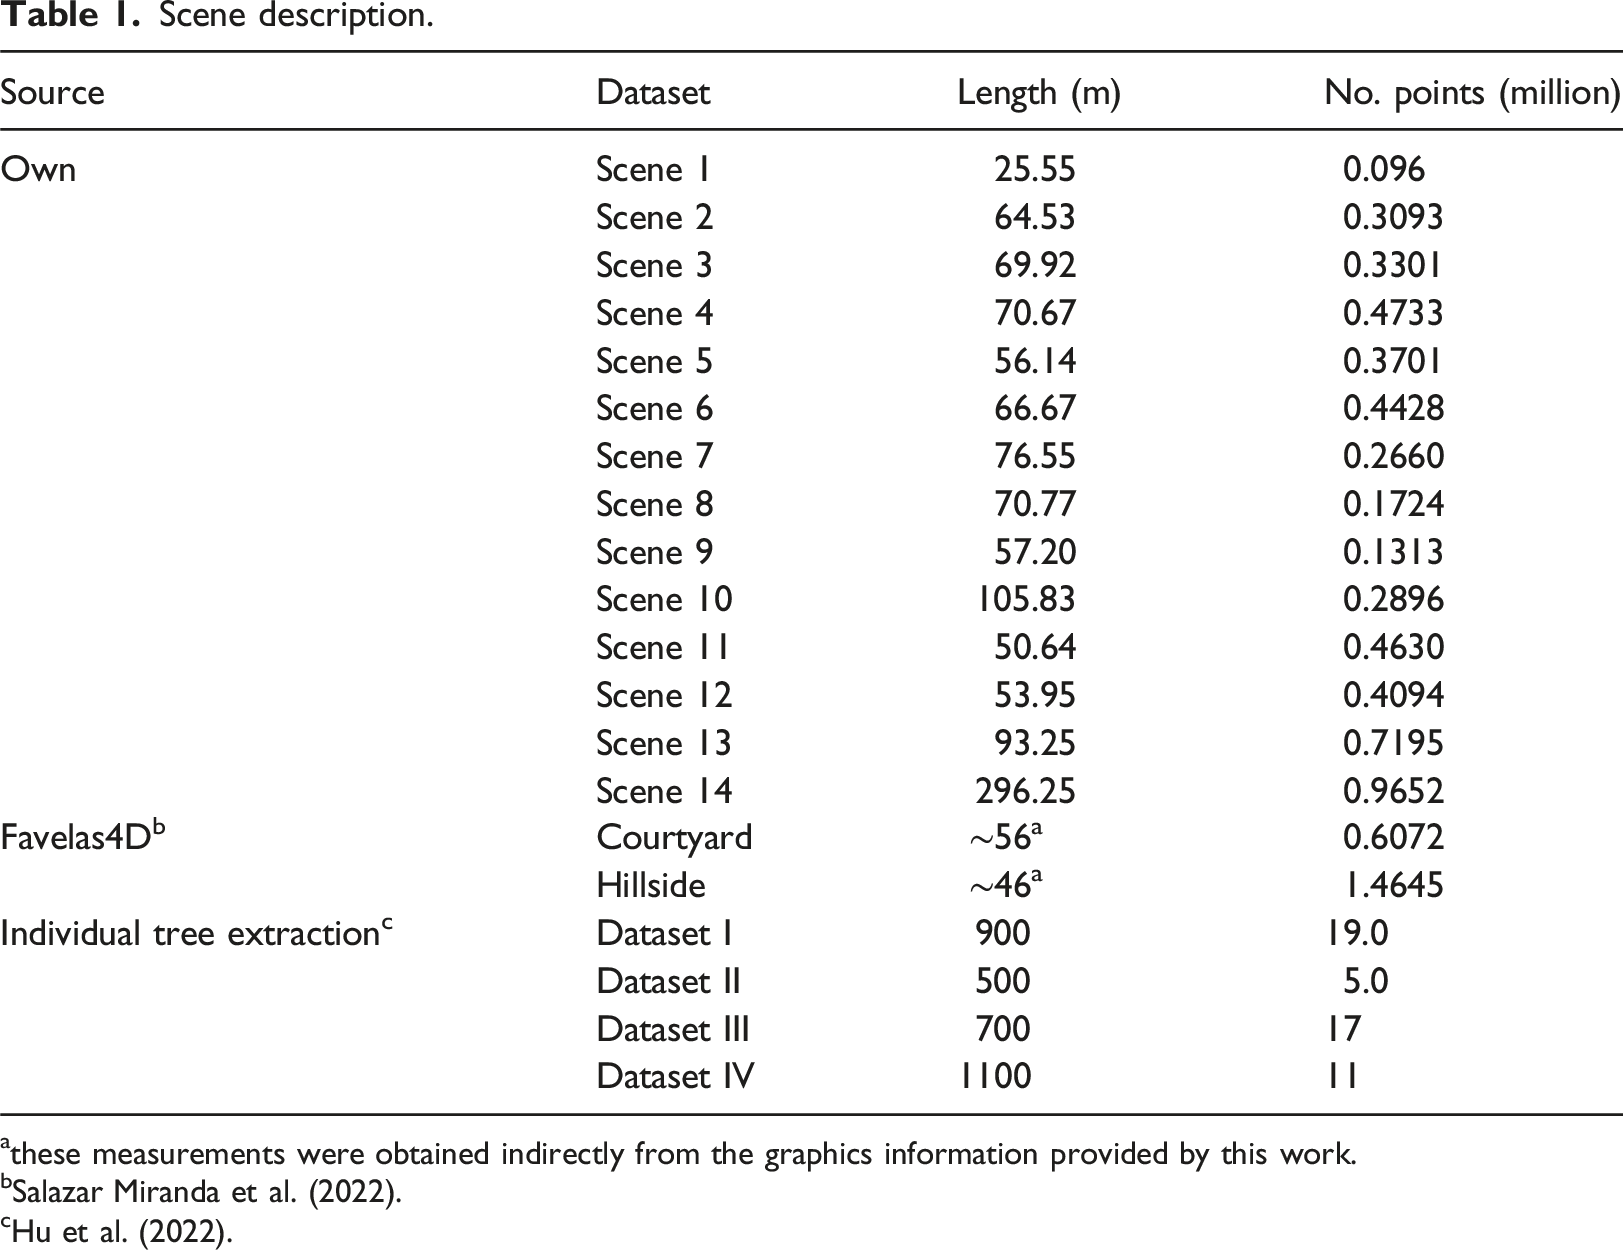
athese measurements were obtained indirectly from the graphics information provided by this work.
bSalazar Miranda et al. (2022).
Next, for each tree, a similar method was applied to extract the metrics related to the trunk and the crown of the tree. In Figure 7, it can be seen the approach used. Again, manually and using a box filter, the parts corresponding to the trunk and crown were separated for each tree. From the size of the bounding boxes (pink and orange), the metrics of tree height, trunk diameter, tree area, and tree volume were defined. Trunk and crown segmentation. The figure shows an example of the trunk and crown segmentation performed for the trees, together with the metrics obtained for each of these elements.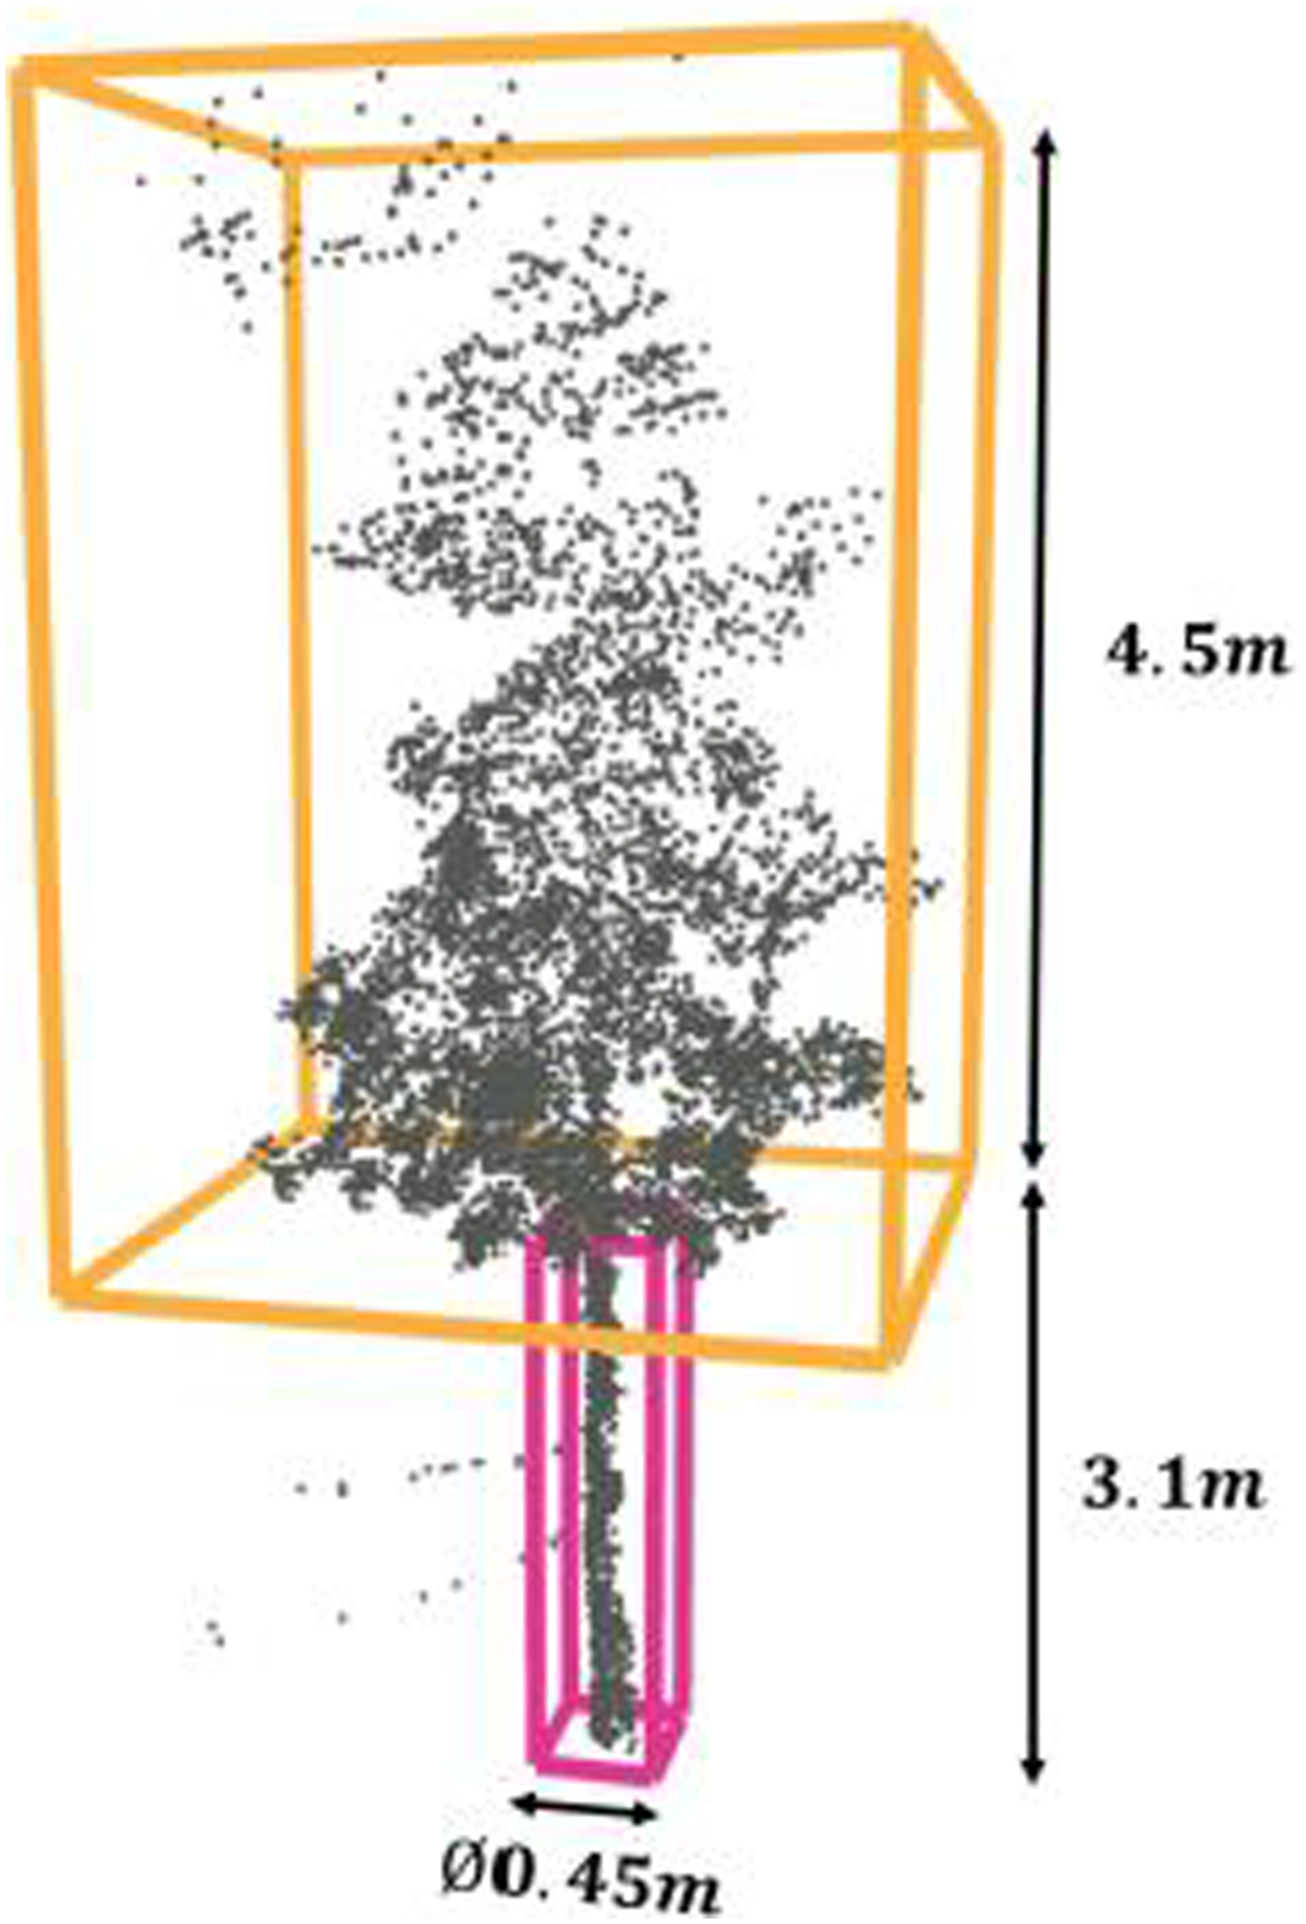
Tree height was defined as the sum of trunk height plus crown height. The area of the tree was defined as the area of the bounding box corresponding to the crown. From the area obtained by the trunk bounding box
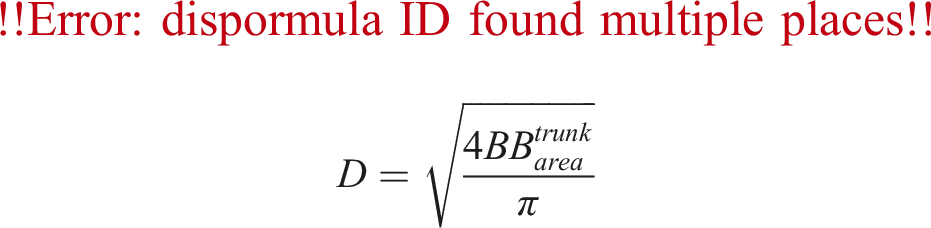
Figure S4 shows the comparison between the data obtained by our method for the estimation of trunk diameter in the defined scenes and the data recorded by governmental entities for this area of the city DAGMA (2022). It should be noted that in this chart there is no direct comparison because the government data does not have the location of the tree specimens. However, the distribution of the data shows that the diameters calculated by our methods are within the range of the data provided by the government. In the work developed by Hu et al. (2022), the metric green volume per unit length (GV) is introduced. Green volume is an important quality indicator for ecological services evaluation, urban greening assessment, and green-economic estimation, which is usually defined as the space occupied by street trees. This metric is defined as: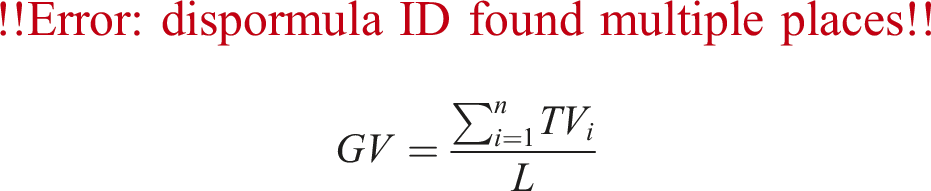
Therefore, the extraction of the trees in the scenes was performed manually. First, a box filter location and size was manually set for the extraction of trunk and crown information for each tree in each scene, an example of the trees segmentation performed is shown in Figure 8. The location (x,y,z) of each bounding box was recorded, which would measure the distance between trees per side of the street. Only trees in public spaces were considered for the study. Trees segmentation example. The figure shows the point cloud of scene 14, in green color the segmented trees for this scene are highlighted in green.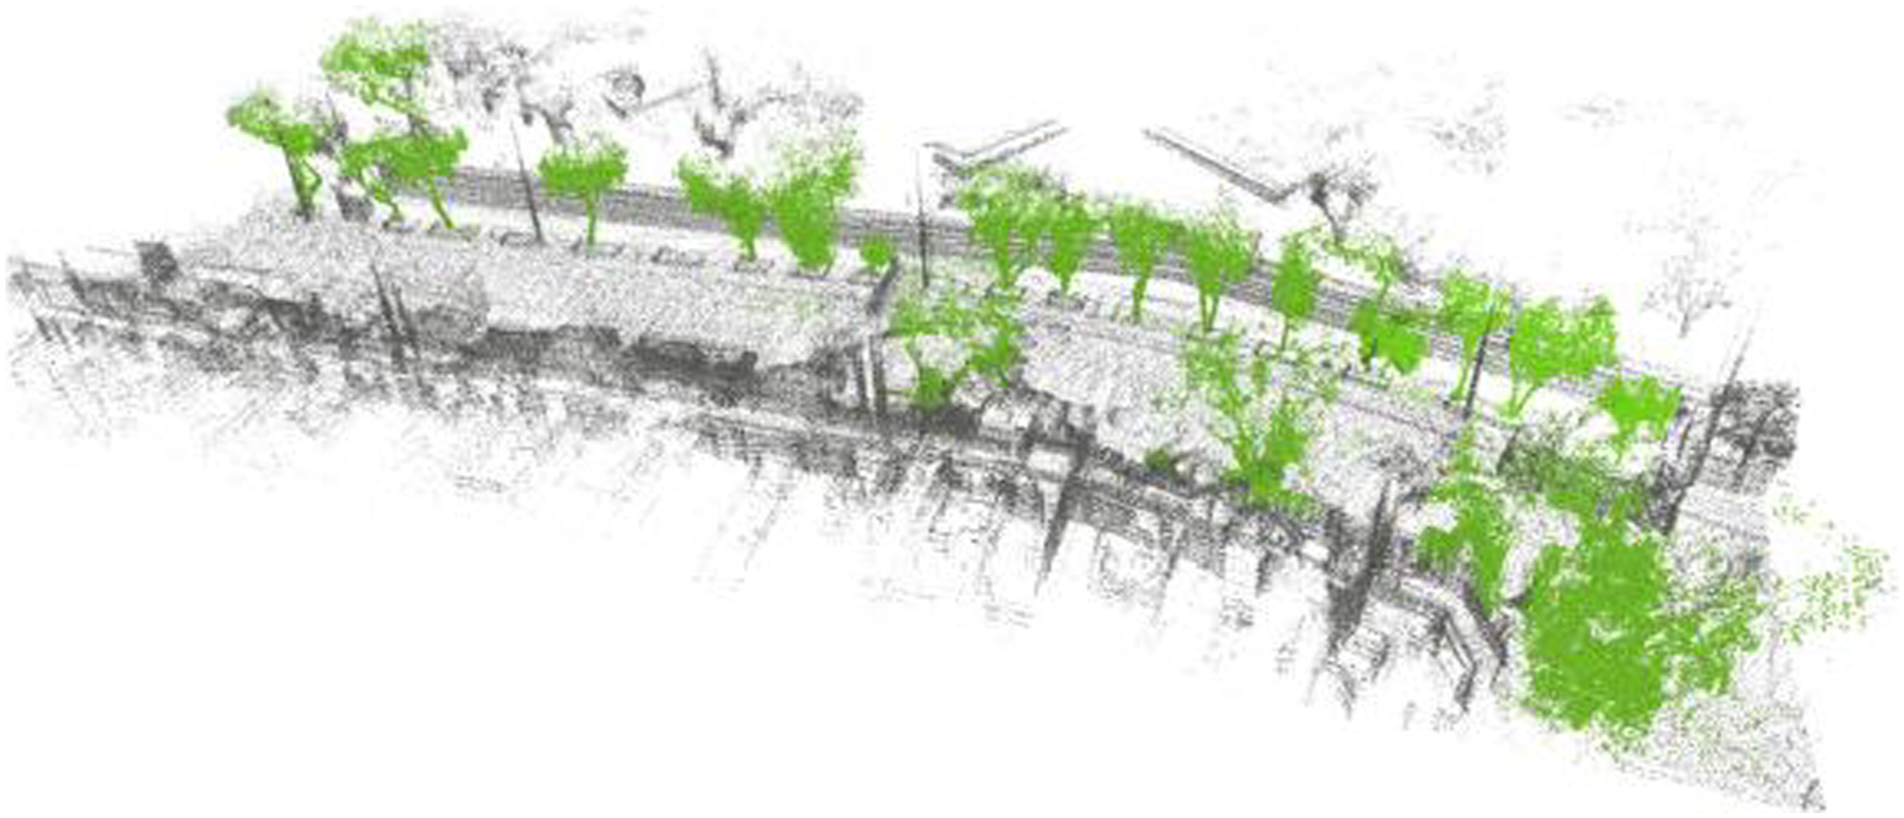
Data analysis and results
Figure 9 consolidates the findings for each scene, delineating fluctuations in the four previously mentioned morphological metrics. Each graph column represents a distinct metric, distinguished by unique colors: street width (red), street elevation (blue), facade height (yellow), and street canyon (violet). Local analysis scene. Each row represents a scene depicting the variations of the following morphological metrics: street width (SW - blue), street elevation (SE - red), facade height (FH - yellow), and street canyon (SC - violet). The X-axis represents a sample along the scene.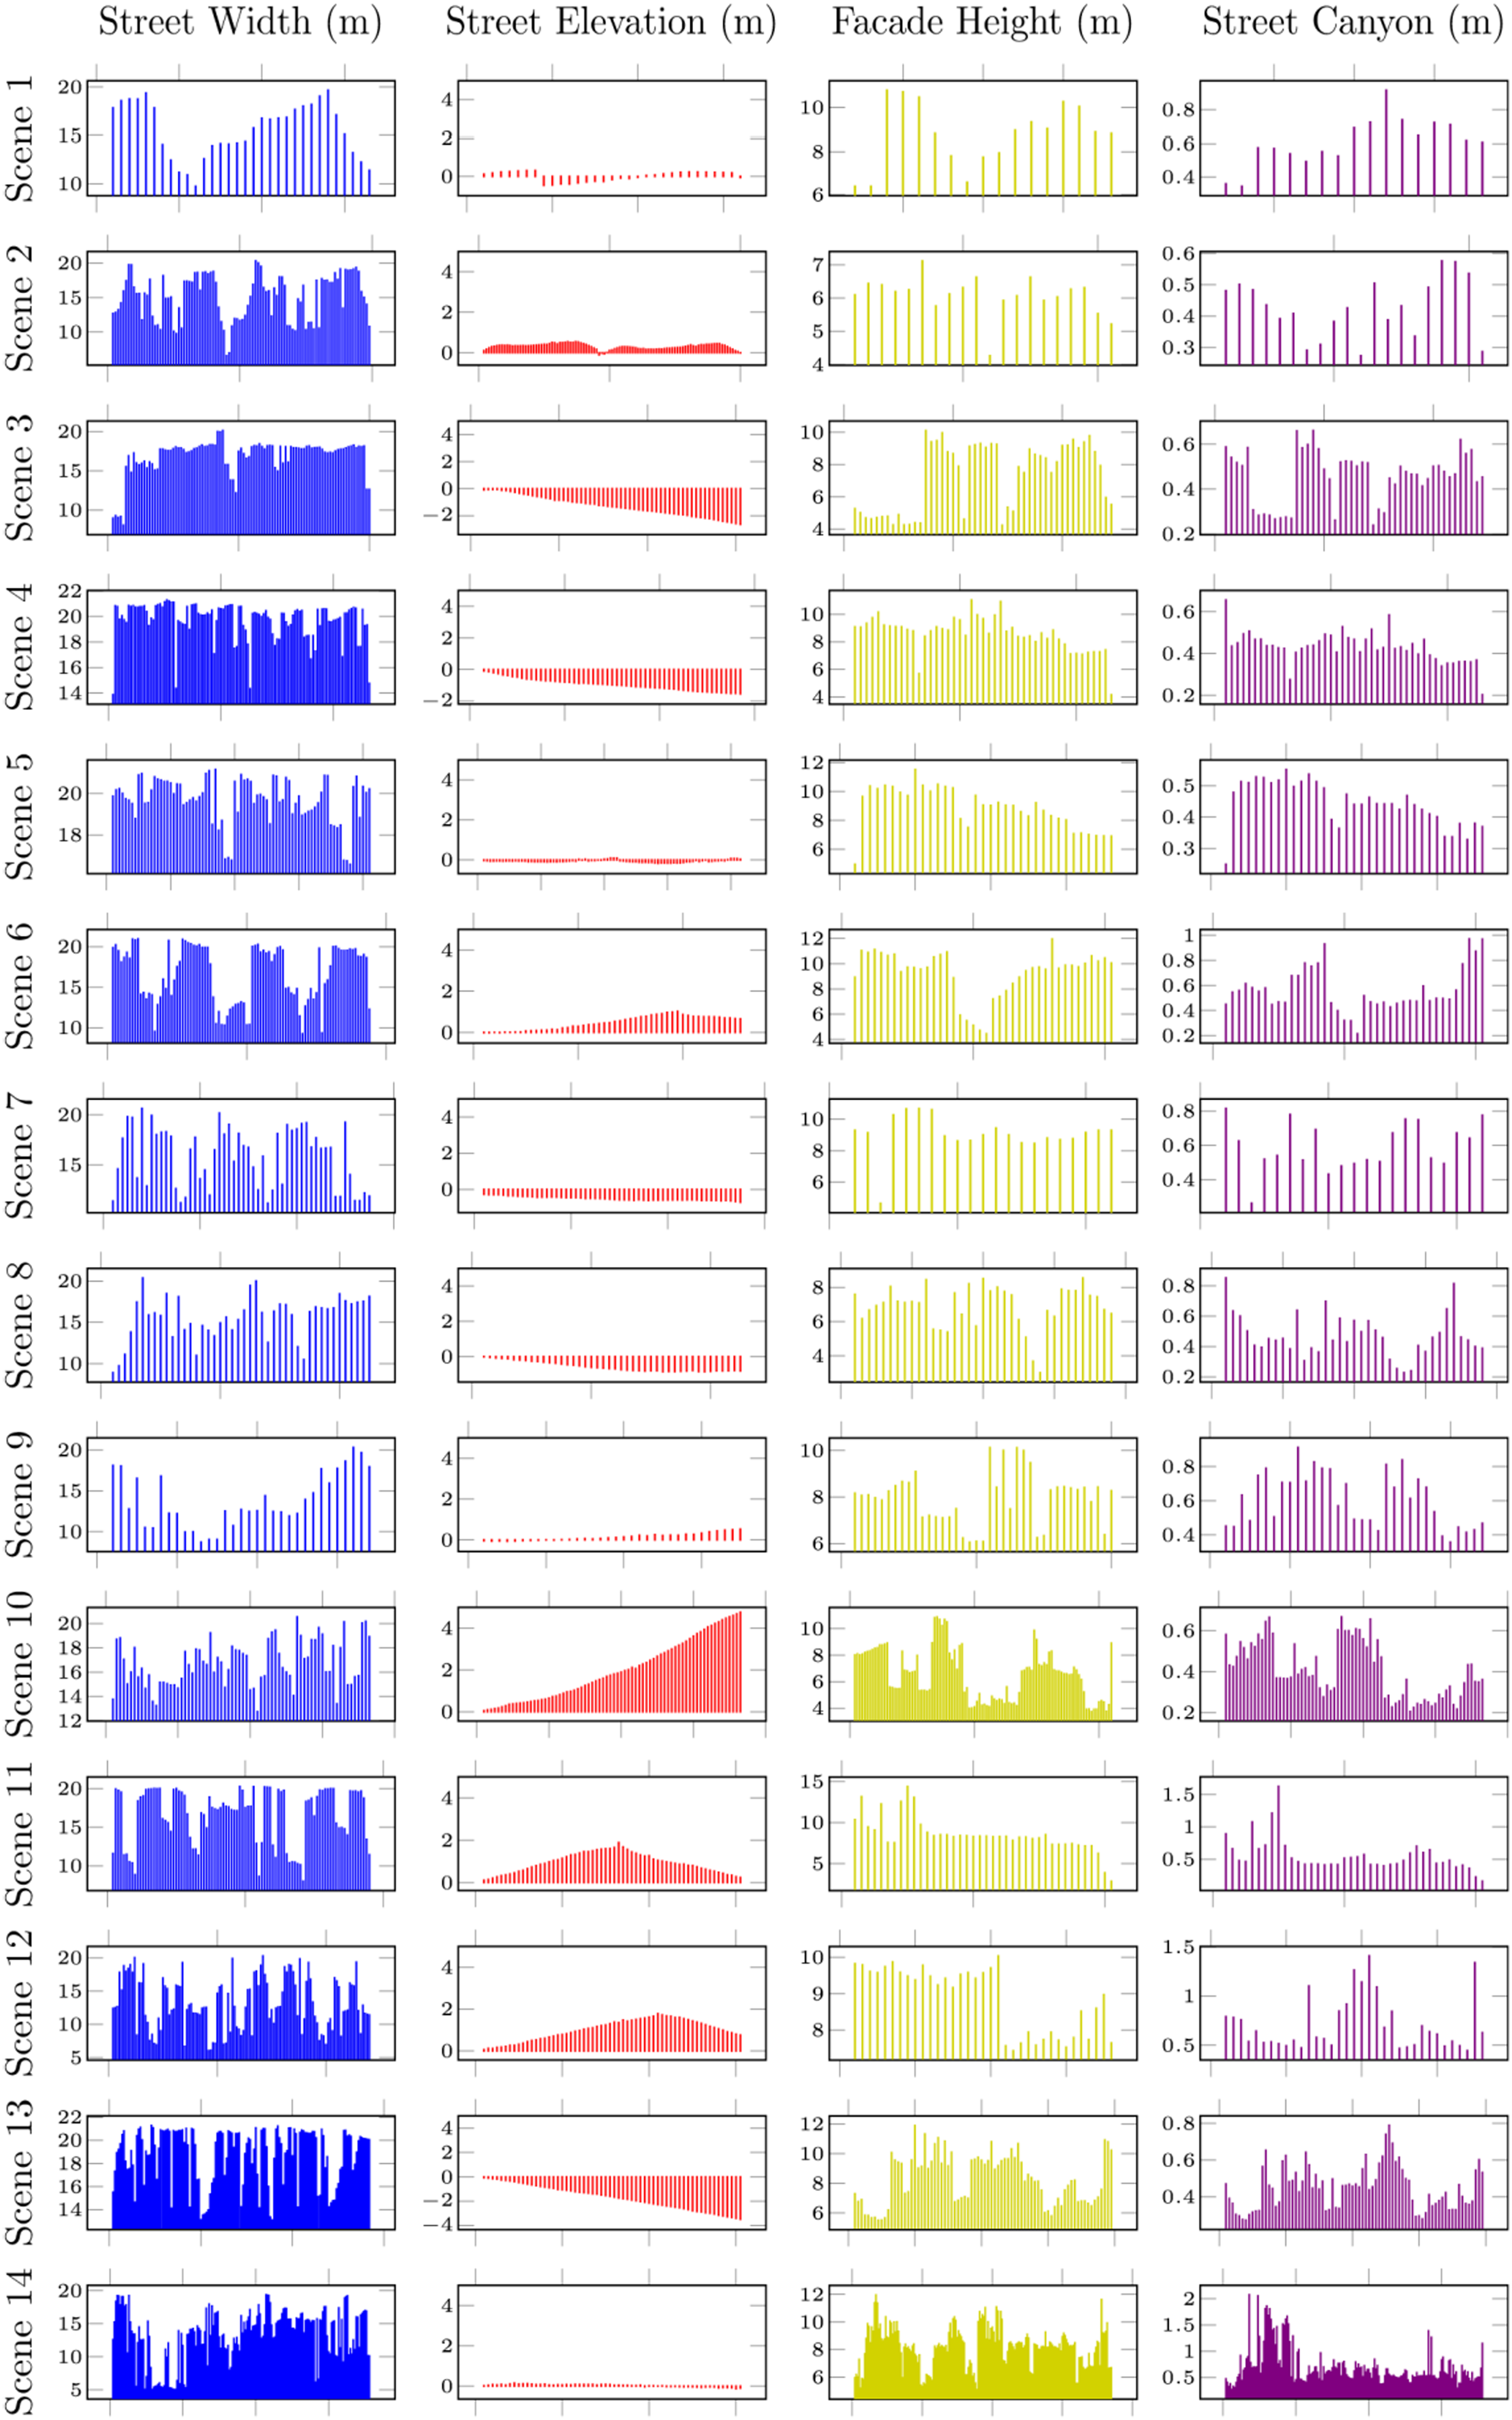
Employing the thresholds established by prior research in regions with a climate akin to that of Cali, as described in Section IV, reveals that the street width is adequate. Despite the predominantly flat nature of the studied region, Scene 10 exhibits an elevation reaching up to 6 m, which may be deemed unfavorable due to its potential impact on increased falls among elderly individuals. Concerning facade height, it is apparent that a substantial number of structures comprise more than two stories, each surpassing a height of 3 m. This results from the prevalence of multifamily residences or, in many cases, the irregular adaptation of the ground floor for commercial purposes. Lastly, an examination of the street canyon reveals that the predominant portion of the studied area has a low height-to-width ratio (H/W). Only in the last four scenes can a few street canyons be found with a high H/W, which indicates that shaded areas are scarce, consequently implying a decrease in thermal comfort.
On the other hand, Figure 10 depicts the 3D shapes of each scene alongside their overall values for the four previously analyzed morphological metrics at a local level (using the same colors and abbreviations). Additionally, we have incorporated the following metrics: number of trees (NT - green), street length (SL - violet), and street length- to-number of trees ratio (TA - purple). Consequently, one can observe the consistent behavior of the height-to-width ratio (H/W) and the exceedingly low Length-Trees ratio. It is important to recall that the established ratio for cities with a climate similar to that of Cali is 10 trees per 100 m. Given that the scenes in our study have varying lengths, we have derived a proportional value, indicating that values exceeding 1.0 may be considered high. This observation reveals that only the first two and the last three scenes surpass this threshold, highlighting that, from an urbanistic standpoint, these spaces fail to meet any of the minimum comfort requirements for individuals. Global analysis scene. Each scene not only portrays its 3D shape but also showcases the morphological metrics employed in the local analysis, providing additional details on the number of trees (NT - green), the length of each scene (LS - purple), and the relationship between these latter two (TA - orange).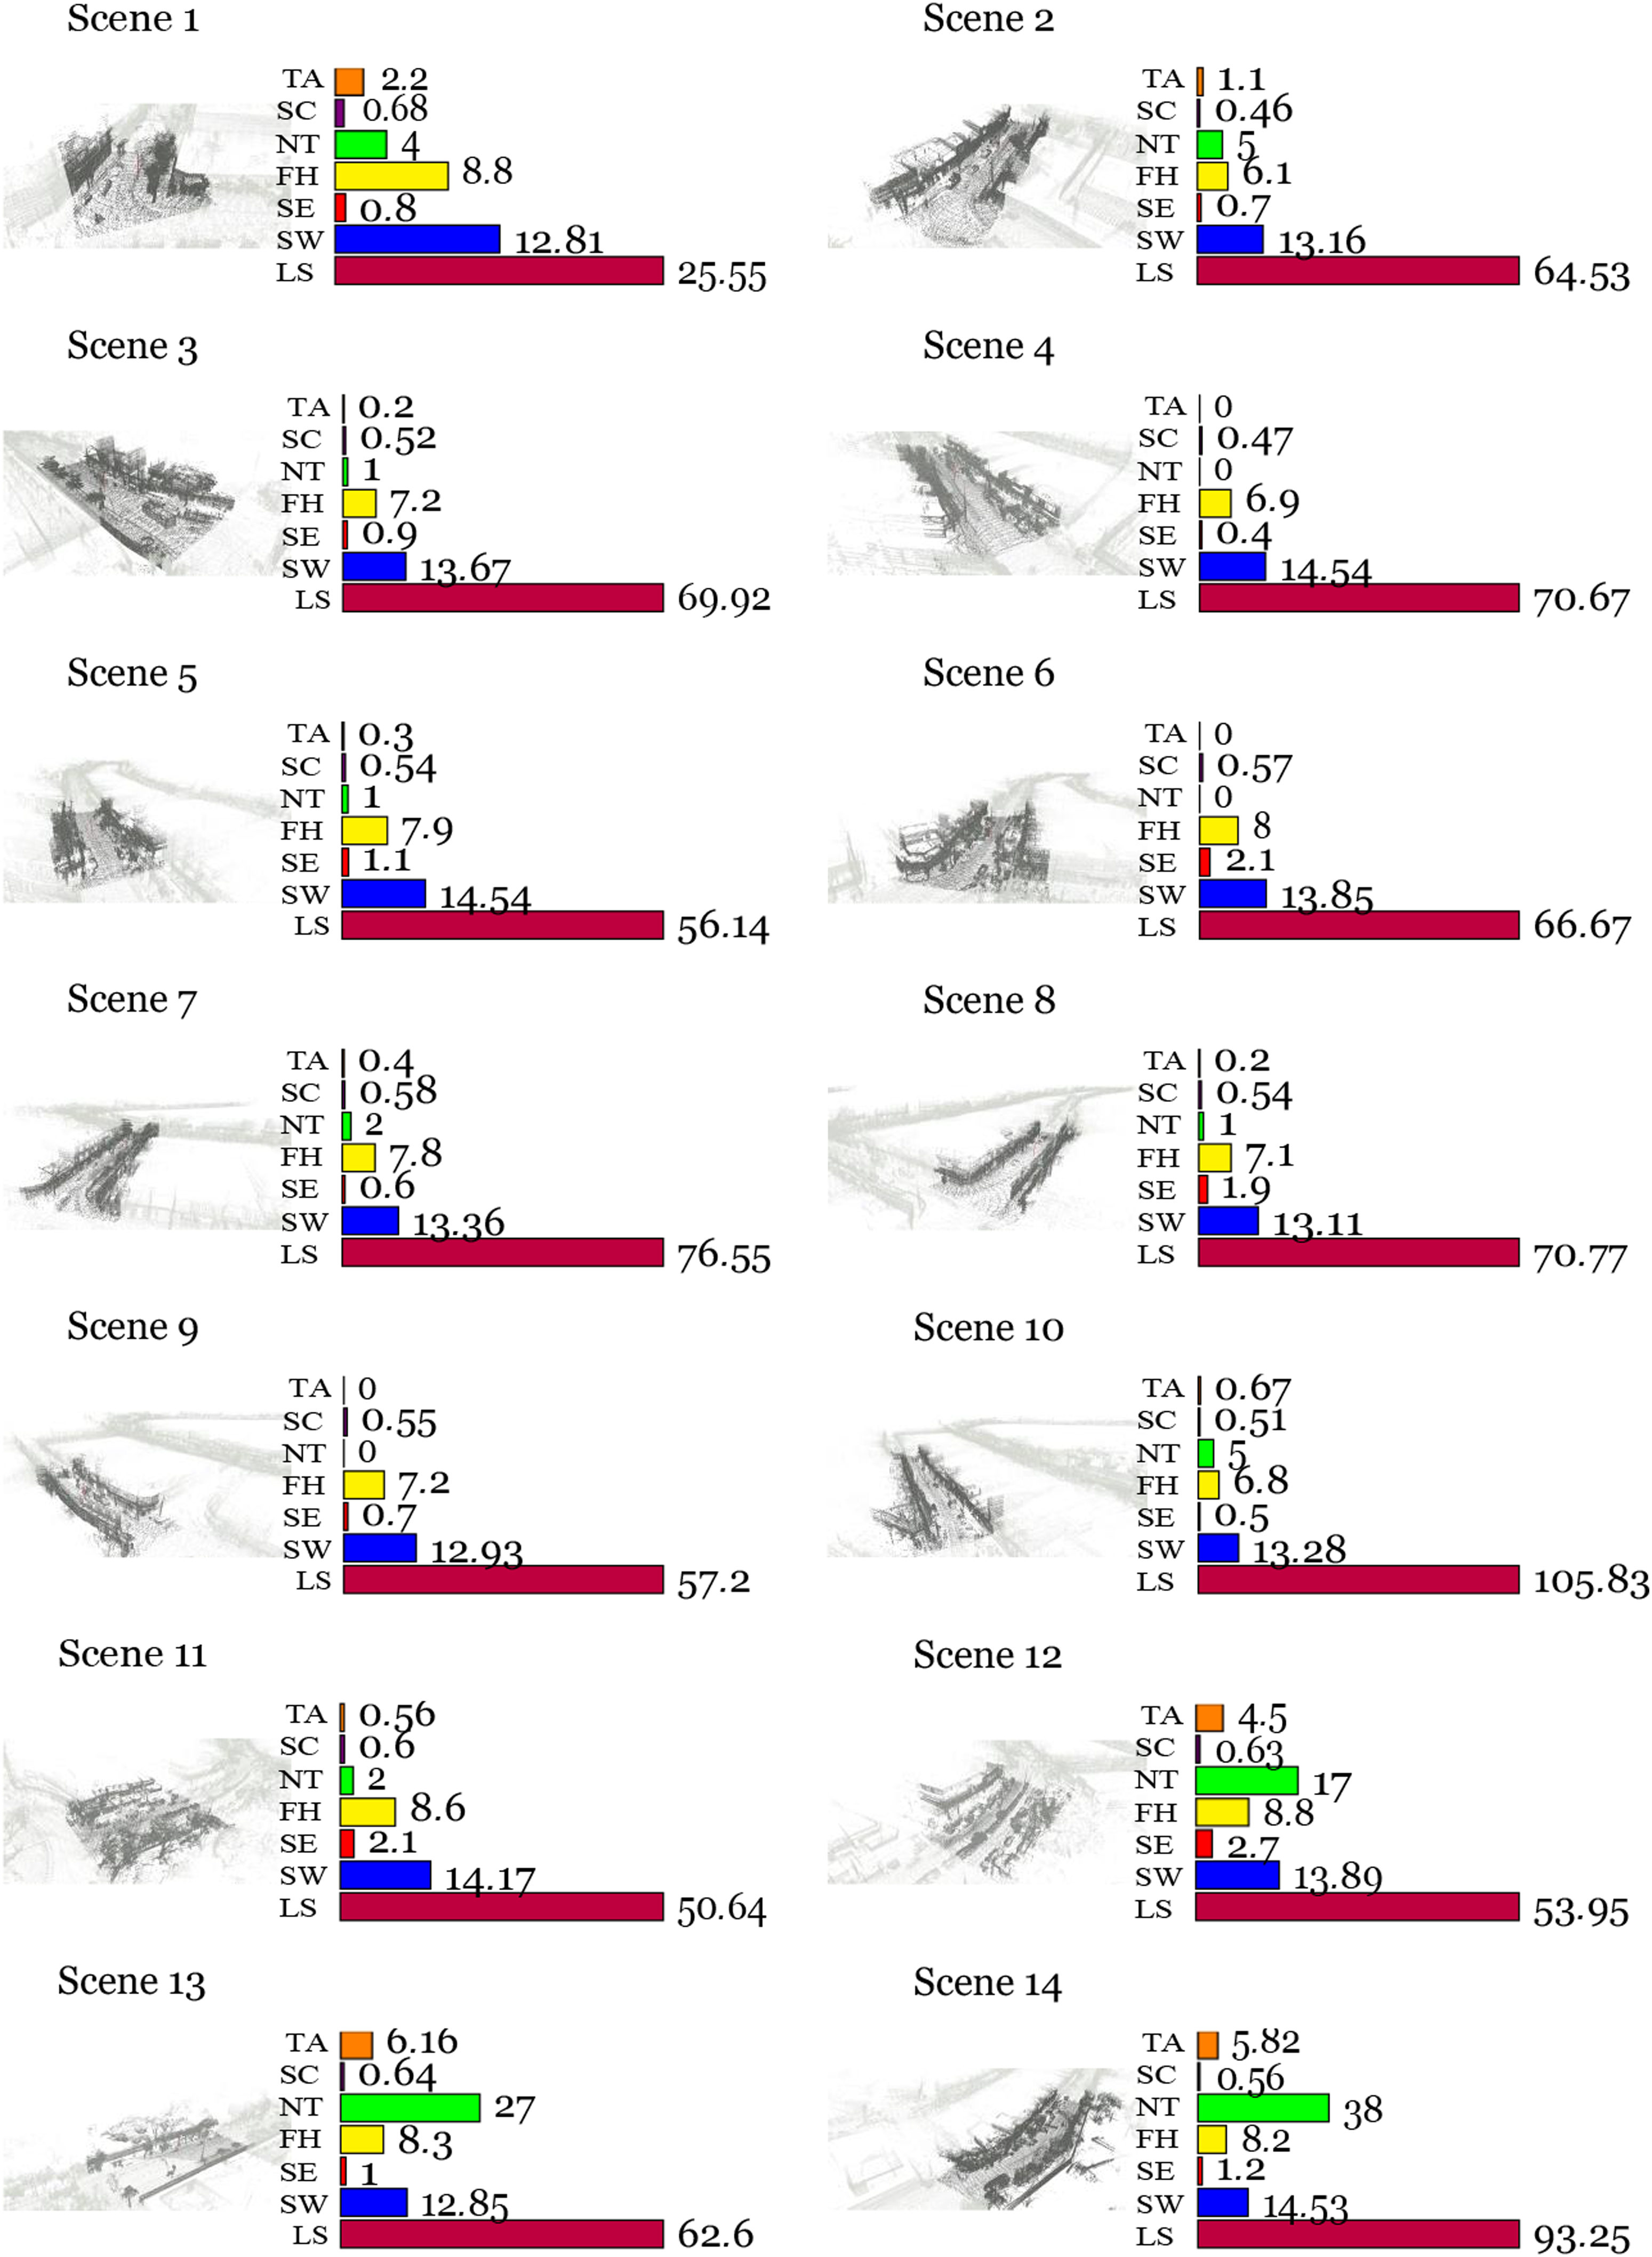
Finally, in Hu et al. (2022), researchers aimed to establish a connection between the quantity of green volume within the street and the esthetic appeal of the space. Their findings revealed a positive correlation between the amount of green volume and a favorable perception of street beauty. Despite variations in the method used to compute tree volume compared to our approach, the comparative results are noteworthy. They quantified beauty perception on a continuous scale ranging from 0 to 5. Streets with higher beauty perception (ranging from 3.27 to 3.58) corresponded to areas with a green volume between 56.91 and 71.79 m3/m. Streets with lower beauty perception scored below 2.39, featuring a green volume below 20.36 m3/m. Having accomplished precise segmentation of each tree in every scene, we proceeded to measure this indicator. The results for each scene are depicted in Figure S5, illustrating that only scene 13 surpasses the threshold of 20.36 m3/m. This observation serves as evidence of the visually unappealing nature of the registered spaces in the Siloé area.
Figure 11 shows a direct comparison between the results obtained by our work and those found in Favelas 4D work Salazar Miranda et al. (2022). This graph compares the global metrics obtained for the study scenes in each work. These are street width, street elevation, facade heterogeneity, and street canyon. Street elevation is presented as the variation of ground height with respect to the variation of street length, in other words, the slope of the street in the scene. The Facade Heterogeneity metric is obtained from the standard deviation of the height of the facades in the scene. By making the direct comparison it is clear that the scenes studied in our work present a much greater street width than in Favelas 4D. It is clear that the areas that were accessed in Siloe´ were spaces where it was possible to travel by vehicle, making the streets wider. Barrios 4D and favelas 4D global analysis comparison. The figure compares the data obtained in our work with results obtained by Favelas 4D. Top left image shows the street widths in meters for the different scenes defined by each approach. Top right chart displays the street elevations in terms of slope. This slope measures the change in height of the street in meters per meter of the scene. The slope values from Favelas 4D were obtained implicitly from their graphics. The facade heterogeneity records the value of the standard deviation of the facade heights for each scene in each work. Bottom right chart shows the street canyon metric obtained for each scene defined by each approach. Information from scenes 1 and 2 of Favelas 4D is not shown as these scenes are not part of an informal settlement.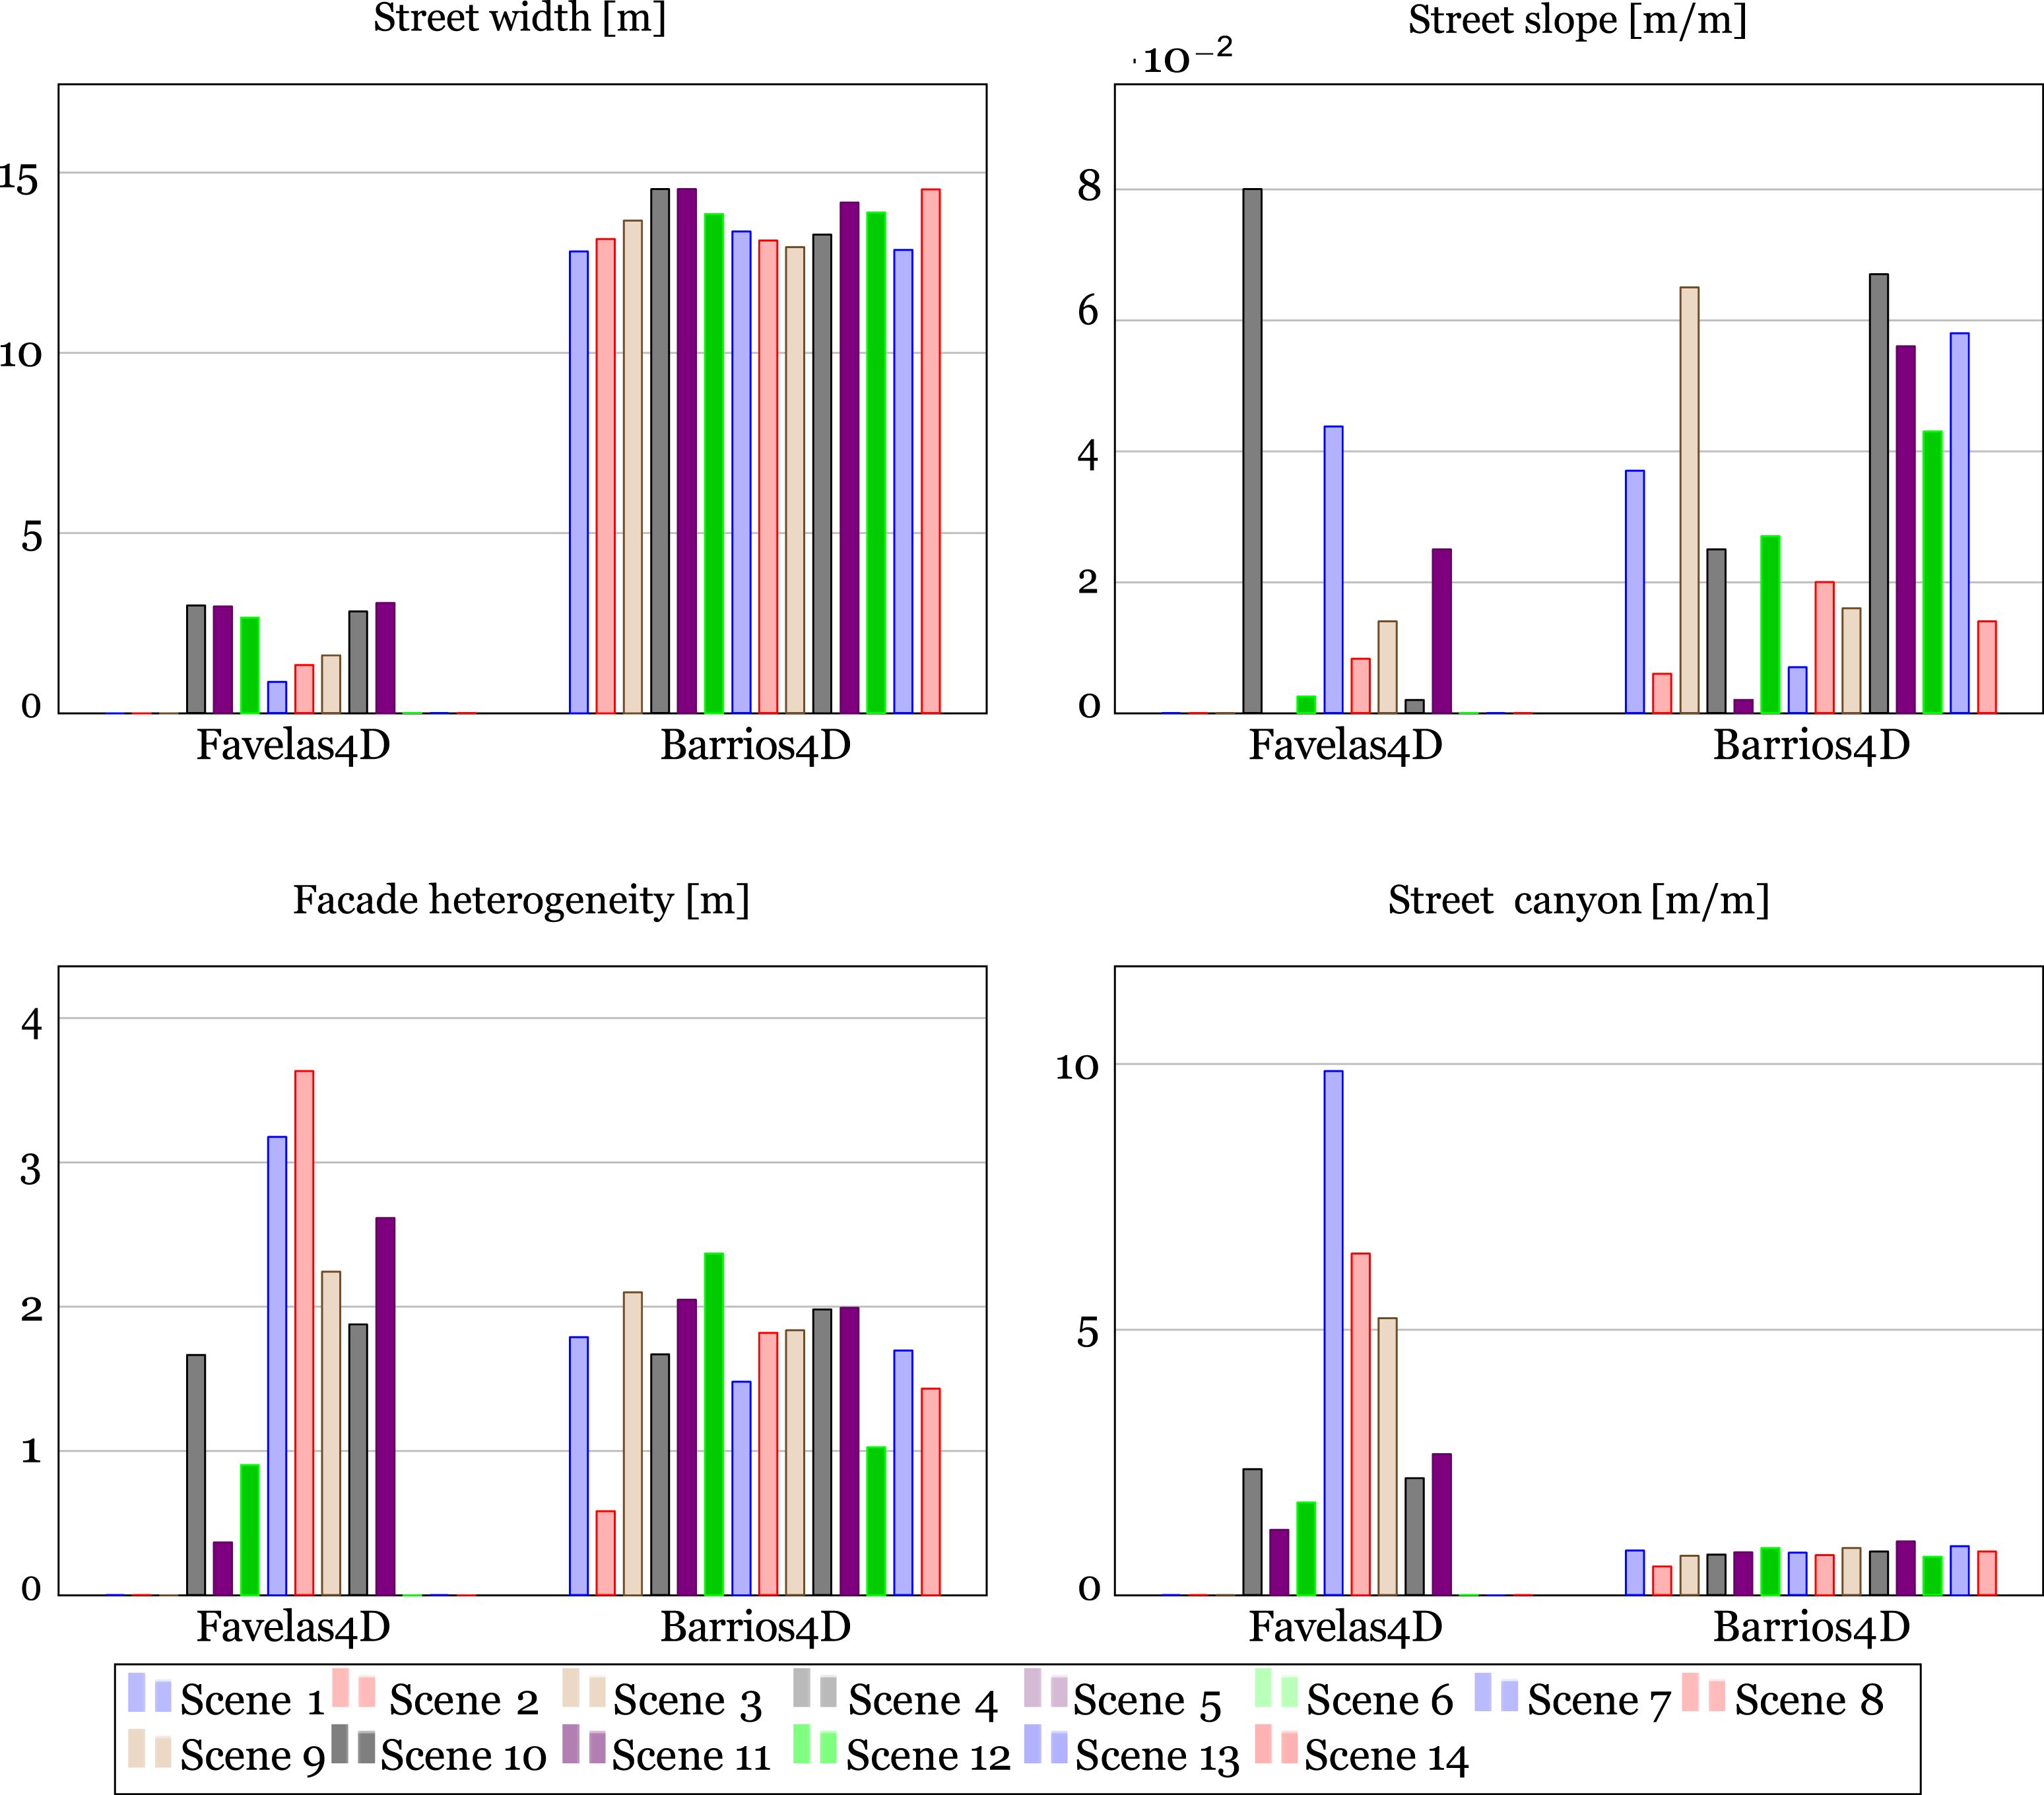
As for the slope of the land, the areas studied in Siloe´ tend to have a greater slope than those evaluated in Brazil. According to the results of the heterogeneity of facades metric, there is a greater variation between the heights of the facades of the houses in Favelas, a characteristic aspect of its buildings with more than three floors, which is unusual in the popular neighborhoods of Cali, as shown, in the studied areas there is a variation of 2 m between houses that can be understood as the difference of one floor between them. As for the Street Canyon metric, due to its wider streets in the studied areas Siloe’, it is understood that in these spaces there may be a greater air flow that can be understood by the lower levels of this metric when compared to Favelas.
Conclusions and future perspectives
This study presents a low-cost system for constructing 3D maps of informal urban environments in Santiago de Cali. Using LiDAR and advanced SLAM algorithms, we successfully generated detailed maps that enabled a morphological analysis of the urban space. Our findings revealed valuable information about building heights, street widths, spatial relationships, and the distribution of trees. This data provides insights into the potential challenges communities face in these areas and helps assess whether the urban environment meets basic comfort standards.
While the LiDAR-based system yielded acceptable results, incorporating visual information from a camera could enhance localization accuracy, especially in areas with poor structural features. Additionally, color information would enable a more detailed characterization of building facades, distinguishing between residential and commercial structures. On the other hand, making use of this information it would be possible to make use of deep learning models to segment the different elements of the scene and fuse their semantic information with the LiDAR information. In addition, with color information it could be possible to perform a more detailed study of green areas, evaluating their conditions from their color. Therefore, for future work, it is proposed to add this type of information to the system.
Our system shown in Figure S1 can be installed on the roof of a vehicle with a rack as shown in Figure S6 from the Appendix section. The current version of the system exposes the sensors and embedded systems to the environment and the main computing unit is stored inside the vehicle. This condition means that the current version can only be used in environmental conditions that do not involve rain or similar conditions that could affect the exposed systems. Protecting our system from these conditions is a task that will be improved in future versions.
In addition, informal settlements are usually characterized by narrow streets and pathways where it is not possible to transit through a vehicle, which is a limitation for our system.
However, this system has also been used by an operator to collect data by walking, see Figure S7. Although this mode of use was not used in this work to collect data from the urban environment, it is clear that the combination of these two implementations, both in vehicle and walking, is necessary to widely understand the particular characteristics of these environments.
The tree census made in the city DAGMA (2022) was a data collection that has been carried out since 2015, a work that takes time and involves the deployment of human agents to identify the specimens. Our system offers a valuable opportunity for these entities to collect crucial data for the effective control and monitoring of green areas.
Supplemental Material
Supplemental Material - Barrios 4D: Semi-automated morphology analysis of human settlements using mobile laser scanning
Supplemental Material for Barrios 4D: Semi-automated morphology analysis of human settlements using mobile laser scanning by Jason Alejandro Castaño-López, Juan Carlos Perafán-Villota and Nicolas Llanos-Neuta, Simone Mora, and Victor Romero-Cano in Environment and Planning B: Urban Analytics and City Science
Footnotes
Acknowledgments
The authors acknowledge the support provided by the MISTI Global Seed Funds grant, as well as the support from Universidad Autónoma de Occidente.
Declaration of conflicting interests
The author(s) declared the following potential conflicts of interest with respect to the research, authorship, and/or publication of this article: The authors declare that the research was conducted in the absence of any commercial or financial relationships that could be construed as a potential conflict of interest.
Funding
The author(s) disclosed receipt of the following financial support for the research, authorship, and/or publication of this article: This work was supported by the MISTI Global Seed Funds grant, as well as MIT International Science and Technology Initiatives.
Data availability statement
Data sharing not applicable to this article as no datasets were generated during the current study.
Supplemental Material
Supplemental material for this article is available online.
Notes
References
Supplementary Material
Please find the following supplemental material available below.
For Open Access articles published under a Creative Commons License, all supplemental material carries the same license as the article it is associated with.
For non-Open Access articles published, all supplemental material carries a non-exclusive license, and permission requests for re-use of supplemental material or any part of supplemental material shall be sent directly to the copyright owner as specified in the copyright notice associated with the article.