
Abstract
Urban point cloud datasets are crucial for understanding the depth and physical structure of environmental features. These details hold significance in urban planning, providing precise measurements of the space upon which novel development plans and strategies can be formulated. However, such datasets, when uncategorized, lack information, rendering them much less helpful in utilizing them in urban planning and design projects. This documentation provides a methodical framework to create the CITYLID dataset, which uses an openly available citywide aerial Lidar dataset, categorizes it with standard urban classes such as buildings, trees, and ground, and fuses with it detailed street features information such as driveways, medians, bikepaths, walkways, and on-street parking. Since the point cloud provides the required height information, shadow maps are also generated utilizing the entire point cloud dataset and further integrated with the point clouds. The resulting dataset includes 3 standard and 5 street feature classes, along with 5 classes representing shadows. Apart from the categorized point cloud dataset, we additionally provide the detailed methodology to generate Lidar categorization and starter codes to extract subsets of point clouds, which can be used to analyze and study urban environments such as street cross-sections, neighborhood comparisons, tree inventory, etc.
Introduction
A point cloud comprises data points within a 3D coordinate system, typically acquired through laser scanning (Lidar) or photogrammetry (Moon et al., 2019). Given their capability to represent depth and heights, point clouds serve as a fundamental framework for the precise construction of 3D models depicting urban environments. Point clouds significantly enhance the fields of surveying and mapping, particularly in applications where precision mapping is imperative for infrastructure development (Soilán et al., 2019). This is particularly relevant for projects involving the construction of bridges, buildings, roads, and utility networks.
Point clouds assist urban planners and designers gather a detailed understanding of the existing urban environment, which is crucial for making informed decisions regarding land use planning and zoning. They also play a vital role in environment monitoring by helping analyze vegetation cover, canopy shapes, and tree species identification (Chen et al., 2021; Liu et al., 2021; Weinstein et al., 2021). By comparing point clouds collected at different times, urban areas can be monitored for changes in land use, vegetation, and infrastructure (Teo and Shih, 2013). Point clouds have also been used in disaster relief and vulnerability assessment, where accurate infrastructure details better estimate resource deployment, aiding recovery efforts (Muhadi et al., 2020). Recently, they have been used to create immersive AR and VR experiences, which can be leveraged for decision-making and collecting public perceptions (Yue et al., 2018).
While point cloud datasets offer promising advantages in examining urban details, their widespread adoption is constrained by various technical challenges associated with data collection. The primary limitation is the equipment cost, making it challenging for organizations and municipalities with smaller budgets to invest in this technology. Other issues are large data sizes, limited expertise, lack of data standardization essential for interoperability, and privacy concerns (Sharif, 2021). Further, while point cloud data provides a detailed 3D representation, the collected raw data is not immediately valuable without proper categorization or classification. Categorization involves assigning labels to individual points based on their characteristics, such as trees, buildings, ground, streets, etc. Various approaches, including manual categorization and machine learning methods, are employed to classify point clouds effectively (Weinstein et al., 2021). However, this process usually requires non-trivial solutions involving technical and computational challenges. Hence, only a limited number of openly available sources in the research domain provide categorized Lidar datasets (Varney et al., 2020; Ye et al., 2020). A significant portion of point cloud datasets made accessible by organizations or city municipalities is often found to be uncategorized or only partially categorized. This observation is particularly noticeable among German cities, where various organizations (LGB, 2023) openly share point cloud datasets that lack full categorization.
This study utilizes one such raw point cloud data provided by FISBroker (Geoportal Berlin, 2023), a geoportal providing citywide geospatial datasets for Berlin, and (a) categorizes raw point clouds into common classes such as ground, buildings, and trees (b) integrates detailed 2D street plan of the city which includes information regarding medians, driveways, walkways, bikepath, and on-street parking with the point clouds, (c) generates Digital Surface Model (DSM) to create shadow maps for the entire city, which is further fused with the resulting point clouds. The final dataset (CITYLID) has also been utilized to generate citywide cross-sections and analyze the city’s generic street characteristics (Verma et al., 2023).
Dataset generation methodology and usage
Preparing the final data product includes using two primary datasets provided by Geoportal of Berlin (Geoportal Berlin, 2023): (a) Aerial Lidar dataset covering the entire city with a resolution of 9.8 points/sqm. The dataset was captured and updated as of 02.03.2021 (Berlin, 2021). The raw dataset contains ∼15 Billion points and is available in *las 1.4 version format. The dataset is divided into 1060 tiles, each with 1 sq. km of area (Figure 1), and is partially categorized into ground and vegetation classes. When downloaded, the uncompressed version of files amounts to roughly 250 GB of disk space. (b) The street dataset comprises a collection of 67 2D shapefiles representing a variety of street components such as driveways, walkways, and parking, and other street infrastructure such as locations of bus stops, hydrants, telephone booths, etc., as polygons and point details. The dataset was created with the help of manual surveying in 2014 and was recently updated in 2019 (Berlin, 2019). We utilize 5 shapefiles, such as medians, driveways, bikepaths, walkways, and on-street parking, in preparation for the final data product. The rest of the shapefiles can also be used based on the application or aim of the study. These datasets are made available using a DL-DE license (Govdata Deutschland, 2023), which allows them to be used for commercial or research purposes. It also permits the dataset to be merged with other independent datasets and integrated into products and applications. Methodology to create categorized point clouds.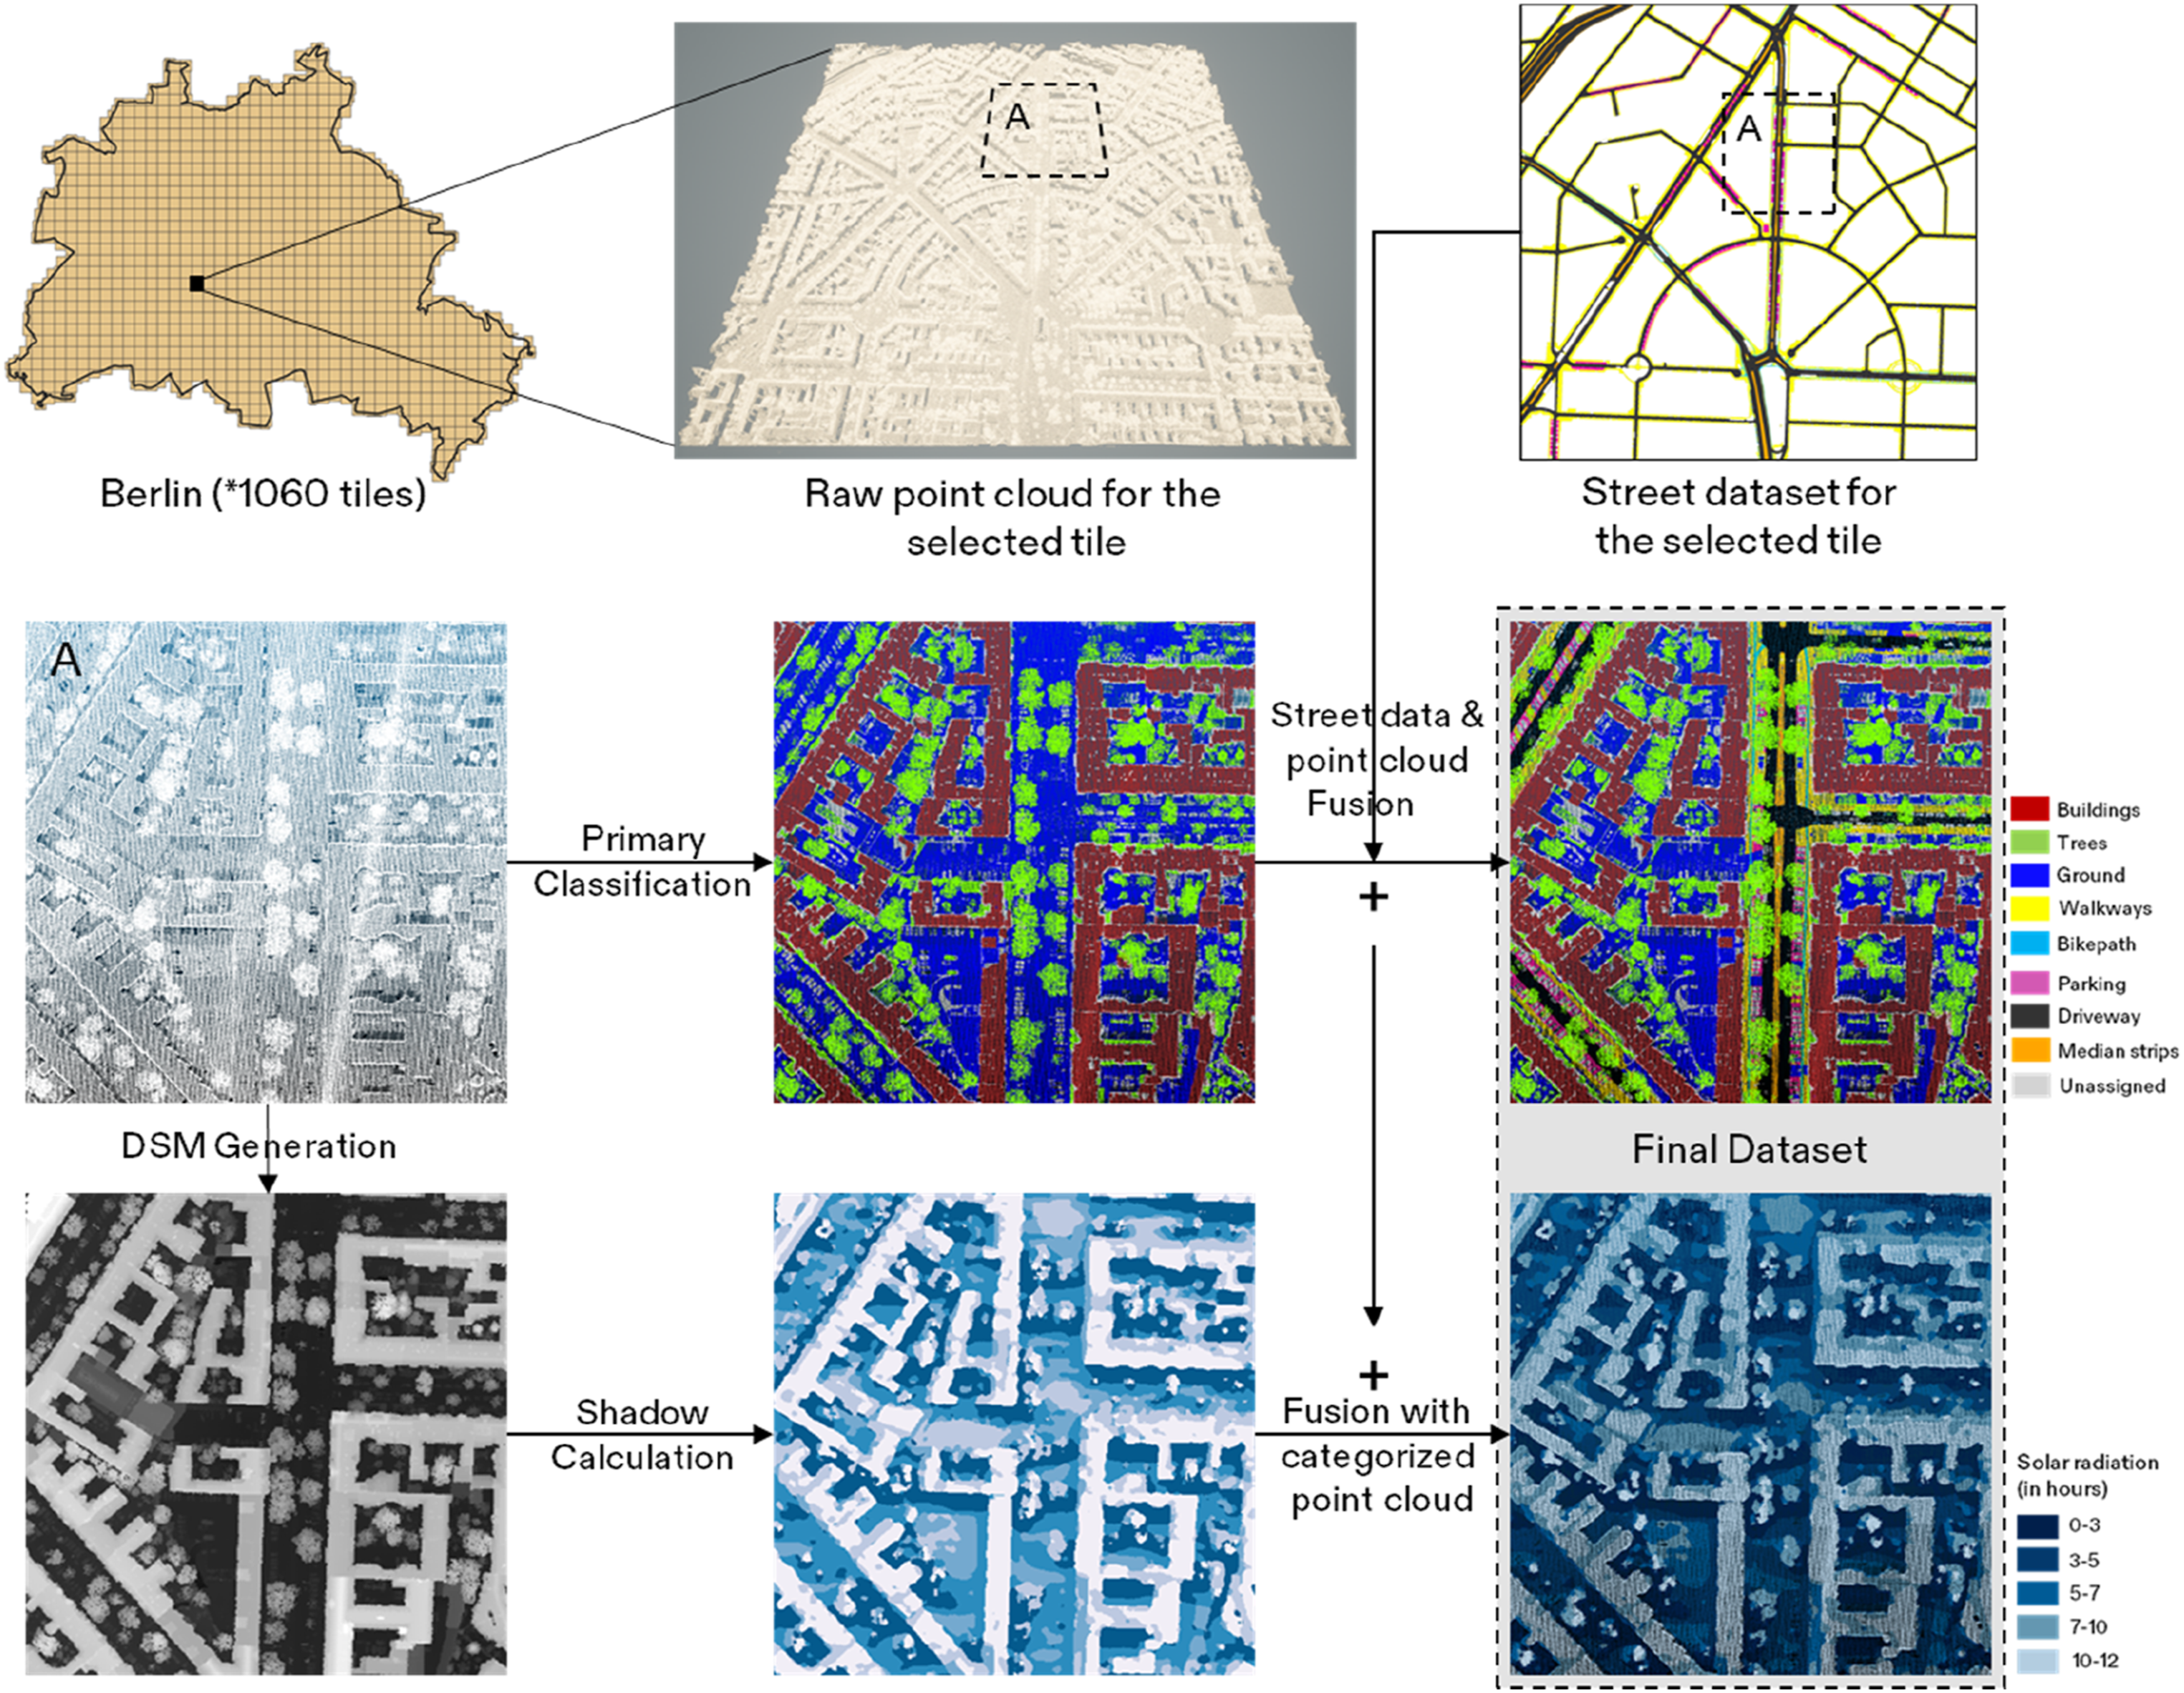
Although the raw downloaded data is partially classified into ground and vegetation classes, it lacks information about points classified as buildings. Moreover, the existing data lacks details on the methodologies employed to categorize and other associated technical information. Therefore, it became essential to initiate a new categorization process from scratch. We used LASTools (Rapidlasso, 2022), a semi-proprietary software suite designed for diverse point cloud processing tasks, to categorize the point clouds. Within the software suite, we utilize tools such as lasground, lasheight, and lasclassify to assign each data tile to primary classes such as ground, buildings, and trees. Since water bodies exhibit similar features to the ground, the tools collectively classify them as ground. The categorization results divide the city of Berlin into different classes, with 45% assigned to ground and water, 30% to trees, 8% to streets (computed after fusing street data with primary classification), 7% to buildings, and the remaining 10% as unassigned points. Unassigned points comprise building faces/walls, street lamps, vehicles in the street, and other infrastructure that cannot be classified as one of the three primary classes.
After the primary classification, each tile is fused with the information obtained from street shapefiles using PDAL (PDAL, 2022). PDAL is a data abstraction library with scripts and code snippets that help process point datasets. It is used to integrate the street information (5 street feature classes) with the points in the point cloud initially categorized as ground. The data fusion process initially separates the ground points from the point cloud and uses the PDAL colorize function to paint the points overlapping with the 2D shapefiles with the respective street classes. The fused point dataset is then reattached to the remaining point cloud, thus obtaining the dataset fused with the street information (Figure 1).
Shadows are one crucial component of urban design and planning, constantly overlooked due to the unavailability of required data to calculate them. 3D representation of the city via point clouds also allowed us to study solar radiation and shadows in the entire city. To calculate shadow information, all the tiles are converted to the Digital Surface Model (DSM) at 0.5 m/px resolution with the help of PDAL. DSM requires only the height information of each point; therefore, it can be generated from either the raw or categorized point cloud. The DSM produces a raster dataset that includes height data within each pixel. An ArcGIS solar radiation pattern generation tool is employed to extract shadow information. This tool utilizes a hemispherical view shed algorithm (Rich et al., 1994), leveraging DSM tiles to generate shadow maps. Since shadows vary temporally, the tool allows the generation of shadow maps based on the time and the day. This study creates shadow maps by taking the sunniest day in the calendar, the summer equinox. The solar maps are generated for the 21st of June for 12 h from 0800 to 2000 h. The tool also considers other parameters such as calculations-directions, diffuse proportion, transmissivity, azimuth, and zenith divisions, which are kept as default (32, 0.3, 0.5, 8, and 8, respectively). The obtained shadow maps are again grouped to form 5 classes based on the hours of received sunlight: 0–3, 3–5, 5–7, 7–10, and 10–12 h. Like the fusion of street shapefile information, the shadow maps are also integrated with the prepared fully categorized point cloud. The resulting cloud consists of two classifications, one with the fused 8-class urban features (3 standard +5 street feature classes) and the other with 5 shadow classes.
The acquisition process of raw data and fusion of other spatial information is further explained with the help of scripts and code snippets in the GitHub repository (https://github.com/deepankverma/navigating_streetscapes). The final fused Lidar point cloud and the solar maps in raster format can be downloaded from the data repository (https://huggingface.co/datasets/Deepank/CITYLID). We also provide R-based scripts, demonstrating one application of creating cross-sections and analyzing the city’s distribution of various streetscape features. Alternative to the fused dataset, users can download the raw point files from the official Berlin geoportal (Geoportal Berlin, 2023) and follow the process to generate the fused Lidar dataset and attach any other information available in the portal, such as building types, tree species, and further street infrastructure details.
Future applications and limitations
The study generates one of the largest categorized point clouds available for study in urban research. Since the data covers the entire city, it is fascinating as a fruitful resource for intra-urban analysis, measurements, and applications suited for various studies related to street design, urban mobility, land use, and environmental assessments. Given its richness and coverage, this dataset has been used to create cross-sections, study generic street types, compare streets, and calculate street metrics (Verma et al., 2023). Further, since the point cloud provides building and tree heights, the estimation of enclosure and sky view factors can be easily estimated. Additionally, the information extracted from the point cloud can be integrated with the details of the street captured from the street view images, which can provide information regarding critical visual features such as building layout and architecture.
Identification, mapping, and evaluation of trees have been a prime component in the ecological assessments of urban areas; the categorized point clouds can help prepare tree inventory and can help generate tree metrics for calculating access to greenery, vegetation upkeep, and estimation of foliage and biomass for carbon estimation. Moreover, climate assessments have recently focused on the neighborhood level, identifying causes and preventions, especially from urban heat (Park et al., 2019). The point cloud dataset and the shadow information can be utilized to estimate neighborhood vulnerability to heat and the shadow areas where pedestrians and cyclists prefer to walk and ride. Further, the scope of such studies can be enhanced when studied with other demographic and socio-economic details.
Apart from purely urban planning and design-related topics, point clouds have been paramount in scene-understanding tasks involving robots and self-driving cars. Although these applications deal with precise 3D point clouds captured via onboard Lidar systems, integrating a citywide categorized large point cloud with locally collected terrestrial points might enhance the data quality, density, and coverage.
The dataset enables a wide variety of urban studies that can take help from the detailed representation of the urban neighborhood. However, there are three main limitations that users might need to consider before using the data. Firstly, this dataset’s resolution is significantly less than point cloud datasets acquired using terrestrial lidar devices. Although this data proves advantageous for citywide applications owing to its reduced size and computational demands, it is not suitable for precise measurements. Further, due to point sparseness and occlusion, the tools employed misclassify building walls as unclassified points, and the tree trunks and small vegetation are not identified in some cases. Secondly, the solar profile and shadows created using the ArcGIS toolset only provide a general outlook. Precise shadow measurements often require a detailed study of radiation patterns, radiative flux around buildings, and light transmittance from built structures and trees (Noilhan, 1981). Current work utilizes default parameters for shadow generation, which saves processing times while providing an accurate summary of shadow patterns, which is still valid for studying local neighborhoods. However, a more precise measurement might be required for studies dealing with establishing a deeper understanding of local heat risks. Moreover, the current dataset only includes shadow rasters generated for a particular day, that is, 21st June; this restricts the usage of shadow-based analysis throughout the year. However, the data repository includes processes and quick steps to generate shadow details for specific times and time intervals, which can be attached to classified lidar point clouds with the help of PDAL scripts.
Finally, the raw point cloud is categorized with the help of LASTools, a semi-proprietary algorithm; the performance and the inner workings of algorithms used in its tools are unknown. Further, since no truth labels are associated with the raw data, the classification accuracy is difficult to ascertain. On analyzing the obtained results visually, the results seem to display coherence with the additional street and building data Berlin Geoportal provides. However, the results from such algorithms might differ widely when applied in other geographical regions with different built structures and vegetation. Although DL-based state-of-the-art point cloud classifiers have shown excellent performance in denser indoor and outdoor datasets collected from the ground, they have yet to deliver their performance in sparser aerial point clouds. Utilizing this comprehensive dataset compilation, we aim to create DL models designed explicitly for classifying aerial Lidar data in future studies. This effort will improve categorization accuracy and achieve broader generalization in the model’s output.
Conclusion
Point cloud datasets play a pivotal role by adding a “depth” dimension to urban research. Incorporating 3D visualization and analysis into examining the city and its environs introduces additional facets, opening up novel avenues for research. As the field progresses, embracing technologies like virtual reality (VR), augmented reality (AR), and 3D simulations, these datasets will prove indispensable for researchers. We offer a comprehensive Lidar dataset, CITYLID, categorized on a large scale derived from an openly accessible citywide point cloud dataset. Additionally, we provide scripts and code that allow users to interact with and process the data for diverse projects. We expect that this dataset will assist other researchers in discovering new urban intricacies and relationships, facilitating the integration of personalized datasets with point cloud data, thereby expanding their research.
Footnotes
Declaration of conflicting interests
The author(s) declared no potential conflicts of interest with respect to the research, authorship, and/or publication of this article.
Funding
The author(s) disclosed receipt of the following financial support for the research, authorship, and/or publication of this article: This research was funded by the Ministry of Science and Culture of Lower Saxony and by the Volkswagen Foundation under Grant 94957.
Data availability statement
All the datasets used in the study are cited in the text.