
Abstract
This paper examines the response of the Airbnb ‘market’ to the shock of COVID-19, exploring the spatio-temporal variations in Airbnb listings, revenues, and hosting patterns in Greater London over the pre-lockdown, lockdown, and post-lockdown periods. At an aggregate level, Airbnb listings and revenues were found to have declined during the pandemic with disruptions differentiated according to the professional or amateur status of hosts. We then disaggregate these global trends to neighbourhood level. We explore the relative importance of socio-demographic, accessibility and neighbourhood amenities to Airbnb revenue levels across the Capital over the course of the pandemic. In doing so, we expose patterns in the Airbnb market as a result of the COVID-19 shock, revealing a geography of spatial clustering in Airbnb revenue levels over time and variations and volatility based neighbourhood deprivation. While COVID-19 certainly delivered a disruptive effect on Airbnb in Greater London, the pandemic did not de-stabilise existing geographies of Airbnb, especially in Inner London, where Airbnb remains spatially entrenched and challenges around housing affordability and neighbourhood gentrification are acute.
Introduction: Airbnb, short-term rentals, and the COVID-19 crisis
Short-term rentals and their associated platform technologies have transformed urban housing markets globally (Deboosere et al., 2019). Airbnb, a dominant peer-to-peer (P2P) platform, operates in over 220 countries and territories, in 100,000 cities, with 6 million active listings (Airbnb, 2022a). Here notable attention has been paid to the ‘disruptive potential’ of Airbnb and other platform services on the urban economy, especially on tourism and the housing market.
Conceived originally as a means for the small-scale ‘amateur landlord’ to advertise and share spare rooms and second homes to generate income, critics point to a gradual deviation towards large-scale, entrepreneur-led activities (Bosma, 2022; Gil and Sequera, 2020; Todd et al., 2021), as profit-making opportunities are said to be attracting rising numbers of professionals – reflected in multi-listing and ‘super-host’ providers (see Deboosere et al., 2019) – advertising on the platform (Cocola-Gant et al., 2021; Semi and Tonetta, 2021). Furthermore, critics also argue that short-term rentals, facilitated by digital platforms, concentrate near tourist attractions, deepen housing financialisation and capital investment in the built environment, thereby intensifying spatial clustering of peer-to-peer accommodation that has the potential to deepen housing insecurity (Gutiérrez et al., 2017; Wachsmuth and Weisler, 2018).
However, the onset of COVID-19 in early 2020 saw severe restrictions imposed on international movement that halted the normal functioning of cities, paralysed the travel and tourism industries, and led to recessions in urban economies globally, including the accommodation sector (Gerwe, 2021; Zachreson et al., 2021). Airbnb did not escape the impacts of the global pandemic. At the height of the COVID-19 pandemic, in May 2020, Airbnb Inc. made 1900 employees redundant, approximately 25% of its workforce, and projected revenue was halved compared to 2019 (Gerwe, 2021). Yet evidence also revealed that Airbnb hosts lost 6.5 times more than the platform itself (Chen et al., 2021), suggesting that hosts bore greater pandemic risks while adjusting their ‘sharing behaviours’ to mitigate the impacts of the pandemic (Calatayud, 2020; Nhamo et al., 2020).
This unexpected shock led commentators to question whether COVID-19 had ‘disrupted the disruptor’ (Dolnicar and Zare, 2020). Yet, the spatial impact of COVID-19 on short-term rentals over space and time remains understudied, a gap this paper aims to fill. If pre-pandemic short-term rentals were concentrated in specific neighbourhoods, deepening housing inequalities and facilitating gentrification (Deboosere et al., 2019; Jang and Kim, 2022; Lima, 2019; Morales-Pérez et al., 2020; Wachsmuth and Weisler, 2018), then understanding how these patterns changed in response to the crisis could help shed light on the vulnerability of certain neighbourhoods to shocks (Hincks, 2017). Furthermore, the response of hosts to the crisis varied, with some doubling down and others adjusting their strategies, potentially reproducing housing information inequalities and triggering spatial adjustments in rental patterns, further impacting urban housing systems and regulations (Dolnicar and Zare, 2020; Wachsmuth and Weisler, 2018).
Here we recognise that the impact of the pandemic on short-term rentals is unlikely to be spatially or temporally homogeneous (Jang et al., 2021; Jang and Kim, 2022), with predictions being that short-term rental markets did not return to pre-COVID dynamics, that profit-minded hosts will have moved their assets to safer longer-term rentals, and amateur hosts will have increased their presence on the platform (Dolnicar and Zare, 2020).
The extent to which the pandemic has instituted a shift towards the original ethos of Airbnb remains to be seen. Our focus instead falls on elucidating spatial patterns in Airbnb listings and revenues over the course of the pandemic in Greater London, exploring patterns of spatial clustering in Airbnb responses and geographies variegated by levels of neighbourhood deprivation (also see Todd et al., 2021). Employing a geospatial framework, we identify neighbourhoods with significant changes in Airbnb listings and yields during different phases of the pandemic and assess some of the factors influencing these listings. Our analysis is framed around the following questions: 1. What are the spatial and temporal patterns of Airbnb rentals before, during, and after the pandemic? 2. Did Airbnb rental revenues vary during the pandemic based on location, amenities, and host neighbourhood characteristics? If so, how? 3. Is there an association between Airbnb rental revenues and neighbourhood-level deprivation, and is there evidence of spatial clustering of revenues across Greater London during different pandemic phases?
Methodology
In this section, we outline the data and methodology we employed to explore spatial and temporal responses of short-term Airbnb rentals to the COVID-19 crisis.
The Airbnb dataset for Greater London
The data we employ were sourced through the open-source project – insideairbnb.com – which provides Airbnb listing information obtained from Airbnb.com. We focus on the period from January 2020 until the end of the third lockdown in England, considering three periods that coincide with phases of lockdown and easing of restrictions (see Brown and Kirk-Wade, 2021): January 2020 pre-lockdown, October 2020 first lockdown lifted, and April 2021 post-lockdown, to capture the extent of the impact on Airbnb in Greater London across these different phases of the pandemic.
The Airbnb listings dataset contains detailed information about hosts and rental space, such as prices, coordinates, profile of hosts, room type, reviews, and calendar dates of bookings. The data was pre-processed by removing listings without online customer reviews (Wang and Nicolau, 2017), which resulted in a dataset comprising 1,265,107 listings. The calculation of monthly revenues for short-term rentals was derived from the product of the nightly price and the number of occupied days in a given month (Yrigoy, 2019). The occupancy estimation is based on the model developed by Inside Airbnb project (see Cox, 2019) and the monthly average revenue for Lower Layer Super Output Areas (LSOAs) was obtained through aggregation of a mean. LSOAs are official census units used in England, created for the dissemination of statistical data and are defined by population size (approximately 1,500 people), contiguity, and social homogeneity (ONS, 2021). To ensure comparability and completeness of data from multiple sources, we employ 2021 LSOAs boundaries to aggregate a range of demographic and socio-economic attributes compiled at Output Area level from the 2021 Census of Population for England. 1
We sourced the Indices of Multiple Deprivation (IMD) 2019 – an official measure of neighbourhood-level deprivation in England – that can be used to distinguish more deprived from less deprived areas in relative terms. The 2019 English IMD uses indicators from income, employment, health, education, housing, crime, and environment to create weighted domain scores that combine to form a composite deprivation score for each LSOA. The higher the score, the more deprived is the area. In addition, the age of residential dwellings was obtained from the Consumer Data Research Centre (CDRC). Information on open spaces and Public Transport Accessibility Levels were sourced through the London Data Store. POIs data from Ordnance Survey include 10 groups of accommodation, commercial services, attractions, education, sports, and transport, with a total of 52 categories, 2 through which we can calculate the various amenities within each LSOA.
Methods
Having compiled our Airbnb and neighbourhood-level datasets, the next step involved calculating descriptive statistics of Airbnb listings across ‘sub-regions’ of Greater London (London City Hall, 2016). Following this, a modelling framework was specified to capture temporal and spatial patterns of Airbnb listings in Greater London over the different pandemic periods, reflecting locational effects on revenues. As the starting point, ordinary least squares (OLS) regression models were used to estimate global trends and relationships between the dependent and independent variables for Greater London. However, analysis revealed the presence of spatial autocorrelation in Airbnb listings at all three time periods. Therefore, two alternative approaches – spatial lagged models (SLMs) and spatial error models (SEMs) – were employed to supplement the global OLS model as a means of accounting for spatial dependence by using the same dependent and independent variables employed in the OLS model.
SLM focuses on the existence of diffusion of variables in a region (i.e. spatial spillover effects) by adding a spatial lag term for the dependent variable to the OLS model, which takes into account the effect of observations of the dependent variable in one spatial unit

SEM deals with the presence of spatial dependence of the error term focussing on the spatial dependence caused by omitted variables. The model incorporates a spatially lagged error term in a classical linear regression. A common spatial error model expression is:

The spatial model setting typically consists of two main steps: 1. Calculating the spatial weight matrix to quantify the spatial dependence between observations. A Gaussian kernel with adaptive bandwidth matrix was adopted to capture the diminishing influence between observations as distance increases. 2. Model comparison and selection. The choice of model (Anselin, 1988; Seya et al., 2020) for SLM and SEM is decided by evaluating the Lagrange multiplier (LMLAG and LMERR) and their robustness measures (R-LMLAG and R-LMERR). AIC and log-likelihood provide additional evidence for the comparative performance of the models.
Description of variables.
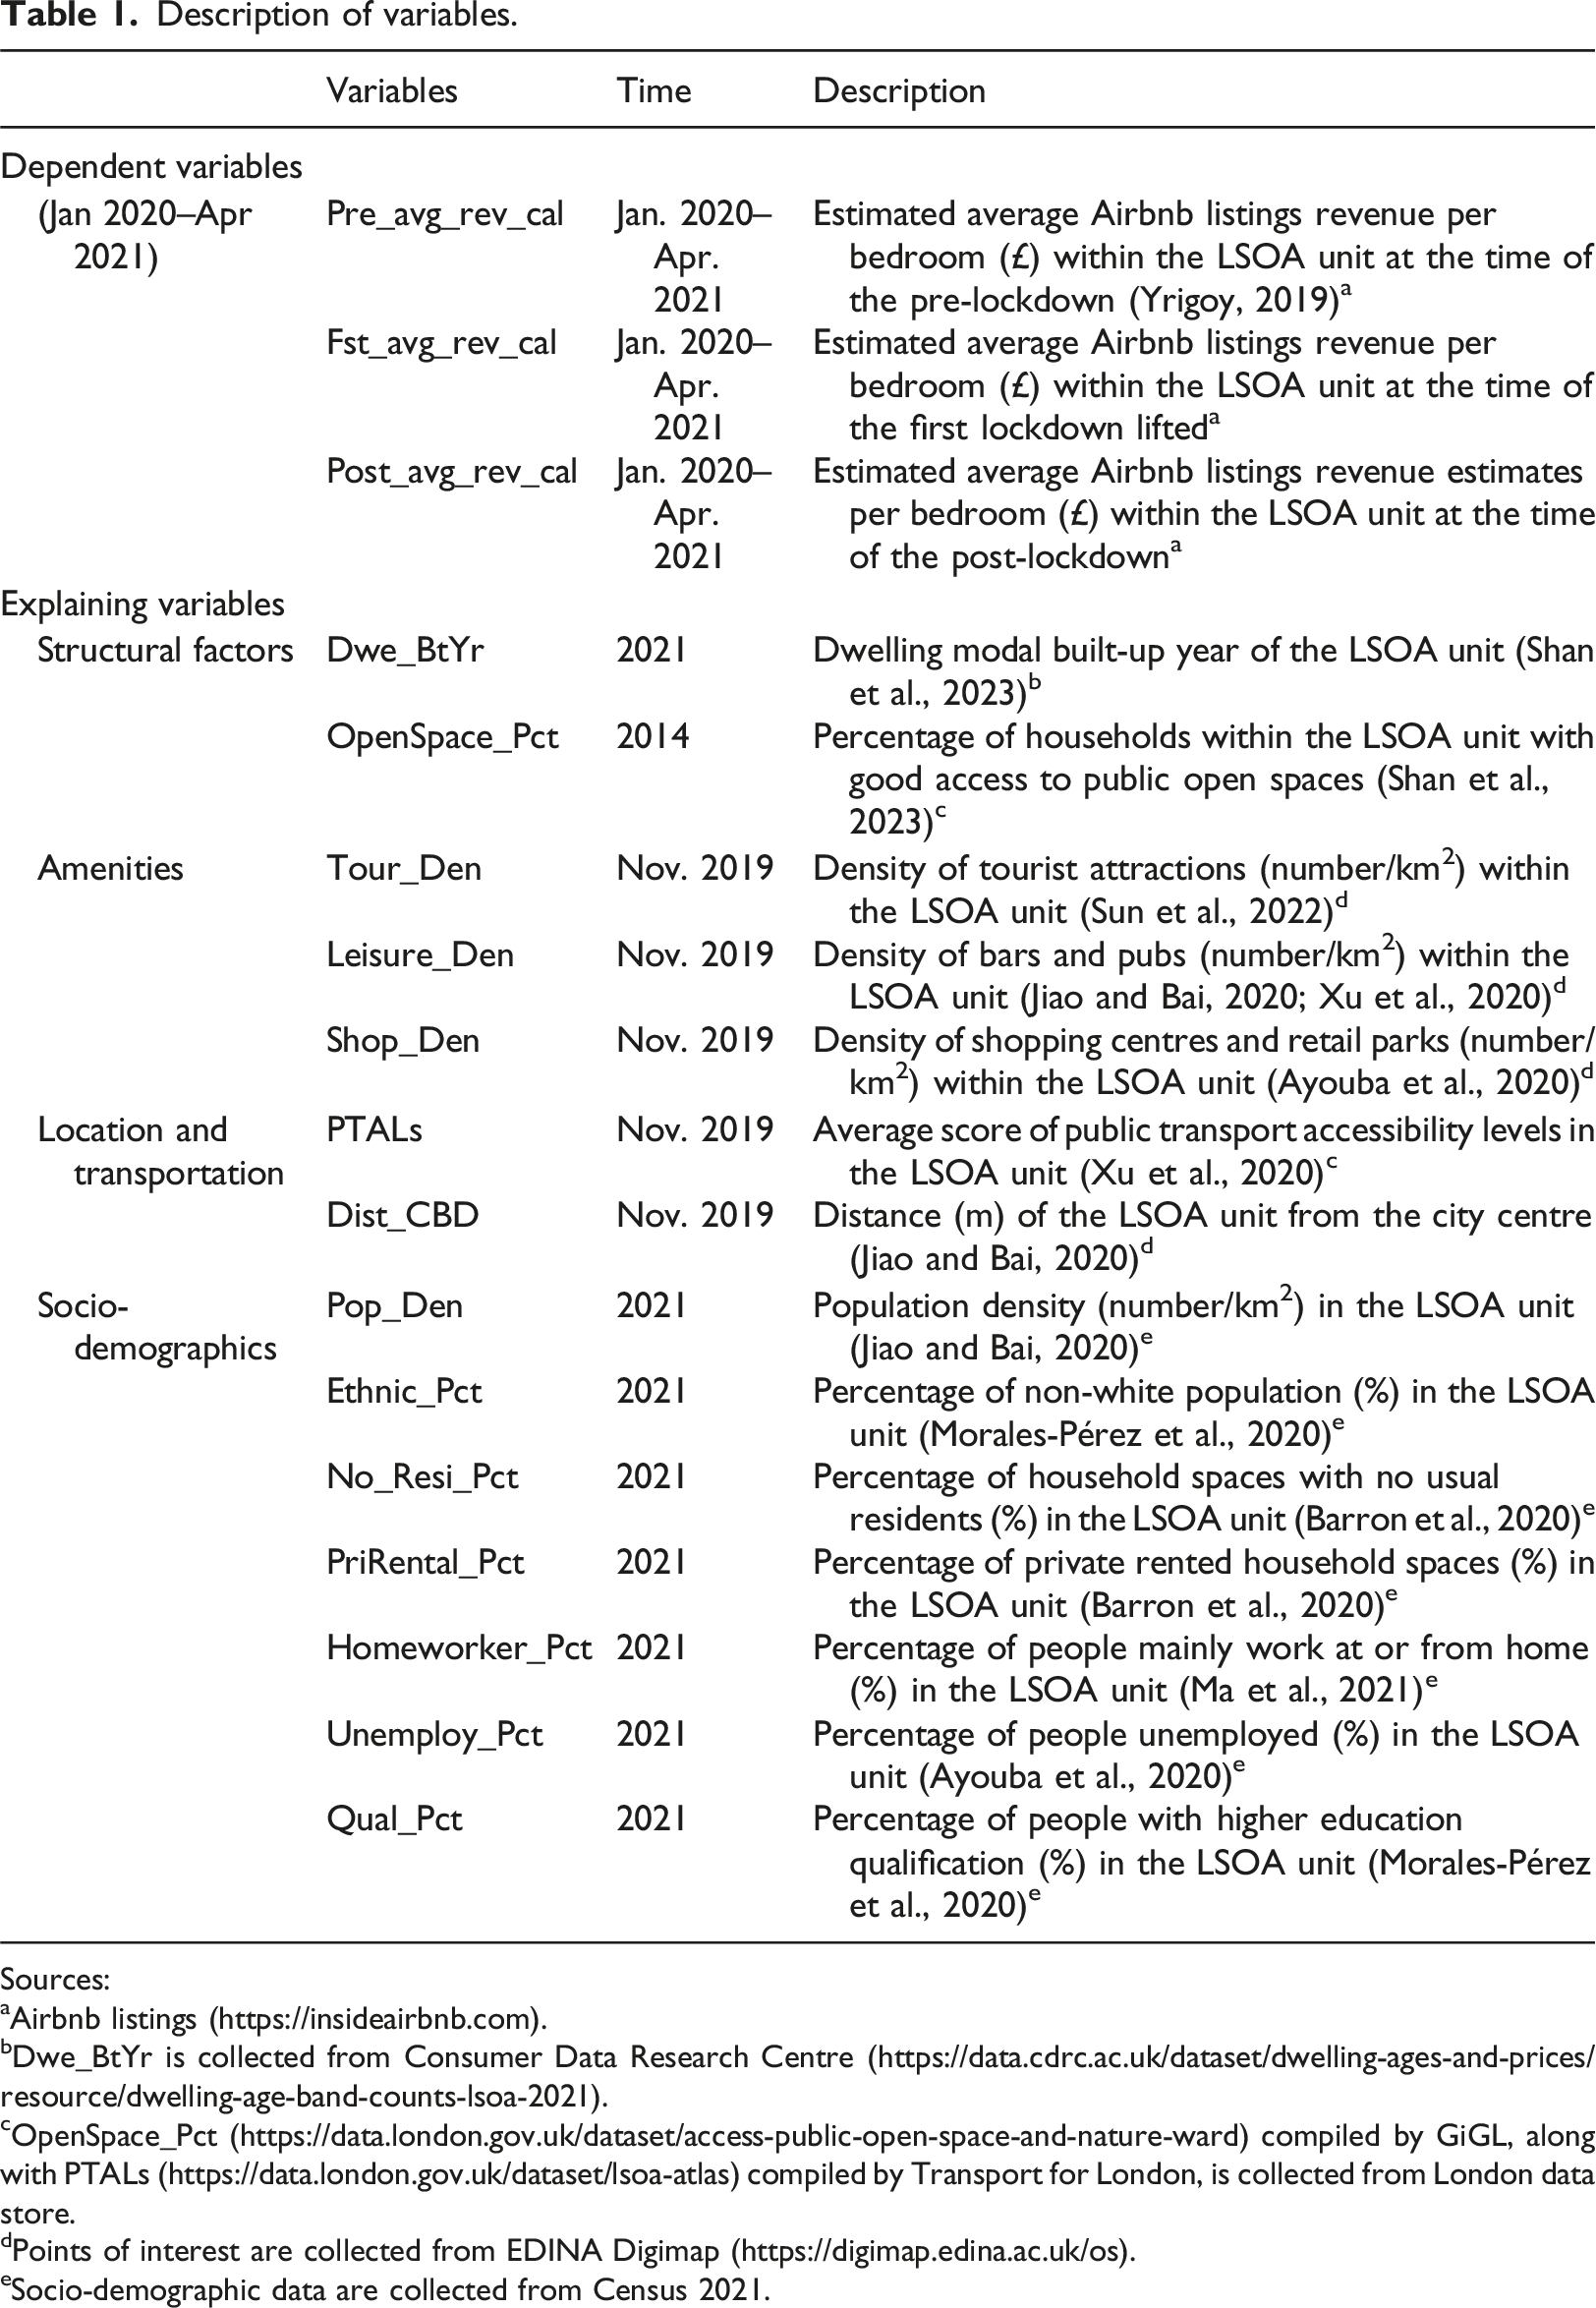
Sources:
aAirbnb listings (https://insideairbnb.com).
bDwe_BtYr is collected from Consumer Data Research Centre (https://data.cdrc.ac.uk/dataset/dwelling-ages-and-prices/resource/dwelling-age-band-counts-lsoa-2021).
cOpenSpace_Pct (https://data.london.gov.uk/dataset/access-public-open-space-and-nature-ward) compiled by GiGL, along with PTALs (https://data.london.gov.uk/dataset/lsoa-atlas) compiled by Transport for London, is collected from London data store.
dPoints of interest are collected from EDINA Digimap (https://digimap.edina.ac.uk/os).
eSocio-demographic data are collected from Census 2021.
Finally, bivariate Local Indicators of Spatial Association (LISA) were employed to explore the relationship between Airbnb revenue and neighbourhood deprivation. Bivariate LISA is applied to identify spatial patterns and spillovers, focussing on the relationship between SLM residuals and IMD scores across neighbourhoods. Unlike univariate LISA, bivariate LISA does not account for in-situ correlation within the same unit (Tao and Thill, 2020) but is helpful in identifying where Airbnb revenues and deprivation scores are spatially correlated for nearby neighbourhood units, where spatial spillovers have the potential to deepen housing inequalities (see Rae, 2009).
Spatial and temporal trends in Airbnb during the COVID-19 pandemic in Greater London
Airbnb listings across the five ‘sub-regions’ defined in the London Plan (London City Hall, 2016) revealed notable volatility during the pandemic. The number of listings in all sub-regions of Greater London showed a downward trend. Although the super-host designation 3 is awarded to only about 18% of hosts, there was a significant change in the proportion of super-hosts during the pandemic. The Airbnb market in London is primarily comprised of single-listing hosts, but multi-listing hosts,4 who are often more professionally oriented (see Deboosere et al., 2019), account for around 44% of all listings in the city. As in other cities internationally, Airbnb in London has evolved with a degree of professionalisation (Gil and Sequera, 2020).
During the early stages of the pandemic (January–March 2020), listings remained stable, with a slight increase in central London (Figure 1). However, the proportion of super-hosts decreased in all sub-regions except the East, while multi-listing hosts saw a modest rise in the Central and West sub-regions but decreased in the South and East. The first lockdown (March–June 2020) saw a significant decline in listings in Central, East, and West London, while other parts remained relatively stable. The increased proportion of super-host listings suggests a commitment to maintaining their business or reputation, while non-super-hosts or multi-listing hosts showed more concern about the deepening crisis. Changes in the number of Airbnb listings and hosts during the spread of COVID-19 in sub-regions of Greater London.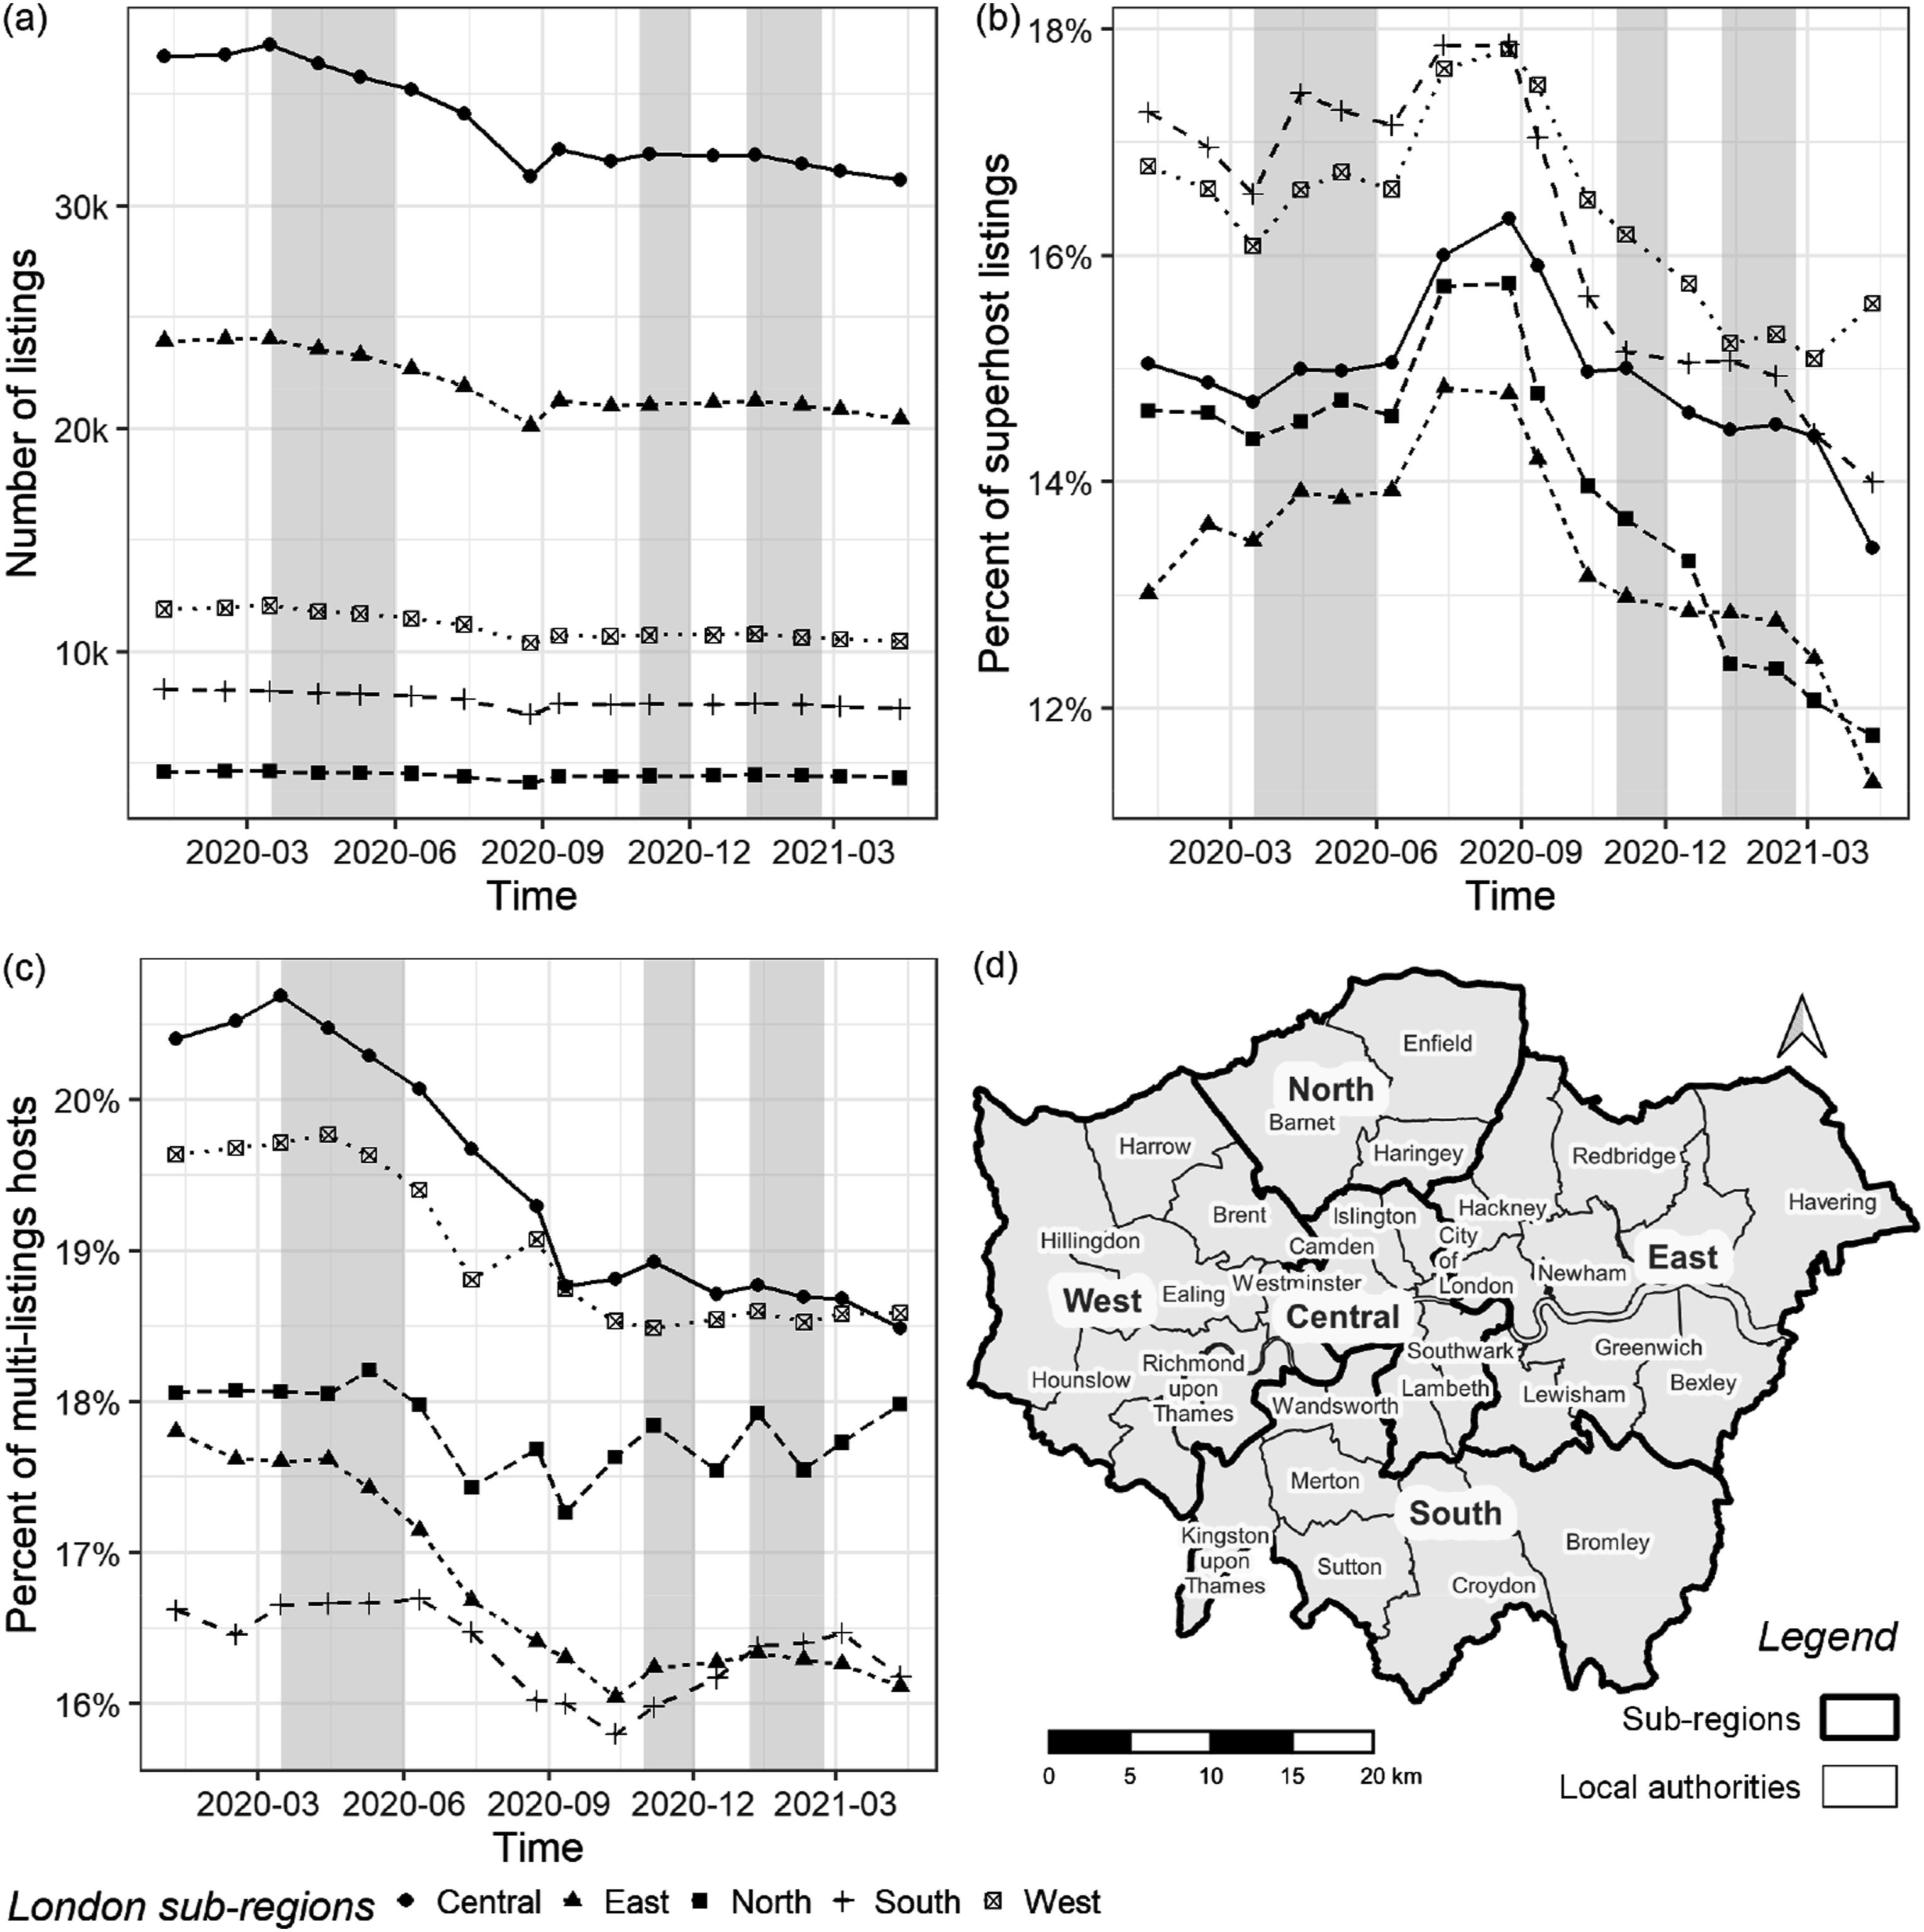
Following the easing of the initial lockdown, all regions saw a further decline in listings between June and October 2020, with new government restrictions on accommodation section affecting both professional and amateur hosts. The second lockdown, announced on October 31, did not result in a significant shift in listings across Greater London’s sub-regions. Hosts adopted a ‘wait-and-see’ strategy, maintaining a sustained pattern of listings. The proportion of multi-listing hosts showed minor recovery signs when the lockdown was briefly lifted.
The third lockdown, implemented in December 2020 due to the Delta variant’s rapid spread, had a diminished impact compared to the first lockdown. Central and East London, areas with high Airbnb stocks, saw a decrease in multi-listing hosts, while it was less pronounced in South and North London, which rebounded close to its initial level following the third lockdown. Meanwhile, there was a significant decline in super-hosts across most regions, except for the West where the proportion of professionalisation remained high.
Spatial patterns of Airbnb revenue during COVID-19 pandemic – a neighbourhood perspective
In the pre-lockdown period, high Airbnb revenue neighbourhoods were concentrated in areas with above-average housing costs and incomes such as Westminster and Chelsea in Central London and surrounding regions known for their commercial and tourist appeal (Supplemental Material Figure S1). However, as the first lockdown lifted, these inner-city areas experienced a decline in listings. Neighbourhoods with previously high yields, such as Croydon, Bromley, and Richmond-upon-Thames, exhibited a decline in revenue, reflecting the lockdown’s impact on tourism and the demand for short-term rentals. In contrast, Havering and Bexley in East London, which had fewer Airbnb listings at the pandemic’s outset, experienced less impact.
In the post-lockdown period, the spatial distribution of Airbnb revenue resembled earlier periods, with a recovery in high-yielding neighbourhoods like Barnet and Richmond-upon-Thames. There was also a trend from high-yielding neighbourhoods dispersing to suburban areas. The impact of the second and third lockdowns on the Airbnb revenue recovery trend appeared to diminish, likely due to varied spatial impacts on lodging location demand.
Despite some revenue suppression, the general trend between the pre-pandemic and post-pandemic periods was towards stability or growth in Airbnb number and revenue levels across Greater London (Supplemental Material Table S1). Many neighbourhoods with established Airbnb concentrations before the pandemic remained dominant in the post-pandemic period. This suggests that while the Airbnb market was disrupted by the pandemic, it remained entrenched, especially in Inner London.
Modelling neighbourhood characteristics and Airbnb revenue during the COVID-19 pandemic
The final dataset contains monthly Airbnb estimated revenue per bedroom and various predictors for the 4835 LSOAs in Greater London, covering the pre-lockdown, first lockdown lifted, and post-lockdown periods. Due to multicollinearity concerns, PriRental_Pct, and Qual_Pct were excluded from the final models (Supplemental Material Table S2).
The global Moran’s I test reveals spatial autocorrelation in all three time periods. As shown in Supplemental Material Table S3, all four Lagrange multipliers display significant effects, indicating spatial autocorrelation in both the dependent variable and the error term of the OLS regression, supporting the adoption of SLM and SEM models to account for spatial dependency.
Results of regression for estimated average monthly revenue per bedroom over three periods of the pandemic.
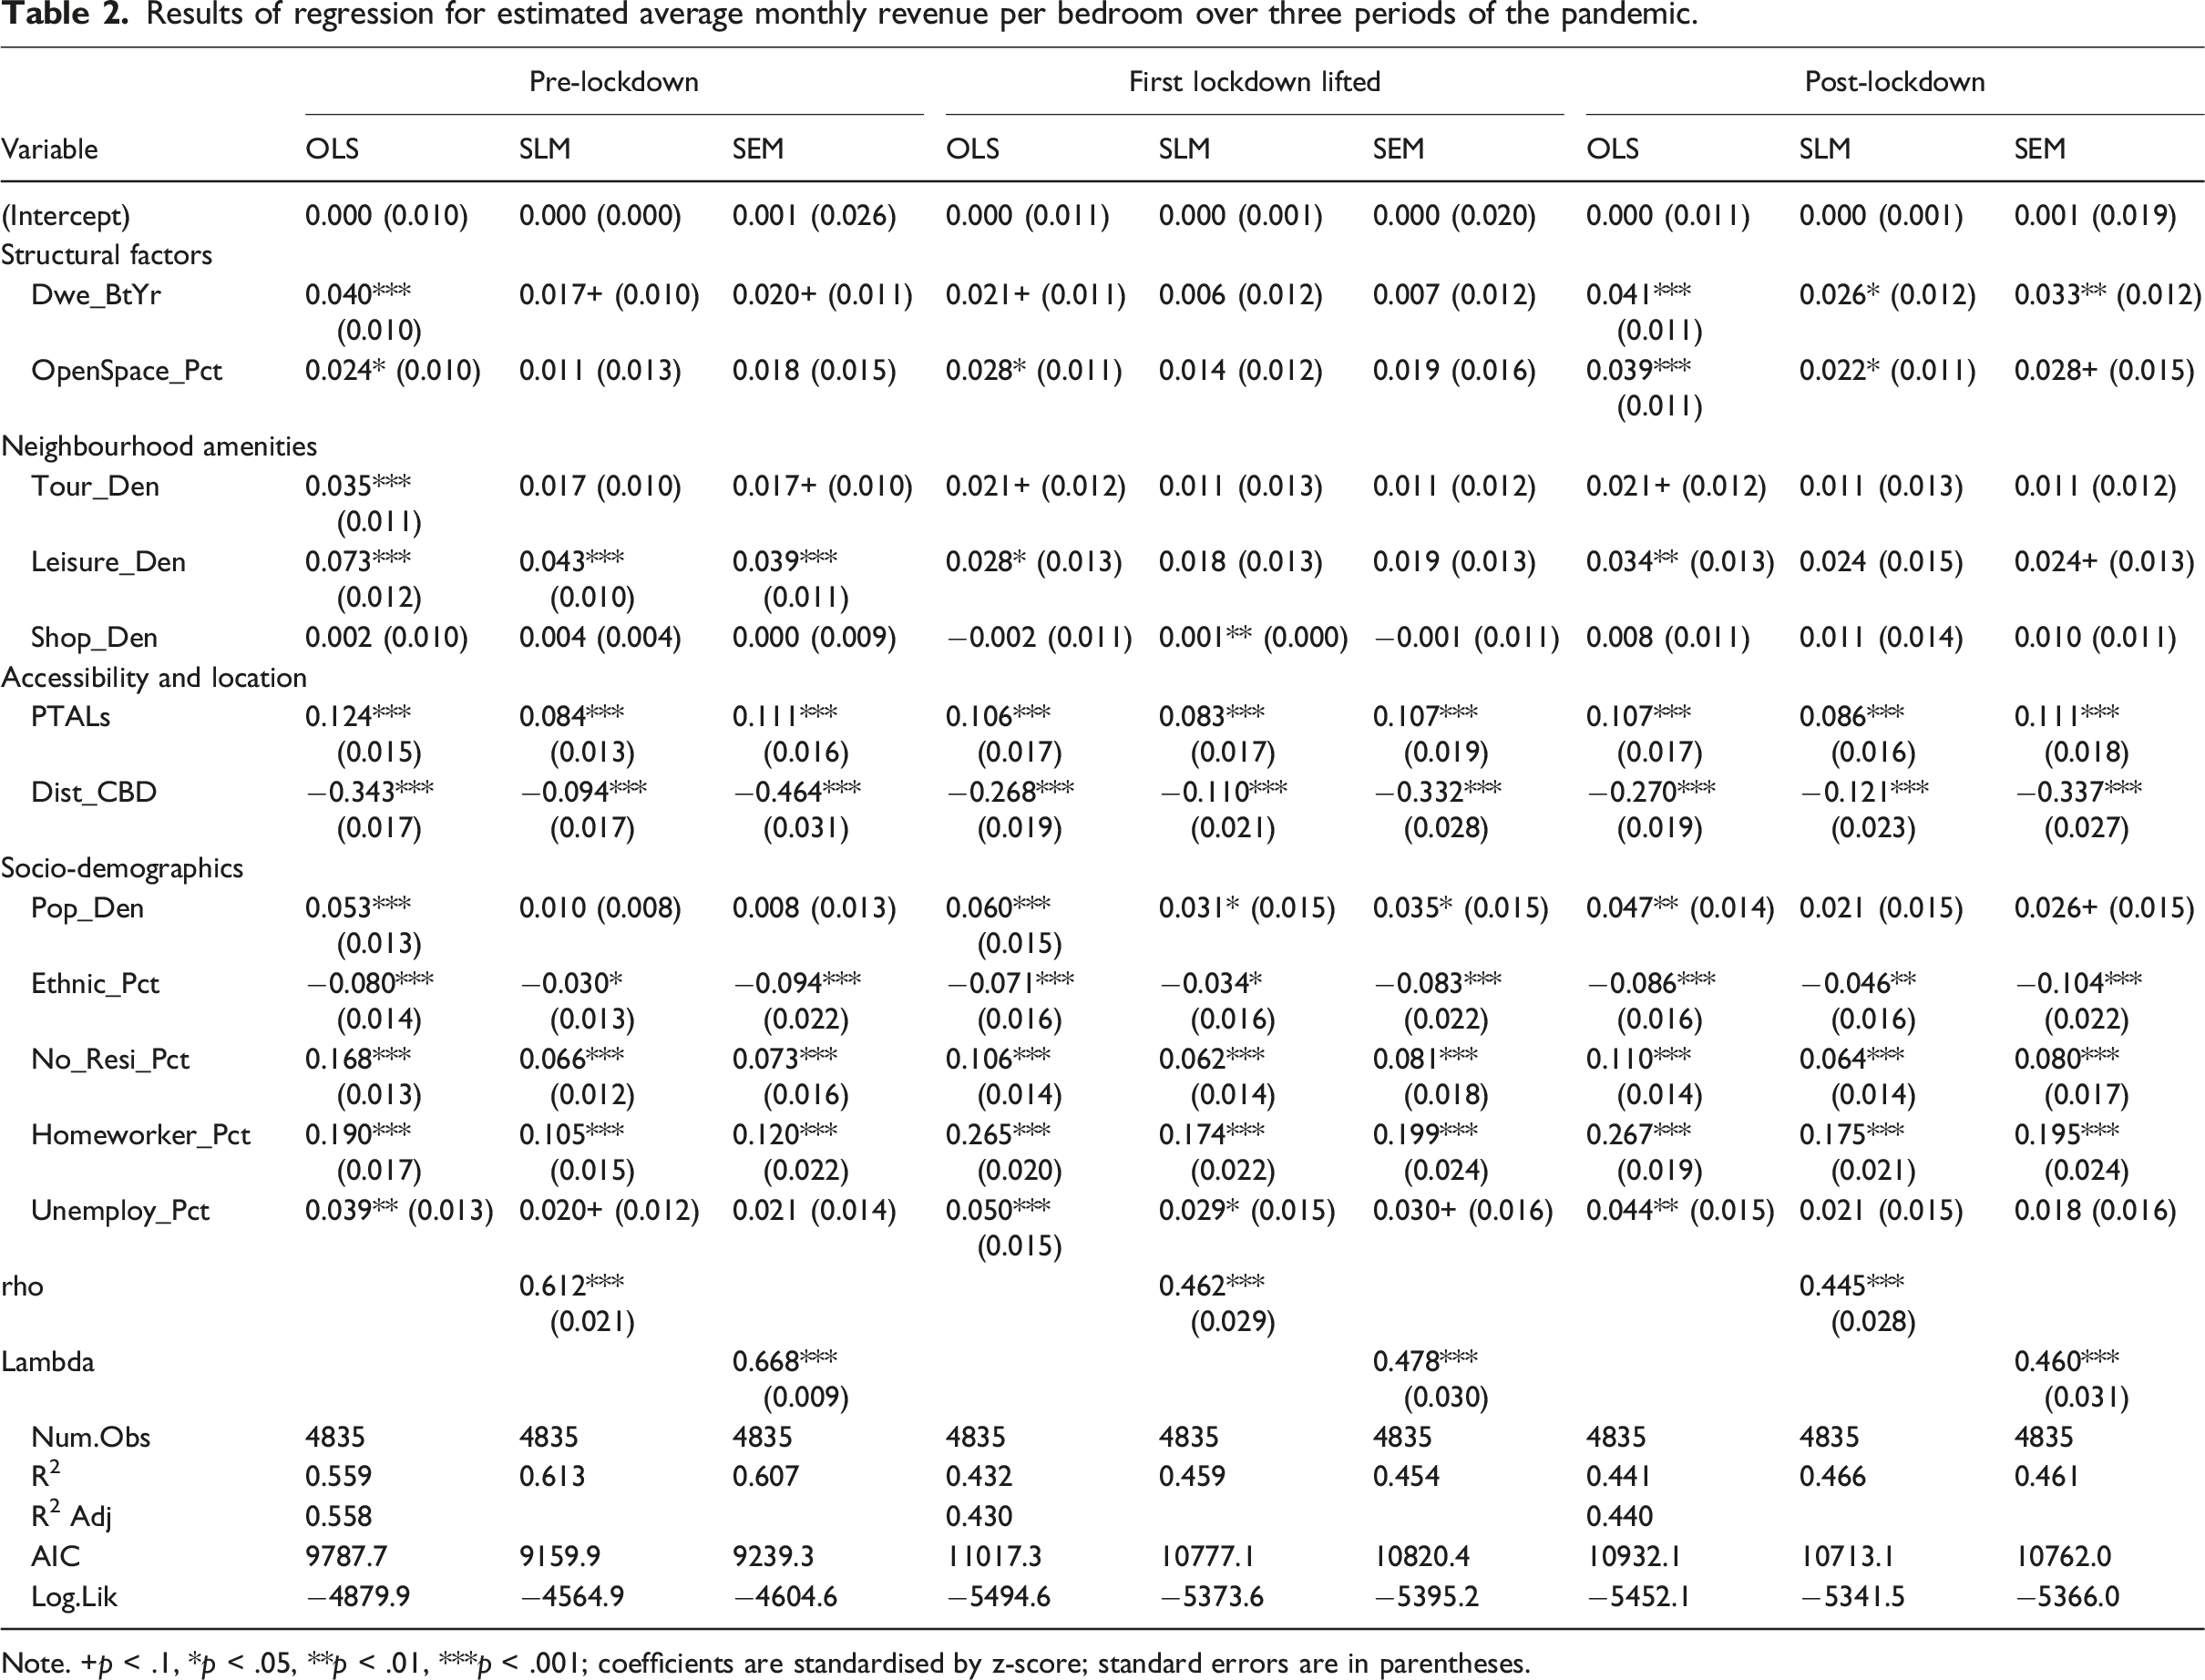
Note. +p < .1, *p < .05, **p < .01, ***p < .001; coefficients are standardised by z-score; standard errors are in parentheses.
Among the factors influencing Airbnb revenues, neighbourhood structural, amenities, and socio-demographics exhibit significant differences, while location variables perform consistently across models and time periods. The sign of the coefficients estimated by OLS is mostly consistent with SLM and SEM, but the magnitude varies, supporting the observation of autocorrelated impacts of Airbnb listings revenue and the error term in surrounding neighbourhoods during different pandemic periods.
Prior to the first lockdown, neighbourhoods with a higher concentration of recently constructed properties (SLM: β = 0.017, p < .1), such as much of central London, tended to capture more gains than those with older dwellings, while public spaces had a non-significant association with estimated Airbnb revenue in SLM (β = 0.011, p > .1). Pub density had a significant association (SLM: β = 0.043, p < .001), but tourist attractions (OLS: β = 0.035, p < .001; SLM: β = 0.017, p > .1; SEM: β = 0.017, p < .1) and retail shop density (SLM: β = 0.004, p > .1) were not significant in spatial models. Tourist attractions had a consistent spatial distribution with estimated Airbnb revenue, but this is confounded by the spatially dependent effects of surrounding short-term rental activities.
Both transport accessibility (SLM: β = 0.084, p < .001) and location (SLM: β = −0.094, p < .001) factors exhibit a significant positive association with revenue estimates (also see Deboosere et al., 2019). For socio-demographic factors, population density (OLS: β = 0.053, p < .001; SLM: β = 0.010, p > .1; SEM: β = 0.008, p > .1) and unemployment rate (OLS: β = 0.039, p < .01; SLM: β = 0.020, p < .1; SEM: β = 0.021, p > .1) were positively related to estimated Airbnb revenue in OLS, but the coefficients were no longer significant after controlling for spatial interactions.
The three models consistently demonstrate that the proportion of white populations (OLS: β = −0.080, p < .001; SLM: β = −0.030, p < .05; SEM: β = −0.094, p < .001), the proportion of no-resident households (OLS: β = 0.168, p < .001; SLM: β = 0.066, p < .001; SEM: β = 0.073, p < .001), and the percent of people working from home (OLS: β = 0.190, p < .001; SLM: β = 0.105, p < .001; SEM: β = 0.120, p < .001) had a particularly positive and significant relation to estimated Airbnb revenue, indicating the crucial role of these socio-demographic characteristics in shaping the Airbnb market.
After the first lockdown was lifted, the positive associations of leisure facilities (SLM: β = 0.018, p > .1) declined significantly, suggesting the significant impact on short-term rental activities near leisure sites. In contrast, the impact of retail shops became lower but more significant (SLM: β = 0.001, p < .01), suggesting people needed good access to retail services right after the first lockdown. The impact of the proportion of home workers (SLM: β = 0.174, p < .001), non-white population (SLM: β = −0.034, p < .05), no-resident households (SLM: β = 0.062, p < .001), and the unemployed (SLM: β = 0.029, p < .05) in the LSOA remained largely consistent with those before the first lockdown. However, the impact of neighbourhood population density (SLM: β = 0.031, p < .05) became significant, indicating that revenue estimates decreased in less densely populated areas, highlighting the spatially heterogeneous effects of the lockdown on the Airbnb market.
After the third lockdown, there were notable changes. The impacts of the two structural factors strengthened. All three amenity factors were non-significant with host earnings, indicating that short-term rentals around leisure and retail areas had not significantly rebounded after the third lockdown. The marginal association of proximity to the centre (SLM: β = −0.121, p < .001) and public transport accessibility (SLM: β = 0.086, p < .001) maintained their positive significant effects on estimated revenue in all three periods. In terms of socio-demographic factors, the magnitude of the effect of population density (SLM: β = 0.021, p > .1) and the neighbourhood unemployment rate (SLM: β = 0.021, p > .1) returned to their pre-pandemic non-significance. Notably, the revenue gap widened between LSOAs with high and low proportions of non-white populations (SLM: β = −0.046, p < .01). This confirms that in the post-pandemic period, short-term rentals remained stubbornly entrenched, underpinned by structural and spatial characteristics and associations.
Given the relatively robust estimation of the SLM, we now turn to considering its spatial effects (Supplemental Material Table S4). Direct effect estimates align closely with Table 1 coefficients, while indirect effects capture spatial spillovers, with their sum representing the total effect. Location factors had the most significant direct and indirect effects. However, we find that spatial spillovers decreased after the first lockdown and did not rebound after the third. Areas with a higher proportion of no usual resident households or home-based workers also saw a drop in Airbnb revenue spillovers post-first lockdown. Similarly, spillovers around tourist attractions (from 0.026 to 0.009) and leisure facilities (from 0.065 to 0.015) declined, with little recovery. As lockdowns eased, spillovers became more pronounced in densely populated, areas with higher concentrations of open spaces. Here the spatial econometrics reveal a shift in Airbnb externalities from traditional transportation nodes to environmentally favourable neighbourhoods across lockdown phases.
Neighbourhood deprivation and patterns of Airbnb
The previous analysis reveals a notable pattern of widening revenue disparities in the aftermath of COVID-19. Given that the spatial clustering of peer-to-peer accommodation has the potential to deepen housing insecurity (Rabiei-Dastjerdi et al., 2022), we turn to examining the relationship between unexplained Airbnb revenue estimates – the SLM residuals – and the IMD, highlighting clear between-group heterogeneity.
The distribution of residuals in Figure 2 indicates a universal attenuation in unexplained Airbnb revenue estimates across IMD quintiles following lockdown measures, coupled with an elevated interquartile range particularly in less deprived clusters. This reflects a broadening disparity within each quintile, as the spread of residuals suggests varying degrees of model misfit across neighbourhoods. In less deprived areas, the elevated IQR highlights the growing differences in how Airbnb revenues are predicted versus actual revenues, pointing to increased heterogeneity in predicted outcomes within these areas. The boxplots for residuals of pre-lockdown, after first lockdown lifted, and post-lockdown period spatial lag models in each IMD quintile group and IMD score LISA category.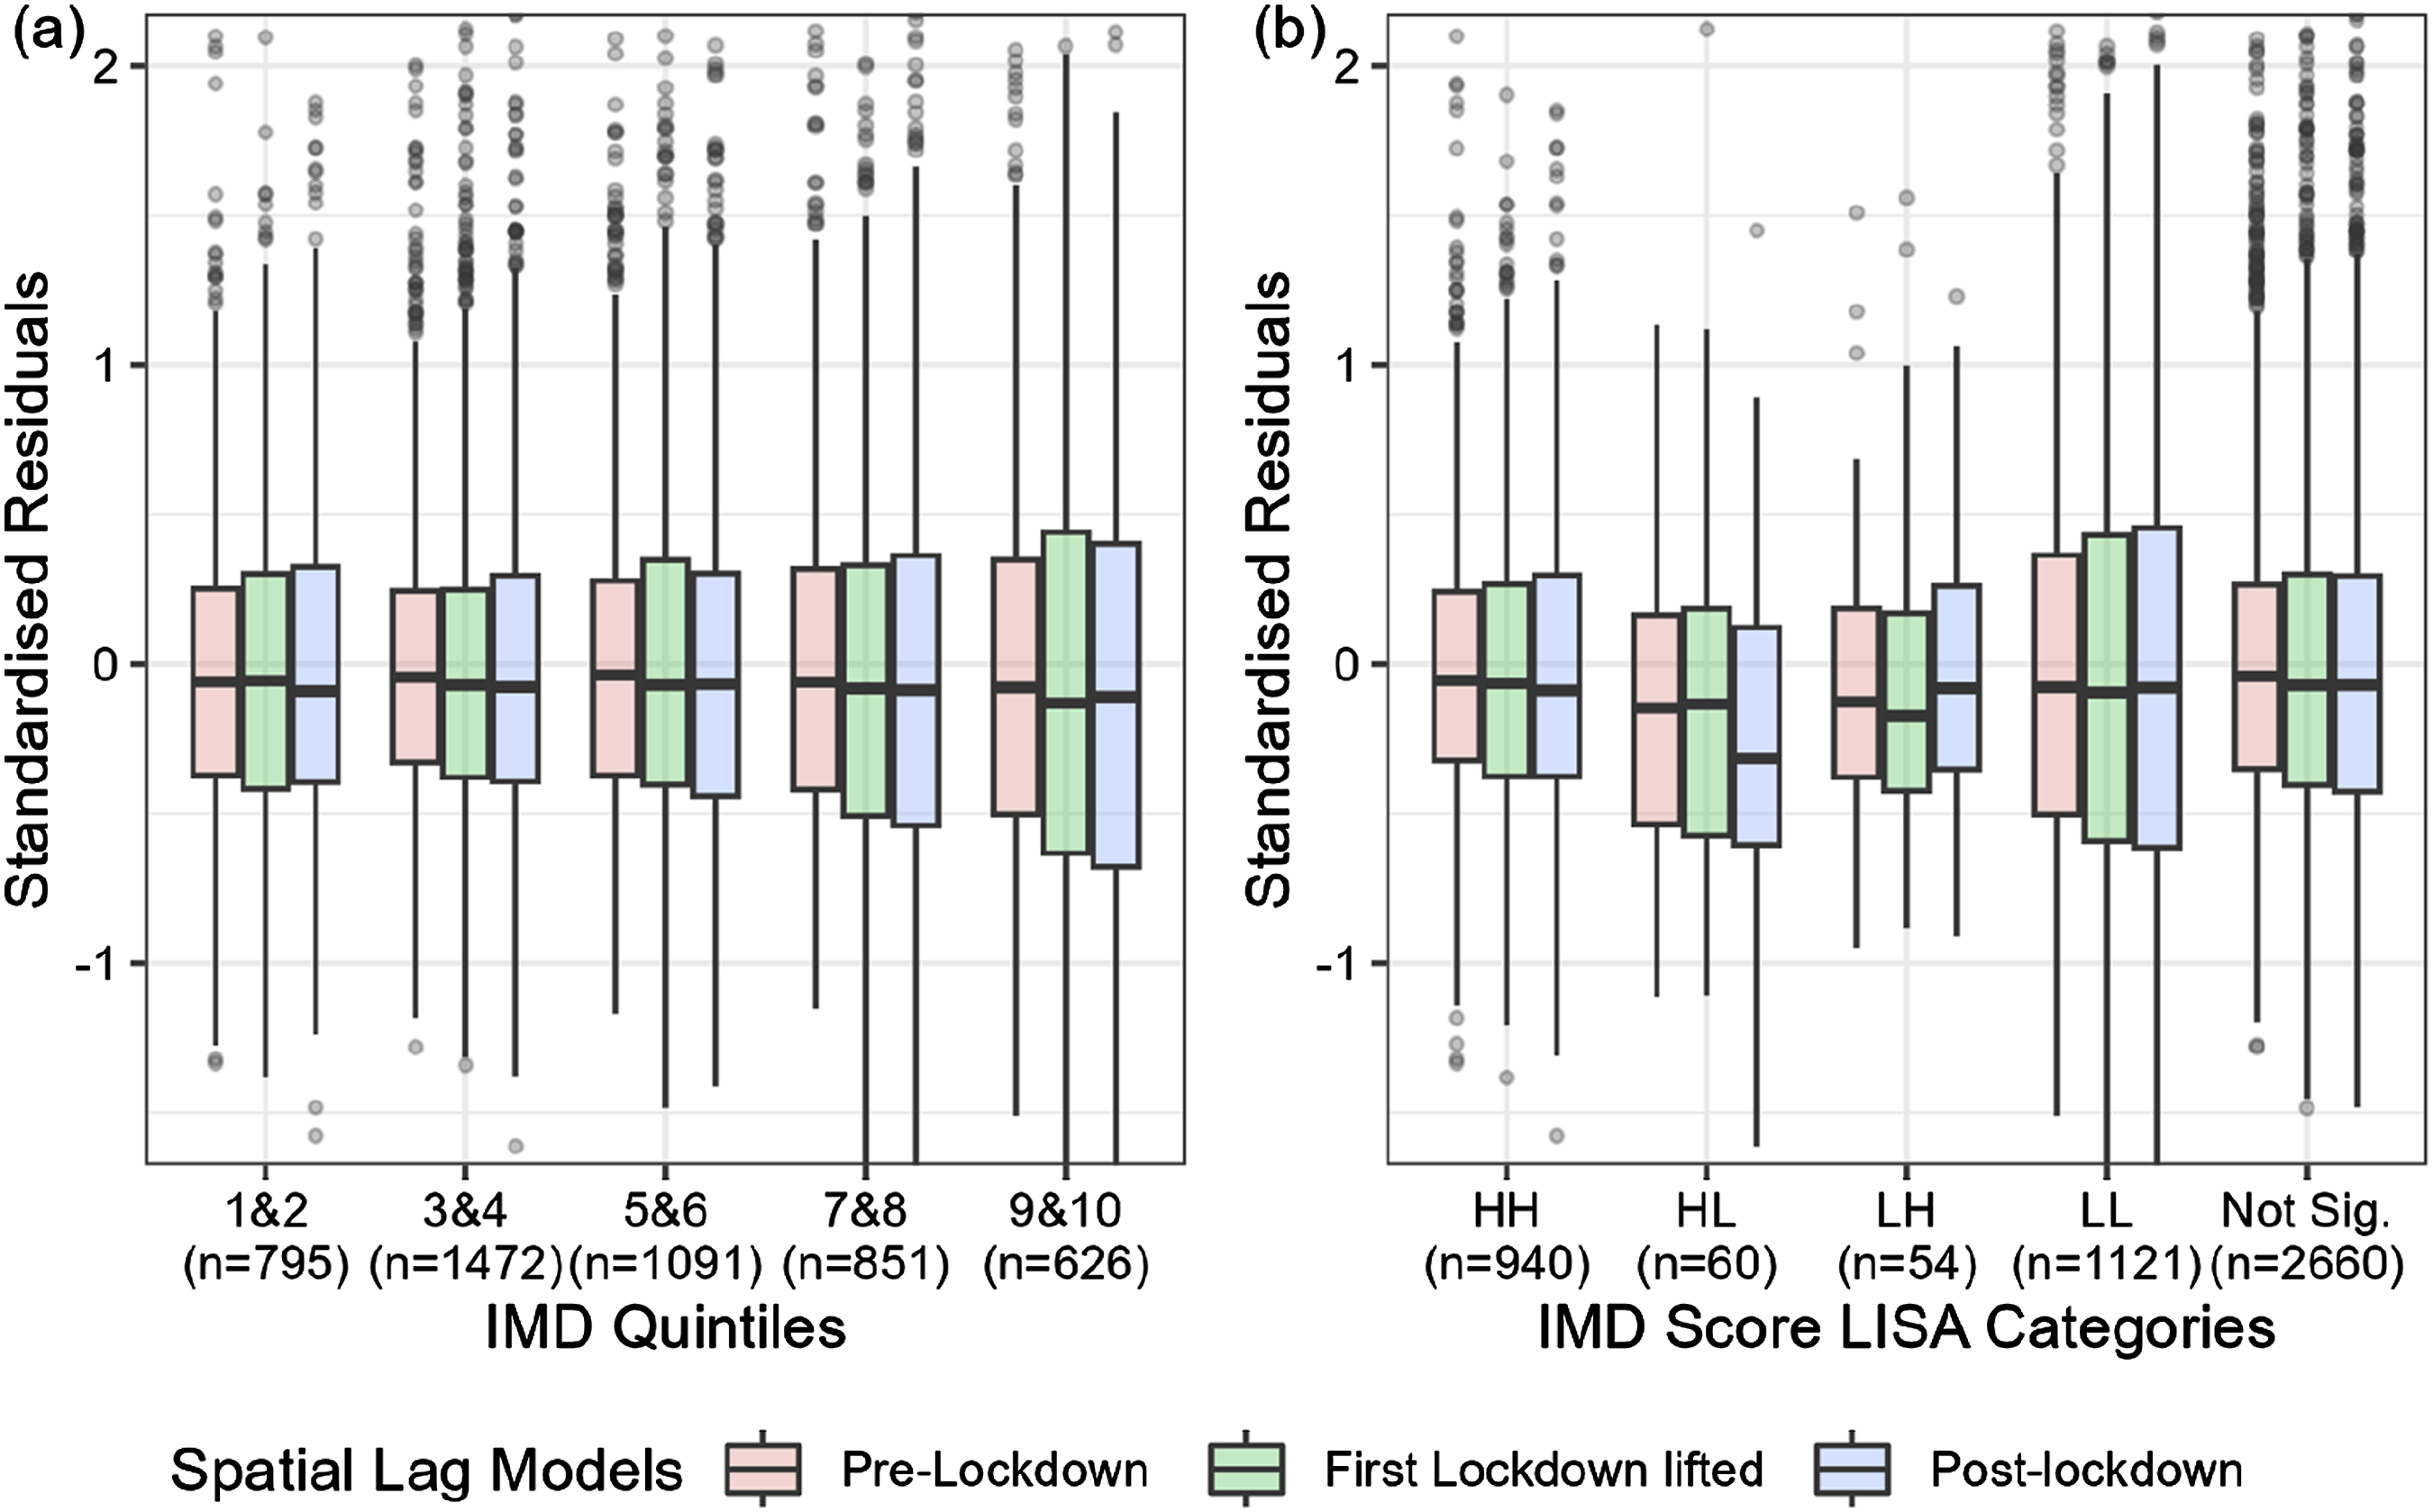
In contrast, the residual distribution of more deprived groups experienced a consistent, albeit minor, reduction across three periods, with the decline being more pronounced in areas surrounded by less deprived neighbourhoods. Despite greater volatility, less deprived areas appear to have recovered more robustly, with low residual-low deprivation (L-L) clusters outperforming low residual-high deprivation (L-H) clusters. In contrast, more deprived areas suffered from a sequential decrease, suggesting heightened vulnerability to lockdown policies and potential exposure to gentrifying tendencies (see also Deboosere et al., 2019).
The bivariate LISA results reveal that both H-H (high deprivation, high Airbnb revenue) and L-H (low deprivation, high Airbnb revenue) clusters are entrenched in the central and western parts of London, reflective of a sustained concentration of Airbnb across the three pandemic periods (Figure 3). The analysis underscores how, in our model estimates, areas with higher deprivation have consistently shown underpredictions in Airbnb revenue, while less deprived areas initially saw overpredictions that were corrected downward over time. In an analysis of deprivation and neighbourhood change, Hincks (2017) found that being more deprived increased the odds of a neighbourhood experiencing greater volatility because of short-run shocks. Our findings highlight the heightened volatility and exposure of more deprived neighbourhoods to the impacts of COVID-19, reflected in the more pronounced variation in Airbnb revenues compared to less deprived areas. The bivariate LISA analysis between IMD score and residuals of pre-lockdown, after first lockdown lifted and post-lockdown period spatial lag models with Queen’s first and second order contiguity. (a) Bivariate LISA between IMD score and residuals (pre-lockdown), (b) bivariate LISA between IMD score and residuals with second order contiguity (pre-lockdown), (c) bivariate LISA between IMD score and residuals (first lockdown lifted), (d) bivariate LISA between IMD score and residuals with second order contiguity (first lockdown lifted), (e) bivariate LISA between IMD score and residuals (post-lockdown), and (f) bivariate LISA between IMD score and residuals with second order contiguity (post-lockdown).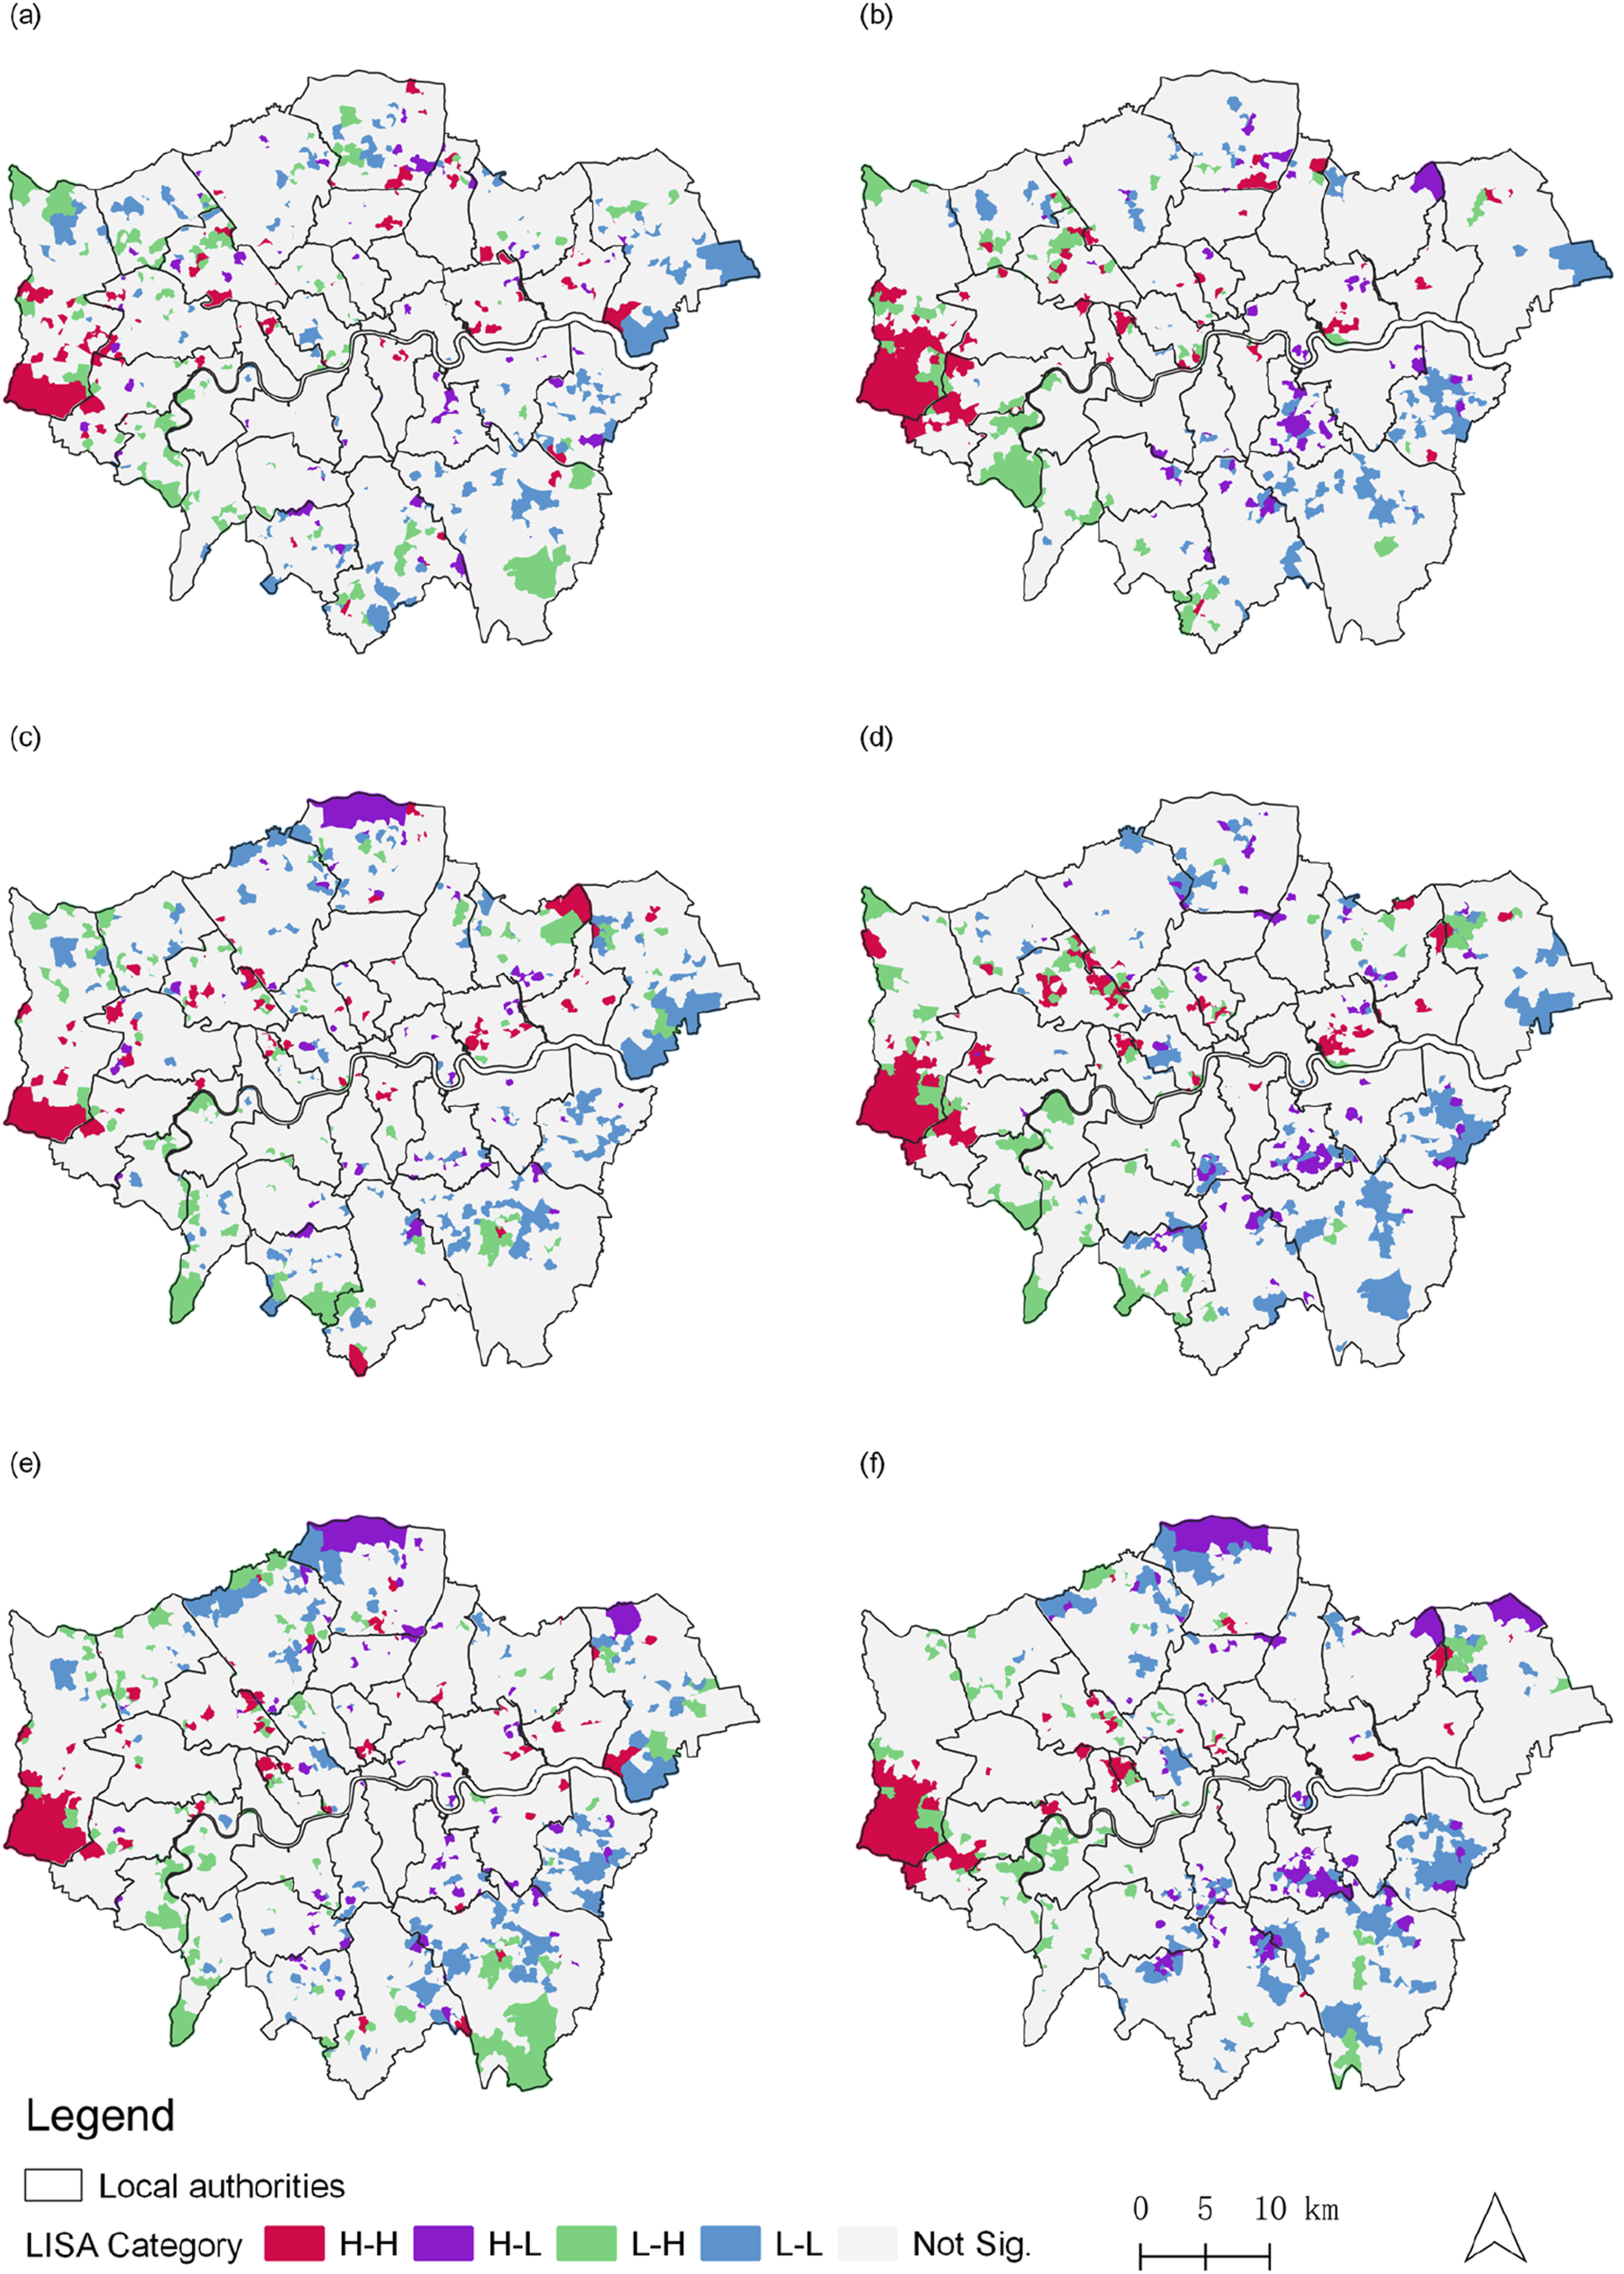
Discussion and conclusion
This paper examines how the Airbnb market in Greater London responded to the COVID-19 pandemic, offering insights into market fluctuations and short-term rental revenue trends. This city-region is recognised for its chronic housing shortage and the popularity of Airbnb due to its status as a major tourist and business travel destination (Todd et al., 2021: 209; Shabrina et al., 2021) provides a compelling case study of the spatial implications of COVID on the short-term rental market.
In relation to the first and second research questions, we find that initially, the first lockdown had a notable impact on Airbnb revenue, with subsequent lockdowns having diminishing effects as the market gradually adjusted to a ‘steady state’. Despite a general decline in Airbnb listings – especially in central London, where supply had increased pre-pandemic (Kourtit et al., 2022) – the overall Airbnb stock remained relatively stable. This stability suggests that Airbnb had become entrenched in central areas facing significant housing supply and neighbourhood challenges (Deboosere et al., 2019; Lima, 2019; Morales-Pérez et al., 2020; Shabrina et al., 2021; Wachsmuth and Weisler, 2018).
Professional hosts, including those with multiple listings and super-hosts, adapted more effectively to the disruptions of the initial lockdown (Dolnicar and Zare, 2020). These hosts seemingly adjusted the pandemic to minimise losses (Llaneza Hesse and Raya Vílchez, 2022). In contrast, single-listing hosts, primarily amateurs, were more inclined to exit the market as the pandemic deepened, highlighting differing responses among host types (Boto-García, 2022; Cocola-Gant et al., 2021; Nhamo et al., 2020). While some hotels struggled with significant operational and financial issues, Airbnb’s adaptability and diverse portfolio positioned it for a quicker recovery, potentially giving it a competitive edge over traditional accommodations.
Here a notable shift occurred during the pandemic from high-yielding neighbourhoods in mature urban centres to suburban areas with access to open spaces (Airbnb, 2022b; Kourtit et al., 2022; Liang et al., 2021). Our analysis reveals that Airbnb revenue estimates and their spatial effects varied based on location, amenities, structural, and socio-demographic characteristics throughout the pandemic. Users consistently preferred areas with convenient public transport and central locations. Neighbourhoods with higher concentrations of home workers, self-employed individuals, white populations, and vacant properties exhibited greater Airbnb revenue, a trend that persisted across lockdown periods but with diminishing spatial spillover effects. Additionally, there was a growing preference for areas with newly constructed properties and public open spaces (Filieri et al., 2023; Sainaghi and Chica-Olmo, 2022).
In terms of the third research question, our bivariate analysis indicates that post-lockdown, variations in revenue estimates widened, especially in less deprived areas and notably in central and western London, revealing a growing gap between predicted and actual revenues. Deprived areas, while consistently experiencing revenue declines, were less likely to recover with the same rapidity as less deprived neighbourhoods, underscoring their heightened vulnerability to volatility and short-term shocks (Hincks, 2017).
Against this context, we identify avenues for further research. First, we do not account for the direct effects of rental unit attributes on revenue levels before, during, and after lockdowns. An alternative hedonic framework may reveal different insights into the effect of the pandemic on Airbnb performance. Secondly, our focus only covers the period from January 2020 to April 2021. Extending this timeframe would enable further insights into the response of the short-term rental market in a longer post-COVID period. Third, the methods employed here could be refined further by adopting local modelling approaches to capture spatial heterogeneity and drawing in new covariates to compensate for omitted variable bias.
Nevertheless, the insights here are valuable in revealing spatial and temporal patterns in the response of the Airbnb market in Greater London to the COVID-19 pandemic. While the shock of COVID-19 served to ‘disrupt the disruptor’ (Dolnicar and Zare, 2020), especially in revenue terms, it did not de-stabilise existing geographies of Airbnb in the capital, particularly in Inner London, where Airbnb remains spatially entrenched and challenges around housing affordability and neighbourhood-level gentrification are acute (Shabrina et al., 2021).
Supplemental Material
Supplemental Material - Airbnb and the COVID-19 pandemic: A geospatial analysis of Greater London
Supplemental Material for Airbnb and the COVID-19 pandemic: A geospatial analysis of Greater London by Nan Wang and Stephen Hincks in Environment and Planning B: Urban Analytics and City Science.
Footnotes
Declaration of conflicting interests
The author(s) declared no potential conflicts of interest with respect to the research, authorship, and/or publication of this article.
Funding
The author(s) received no financial support for the research, authorship, and/or publication of this article.
Data availability statement
Data sharing not applicable to this article as no datasets were generated or analysed during the current study.
Supplemental Material
Supplemental material for this article is available online.
Notes
References
Supplementary Material
Please find the following supplemental material available below.
For Open Access articles published under a Creative Commons License, all supplemental material carries the same license as the article it is associated with.
For non-Open Access articles published, all supplemental material carries a non-exclusive license, and permission requests for re-use of supplemental material or any part of supplemental material shall be sent directly to the copyright owner as specified in the copyright notice associated with the article.