
Abstract
Understanding the intracity heterogeneities in housing market dynamics across microgeographic areas is important but challenging due to infrequent transactions. Unlike traditional methods that use trend-based clustering to improve the accuracy of local housing price and rent indices, we propose a novel hybrid model that combines the state-space model and the Bayesian nonparametric clustering approach to cluster neighbourhoods according to their temporal price volatility. We show that our methods improve the performance of traditional methods by 10-40%, using over 889,428 housing transactions in Singapore between 2006 and 2018. We also demonstrate a practical application of our method – monitoring neighbourhoods’ distinct market reactions to macroeconomic or policy shocks, which has important implications for urban planning and housing investment.
Keywords
Introduction
Housing price dynamics may vary significantly across different small local areas within a city due to numerous latent variables (Guerrieri et al., 2013; Head et al., 2014). Understanding the heterogeneities in housing price dynamics in small areas greatly benefits policy-makers, developers, and housing investors (Lopez Ochoa, 2023), as this knowledge can effectively facilitate their decision-making (Piazzesi et al., 2020). It is common to represent housing price dynamics by using indices estimated by econometric methods (e.g. the hedonic models by Goodman (1978)), but constructing housing price indices in smaller areas is challenging due to less frequent transactions, making it a trade-off between a granular geographic scope and a shorter time interval. Therefore, while most academic studies and industry practitioners have provided housing price indices across cities (Anundsen and Røed Larsen, 2018), there is a technical gap in how to construct high-frequency intracity housing price indices.
A major research direction to close this gap is to identify areas that share similar housing market trends. Then, the shared patterns inferred from other areas can be leveraged in price index construction when transactions in small areas are scarce (Ahlfeldt et al., 2023; Clapp, 2004). For example, spatial autocorrelation (SAR) models incorporate information from surrounding areas, which requires assuming that adjacent areas should show correlations in price trends (Li et al., 2007). There are two shortcomings in such models. First, spatially correlated areas are normally predefined and are based on strong assumptions of systematic urban structure and spatial continuity (Ahlfeldt et al., 2023). Second, only the overall price trends in other areas can be included in the index estimation, which provides limited information on the actual market dynamics within short time intervals (Hu et al., 2022; Kopczewska and Ćwiakowski, 2021).
Unlike these existing models, we relax the assumption of spatial continuity and propose a novel method that clusters areas by their temporal volatility rather than their overall trends. 1 First, the historical volatility of housing prices in an area, relative to overall price trends, has been shown to improve predictions of housing prices by a body of literature on state-space (SS) models (Francke, 2010; Geltner et al., 2020); therefore, it is reasonable to hypothesize that historical temporal volatility is also be effective in clustering submarkets in a city (Ren et al., 2017). Second, we adopt a nonparametric approach to find the clusters. Specifically, we incorporate the Bayesian nonparametric clustering algorithm (BNC) into state-space models; this approach allows it to generate optimal clusters based on each area’s temporal volatility without predefining the number of clusters or requiring the areas in a cluster to be adjacent in space. Our method (denoted as the ‘SS-BNC’ method) is similar to that of Ren et al. (2017), but we extend their work to multiple housing market sectors, aiming to investigate the application of the method in understanding intracity housing market dynamics.
By using over 889,428 sales and rental transaction records in both public and private housing markets in Singapore between 2006 and 2018, we demonstrate the advantage of our method in capturing local housing price (or rent) dynamics at the neighbourhood-month level. 2 Our method significantly improves the accuracy of neighbourhood housing price predictions by 10-40% compared to those of standard hedonic models, SAR models, and SS models. Moreover, we illustrate how our methodology can be applied to assist the decision-making of policy-makers and investors in practice. Under economic shocks or policy interventions, our model reveals that the boom-bust cycles of neighbourhoods differ in terms of both size and timing and cannot be investigated using the traditional housing pricing index aggregated at the city level.
Our study provides two contributions to the literature. First, we extend the implementation of methodological design in Ren et al. (2017) and introduce a novel temporal volatility-based clustering approach that can be applied to construct a housing price index of microgeographic scales within cities. We demonstrate that improvement of this model, compared to traditional methods (Case and Shiller, 1987; Clapp, 2004; Francke, 2010; Zhu et al., 2022), is economically significant for the analysis of complex metropolitan areas such as Singapore. Second, we propose a novel application of high-frequency housing price indices for small geographic areas. We show that our model assists in monitoring how intracity housing markets react to economic and policy shocks distinctively. This method also satisfies the demand for housing price/rent indices at the microgeographic scale in theoretical model simulations (Ahlfeldt et al., 2023). We encourage future researchers to adopt the model and to explore the underlying forces driving the heterogeneities in local housing dynamic patterns.
Literature review
Spatial variation exists in and heavily influences intracity housing price movements, which are caused by heterogeneous factors such as residential amenities, land supply, and transportation infrastructure (Ahlfeldt et al., 2015; Beracha et al., 2018). For example, Guerrieri et al. (2013) demonstrated significant differences in housing price growth across neighbourhoods within a city during citywide housing price booms. In contrast, Liu et al. (2016) found that there are also large variations in housing price volatility within a city when a housing bubble busts. Zhu et al. (2022) showed that even if the housing market is not experiencing extreme booms or busts, local prices can vary significantly in both their levels and changes. Therefore, due to the existence of large intracity heterogeneities, investigating local housing price dynamics across small areas within a city is important for investors, developers, and policy-makers (Piazzesi et al., 2020).
Housing price dynamics are normally captured and studied by constructing price indices. The common methods adopted in housing price index construction include the hedonic index method and the repeat-sales index method. The hedonic index method represents price trends after adjusting for the observed property features (e.g. floor area) of all transactions in the market (Goodman, 1978), but omitted property features often cause estimation bias. In contrast, the repeat-sales index method mitigates the impacts of omitted hedonic variables by focussing on price changes in repeat sales of the same dwelling at different times (Case and Shiller, 1987). However, the subsample of repeat sales may not fully represent the dynamics of the entire market, and the method cannot capture physical changes (e.g. renovations) in the same dwelling (Wheaton and Torto, 1994). Furthermore, both methods become less accurate when the geographic area is small because they require a relatively large sample of transactions (Lopez Ochoa, 2023). Therefore, methodology wise, it is challenging to construct housing price indices and to study price dynamics at the small neighbourhood level within a city (Ahlfeldt et al., 2023).
To address this challenge, past researchers have revised traditional hedonic or repeat-sales methods as spatial (or spatiotemporal) models when studying the housing price dynamics of small areas within a city (Ahlfeldt et al., 2023; Zhu et al., 2022). Compared to traditional methods, spatial models represent information from transactions in other areas as supplementary information (Clapp, 2004; Zhu et al., 2022), which enables us to construct indices of small areas even if the actual transaction numbers within the areas are scarce (Sun et al., 2005; Tu et al., 2007). Nevertheless, spatial models suffer from two critical drawbacks. First, we must make strong assumptions on which other areas are relevant in the estimation. For instance, the SAR model (one of the most adopted spatial models) assumes spatial continuity in housing price dynamics (Li et al., 2007). In other words, areas closer to a site are assumed to present more similar price dynamics than are areas farther away. This assumption has been challenged in various empirical and theoretical studies (Ahlfeldt et al., 2015; Kleinman et al., 2023). Second, the spatial models can only capture the overall price trends from other areas and supplement them to the index construction; this approach provides insufficient information to represent the detailed market dynamics over short intervals (Francke, 2010).
In this study, we propose a new methodology (the SS-BNC model) that combines two technical advancements to address the two shortcomings of previous spatial models. First, we propose adopting the state-space (SS) model to extract supplementary information from other areas. Unlike the existing spatial models that capture the overall trends only over a certain period, the SS model gathers information on temporal volatility at each time point (Geltner et al., 2020). Therefore, it provides more granular information and is expected to improve prediction accuracy (Calainho et al., 2022). Second, the BNC method can be implemented to determine which areas are most relevant in the estimation. Therefore, no preceding assumptions by humans are needed, and the areas from which the model extracts supplementary information do not need to be adjacent (Chi et al., 2021; Wang and Biljecki, 2022).
Notably, unsupervised clustering methods have been widely used in analyzing intracity housing price dynamics (Hu et al., 2022; Kopczewska and Ćwiakowski, 2021). These studies are fundamentally different from our study in terms of both the methodology and the objective. These studies work in two steps, first by using traditional (hedonic, repeat sales, or spatial/spatiotemporal) methods to obtain price indices of small areas and then by finding clusters that share similar patterns in these indices. In contrast, we use a joint-estimation model that finds clusters of neighbourhoods that share similar temporal price volatility and improves the housing price/rent indices with the clustering information. Our study is closest to the work of Ren et al. (2017); they demonstrated that a similar design can improve the model accuracy for resale transactions of single-family housing. By using informative housing data from Singapore, we extend their methodological design to multiple housing sectors (e.g. public vs private and sale vs rent), which are expected to have heterogeneous patterns and various degrees of spatial correlation in terms of housing price dynamics at the neighbourhood level. Beyond examining the model accuracy, we further investigate the application of the method in revealing heterogeneous market responses to policy interventions or macroeconomic shocks.
The SS-BNC model
We first illustrate the technology roadmap of our proposed SS-BNC model (Supp FIG 1). The input model parameters include the hyperprior distributions of several random variables, which are explained in the following section. The outcomes of the model include a series of housing indices at the neighbourhood level and the identified common patterns of housing price dynamics shared by clusters (denoted as ‘cluster-based housing price dynamics’ hereafter).
To obtain the outcomes, we follow the procedure proposed by Ren et al. (2017) and include three steps in the iterative estimation process. Each step is represented by one rectangle in Supp FIG 1. First, we apply a standard SS model to estimate neighbourhood housing indices, and we obtain residuals after controlling for hedonic characteristics at the housing unit level (see equation 3.1.2) by using housing transactions in each neighbourhood. Second, the BNC process takes the housing indices and residuals from the state-space model as input and estimates the optimal number of clusters and cluster-based housing price dynamics. Third, we start iterating the first and second steps by inputting the cluster-based housing price dynamics into the SS model and updating each neighbourhood’s housing index and residuals. The updated outcomes of the SS model are further input into the BNC model to update the optimal number of clusters and cluster-based housing price dynamics. The iteration continues until the outcomes converge, with the use of the Gibbs sample estimator. In this way, the obtained price indices capture all available neighbourhood information at each time point, as well as the price dynamics in the cluster that the neighbourhood is in.
SS-BNC model with Gibbs sampler
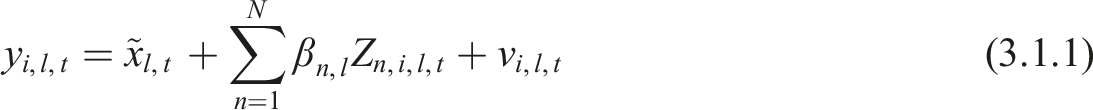
Mathematically, our proposed SS-BNC model is structured as equation 3.1.1 to 3.1.3. The SS model contains two equations: the measurement equation (3.1.1) and the transition equation (3.1.2), where


In equation 3.1.3, the BNC algorithms discover the clustering structure and qualify housing price dynamics with a latent factor estimation. Neighbourhood l belongs to neighbourhood cluster k (k = 1…. K), and K indicates the total number of neighbourhood clusters in a local housing market, which is entirely data-driven.
The entire SS-BNC model is estimated by the Gibbs sampler algorithm. This estimator has recently received increasing attention in structural time-series model estimation (Francke and Van de Minne, 2021). Compared with the standard estimator – the Kalman filter and smoother recursive algorithm and the expectation maximization algorithm (KREM estimator, De Jong, 1989) – the Gibbs sampler is easier to estimate when multiple iterations are involved.
The two outcomes: Cluster-based dynamics and neighbourhood indices
The first model outcome, housing price dynamics at the cluster level, is represented by
The second model outcome, the neighbourhood housing indices, is transformed from the time series of


In the process of estimating
In summary, our proposed SS-BNC model classifies neighbourhoods into K clusters, which are data-driven and are not predetermined. It estimates the shared housing price dynamics (
Model assessments
We assess the performance of our proposed SS-BNC model from two perspectives: prediction accuracy and robustness.
To assess the improvement in the prediction performance of the SS-BNC model, we chose three traditional models that we reviewed in Section Literature Review for comparison: hedonic housing price models (Hedonic Model, for short) with geographic information (i.e. neighbourhood fixed effects), the SAR model and the SS model by using a KREM estimator. 4 Two cross-validation methods (CVs), including the 10-fold CV 5 and the leave-one-out (LOO) CV, 6 were adopted (James et al., 2013) to compare model performance. Errors are measured by the root mean squared error (RMSE), mean absolute error (MAE), and mean absolute percentage error (MAPE). 7 Notably, some studies have developed alternative ways to measure errors, such as the absolute mean of LOO residuals (Francke and Van de Minne, 2021) and the average standard error (Schwann, 1998). Their underlying principles are the same as those of the three abovementioned measures, so we omit these alternative measures in our study.
To evaluate the robustness of the SS-BNC model, we check the heterogeneous performances of our model across various types of housing submarkets, housing transaction numbers in neighbourhoods, and definitions (i.e. sizes of physical boundaries) of neighbourhoods. First, we choose four types of housing submarkets in Singapore: the public resale housing market, the public open rental housing market, the private condo resale housing market, and the private condo rental housing market, as shown in Supp FIG 2. Second, we evaluate the impact of the number of transactions (i.e. sample size) in neighbourhoods on model performance. The BNC algorithm has no prior assumptions on sample size. However, by intuition, an estimation is less accurate if the sample size is smaller. Thus, we investigate the changes in estimation errors when the sample size (number of housing transactions) in a neighbourhood decreases. Third, our SS-BNC model requires predefined physical boundaries of neighbourhoods. Smaller neighbourhoods are expected to capture more granular spatial variations. However, they may also result in fewer sampled transactions within neighbourhoods and can increase computing time. Therefore, we recalculate with smaller boundary of neighbourhoods and investigate whether it takes more time to calculate this model.
Data
Data collection and description
The housing system in Singapore comprises public and private sectors. Combined with the resale and rental markets, we focus on four housing submarkets in this study, as defined in Supp FIG 2. Singapore public housing accommodates more than 80% of Singaporeans and permanent residents (PRs), of whom approximately 90% own their home; the rest are mainly in the public rental housing sector with subsidized rent. Of the four housing markets (prices are market prices), only the public resale housing market is regulated with subsidized mortgages to ensure affordability. Private condos are chosen because they represent 67% of all private housing.
We collected the complete records of 889,428 transactions in the four types of Singaporean housing submarkets between May 1, 2006, and April 30, 2018. In total, our transaction sample covers more than 90% of the residential buildings in Singapore, which represents our data. The data are obtained from the 99 Group, which is a real estate transaction database company in Singapore. The descriptive statistics are presented in Supp Table 1.
Based on the distinct attributes of the four housing submarkets in Singapore, we assume that there is heterogeneity in the extent of spatial correlation across the submarkets. To verify this, we estimate the spatial autocorrelation index (Moran’s I) and dissimilarities index (Geary’s C) of housing prices (rents) for each of the submarkets. The results reported in Supp Table 2 support our conjectures: The Singapore public resale housing market has the strongest spatial correlation, followed by the public open rental housing market, the private condo resale housing market, and the private condo rental housing market. This is because public housing units are more homogeneous in terms of physical layout and configuration than are private units. In addition, correlations are stronger in a housing asset market (resale market) than those in a space market (rental market) because there are more omitted characters that influence rent than resale price, such as duration of the lease and packages in rent (water and electricity fees).
Geographical distribution of neighbourhoods
A neighbourhood is defined as a geographically localized community within a city (Lewis, 1954). The spatial partitions of neighbourhoods are typically designated by geographic, administrative, or political boundaries based on socioeconomic or environmental characteristics (Bourassa et al., 2003). Since our study is not focused on determining the optimal definitions of neighbourhoods in our model, we use local administrative boundaries (‘postal sectors’) defined by the Singaporean government as an illustration in this case study. All residential buildings in Singapore are grouped into our defined postal sectors by the first two digits of their postal codes. In total, 64 out of the 82 postal sectors in Singapore are residential areas (i.e. with residential buildings), and we define them as the 64 neighbourhoods in our study.
During our study period, there were 276,836 transactions in 47 of the 82 neighbourhoods in the public resale housing market, 118,195 in the public open rental housing market in 46 neighbourhoods, 188,195 in the private condo resale housing market in 58 neighbourhoods, and 238,117 in the private condo rental housing market in 59 neighbourhoods. Thus, we have 210 neighbourhood-by-submarket observations in total.
Research findings
SS-BNC modelling outcomes
Supp Table 3 summarizes the clusters of neighbourhoods identified by our SS-BNC model. In brief, the model identifies 14 clusters among our 210 neighbourhood-by-submarket observations. There are 2-5 clusters within each submarket, and the largest submarket cluster contains approximately 30-50% of the neighbourhoods, demonstrating that there is sufficient variation within the city.
To demonstrate that our model captures intracity housing market dynamics, we use the public resale housing market as an illustration for in-depth analyses.
8
First, we show that the housing market dynamics are largely different between the different clusters we identified (i.e. spatial heterogeneity across clusters). As shown in Supp Table 3, our SS-BNC model classifies the 47 neighbourhoods with public housing resale transactions into 4 clusters. In Supp FIG 3, we plot the housing price dynamics for each of the 4 clusters – common changes in housing prices among all neighbourhoods in a cluster between two consecutive time points (i.e. 1 month in our example), which are represented by
Second, Figure 1 displays the relationship between cluster-level housing price dynamics and the neighbourhood-level housing price index of public housing resale market. The solid lines represent the housing price index of each neighbourhood, and the dashed-dotted lines represent the common price dynamics ( Neighbourhood-level housing price indices and cluster-level housing price dynamics in the public resale market from 2010 to 2012. (a) Cluster-1, (b) Cluster-2, (c) Cluster-3 and (d) Cluster-4.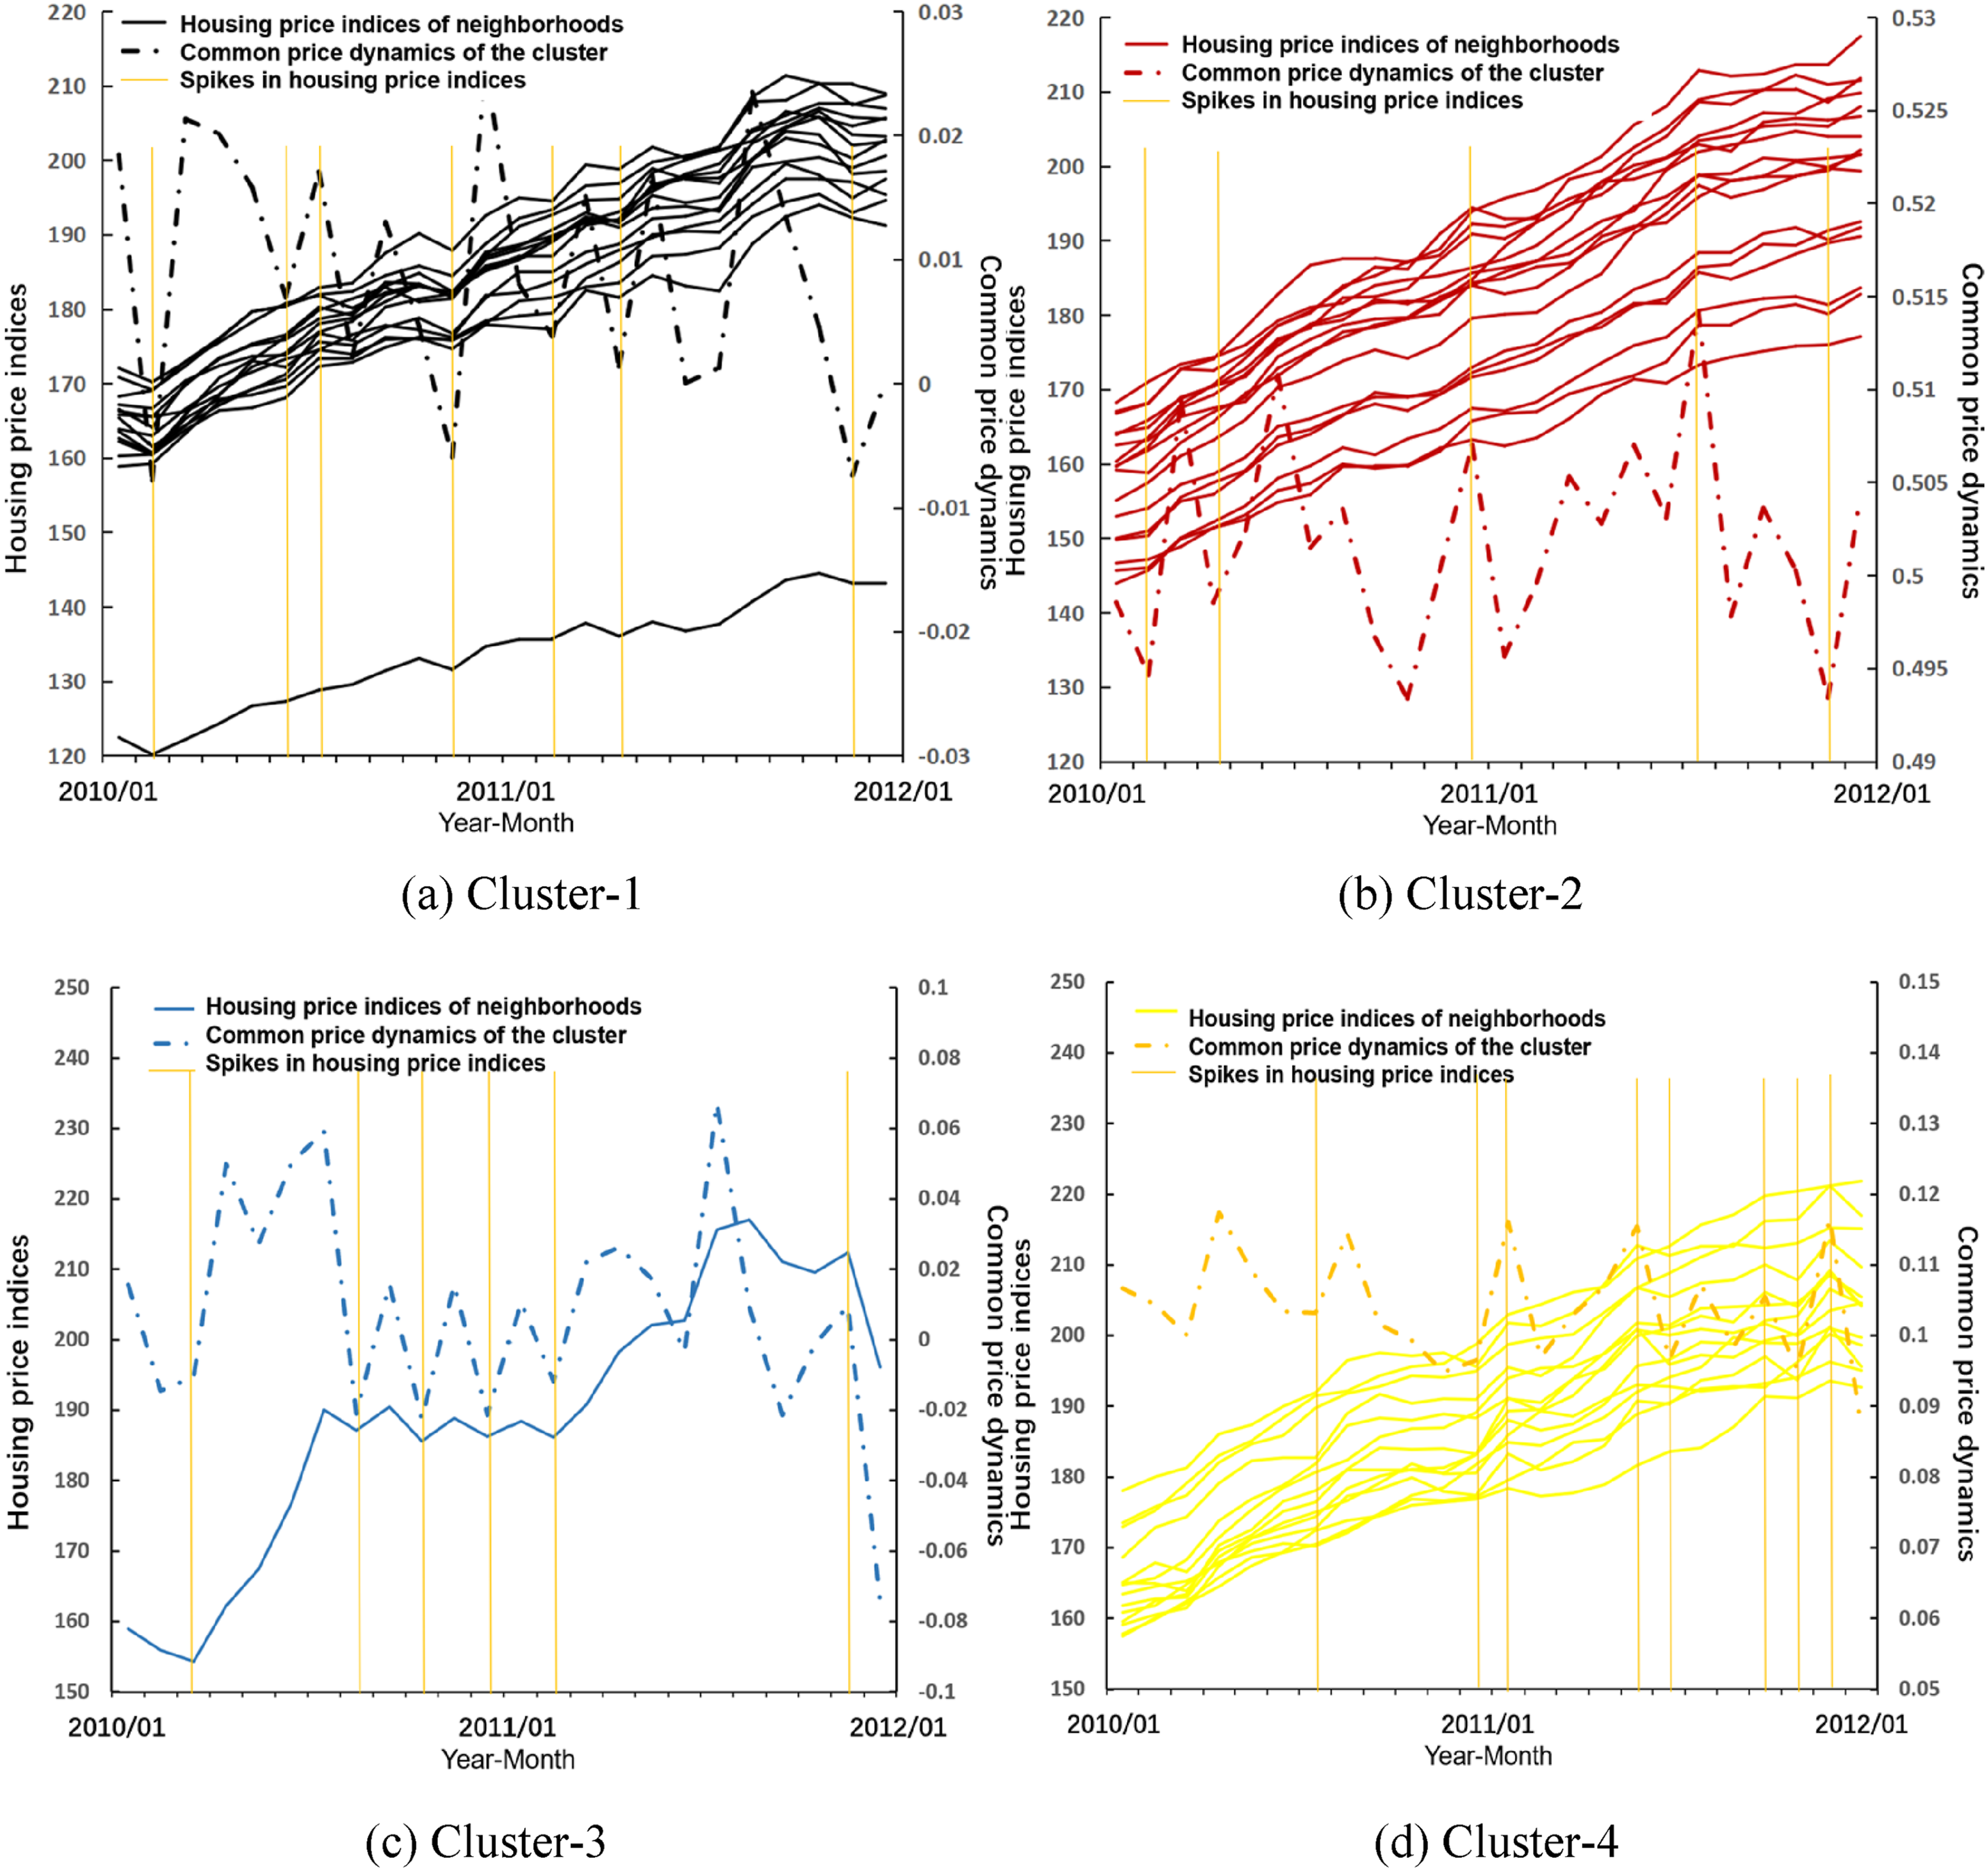
Third, we find that neighbourhoods in the same cluster, which share common housing price dynamics, are not necessarily adjacent (i.e. spatial discontinuity). Figure 2 shows the spatial distribution of the identified clusters in the four Singapore housing market sectors. We find that neighbourhoods within a cluster can be spatially discontinuous. In other words, some distant neighbourhoods may share common patterns in housing price dynamics, while adjacent neighbourhoods can belong to different clusters. In Supp Section C, we present a field study of four neighbourhoods that belong to two clusters of public resale housing price dynamics. We find that the accessibility to amenities and physical segmentations can be potential reasons of their spatial discontinuities. Distributions of neighbourhood clusters in the Singaporean housing sectors. (a) Public resale housing market (b) Public open rental housing market (c) Private condo resale housing market (d) Private condo rental housing market.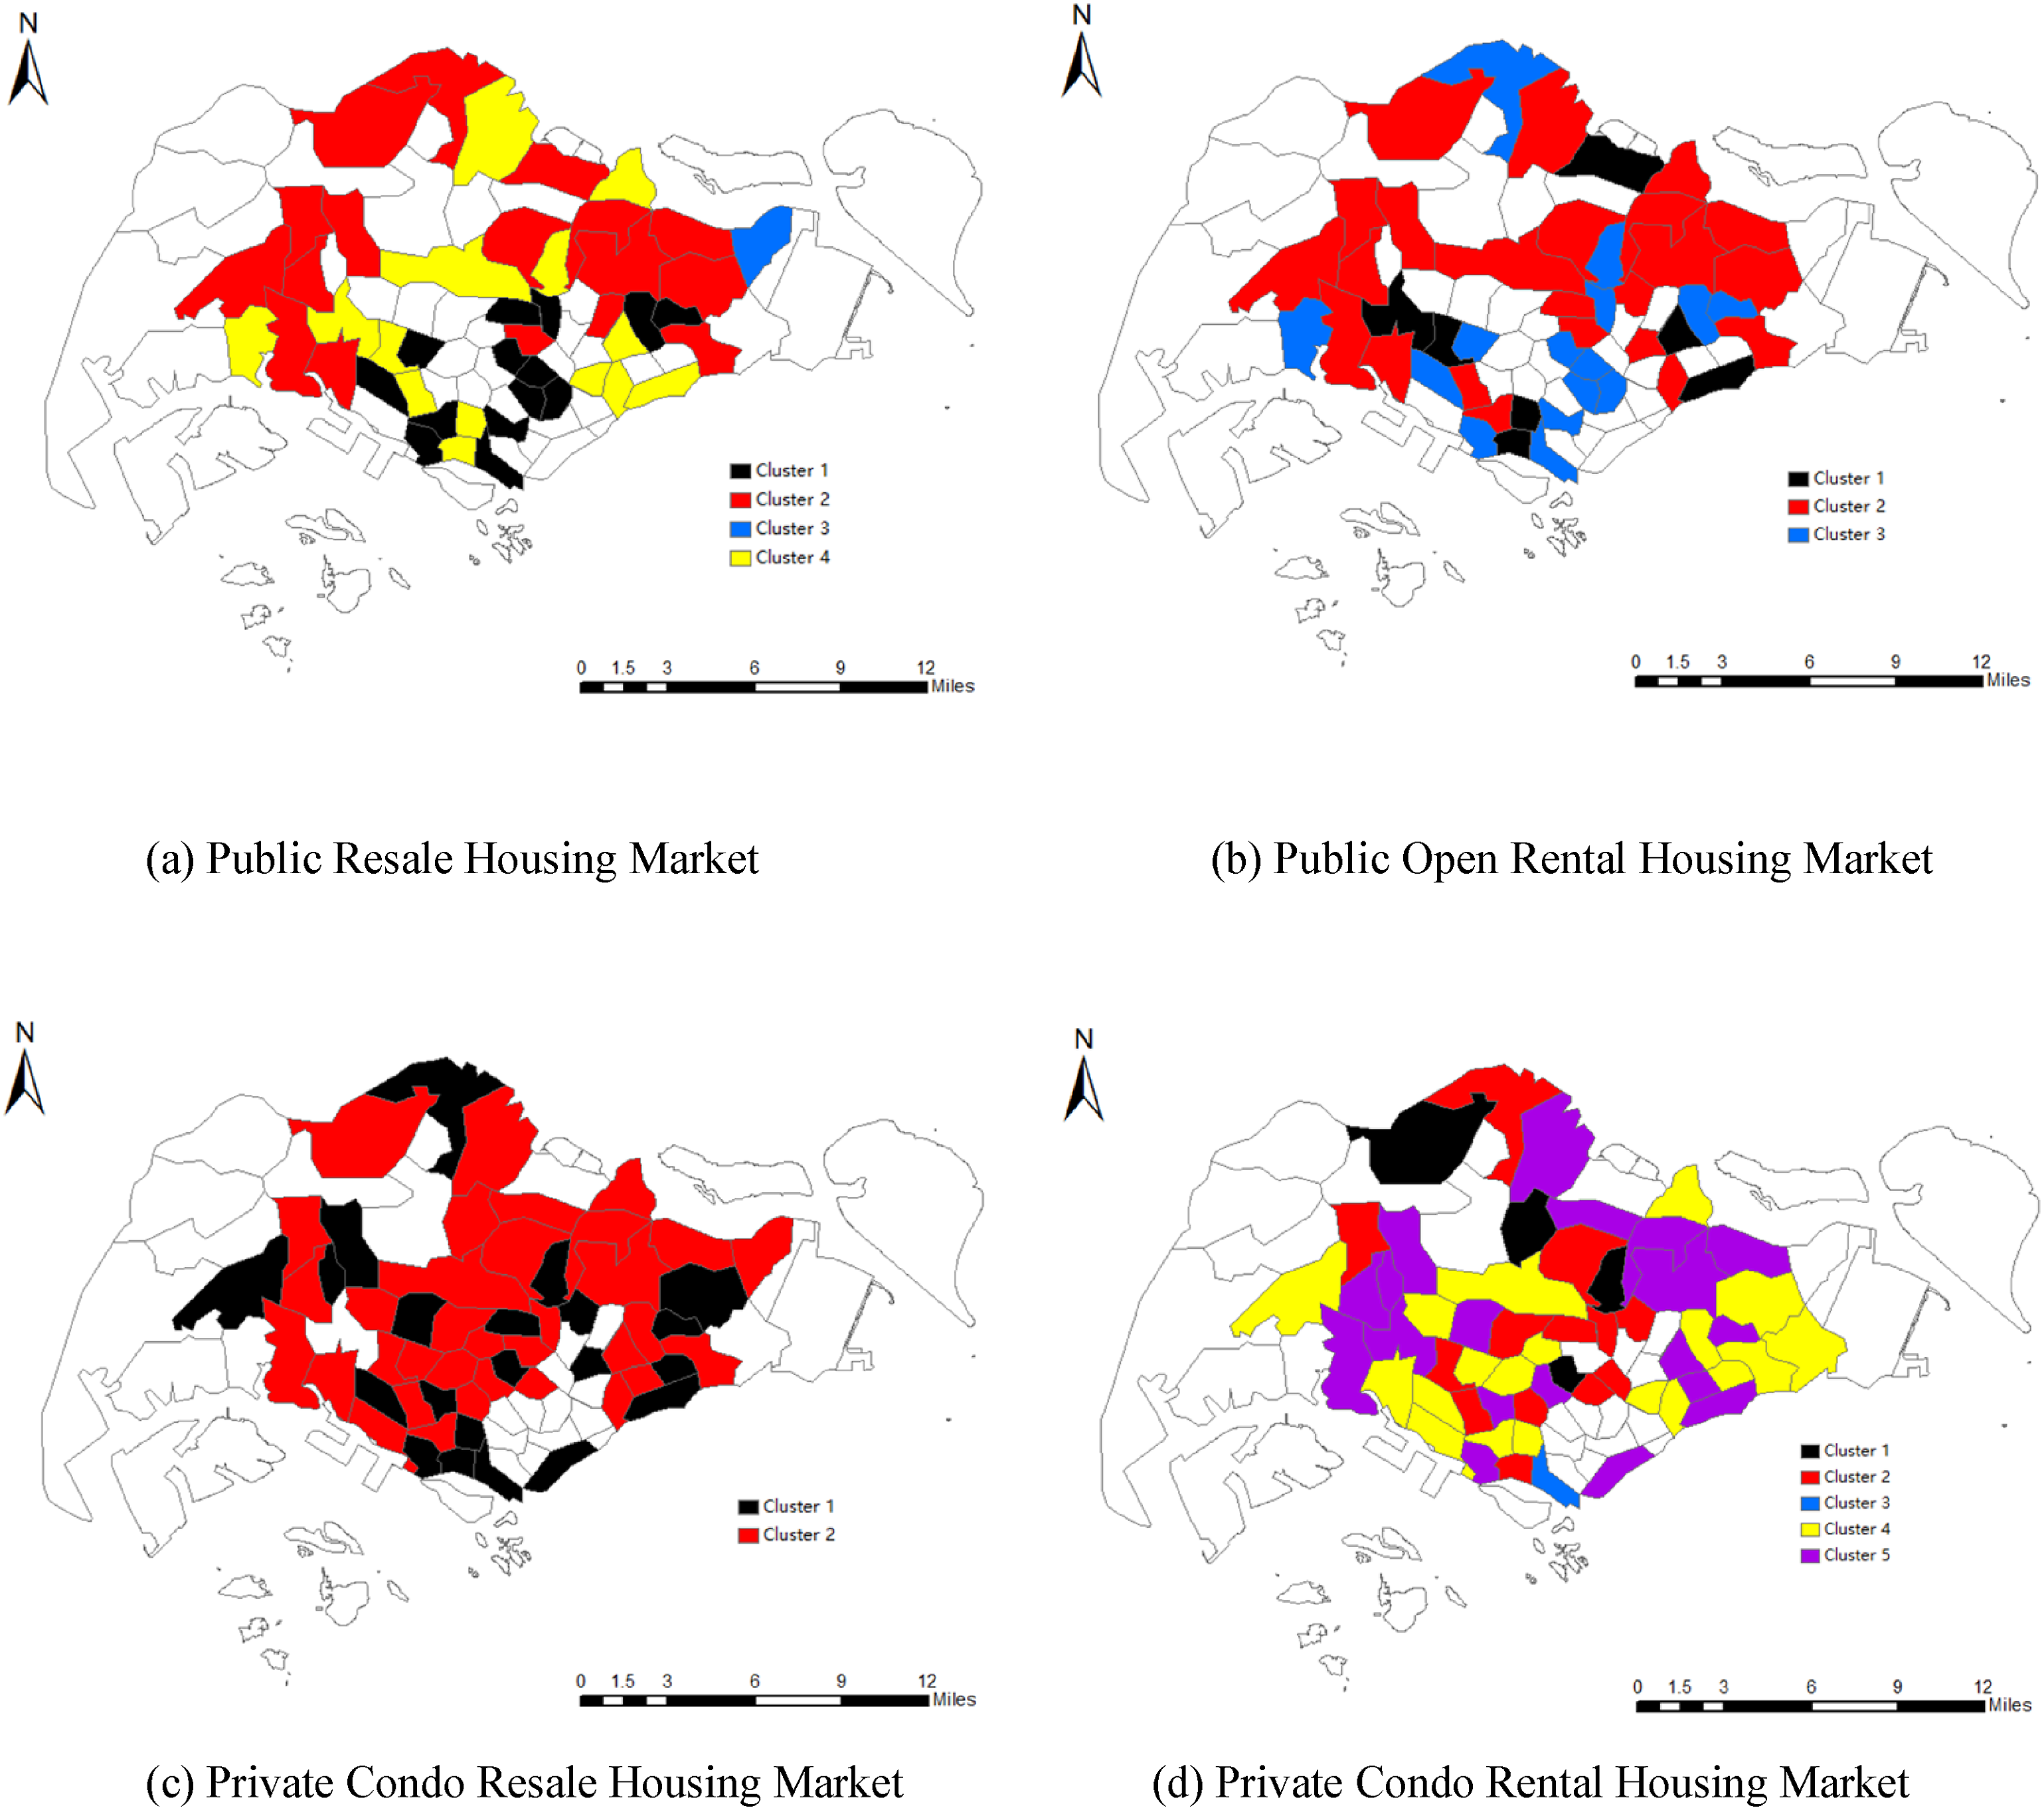
In summary, unlike existing methods in the literature that cluster the overall time trends of neighbourhood indices (Hu et al., 2022; Kopczewska and Ćwiakowski, 2021), we cluster the housing price temporal volatility patterns within short time intervals to better represent both the spatial heterogeneity across clusters and the spatial correlation within clusters. Furthermore, our results imply that some latent cluster-level factors that have not been captured by traditional methods in the housing price literature may also influence local housing price movement. Neighbourhoods in the same cluster share some common latent features that drive cluster-level housing price dynamics, which are not captured by conventional city-level market factors and other neighbourhood-level factors in traditional methods. Potential cluster-level factors include comparative advantages in production, residential amenities, land supply and transportation infrastructure (Ahlfeldt et al., 2015; Beracha et al., 2018).
SS-BNC model assessment
Model prediction accuracy
To assess the improvements that our proposed SS-BNC model made relative to traditional methods, we use our SS-BNC model, together with the three selected benchmark models (hedonic, SAR, and SS), to predict the housing price/rent in all four housing submarkets in Singapore. The results are reported in Supp Table 4. The out-of-sample predictions, by using the 10-fold CV and the LOO CV tests, show that the CV errors (RMSE, MAPE and MAE) of the benchmark models are comparable to the reported levels in existing studies, while the new SS-BNC model outperforms all the benchmark models in every housing market sector. It reduces prediction errors by more than 40% (i.e. relative decreases in RMSE/MAPE/MAE) compared with those of the hedonic housing price models and more than 10% compared with those of the SS model. Therefore, our method significantly improves the price prediction accuracy. Our model is robust across all four housing submarkets in Singapore.
More interestingly, we find that the SS-BNC model performs better in a more homogeneous housing submarket with a higher level of spatial correlation across neighbourhoods. The Singapore public resale housing market is the most homogeneous of the four submarkets (in terms of the physical configuration of units, locations, background of occupiers/tenants, etc.) and has best prediction performance, followed by the public open rental, private condo resale, and private condo rental housing markets. One potential reason is that homogeneous homes create similar spatial utility and attract common housing demand. Therefore, homogenous homes are more likely to share a common trend across neighbourhoods, which is more easily captured by our SS-BNC model.
In addition, we find that the sample size of transactions in a neighbourhood has limited impacts on the estimation accuracy of the SS-BNC model. We take the Singapore public resale housing market as an example and use 10-fold CV and the MAPE to illustrate the impact. Forty-seven out of 64 neighbourhoods in the public resale housing market have transactions, with sample sizes ranging between 104 and 23,457. The MAPEs of each neighbourhood are illustrated by the y-axis in Figure 3 relative to the neighbourhood’s transaction number on the x-axis. We find that all MAPEs are lower than 0.015, regardless of the neighbourhood sample size. Additionally, neighbourhoods with smaller sample sizes do not necessarily produce larger MAPEs. This result demonstrates the main strength of our model: when a neighbourhood has a limited number of transactions, the model can utilize information from the neighbourhood cluster and thus can improve the prediction accuracy. Transaction sample sizes in neighbourhoods and performance of the SS-BNC model in the public resale housing market.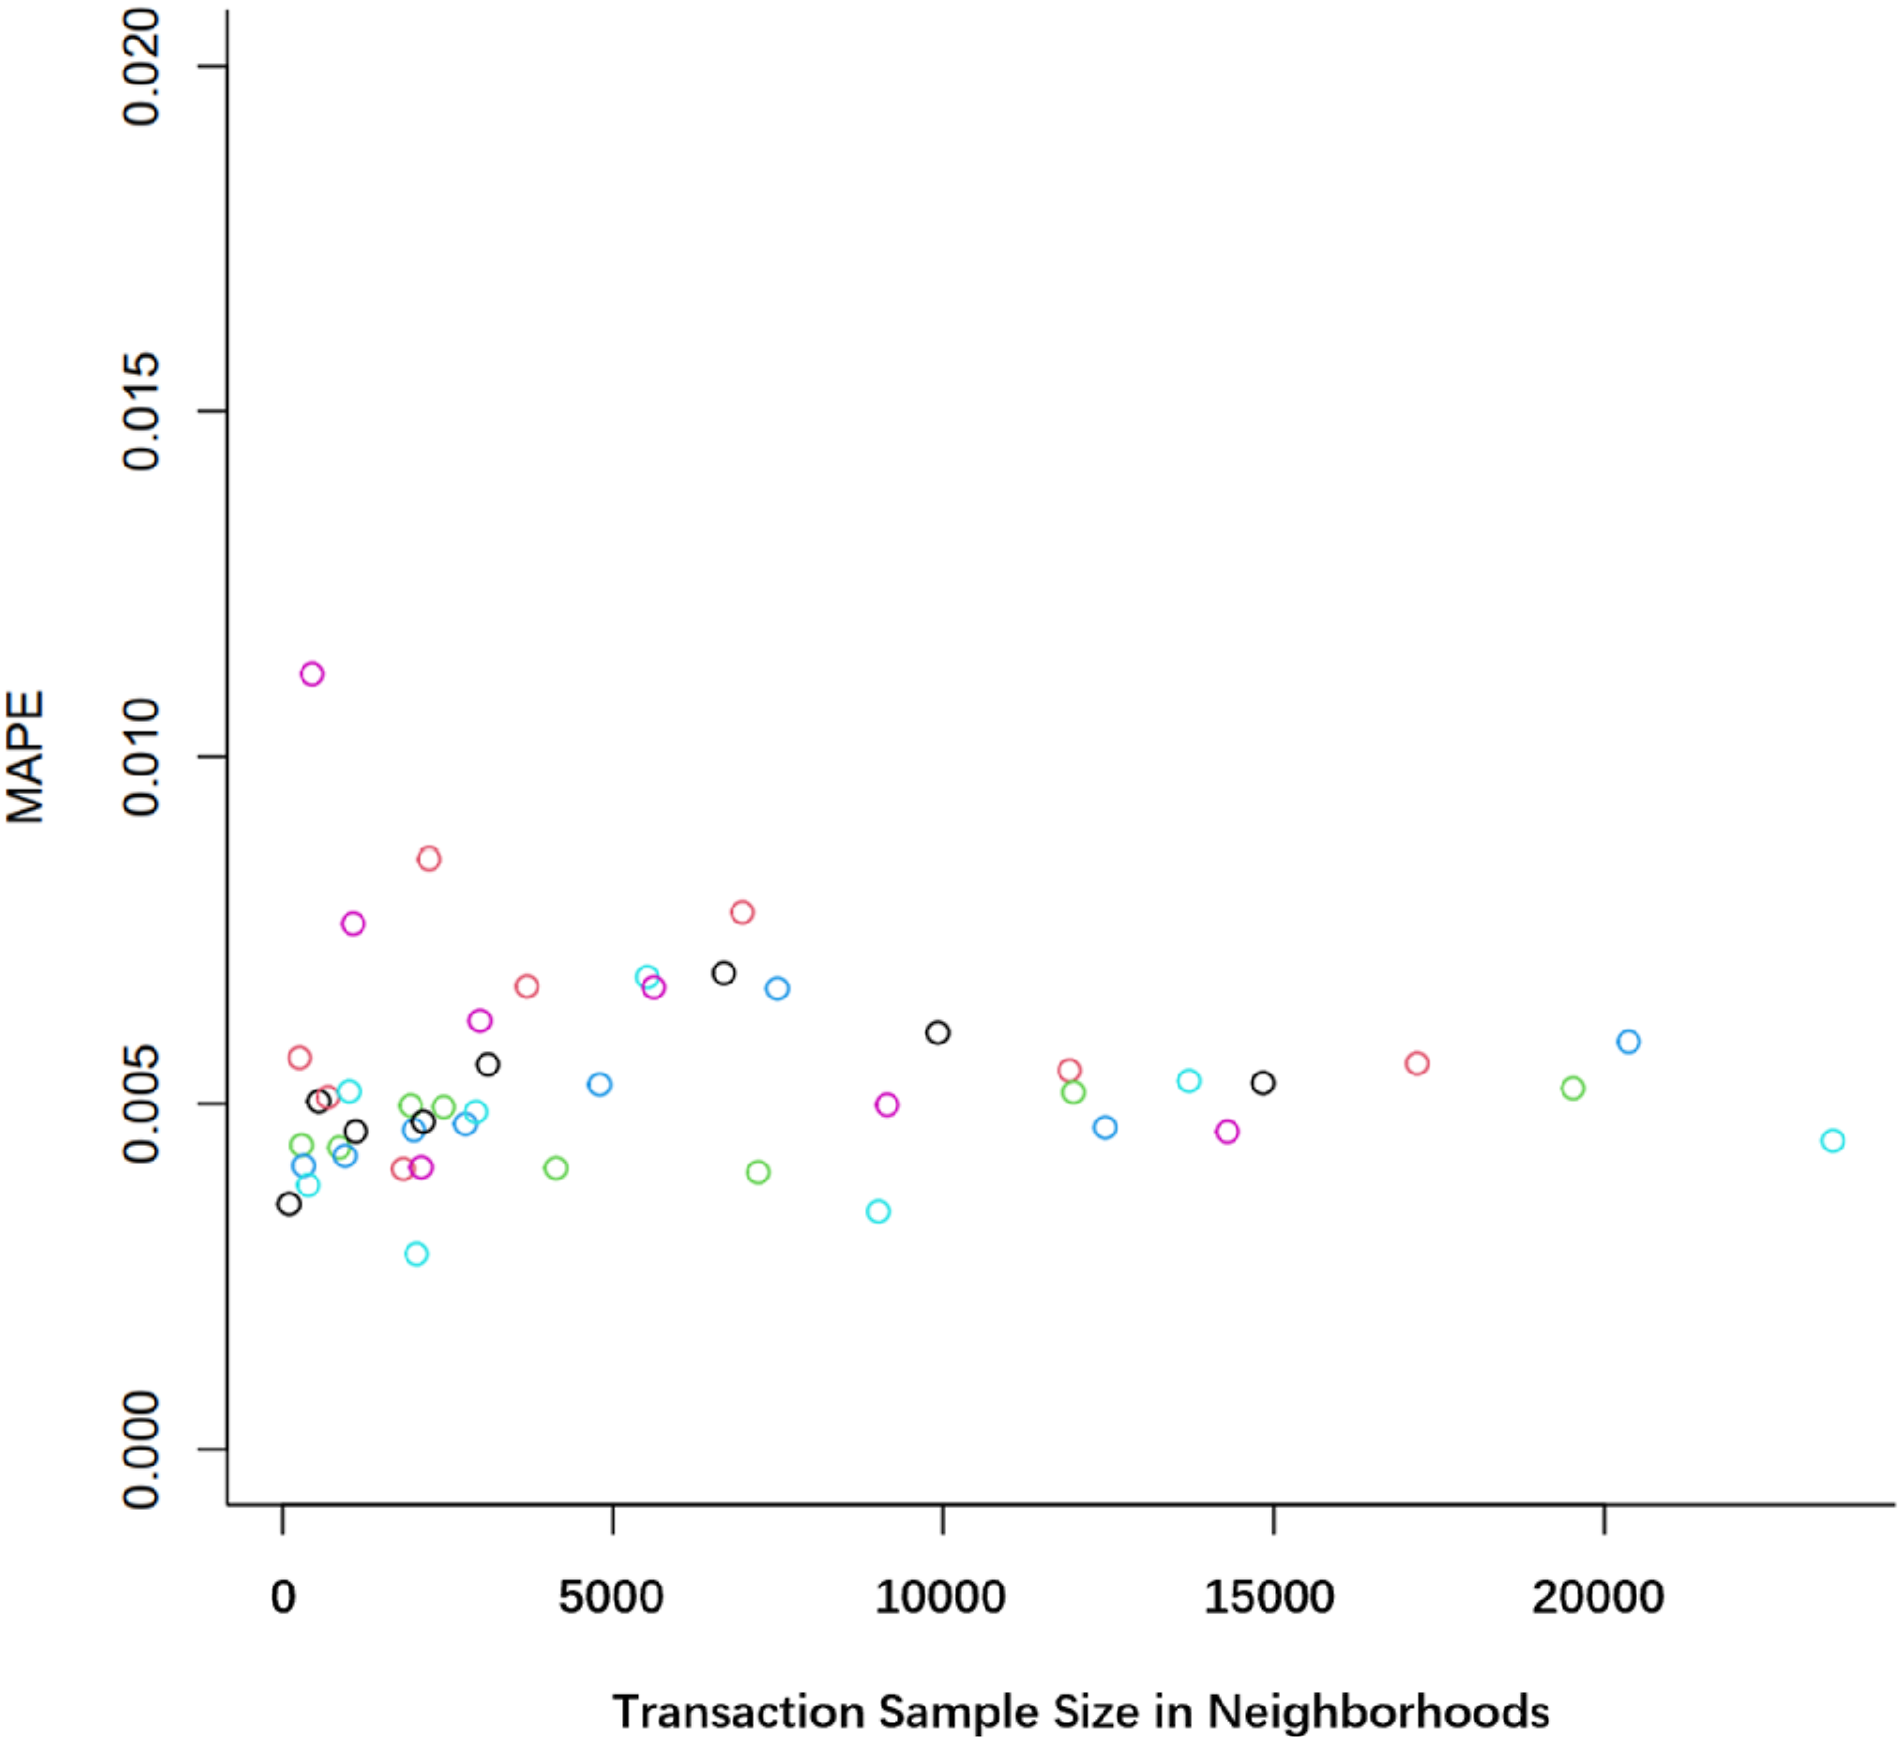
Finally, the sizes of the predefined neighbourhoods may influence the predictive accuracy. To evaluate the robustness of our model with various sizes of neighbourhoods, we redefine neighbourhoods by using the first 3-digit (rather than the first 2-digit in our main analysis) of a postcode, which increases the number of neighbourhoods from 64 to 168 and decreases the average number of residential buildings in a neighbourhood from 227 to 86. Then, we replicate all the analyses and report the results in Supp Table 5. We find that the model accuracy improves, as all measures of the CV errors consistently decrease with decreasing neighbourhood size. However, the calculation time of the model increases threefold, indicating a trade-off between model performance and calculation time.
Model applications
One important reason why we need to understand intracity housing market dynamics is that neighbourhoods may respond distinctively to a common shock (e.g. economic recession or government regulation) to the entire city’s housing market (Lu et al., 2023). Understanding such heterogeneous responses will guide the decision-making of various stakeholders, such as investors, developers, policy-makers, and urban planners. In this section, we demonstrate how our proposed SS-BNC model can be applied to understand these heterogeneous responses. For illustration, we design two different analyses to reveal neighbourhoods’ responses to macroeconomic shocks and policy interventions, but it is noteworthy that these designs can be used interchangeably.
First, we investigate how different Singaporean neighbourhoods respond to the Global Financial Crisis (GFC) – a large external macroeconomic shock to the entire Singapore housing market. Overall, the Singapore housing market experienced a short recession after the shock that started in August 2017, and we are interested in exploring whether different neighbourhoods came out of the recession at different times. This knowledge has important implications for homeowners in their home purchasing or selling decisions and for governments in effectively allocating financial support during economic recessions.
Specifically, we use our SS-BNC model to generate national indices and cluster-level indices for each housing submarket
10
and identify the time at which each cluster (or the nation on average) stepped out of recessions (denoted as the ‘breakpoint’ time).
11
The results are shown in Figure 4. We observe large variations in the breakpoint time, which are distributed over a one-year time span. Overall, the private housing market recovered faster from the GFC than did the public housing market, while the rental market recovered faster than did the sales market. Within each housing submarket, different clusters also have varying response times to the shock, ranging from one to 6 months, which are different and cannot be captured by the national average recovery time. In the unique case of cluster 3 in the private condo rental market, no recession is observed, so there is no breakpoint time for recovery. There are various potential reasons for these heterogeneities. For example, there are many more government regulations for transactions in the public housing market than there are in the private housing market, which slows the market adjustment. Additionally, different submarkets have different trading frequencies and transaction costs. The resale market has lower trading frequency and higher transaction costs, resulting in longer response times. Distinct breakpoints of each cluster in response to the GFC.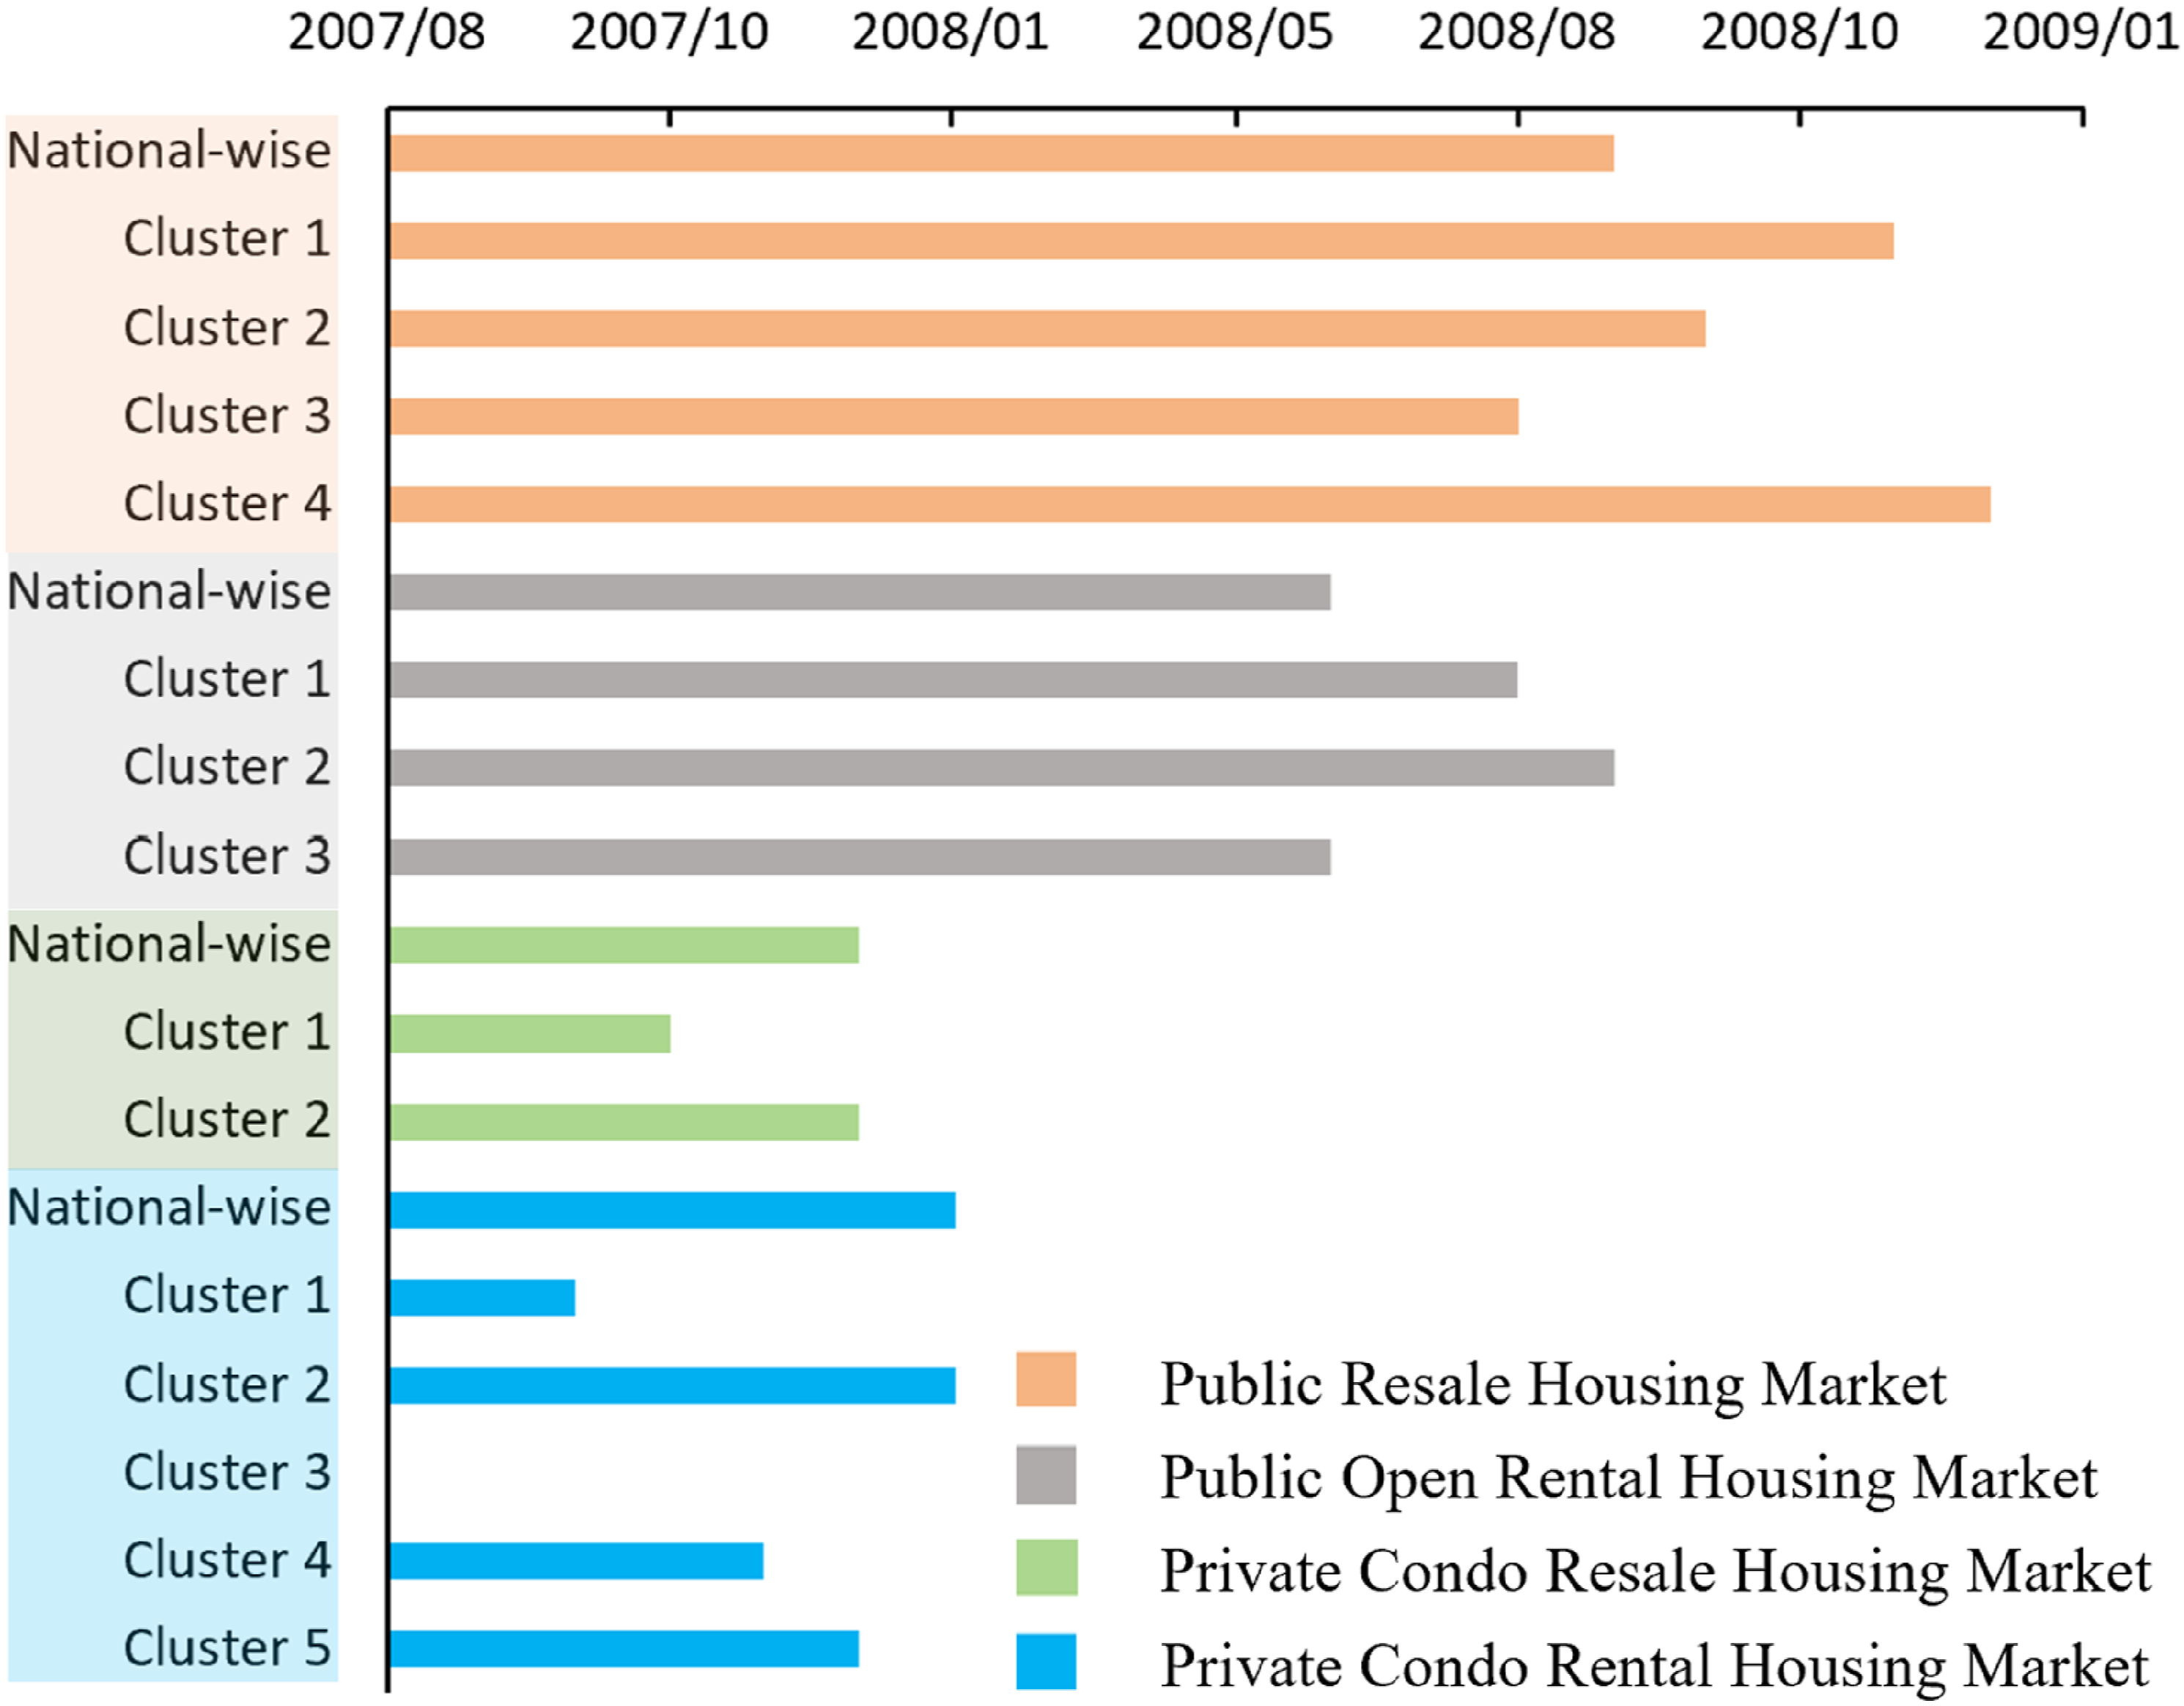
Second, we apply the SS-BNC model to monitor market responses to government policies at the granular neighbourhood level. This application is of significant public interest, as monitoring the effectiveness of public policies is critical for reviewing and adjusting future policy-making. We use the introduction of the seller’s stamp duty by the Singapore government in February 2010 – the first anti-speculation policy rolled out in Singapore during our study period – as an illustration. After the enactment of the policy, reselling a property within a short period (1 to 3 years) results in additional stamp duties payable by the sellers, so the resale market is expected to cool. In particular, we are interested in exploring whether submarkets in the same neighbourhood reacts differently to the same policy intervention because the policy targets resale submarkets only, and any co-movements in nontarget submarkets can be considered unintended outcomes of the policy.
To demonstrate this application, we sampled one neighbourhood (the postal sector ‘35’) in which the four types of Singapore housing submarkets coexist. We present the housing price/rent indices of four housing submarkets in the selected neighbourhood, as well as the national indices of the four submarkets, in Figure 5. In the selected neighbourhoods, a large deviation in housing prices from the national average is observed in the private condo resale housing market after the introduction of the policy, while a much smaller deviation is found in the public resale housing market. Similarly, there are larger deviations in the private condo rental market than those in the public open rental market. Housing price/rent indices of the four housing market sectors. (a) Selected neighbourhood (b) Singapore nationwide.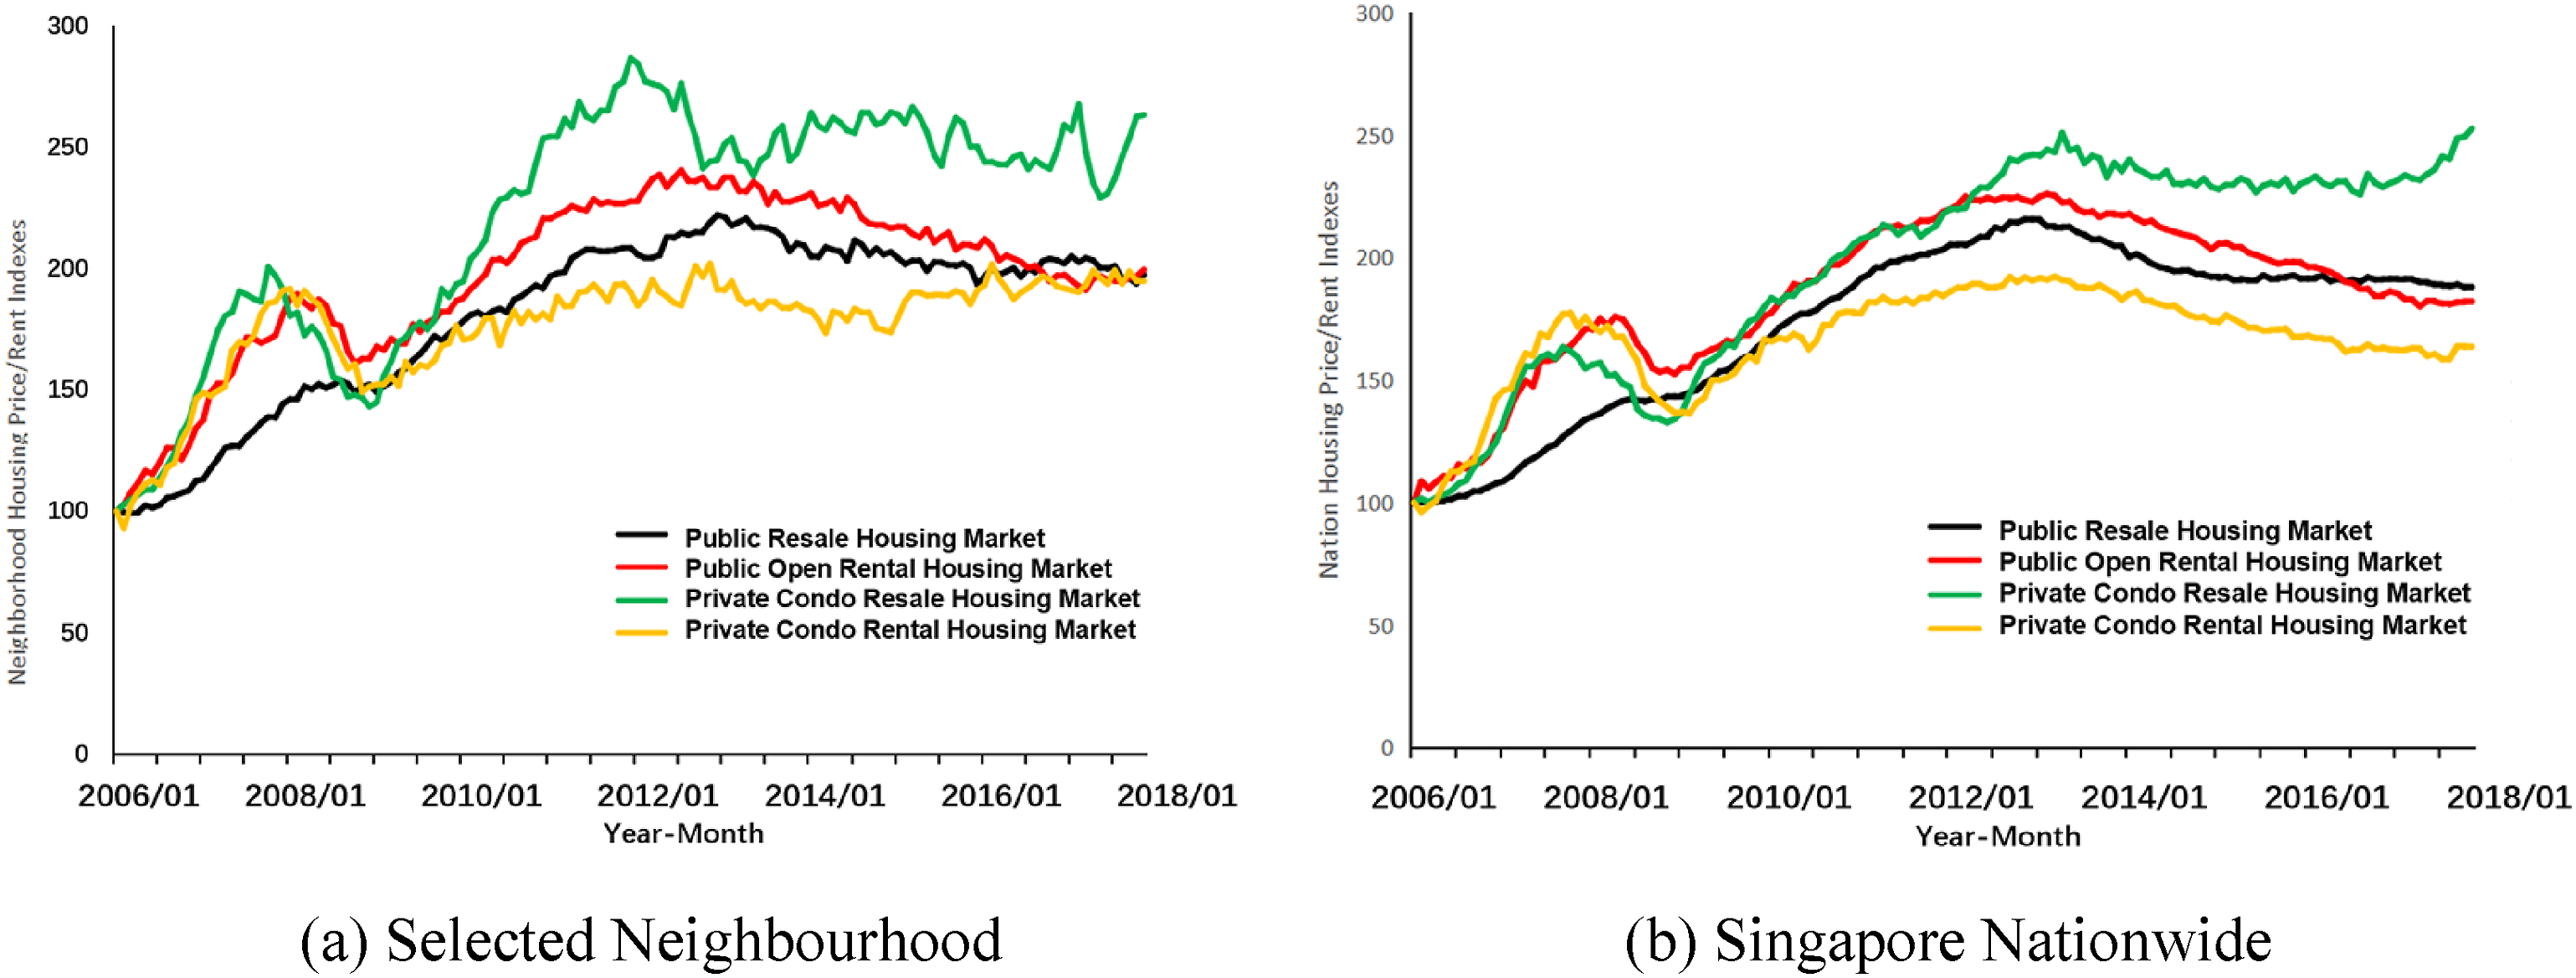
Supp Table 6 illustrates how different housing markets respond to the anti-speculation policy in the selected neighbourhood. We define the breakpoint as the time at which the index reaches the peak; this point indicates that the market started to be cooled by the policy. We find that in the sampled neighbourhood, private condo resale housing prices – the main target sector of the policy – are the first to respond to the policy, followed by the private condo rental and public open rental markets. However, the public resale market was not effectively cooled by the policy until September 2013. More importantly, these patterns in the sampled neighbourhoods are different from those at the national level. One implication of this result is that some latent factors result in the ineffectiveness of the policy in regulating the public resale market in this neighbourhood (e.g. low public housing supply), which requires further investigation by planners and policy-makers.
In summary, our examples demonstrate the wide range of real-life applications of our proposed model in monitoring housing market dynamics at the granular neighbourhood level. These functions are particularly important when a city faces macroeconomic shocks or when there is a need to evaluate government regulations.
Conclusion
In this paper, we adopt a novel SS-BNC model to improve housing price prediction at the neighbourhood level, and we provide deeper insights into intracity housing price dynamics. We show that our proposed model outperforms other conventional methods, and it effectively represents the common market dynamics within clusters. The model has important real-life applications, as it can reveal how different neighbourhoods respond to a common macroeconomic shock or a policy intervention, which is important but not feasible with conventional methodology.
Apart from the applications, our model also contributes to theories on urban structures. Existing studies on intracity structures generally assume spatial continuity or that closer areas are more strongly correlated with housing market dynamics (Pérez-Molina, 2022; Tomal and Helbich, 2022). Our model outcomes lend strong support for the argument of spatial discontinuity, implying the existence of latent factors that drive the housing market dynamics in discontinuous clusters. We advocate for researchers to explore such latent factors.
Supplemental Material
Supplemental Material - Understanding intracity housing market dynamics: A state-space model with Bayesian nonparametric clustering approach
Supplemental Material for Understanding intracity housing market dynamics: A state-space model with Bayesian nonparametric clustering approach by Yao-Pei Wang, Yong Tu, and Wayne Xinwei Wan in Environment and Planning B: Urban Analytics and City Science.
Footnotes
Declaration of conflicting interests
The author(s) declared no potential conflicts of interest with respect to the research, authorship, and/or publication of this article.
Funding
The author(s) received no financial support for the research, authorship, and/or publication of this article.
Data availability statement
The datasets generated during and/or analyzed during the current study are available from the corresponding author on reasonable request.
Supplemental Material
Supplemental material for this article is available online.
Notes
References
Supplementary Material
Please find the following supplemental material available below.
For Open Access articles published under a Creative Commons License, all supplemental material carries the same license as the article it is associated with.
For non-Open Access articles published, all supplemental material carries a non-exclusive license, and permission requests for re-use of supplemental material or any part of supplemental material shall be sent directly to the copyright owner as specified in the copyright notice associated with the article.