
Abstract
Climate change and the associated increase in heat-related hazards pose a pressing threat to urban residents’ health and well-being. People, when walking in particular, are at risk of experiencing heat stress as they navigate urban environments. This study proposes a novel heat risk assessment framework combining pedestrian mobility modeling with urban microclimate modeling. Using this framework, we assessed pedestrian heat-related exposure and risk in urban areas by integrating the Universal Thermal Climate Index (UTCI) as the hazard and pedestrian trips to critical destinations as exposure. We considered temporal variation, in both hazard and exposure, by examining different time periods during the day—morning peak, midday, and evening peak. In addition to hazard and exposure, we also considered vulnerability by focusing on young children and older adults. We contribute to improving the spatial resolution of heat risk assessment by analyzing the hazard for pedestrian trips between home locations and five critical destinations—bus stops, rail stations, parks, schools, and commercial amenities—at the address-point level and using a pedestrian network comprising sidewalks and crosswalks. Our framework helps identify sidewalks with high heat exposure levels as well as home locations with high cumulative heat risk, accounting for walking trips to critical destinations along feasible routes. We demonstrated the effectiveness of this framework by applying it to a 36-square-kilometer area of central Los Angeles, CA. Our findings offer valuable information to urban planners and policy-makers, supporting evidence-based prioritization of intervention sites, climate adaptation strategies, and policy decisions essential for climate-proof planning. By implementing targeted interventions in areas where heat hazard is expected to affect the most vulnerable pedestrians, planners can create heat-resilient, pedestrian-friendly environments while prioritizing the health and well-being of vulnerable groups. This study contributes to the growing knowledge of robust risk assessment methodologies for climate-proof planning, specifically with regard to addressing outdoor heat-related risks during extreme heat events.
Introduction
Rapidly accelerating climate change is increasing the frequency, duration, and intensity of extreme weather phenomena globally. These events, such as heatwaves, pose an urgent threat to human health and well-being. Heatwaves can be particularly severe in urban areas, where heat-absorbing surfaces (such as impervious pavement) are found in abundance. This Urban Heat Island (UHI) phenomenon (Oke et al., 2017) results in urban temperatures that are significantly higher than those in surrounding rural areas, which can lead to serious consequences. Studies have shown that the UHI effect contributes to increased levels of air pollution (Sarrat et al., 2006) and heat-related illness and mortality (Heaviside et al., 2017). As anthropogenic activities significantly contribute to the formation of heat islands, this problem is likely to exacerbate over the coming decades with almost 70% of the global population projected to live in urban areas by 2050 (UN-DESA, 2018). The effects of heatwaves are distributed unequally across the population with most of the rural-urban migration occurring in the Global South and historically marginalized neighborhoods within cities being subjected to higher temperatures with fewer mitigation resources, leading to a global climate justice movement (Amorim-Maia et al., 2022; Fiack et al., 2021; Fitzgerald, 2022).
In addition to affecting the health, comfort, and well-being of urban residents, rising urban temperatures also influence how people choose to travel around cities. Extreme weather events have been found to affect recreational travel (with subsequent effects on mental health and well-being), reduce travel demand, and induce people to shift to less sustainable travel modes (Wu and Liao, 2020). During hot and humid weather conditions, people are more likely to choose modes with air-conditioning, such as private automobiles, ride-hailing (Uber, Lyft, etc.), taxis, trains, and buses. The likelihood of choosing active transportation modes, such as walking and biking, reduces, as does the duration of active trips (de Montigny et al., 2012; Gebhart and Noland, 2014). This is because people are directly exposed to potentially dangerous temperatures while walking and biking (Saneinejad et al., 2012). As we try to nudge more people toward non-auto modes of transportation to reduce transport-related greenhouse gas emissions globally, it is becoming increasingly important to consider the effect of extreme heat on travel behavior. Failure to consider this aspect will result in cities falling short of their ambitious mode shift targets and consequently unable to reduce transport-related emissions significantly, thereby fueling the vicious cycle of auto-dependence and rising temperatures even further.
To effectively address these challenges, we need a more nuanced understanding of the heat risk faced by people as they travel around urban areas. The Fifth Assessment Report by the Intergovernmental Panel on Climate Change (IPCC) laid out a general framework, reiterated in the Sixth Report,highlighting the interconnected nature of hazard, exposure, and vulnerability (which we define in the following section). The report emphasized the need to implement effective urban adaptation in light of the growing risks, vulnerabilities, and impacts of climate change (Pachauri, 2016). In this study, we built on the general framework conceptually in two important ways to illustrate how outdoor heat-related risks can be assessed for people walking to essential destinations in urban areas. First, we went beyond “mere” temperature and humidity in evaluating urban heat exposure. Although these two elements undeniably affect urban health and well-being, they do not paint a complete picture of urban heat exposure. Studies have demonstrated that factors at a local level such as urban microclimate, solar radiation, urban structure, and availability of shade collectively shape our experience of heat in urban environments (Harlan et al., 2006; Melnikov et al., 2022; Sangiorgio et al., 2020). Therefore, we considered a state-of-the-art multi-dimensional microclimate index (the Universal Thermal Climate Index, or UTCI) in our measurement and evaluation of urban heat exposure. Second, we recognize that temporal variations in urban microclimates and human mobility play an important yet understudied role in understanding heat exposure. Where, when, and how people move about the city influences their exposure to extreme heat. Possibly for the first time, we incorporated the human mobility aspect (focusing on people who walk, who are much less sheltered from heat exposure than people who drive or use transit) into the heat risk assessment framework.
In addition to these conceptual advancements, we made several methodological improvements that, to the best of our knowledge, are unique. These improvements largely relate to the scale at which heat risk is assessed, which has traditionally been a Census tract, block group, or block. We contend that these geographical units are not granular enough to appropriately represent how people experience the micro-scale outdoor urban environment while walking. To inform and design effective interventions for people who walk, we need a more accurate and higher-resolution representation of how pedestrians experience extreme heat exposure. Therefore, we improved the resolution of where people are walking from and to (origins and destinations), how they walk (network), and when they walk (different times of the day). First, we used a pedestrian mobility model that generates pedestrian trips between different origins and destinations at the address point (building) level. These trips were probabilistically distributed across different routes for each origin-destination pair, rather than choosing a simple shortest-path routing approach, in a manner that accounts for pedestrian preferences and idiosyncrasies. Second, we created and used a sidewalk network instead of using the road network comprising street centerlines. A sidewalk network can paint a truer picture of how and where people walk within urban areas, allowing us to differentiate between two sides of the street that may have varying degrees of shading and vegetation and other factors influencing pedestrian route choice (Basu and Sevtsuk, 2022; Sevtsuk and Basu, 2022; Sevtsuk et al., 2021). Third, we computed both the urban microclimate index (UTCI) and pedestrian trip volumes at three different time periods during the day (i.e., morning peak, midday, and evening peak) to assess heat risk experienced by people walking at different times of the day. In combination, we calculated a sidewalk-level temporally varying heat exposure index that can help communities, planners, and decision-makers identify critical areas (down to the sidewalk level) that are most in need of adaptation measures.
We demonstrate the application of the proposed framework in central Los Angeles, CA, and illustrate its outcomes through two key products that can aid planners in shaping effective heat adaptation strategies and identifying prime locations for operationalizing targeted interventions. The first is a sidewalk-level heat exposure map that draws on the probabilistically routed pedestrian trips between origins (homes or address points) and a set of critical destinations (bus stops, train stations, parks, schools, and amenities). This map highlights sidewalks where a high volume of people walking might be experiencing a high level of heat risk. Building on this approach, the second product is an origin-level heat risk map that shows where people who are most susceptible to cumulative outdoor heat risk as a result of walking from their homes to the aforementioned set of critical destinations live (i.e., their home locations or origins).
The remainder of this paper is structured as follows. We present the IPCC risk assessment framework in the next section, along with outlining our proposed enhancements and defining how we measure the three key components of the framework—heat hazard, exposure, and vulnerability. In the subsequent section, we introduce the area of focus and the data sources used in this study before describing the analysis. The results are then presented and discussed, emphasizing how these tools can aid planners in identifying high-exposure sidewalks and high-risk origin points for more effective climate change mitigation strategies. Finally, we conclude the paper by summarizing key takeaways, discussing limitations, and suggesting avenues for future research.
Heat risk assessment framework
The risk assessment framework proposed by the IPCC includes three components—(a) Hazard, (b) Exposure, and (c) Vulnerability. In this study, we adapt and extend this framework to measure heat risk experienced by people who walk. We measure hazard through the Universal Thermal Climate Index (UTCI), while exposure is measured through segment-level pedestrian volumes (i.e., estimates of the number of people walking on each sidewalk). We consider young children (aged below 5 years) and older adults (aged over 65 years) to be especially susceptible to heat who are accounted for in the framework as vulnerable population groups. Collectively, these three components contribute to the evaluation of heat risk experienced by pedestrians as they walk within urban environments.
Heat hazard: Universal Thermal Climate Index
Although extreme heat events are characterized by unusually high temperatures, temperature alone or even in combination with humidity is insufficient to account for heat hazards comprehensively. More advanced measures of thermal stress are required to adequately capture the outdoor pedestrian experience in densely built-up urban environments. In this study, we used the Universal Thermal Climate Index (UTCI), which is a bioclimatic measure designed to assess the physiological comfort of the human body under specific weather conditions (Jendritzky et al., 2012; Liu and Qin, 2023). UTCI represents the perceived temperature that our bodies would experience under given environmental conditions, taking into account the combined effects of four elements—(1) air temperature, (2) wind speed, (3) humidity, and (4) mean radiant temperature (Fiala et al., 2012). The mean radiant temperature, in particular, is a key factor as it incorporates all components of solar radiation, including direct and diffuse solar radiation, as well as long-wave radiation emitted by the sky, ground, and nearby surfaces. Heat-related mortality risk in adults aged between 45 and 79 years has been found to rise by 5% for mean radiant temperature values over 58.8°C (Thorsson et al., 2014). For adults over 80 years old, the mortality risk is reported to rise by almost double that (10%) for mean radiant temperature values over 59.4°C.
The four UTCI components play a crucial role in the heat exchange process between the body and its surroundings, influencing the body’s heat balance and overall thermal sensation. Owing to the integration of an advanced thermo-physiological model and a cutting-edge clothing model, the UTCI has been found to surpass the limitations of previous heat indices (Di Napoli et al., 2021). UTCI, measured in degrees Celsius, uses a scale of thermal stress categories to reflect physiological responses to the environment. These categories span from extreme heat stress (+46°C or more) to extreme cold stress (−40°C or less), with varying degrees of heat and cold stress in between. UTCI values between +9°C and +26°C correspond to a no stress (neutral) category.
In this study, we computed UTCI at a very high resolution (1 meter per pixel) using the four components (i.e., air temperature, relative humidity, wind speed, and mean radiant temperature). We used the Solar and Long-Wave Environmental Irradiance Geometry (SOLWEIG) model, which is a well-established tool available in QGIS through the open-source Urban Multi-scale Environmental Predictor (UMEP) plugin (Lindberg et al., 2018). Several studies have reported on the reliability of the SOLWEIG model in estimating radiative fluxes in the urban environment (Lindberg et al., 2008; Thorsson et al., 2017).
The study focuses on a 7-day heatwave in Los Angeles, CA, from September 3rd to 9th, 2022 . We created hourly UTCI raster maps over this period for daylight hours (6:00 A.M.–7:00 P.M.), when solar radiation is most impactful. We then divided these hourly UTCI maps into three time periods: (1) morning peak (6:00 A.M.–10:00 A.M.), (2) midday (10:00 A.M.–3:00 P.M.), and (3) evening peak (3:00 P.M.–7:00 P.M.), resulting in three separate UTCI stacks. For each time period during the heatwave, we calculated both the pixel-based mean and 95th percentile of UTCI across the stacks. We opted to consider the 95th percentile as well since it is less likely to be influenced by outliers compared to the mean and can effectively highlight areas with frequent, high UTCI values. By combining the mean and 95th percentile, we can capture both typical and extreme heat hazards experienced by pedestrians throughout the day. We then normalized the mean and 95th percentile maps to a 0–1 scale and multiplied them together. During this normalization, we used the overall minimum and maximum UTCI values (instead of by time period), ensuring a consistent representation of heat stress impact across different periods (morning, midday, and evening). This approach maintains a 0–1 scale for the final heat hazard maps, where a higher value indicates a greater heat hazard. We summarize the pipeline leading to the creation of the three heat hazard maps in Figure 1. Pipeline for the creation of UTCI-based heat hazard maps, segmented into three distinct time periods: morning peak (6:00 A.M.–10:00 A.M.), midday (10:00 A.M.–3:00 P.M.), and evening peak (3:00 P.M.–7:00 P.M.).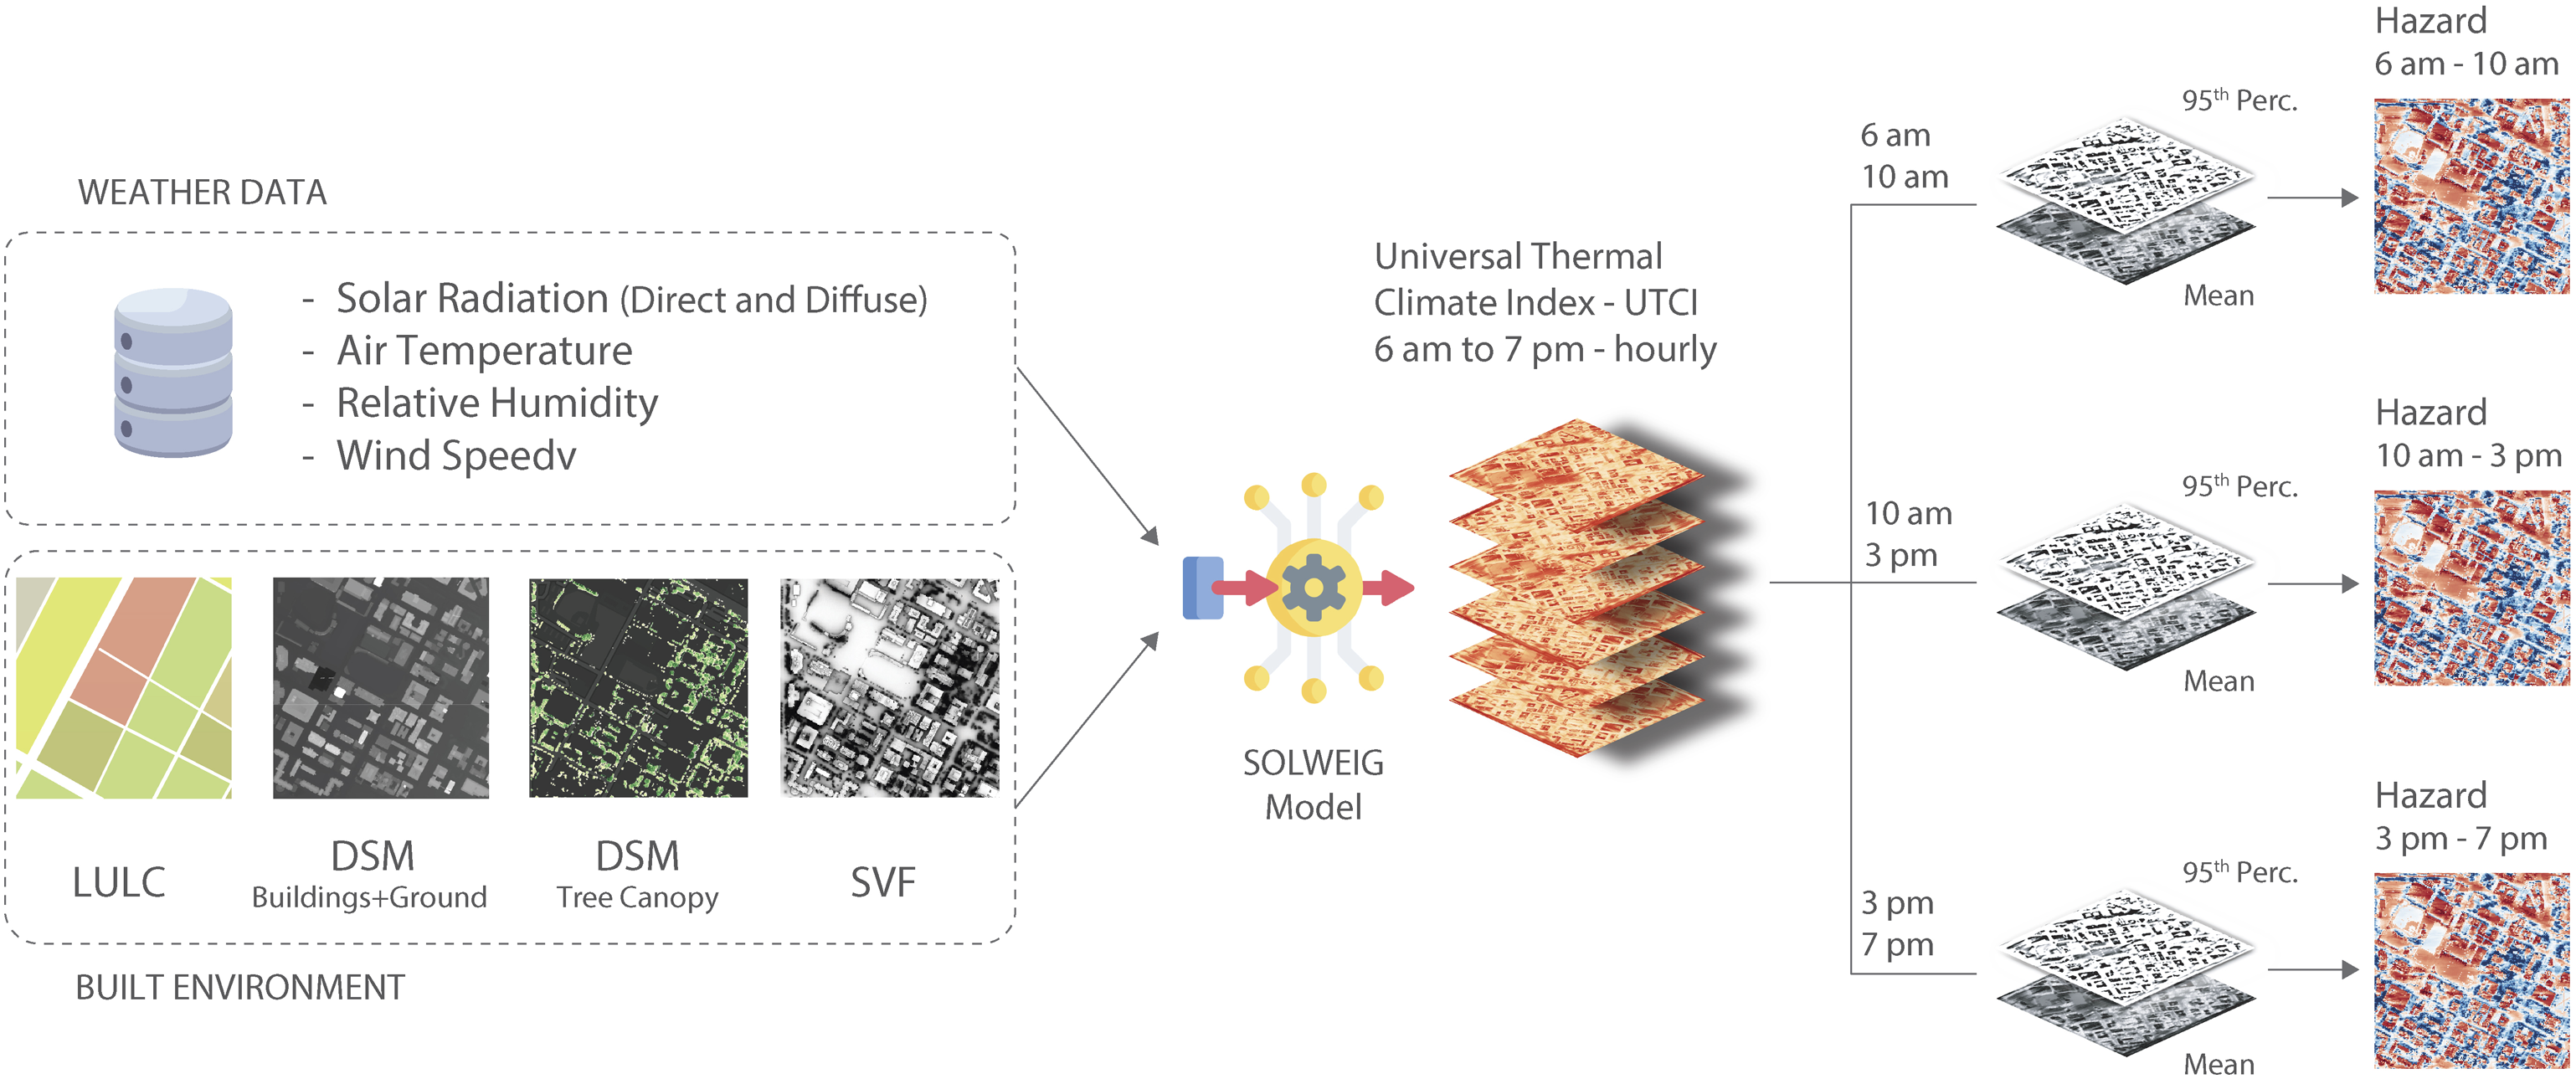
Heat exposure: Pedestrian volume
Heat exposure relates to the potential presence of people in areas where high temperatures can adversely affect their health and well-being by causing heat stress and discomfort. In this study, we considered how people are exposed to extreme heat as they walk from their homes (origins) to five critical destinations—(1) bus stops, (2) train stations, (3) parks, (4) public schools, and (5) commercial amenities (such as retail, food and beverage services, personal services, and entertainment businesses). We chose to focus on these five critical destinations as we believe they represent essential destinations that should be accessible to every urban resident within a reasonable walking distance without having to experience hazards (such as extreme heat or the lack of safety). As the transportation planning profession slowly transitions from viewing its objective as increasing mobility to increasing accessibility, we argue that it would behoove us as members of this community to consider essential destinations (such as the five we considered) in the measurement of accessibility, especially for people who walk.
We modeled pedestrian trips between homes and these five destinations using the Urban Network Analysis (UNA) framework in the newly developed open-source “Madina” Python library (Sevtsuk and Mekonnen, 2012; Alhassan and Sevtsuk, 2024). As mentioned earlier, we considered both origins and destinations as address-level points, which go beyond larger geographical units, such as Census block groups or tracts that have typically been considered in the automobile-focused transportation modeling literature. Moreover, we created and used a sidewalk network as opposed to a street centerline network that has been used in most prior studies on pedestrian mobility modeling, recognizing that even two sides of the same street can provide very different walking experiences.
The pedestrian mobility model in the UNA framework routes pedestrian trips between origins and destinations based on destination accessibility and geometric properties of the sidewalk network (such as street connectivity). Trips are generated from the origin based on origin weights, which we consider to be the number of people living at each home location. The model incorporates several behavioral nuances, such as pedestrians being willing to walk only up to a certain distance threshold (e.g., a half mile or 800 m). The model does not assume pedestrians walk the shortest route to each destination. Instead, we find all routes up to a certain detour ratio (e.g., 1.15 times) longer than the shortest route and assign equal probabilities to all such routes to capture idiosyncratic route choice preferences. Since many route alternatives tend to overlap, especially along the shorter paths, more direct paths naturally obtain higher probabilities.
The routing algorithm provides estimates of pedestrian volumes for each of the five trip types (corresponding to the five destinations), as well as total volumes, on each segment of the sidewalk network. We provide a more detailed explanation of the pedestrian mobility model, along with parameter assumptions (Table S1), in Section A: Expected Pedestrian Volumes (Betweenness Flows) of Supplementary Materials. Since these pedestrian volume estimates are not temporally varying, we used Streetlight pedestrian count data from Los Angeles to calibrate three models for three different time periods (i.e., morning peak, midday, and evening peak). As a result, we obtained calibrated estimates of pedestrian volumes on the sidewalk network for these three time periods in alignment with the temporally varying heat hazard maps. This approach allows for examining the spatiotemporal distribution of pedestrian heat exposure in relation to critical destination types at a resolution higher than previously observed.
Heat vulnerability: Young children and older adults
Heat vulnerability is shaped by a range of social, economic, and environmental factors that impact the ability of individuals or population groups to cope with the impacts of heat hazards. It can depend on age, health status, and access to resources such as air conditioning or healthcare. Older adults, young children, and individuals with chronic medical conditions are much more likely to be vulnerable to extreme heat effects (Åström et al., 2011; Ebi et al., 2021). Factors such as poverty, race, social isolation, and limited access to public or private motorized transportation can also affect the distribution of impacts, potentially leading to inequities among different sociodemographic groups (Hsu et al., 2021; Reid et al., 2009). Lower-income individuals, in particular, are more likely to depend on walking as a mode of transportation, which can increase their vulnerability to heat hazards (Karner et al., 2015). Consequently, these groups have a higher likelihood of experiencing adverse effects from climate change and enduring disparities in health outcomes. Addressing these vulnerabilities and inequities is essential to foster a more resilient and inclusive approach to extreme heat events and climate change impacts (Ross, 2022).
In this study, we chose to consider age as the sole factor in determining heat vulnerability. This was done to demonstrate the application of our proposed heat risk assessment framework as a proof-of-concept. As mentioned earlier, there are several factors in addition to age that can influence heat vulnerability and future work should incorporate a more multi-dimensional approach to the measurement of vulnerability. We focused on young children (aged below five) and older adults (aged over 65) in particular, recognizing their higher reliance on walking as a mode of transport and their heightened susceptibility to extreme heat due to their inherent physical characteristics. The spatial distribution of the home locations of these population groups is combined with the hazard (UTCI) and exposure (pedestrian volume to critical destinations) to estimate risk at each home location. Further details about how these components are combined to compute heat exposure and heat risk are provided in the following sections.
Research methods
Study area
Our area of focus for this study is approximately 6 km × 6 km in size and centered around the intersection of Exposition Boulevard and Vermont St. in Los Angeles, CA (Figure 2). This area, which covers a large part of downtown, South-Central LA, and Skid-Row (the highest concentration of unhoused population in California), encompasses neighborhoods of starkly contrasting incomes, ethnicities, and demographic attributes. While we demonstrate the application of our proposed heat risk assessment framework in this study area as a proof-of-concept, the framework can be applied to other (and larger) areas around the world, provided the required data are available. Map of the study area in Los Angeles, CA (centered around the Expo neighborhood) with a zoomed-in section illustrating the sidewalk-level heat hazard (UTCI).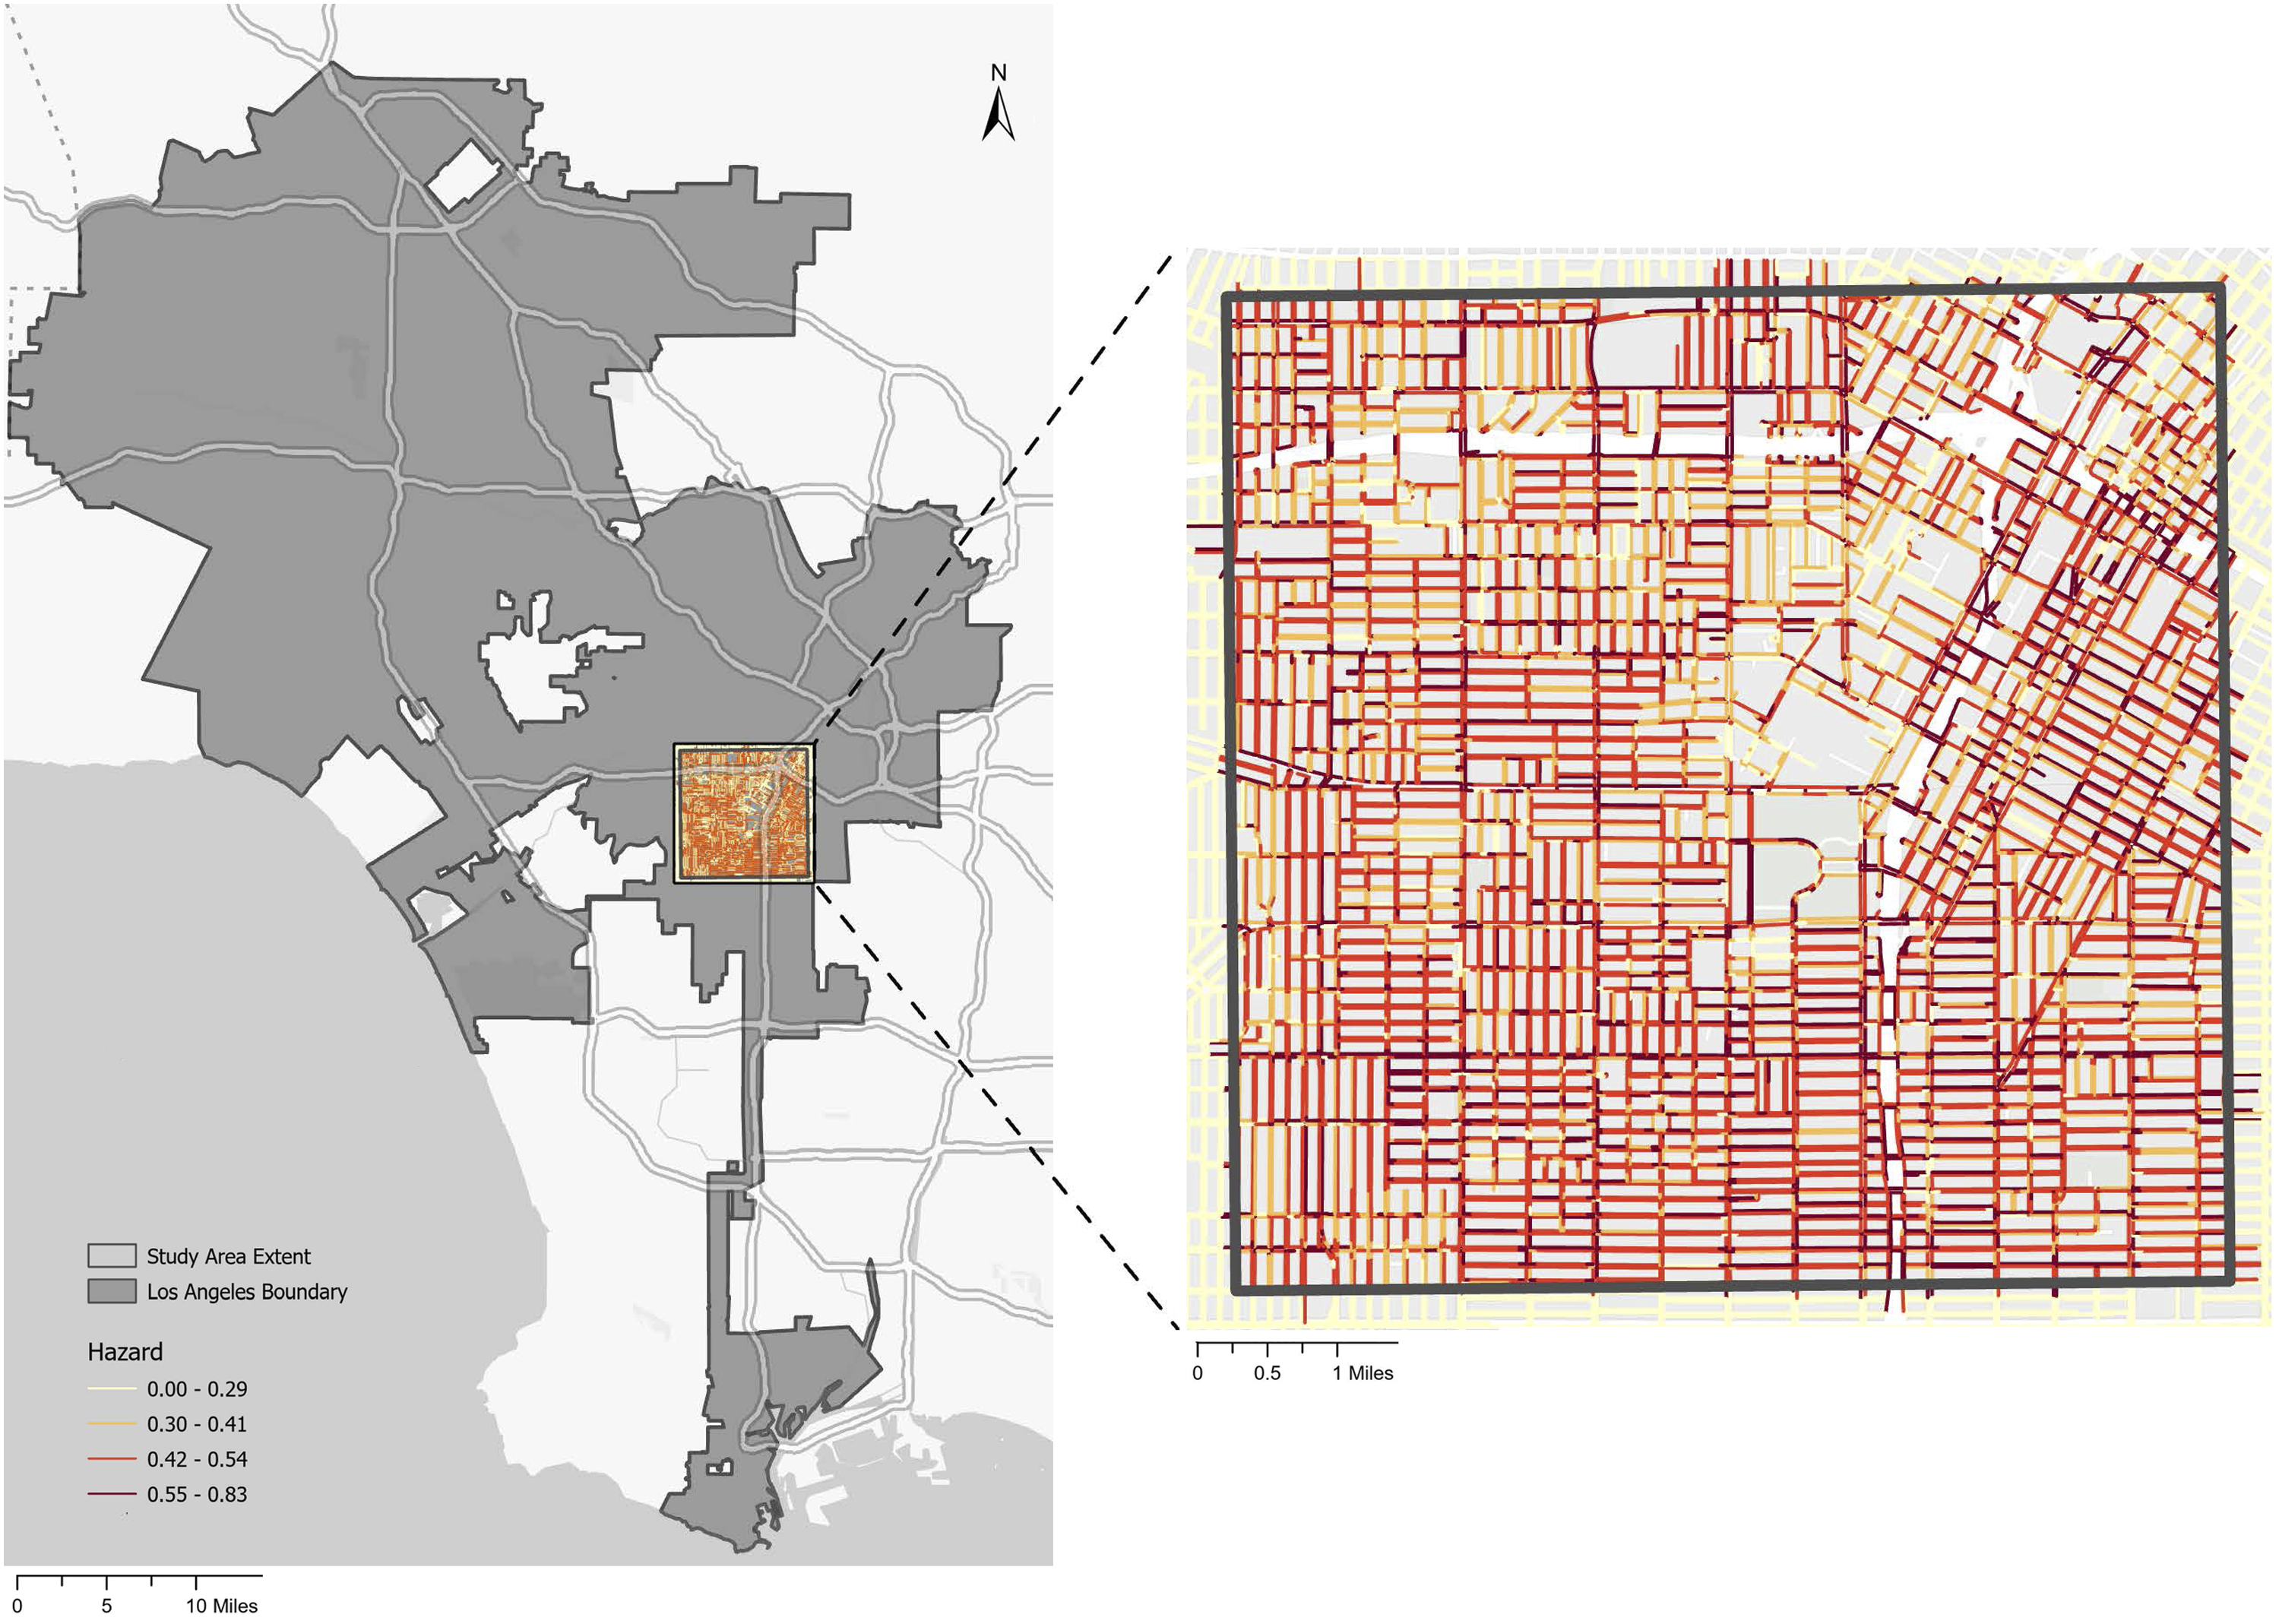
The study area contains diverse land uses, such as residential neighborhoods, commercial districts, recreational spaces, and public amenities. The area includes several metro transportation corridors, the University of Southern California campus, and the future 2028 Olympic Village. The City of Los Angeles has been investing heavily in public transportation in recent years, due to which this area has witnessed an expansion in rail service, where several new lines and stations (Expo Line, Downtown Connector, along with new stations) have opened. However, the low-density built environment in Los Angeles often forces pedestrians to walk for relatively long distances to and from public transit stations. The propensity for longer walking trips, coupled with increasingly hot temperatures in Los Angeles, makes this area an interesting region to consider.
We used a 7-day heatwave from the 3rd to the 9th of September, 2022, in Los Angeles, CA as an example through which we demonstrated the application of our heat risk assessment framework. We identified the heatwave by comparing the daily maximum temperature of each day from June to September 2022 with the 90th percentile of the daily maximum temperature of the corresponding day over a reference period from 1980 to 2022 (Figure S2). This heatwave, spanning a rather prolonged period, offered an apt scenario to apply our proposed framework to.
Data
A wide variety of data sources is used to model the UTCI and pedestrian mobility for this study. The ERA5 high-resolution dataset from the Copernicus Climate Change Service (C3S) at the European Centre for Medium-Range Weather Forecasts (ECMWF) combines observations with weather prediction models to offer a complete dataset with hourly temporal resolution (Hersbach et al., 2020; Jiao et al., 2021; McNicholl et al., 2021). A Digital Surface Model (DSM) derived from LiDAR data provides 2.5D models for buildings and trees. The DSM, along with a 2016 Land Use Land Cover (LULC) dataset and meteorological data, are the main inputs used to model UTCI (see Figure 1).
We constructed a pedestrian network using the open-source Tile2Net framework (Hosseini et al., 2023) and used it in this study instead of the more commonly used street centerline network. Using a sidewalk network helps us model and route pedestrian trips according to available pedestrian infrastructure, while also considering the different sides of streets and crosswalks. We used home locations as origins and the aforementioned five critical destinations (bus stops, train stations, parks, public schools, and commercial amenities) at the level of address points. We obtained these data from the Los Angeles GeoHub and the General Transit Feed Specification (GTFS). We used data from the U.S. Decennial Census 2020 to obtain resident counts (population) and proportions of vulnerable pedestrians (young children and older adults) at the block group level, which we then redistributed proportionally from block groups to residential buildings.
Finally, we used StreetLight data to calibrate segment-level pedestrian volumes (StreetLight Data Inc., n.d.-b, n.d.-a). These data provide estimates of volume and activity by mode of transportation (walking, biking, and automobiles) for specific zones or segments. In particular, we used the foot traffic (pedestrian) volume index which is a proxy of the number of people walking. This index, available for every day of the week, is segmented into three daily time periods—(a) Morning peak (6:00 A.M.–10:00 A.M.), (b) Midday (10:00 A.M.–3:00 P.M.), and (c) Evening peak (3:00 P.M.–7:00 P.M.). We provide additional details in Section B: Data Sources of Supplementary Materials.
Analytical framework
Pedestrian volume calibration
Although we had obtained expected pedestrian volumes from the pedestrian mobility model through the UNA framework, they have a couple of limitations. First, they are “expected” volumes, based on an assumption that everyone living at an origin location would choose to walk to the selected destinations. On its own, this assumption is inaccurate, especially in a context as auto-dependent as Los Angeles. Second, they do not vary temporally. These expected pedestrian volumes are available for each segment but do not change over the course of the day, which does not align with our understanding of temporally varying pedestrian activity patterns, especially during heat waves. Therefore, we undertook an additional step to calibrate these expected pedestrian volumes based on observed count data.
While actual pedestrian counts would be ideal, such data are not available to us for this study area. We opted to use Streetlight data instead as a proxy for pedestrian counts. Streetlight provides indices to represent traffic volume and activity separately for vehicles, bicyclists, and pedestrians. These indices are segmented by time-of-day (morning peak, midday, and evening peak), day-of-week (weekday and weekend), and location. We chose to focus on weekday pedestrian volume indices for three time periods—morning peak (6:00 A.M.–10:00 A.M.), midday (10:00 A.M.–3:00 P.M.), and evening peak (3:00 P.M.–7:00 P.M.). We obtained these data for all locations within the study area and processed them to obtain an average pedestrian volume index for each segment in the sidewalk network for each of the three time periods mentioned earlier. These temporally-varying segment-level indices (dependent variable) were used to calibrate pedestrian volumes stemming from five different trip types—walking from homes to bus stops, train stations, parks, public schools, and commercial amenities (independent variables).
Pedestrian volume model calibration results for three time periods.
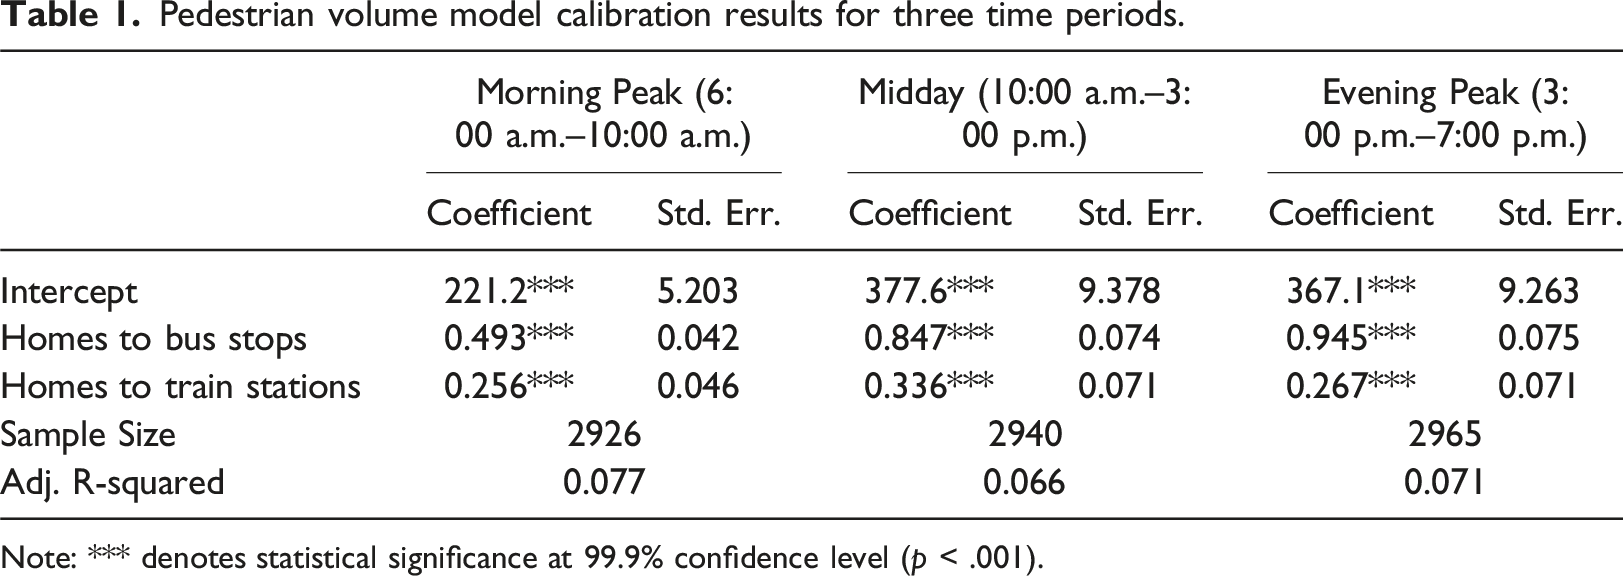
Note: *** denotes statistical significance at 99.9% confidence level (p < .001).
These coefficients were then multiplied with expected pedestrian volumes on each segment to obtain calibrated total pedestrian volumes. For example, if the expected pedestrian volume on a segment was estimated to be 1,000, then the calibrated total volume during the morning peak would be ((0.493 * 1000) + (0.256 * 1000) = 749). Similar calculations yielded calibrated total pedestrian volumes for the midday and evening peak periods on each segment of the sidewalk network.
Heat exposure index
In order to identify hotspots where a large number of pedestrians might experience high heat stress while walking to critical destinations, we created a heat exposure index (HEI) that combines heat hazard (UTCI) and heat exposure (pedestrian volume). As both heat hazard and exposure are computed for each segment in the sidewalk network, we obtained segment-level HEI values. This provides valuable insights to planners and policy-makers for designing and implementing targeted adaptation measures at the level of each sidewalk.
We first computed the average UTCI value for each segment that represents the segment-level hazard. We created a buffer around each segment in the sidewalk network and overlaid it against the UTCI raster layer (that we had created with a 1-meter spatial resolution). We calculated the average UTCI across all the pixels that intersected with the segment buffer and assigned it to that segment as its heat hazard. We also estimated the total pedestrian volume on each segment using the UNA modeling framework considering trips from homes to two critical destinations (i.e., bus stops and train stations). The other three critical destinations (parks, public schools, and commercial amenities) were not included as they did not feature in the calibrated models for any of the three time periods (see Section: Pedestrian Volume Calibration). The models were used to obtain segment-level calibrated total pedestrian volumes for three distinct time periods. The calibrated pedestrian volume on each segment represents the exposure on that segment, indicating the number of people who would likely be exposed to the heat hazard associated with that segment while walking from their homes to the selected destinations (i.e., bus stops and train stations).
After calculating segment-level heat hazard and exposure, we normalized both of them on a 0–1 scale. Normalization ensures that both components of the HEI have the same scale (or range) and that their influence on the HEI is balanced. We then multiplied the normalized hazard and exposure to obtain the HEI for each segment in the sidewalk network. Doing this combines the influence of both factors on the overall heat exposure as experienced by people walking from their homes to bus stops and train stations. A segment has high heat exposure when it has high heat hazard along with a large volume of pedestrians walking along that segment. This combination enables the identification of sidewalk segments that would benefit the most from adaptation strategies.
Heat risk
Measuring heat exposure on each segment of the sidewalk network can help inform targeted interventions that make it safer and more pleasant for people to walk along high-exposure segments. However, understanding the total heat risk that different population groups experience as they walk to critical destinations across the urban area over the course of the day is crucial to detecting and addressing inequities related to the spatial distribution of critical destinations, resilient sidewalk infrastructure, and, consequently, heat risk while walking. To that end, we propose a cumulative heat risk measure that is computed for each origin (home location) by combining home-based hazard, exposure, and vulnerability.
We built on our prior calculation of segment-level hazard to compute home-based hazard. For each origin (home location), we obtained all feasible routes to the selected critical destinations (bus stops and train stations) and computed weighted averages of the segment-level hazard values, with segment lengths as weights and UTCI as heat hazard. This aggregation is necessary as each route passes through multiple segments with different heat hazards. Then, the probabilistic assignment of trips from a home location to the two critical destinations along different routes was used to compute destination probabilities (i.e., the probability of a destination being chosen, given a fixed origin and a sidewalk network) and route probabilities (i.e., the probability of a route being chosen, given a fixed origin, destination, and a sidewalk network). We aggregated the product of the destination probabilities, along with the route probabilities (for a given destination) and the corresponding route-level mean hazards and lengths (for a given route). This cumulative probability product represents the accumulated hazard from a given origin, given the distribution of pedestrian trips from that origin to the two critical destinations along all feasible routes. We provide further details in Section C: Home-based Risk Formulation of Supplementary Materials.
To obtain measures of home-based exposure and vulnerability, we used Census data on counts of all residents and vulnerable population groups (i.e., young children and older adults) at the block group level and interpolated them to the scale of an address point (home location) through a proportional volume split approach. We only considered address points that were tagged as residential land use or mixed land use with a residential component and redistributed counts from the block group proportional to the gross floor area corresponding to residential use at each address point in the block group. We then applied the coefficients from the calibrated pedestrian volume models (see Table 1) to translate population counts to calibrated counts of people who walk (as not every resident would choose to walk from their home to the two selected destinations).
We then normalized all three of these metrics (home-based hazard, exposure, and vulnerability) to a 0–1 scale and multiplied them. The cumulative product can be interpreted as the home-based heat risk, which was further normalized to a 0–1 scale. Thus, we assigned a heat risk value between 0 and 1 to each home location, with a higher value indicating a greater risk faced by people living at that location when they walk to the two selected destinations (bus stops and train stations) considering all feasible routes.
Results
Mapping high-exposure sidewalks
High-exposure sidewalks can be identified through the Heat Exposure Index (HEI), which we computed by combining the segment-level UTCI-based heat hazard and the exposure (calibrated pedestrian volume) on each segment of the sidewalk network. High-exposure sidewalks have high HEI values, that is, these sidewalks have a high level of heat hazard and large numbers of people walking from their home locations to bus stops and train stations. Only these two destinations are considered based on the model calibration results. The spatiotemporal variation in segment-level HEI is shown in Figure 3. The top row shows segment-level Heat Exposure Index (HEI) within the 6 km × 6 km study area during the three time periods—morning peak (6:00 a.m.–10:00 a.m.), midday (10:00 a.m.–3:00 p.m.), and evening peak (3:00 p.m.–7:00 p.m.). The middle and bottom rows show segment-level HEI and UTCI (at 1-m resolution) in three zoomed-in areas focused around four subway stations: (A) Expo/Western Station, (B) Expo Park/USC Station, and (C) LATTC/Ortho Institute Station and Grand/LATTC Station. Warmer shades (red) represent larger values, while cooler shades (blue) depict smaller values.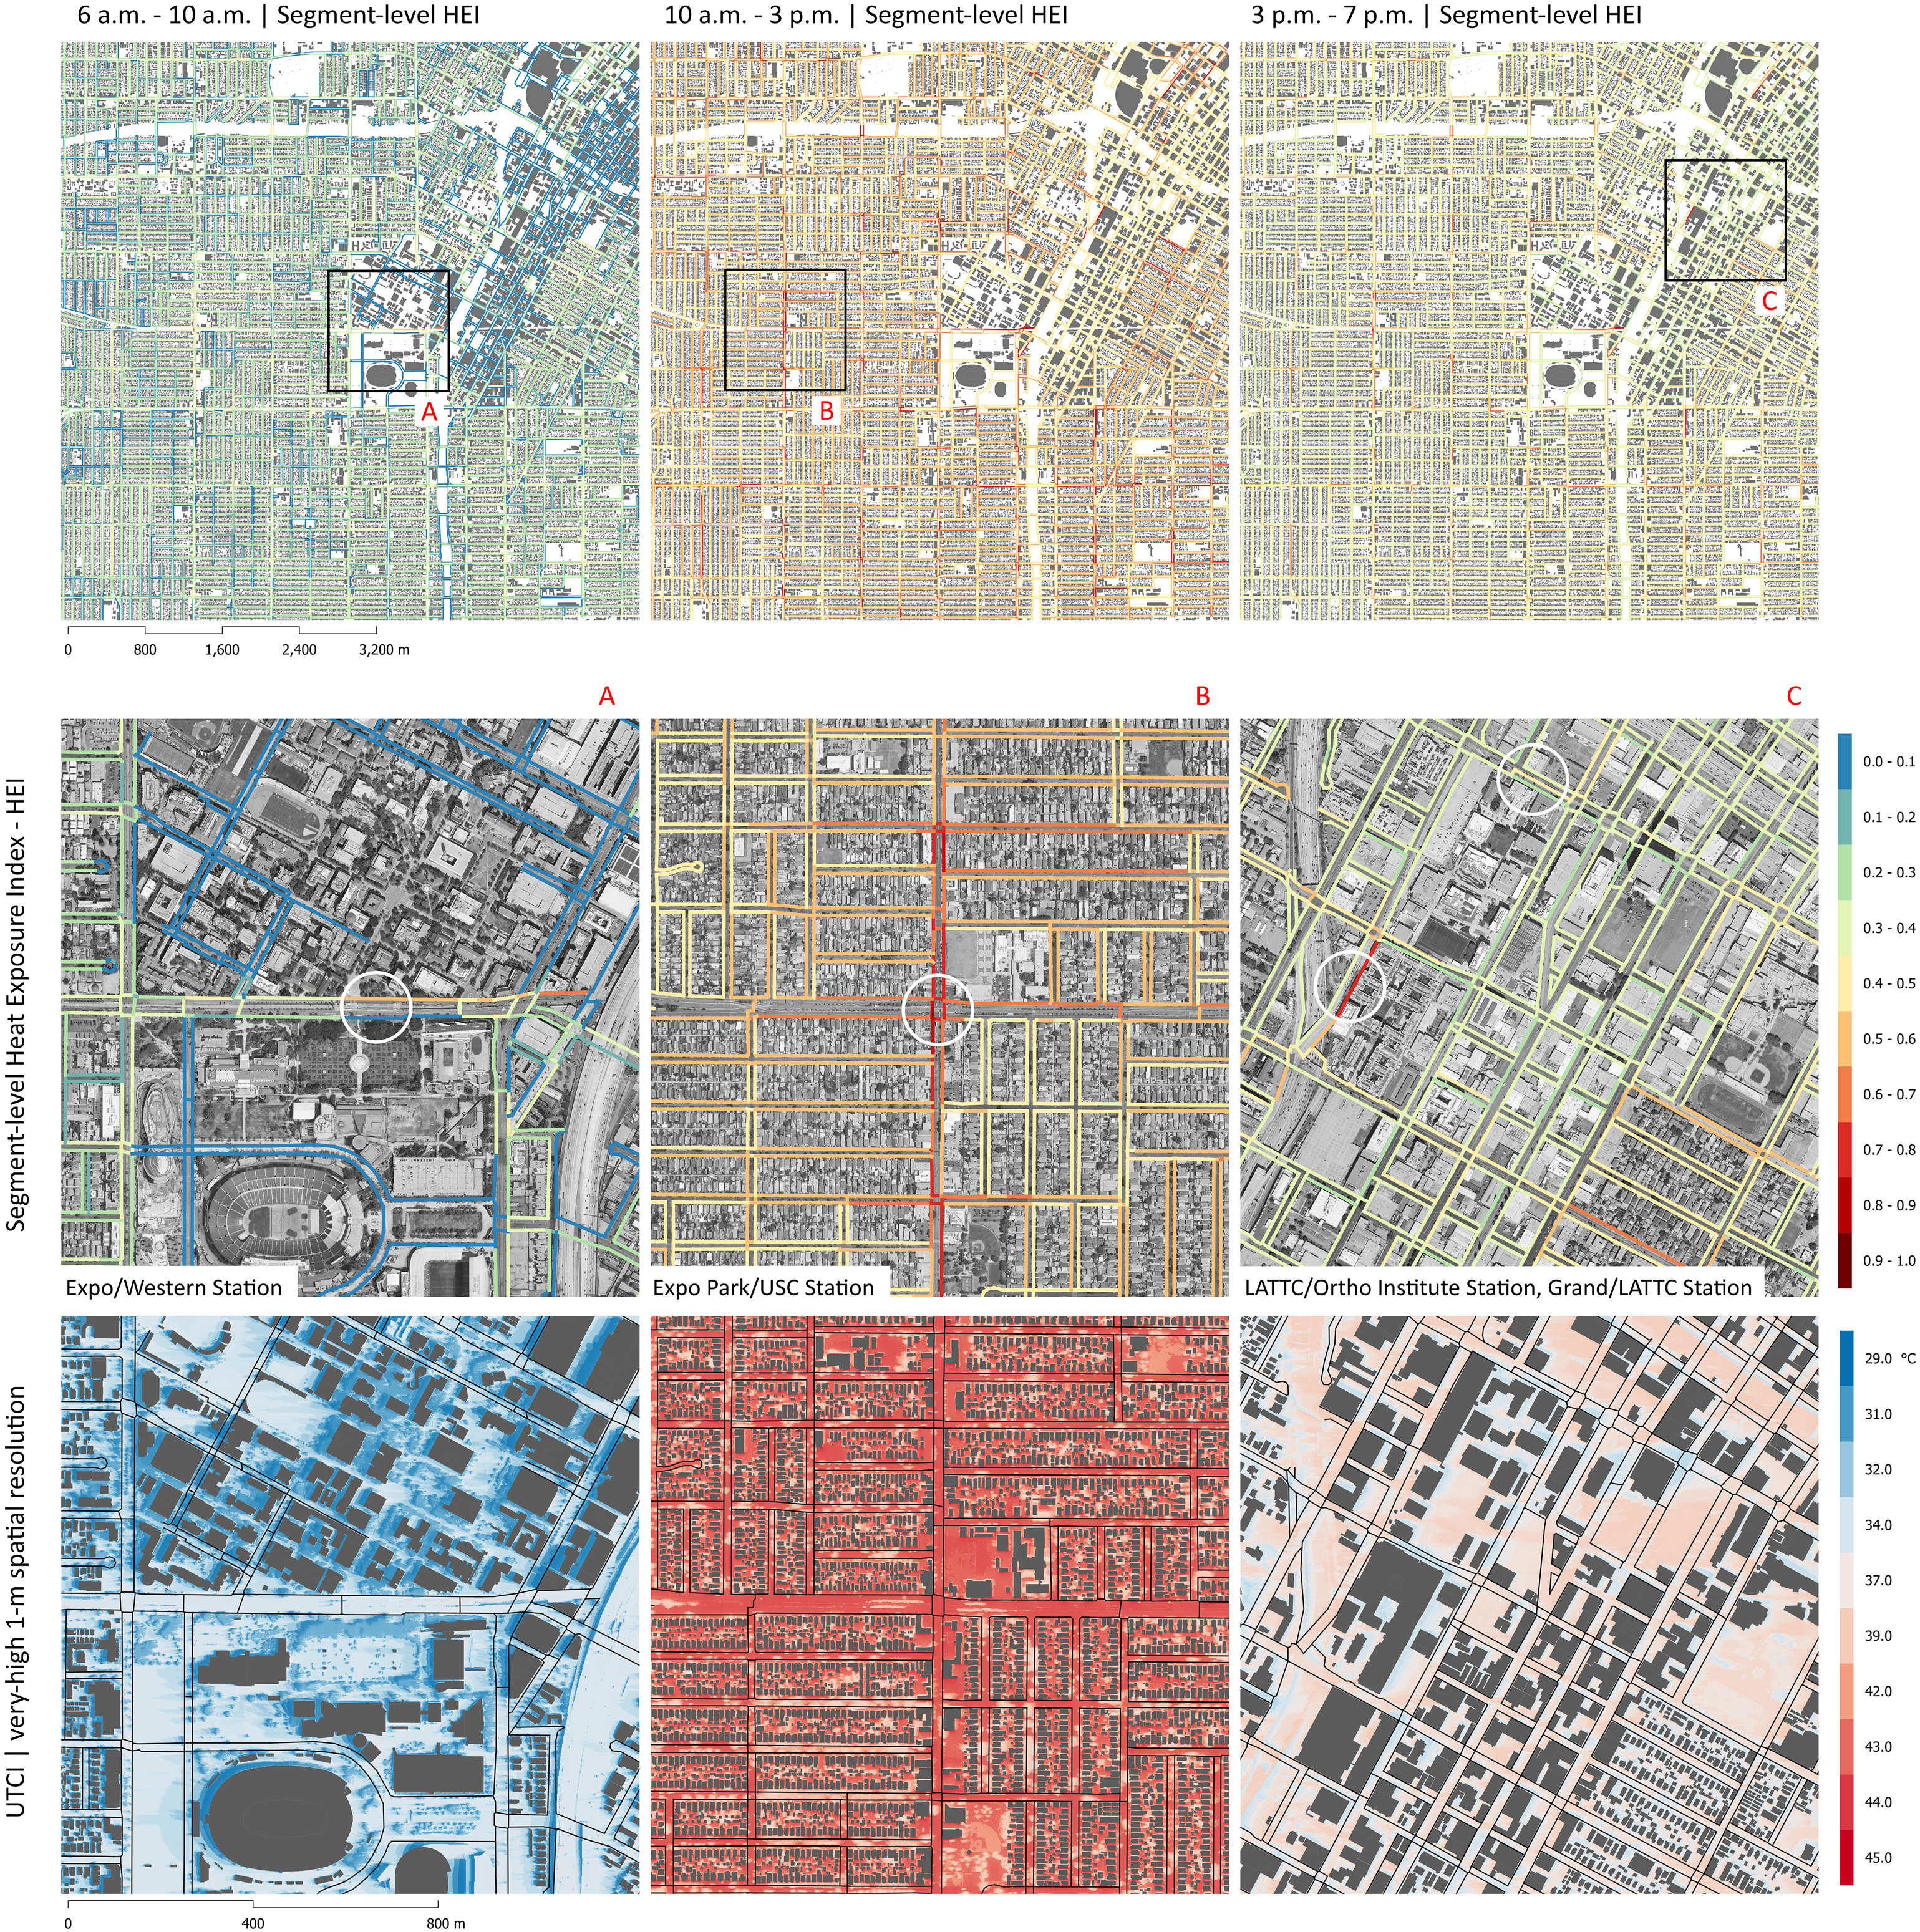
Upon examining varying levels of heat exposure intensity in the study area across different time periods, we identified the midday period (10:00 A.M. – 3:00 P.M.) as the most hazardous period. We also observed higher HEI values near residential areas where homes are located, while HEI values in the downtown region are much lower comparatively. This is because the HEI partially depends on heat exposure, which we measure by the number of people walking from their homes to bus stops and train stations within an 800-m walking distance. By using the sidewalk network, we were able to demonstrate asymmetric heat exposure intensity on streets. Not only can pedestrian traffic be unevenly distributed on opposing sidewalks of the same street (whereby one side experiences a higher volume of people walking), the shadowing effect of buildings and trees can mitigate heat hazard unevenly. This can lead to contrasting scenarios on the same street where one sidewalk has high heat exposure intensity while the opposite sidewalk has low exposure, which can only be captured if a sidewalk network is used in the application of our proposed heat risk assessment framework.
Key destinations or hubs, such as the Western Station (zoom-in area A of Figure 3) and the Ortho Institute Station (zoom-in area C of Figure 3) on the Expo Line, attract significant pedestrian trips from surrounding neighborhoods. Larger pedestrian volumes amplify heat exposure intensity. As a result, the pedestrian segments adjacent to these stations register higher HEI than other sidewalk segments in the immediate vicinity despite having similar levels of UTCI-based heat hazard. Although not exceptionally high in both magnified areas (zoom-in A and C), UTCI levels exceed 29°C, which is greater than the 26°C threshold typically considered indicative of no thermal stress. The zoom-in area B, as depicted in Figure 3, represents the most severe scenario with exceptionally high UTCI values. The combined use of heat hazard (UTCI) and exposure (pedestrian volume) helps identify specific sidewalks that warrant prioritization for interventions to enhance heat resilience.
A sidewalk-level heat exposure index captures variations from the perspective of a person walking and opens up opportunities to address the hazards with targeted urban design interventions. The results of this analysis can be leveraged to improve pedestrian comfort during heat waves, particularly when walking to key destinations such as public transit stations, commercial districts, and parks. This can be achieved by implementing targeted interventions such as tree cover, alternative pavement materials that reflect heat or absorb less heat, and adding supplementary shading structures on sidewalks that experience high pedestrian volume and significant heat hazard. Such heat adaptation strategies would make areas with high foot traffic more tolerable during periods of intense heat as well as contribute to the overall resilience of pedestrian infrastructure to high temperatures.
Identifying areas with high heat risk
Home-based heat risk provides a measure of the cumulative heat risk faced by people living at that location as they walk to bus stops and train stations. In addition to combining cumulative hazard (UTCI) and exposure (cumulative pedestrian volume), our proposed heat risk measure also incorporates vulnerability through the consideration of vulnerable age groups (young children and older adults) who live at each home location. Although we had originally considered five key destinations (bus stops, train stations, parks, public schools, and commercial amenities), only two (bus stops and train stations) were found to retain statistical significance during model calibration. Using the home-based heat risk measure, we can identify areas with high levels of cumulative heat risk, that is, where people who experience high levels of heat risk as they walk to bus stops and train stations live.
Figure 4 displays the spatiotemporal variation in heat risk at home locations within the study area. As the midday period (10:00 A.M. – 3:00 P.M.) has the highest heat risk among the three time periods, we considered this period for further investigation. We zoomed into three sections labeled A, B, and C for the midday period to illustrate the spatial heterogeneity even within the same time period. For each of these zoomed-in sections, we provide a Google Street View perspective for selected streets to emphasize the varying degrees of heat risk across these areas. Spatiotemporal distribution of cumulative heat risk at home locations for residents walking to bus stops and train stations, along with midday zoom-in areas and Google Street View perspectives of selected locations.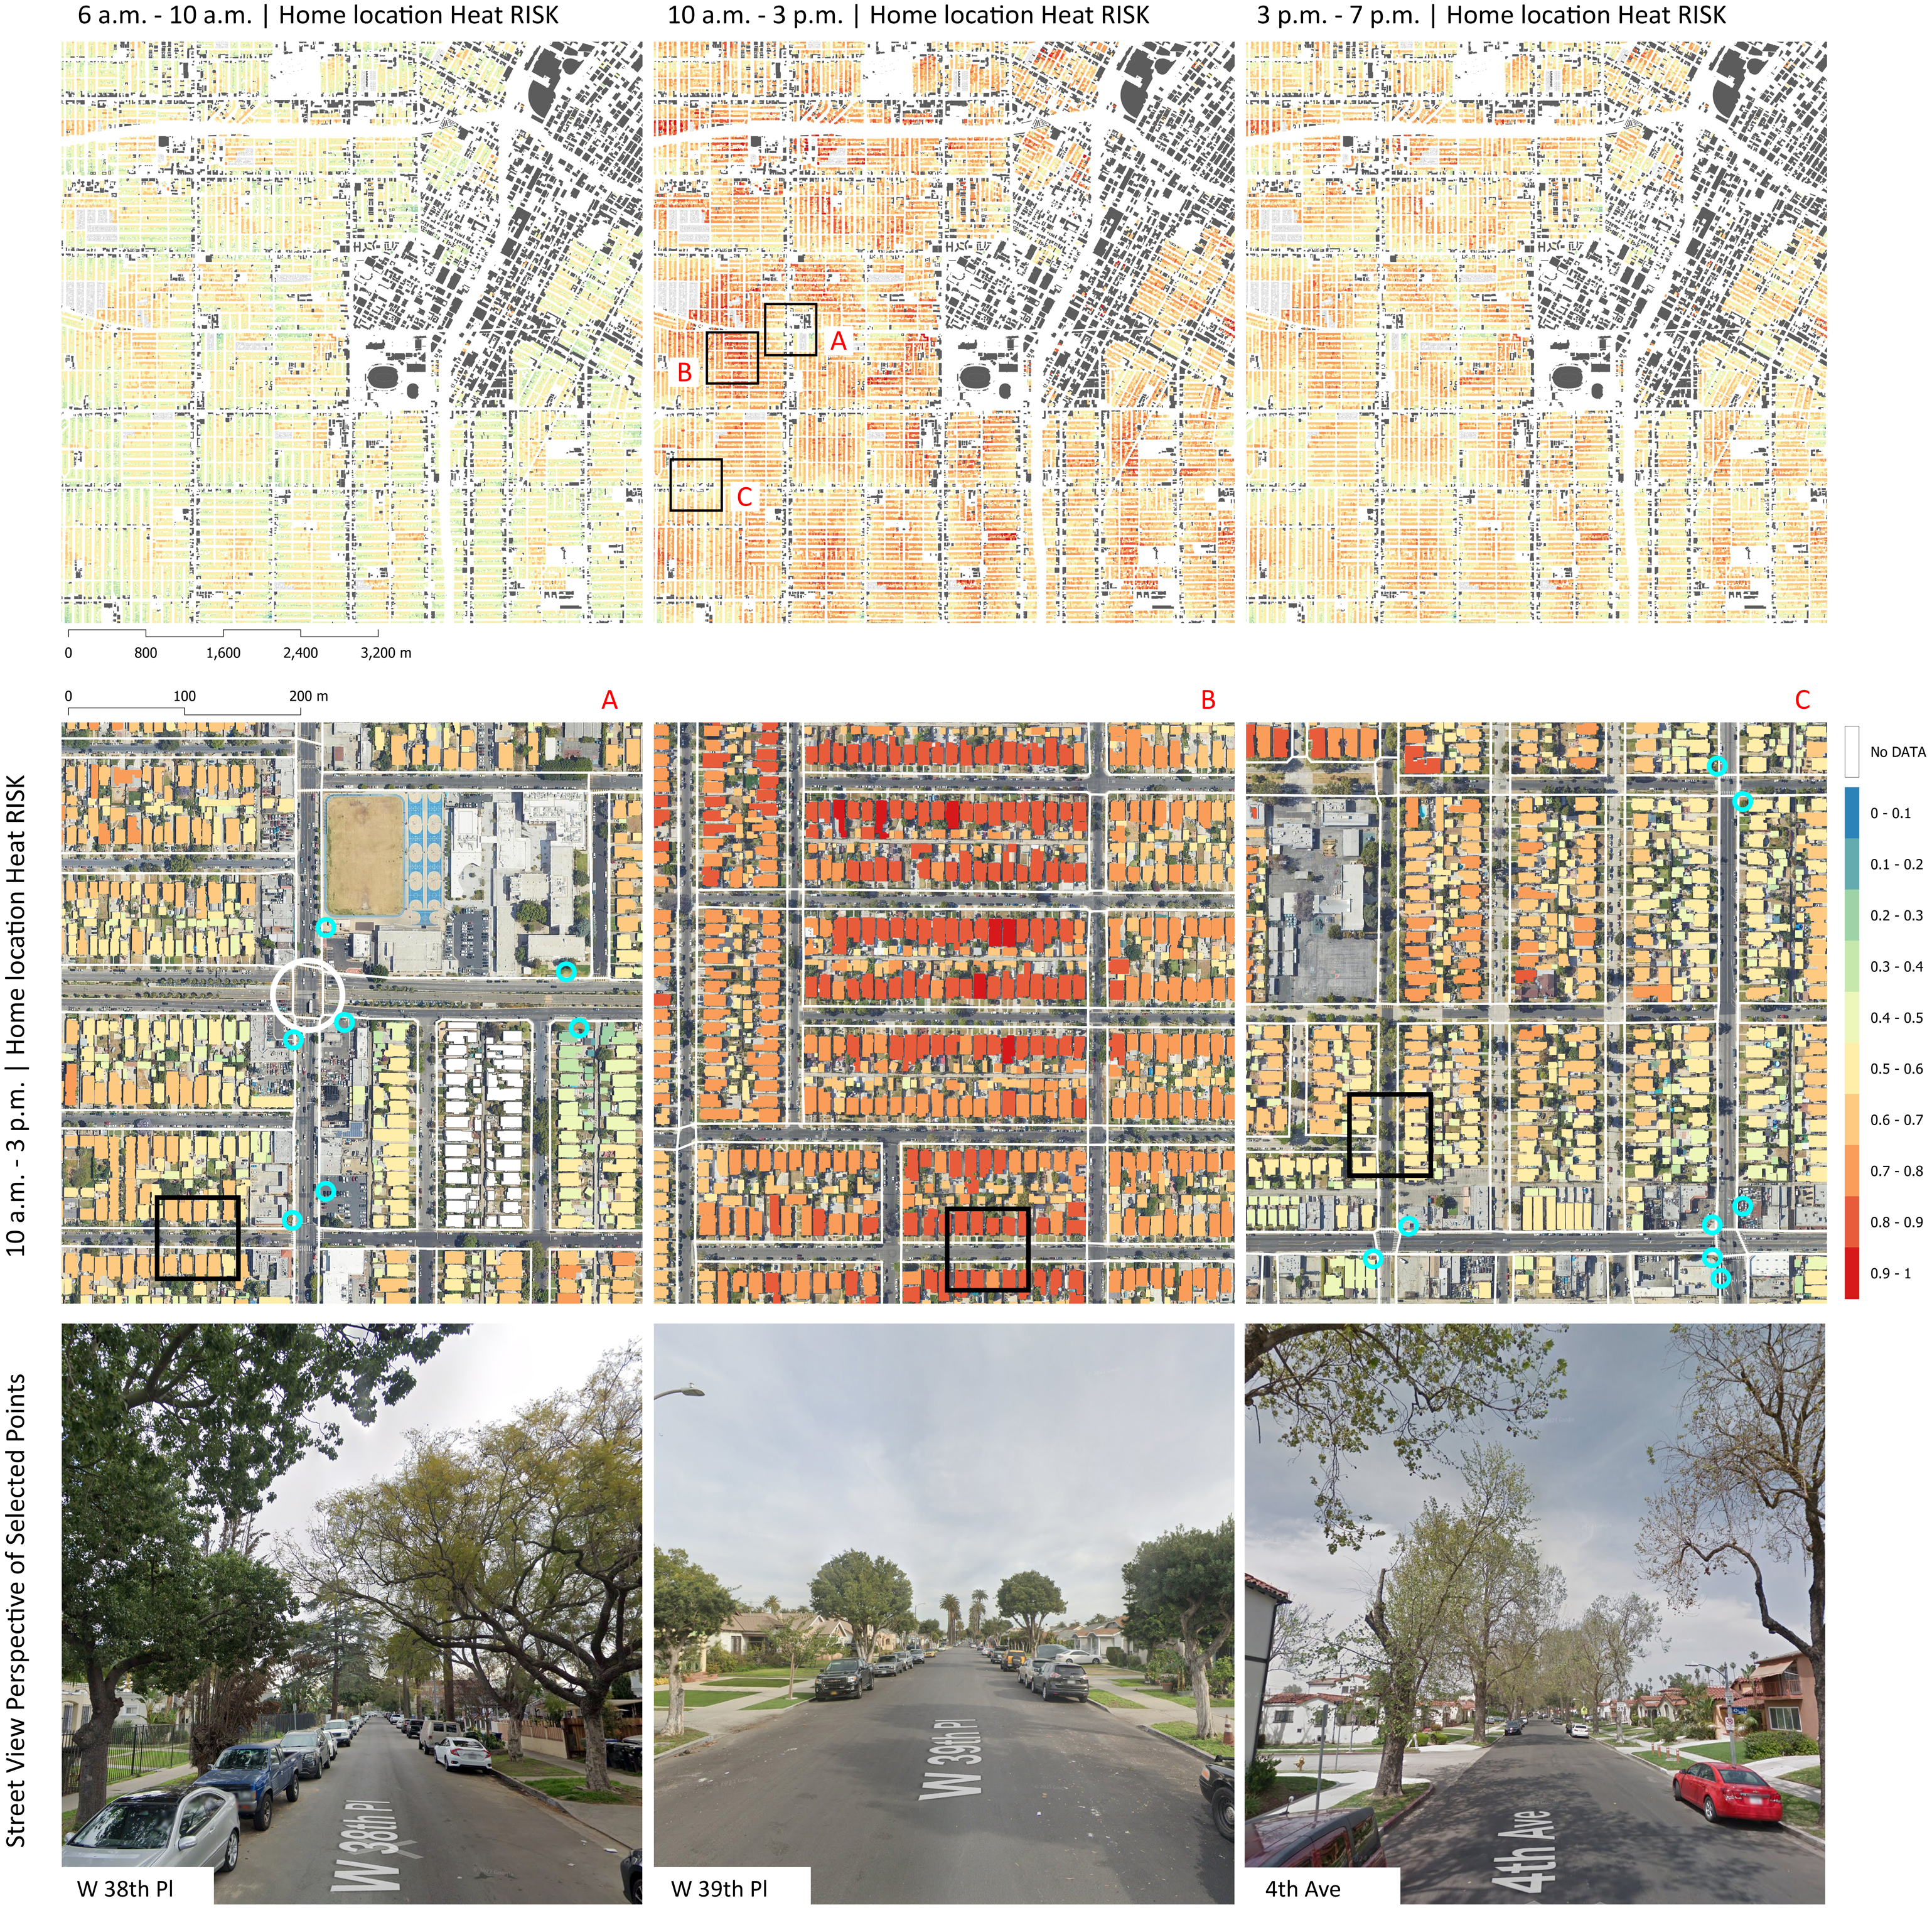
Heat risk is quantified on a 0–1 scale, where a higher value indicates a greater risk for residents walking from homes to bus stops and train stations. In addition to the share of vulnerable age groups living at a home location, heat risk accounts for the proximity of destinations within a walking distance, the attractiveness of those destinations, and the likelihood of choosing a particular destination and route to walk there. As a result, lower risk values can be attributed to both the presence of shading elements, such as trees, as well as the proximity of bus stops and train stations. While shade can reduce the hazard experienced by people walking, proximate destinations reduce the distance people have to walk, thereby reducing exposure. This is evident in zoom areas A and C, where the white circle represents the Expo Park subway station, and the smaller cyan circles indicate bus stops. The proximity to public transit reduces walking time and exposure to heat. Concurrently, tree canopy along the segment, as shown in the Google Street View images, significantly lowers heat risk. In contrast, zoom-in area B shows higher risk values due to the absence of nearby public transit and reduced tree canopy-induced shading.
Our proposed heat risk assessment framework can also be used to highlight gaps in pedestrian infrastructure. In Figure 4, zoom-in A shows a block where each home (in light gray color) is labeled “No DATA” with no risk values. This block is isolated because the sidewalks around it are not connected to the rest of the pedestrian network, such as through crosswalks, as seen in the image. This block can be thought of as an “island” in the sidewalk network as trips are not being generated from homes on this block to any destination. However, this does not imply that people walking from homes on this block do not experience heat risk. Rather, we cannot determine the heat risk values because of the lack of connection to the pedestrian network. This example highlights an additional benefit of our approach, which is sensitive to the degree of interconnectedness in pedestrian infrastructure, allowing us to identify critical areas where improvements in connectivity are needed.
These findings provide valuable insights into home locations where individuals, particularly vulnerable populations, may experience high heat exposure and risk while walking to specific destinations. By combining spatially explicit hazard data and pedestrian exposure with interpolated sociodemographic data at the address-point level, we can assess the differential impacts of heat stress on various populations within specific areas. This is crucial for understanding the social dimensions of heat-related issues and ensuring that vulnerable communities receive appropriate support and that mitigation actions are implemented more effectively.
Discussion
With accelerating urbanization and climate change, extreme heat events are becoming more frequent and gaining intensity. Urban heat islands exacerbate health risks, economic disparities, and social inequities. Urban heat risk disproportionately affects lower-income populations, elderly individuals, children, and those with pre-existing health conditions. These groups often reside in areas with limited green spaces, higher population densities, and poorer infrastructure, all contributing to elevated exposure to extreme heat. Socioeconomically disadvantaged communities are less likely to have access to the resources and infrastructure necessary to cope with heat waves, including air conditioning, cooling centers, and healthcare services (Klinenberg, 2001, 2015). Therefore, we need to examine urban heat risk with an equity lens. This involves assessing heat exposure and vulnerability at a granular level, considering the specific needs and conditions of different population groups.
This study highlights the critical need to integrate climate-resilient strategies into urban planning and policy-making to effectively mitigate urban heat risk. Climate-responsive planning requires continuous monitoring and adaptive management, with regular updates to building codes, zoning laws, and land-use plans reflecting the latest climate projections and heat risk assessments. Along with advancing environmental sustainability goals, climate-responsive planning needs to incorporate spatial and social equity.
Likewise, we believe that climate-responsive urban design is crucial in heat risk mitigation. Green infrastructure, such as parks and urban forests, can significantly lower temperatures and solar radiation impact. These elements provide shade, enhance evapotranspiration, and reduce the overall heat burden on people who walk and bike. Targeted interventions can create heat-resilient environments that promote active mobility and prioritize vulnerable groups’ health and well-being. When designing public spaces with cooling features such as shade and water, access and affordability, especially for historically marginalized communities, needs to be a key consideration.
Heat exposure while walking and biking poses a challenge not just to urban sustainability but to equity as well. Socially disadvantaged groups, such as lower-income individuals and zero-vehicle households in auto-dependent cities, are more likely to walk, bike, and use transit and, as a result, are disproportionately exposed to extreme heat while traveling (Karner et al., 2015). Conversely, the propensity to walk and bike decreases with an increase in socioeconomic status. More advantaged groups are comparatively more likely to have access to private automobiles or air-conditioning at their homes and/or workplaces. Moreover, wealthier neighborhoods in many U.S. cities contain more trees and shading than lower-income neighborhoods (McDonald et al., 2021). This suggests that efforts to mitigate heat exposure can provide disproportionate benefits to socially disadvantaged groups (Sheikh and van Ameijde, 2022).
We need to include the consideration of the impact of extreme heat on travel behavior in our transportation policies. To encourage more people to walk and bike, shaded pathways, water fountains, and resting areas can be provided to enhance comfort and safety. Public transit infrastructure needs to offer adequate heat shelter, including shaded bus stops and air-conditioned waiting areas. Increasing tree canopy cover, especially along high heat exposure routes, can mitigate extreme heat effects. Areas with high foot-traffic have to be prioritized for shading.
The findings of this research highlight that key mobility hubs, such as subways, can become highly vulnerable at certain times due to overcrowding and insufficient shading during periods of extreme temperatures. Concurrently, investments in active transportation infrastructure have to be paired with public awareness campaigns about their health and environmental benefits. Most importantly, policies must ensure equitable access to safe and comfortable mobility options across the spatial and sociodemographic spectrum.
Through this study, we demonstrated how advanced urban modeling methods that integrate high-resolution bioclimatic data and precise pedestrian mobility models can be used to conduct sidewalk-level heat analysis. Integrating climate data into urban planning, design, and transportation practices is crucial to anticipate future heat risks. Integrating top-down data, such as GIS and Remote Sensing, and bottom-up data reflecting people’s mobility behavior, including GPS trajectories and people counts, will be instrumental in shaping heat-resilient city design. Such explorations can help us better understand how different groups experience heat while traveling in urban environments. These efforts are key to identifying high-risk areas and implementing targeted adaptation measures. Such measures, which may include increasing tree cover, installing shaded walkways, and providing access to public cooling centers, have to be strategically and equitably deployed.
This study contributes to the emerging and increasingly important area of robust risk assessment methodologies for climate-proof and equitable planning, emphasizing outdoor heat-related risks during extreme heat events. However, it is not without a few limitations. Our definition of vulnerable groups is quite limited in scope as our goal in this paper was to demonstrate the application of our proposed framework as a proof-of-concept. Future research efforts could consider income, race, and accessibility to green infrastructure in their definition of vulnerability to account for systemic socio-spatial disparities in urban areas, especially in the U.S. We also did not consider any sociodemographic differences in walking behavior within our pedestrian mobility model owing to lack of granular data. Vulnerable groups, such as young children or older adults, may not be willing or capable of walking as far as the average pedestrian; nor may they take as many walking trips. These behavioral nuances need to be incorporated within the pedestrian mobility modeling framework, but the lack of reliable data forced us to assume uniformity. As we continue developing robust tools to enable climate-resilient planning, researchers might also want to examine heat exposure for biking trips, not just walking trips, as biking also involves time spent outdoors and potentially greater risk of heat stress.
Conclusion
Climate change and the associated increase in heat-related hazards pose a pressing threat to urban residents’ health and well-being. Pedestrians, in particular, are at risk of experiencing heat stress as they navigate urban environments. As cities seek to transition people away from using cars, a failure to account for the adverse effects of urban heat could severely challenge the first and last-mile pedestrian access to public transit and direct walking trips to critical destinations, potentially compromising the effectiveness of transportation decarbonization policies.
This study builds on the general risk assessment framework proposed by the IPCC to propose a granular and precise framework for assessing pedestrian heat risk in urban areas. Our framework combines pedestrian mobility modeling with urban microclimate to obtain high-resolution measures of urban pedestrian heat exposure and risk. We improved the spatial resolution of heat risk assessment by including pedestrian trips between different origins and destinations at the address-point level and a pedestrian network comprising sidewalks and crosswalks. As a result of this increased granularity and precision, our framework helps identify sidewalks with high heat exposure levels and home locations with high heat risk, accounting for trips from home to key destinations along different routes. We demonstrated how this framework can aid planners and decision-makers by applying it to an area within the Expo neighborhood in Los Angeles, CA. Our findings support evidence-based climate adaptation strategies and policy decisions essential for climate-proof planning and design.
Relying on open-source data and tools at each stage, this framework can be scaled up to a much larger area beyond the 6 km × 6 km study area we showcased in this paper. It also has the potential to be applied to any other urban area worldwide, provided the required input data are available. Moreover, the framework can be easily extended to examine other types of risks to pedestrians, such as air pollution and road safety. Building on the designed approach, a multi-dimensional pedestrian risk assessment framework could be explored for incorporation into the environmental impact review process, whereby developers would need to assess the additional risks any new developments might pose to pedestrians beyond increasing car traffic. This study is a first step in that direction and provides some evidence of how urban analytics and modeling can aid the planning of climate-resilient, sustainable, and equitable cities.
Supplemental Material
Supplemental Material - A sidewalk-level urban heat risk assessment framework using pedestrian mobility and urban microclimate modeling
Supplemental Material for A sidewalk-level urban heat risk assessment framework using pedestrian mobility and urban microclimate modeling in Nicola Colaninno, Rounaq Basu, Maryam Hosseini, Abdulaziz Alhassan, Liu Liu and Andres Sevtsuk in Environment and Planning B: Urban Analytics and City Science
Footnotes
Acknowledgments
This research was supported by the project ‘MultiCAST - Multiscale Thermal-related Urban Climate Analysis and Simulation Tool,’ which has received funding from the European Union’s Horizon 2020 research and innovation programme under the Marie Sklodowska-Curie grant agreement No 101028035.
Declaration of conflicting interests
The author(s) declared no potential conflicts of interest with respect to the research, authorship, and/or publication of this article.
Funding
The author(s) disclosed receipt of the following financial support for the research, authorship, and/or publication of this article: This research was supported by the project MultiCAST—Multiscale Thermal-related Urban Climate Analysis and Simulation Tool, which received funding from the European Union’s Horizon 2020 (H2020) Research and Innovation program under the Marie Skłodowska-Curie Action—Individual Fellowship—Global Fellowship (MSCA-IF-GF), with grant agreement number 101028035.
Correction (October 2024):
Some minor changes have been made in the Discussion section since the online publication of the article.
Supplemental Material
Supplemental material for this article is available online.
References
Supplementary Material
Please find the following supplemental material available below.
For Open Access articles published under a Creative Commons License, all supplemental material carries the same license as the article it is associated with.
For non-Open Access articles published, all supplemental material carries a non-exclusive license, and permission requests for re-use of supplemental material or any part of supplemental material shall be sent directly to the copyright owner as specified in the copyright notice associated with the article.