
Abstract
The implementation of sustainable urban lighting infrastructure is of paramount importance to promote healthy habits, mitigate the impact of light pollution on humans and wildlife, and balance out energy consumption. However, the analysis of alternatives for implementing lighting interventions in urban spaces is a laborious and time-consuming task, often involving the use of multiple tools. Also, the design of lighting infrastructure often demands a balance of conflicting needs and variables (e.g., aesthetics, human perception, impact on wildlife, and energy consumption). In this paper, we introduce NorDark-DT, an urban digital twin to support urban lighting infrastructure planning and analysis. We present the main requirements addressed in its design and development, its architecture and components, and illustrate its use in compelling usage scenarios related to the assessment of lighting intervention options in two study areas in Ålesund (Norway) and Uppsala (Sweden). We also discuss challenges and lessons learned during the development of NorDark-DT, providing valuable insights to developers, stakeholders, and practitioners interested in the creation of urban digital twins or similar tools.
Introduction
Significant population growth during the last decades and the consequent expansion of cities have imposed several challenges for the management of urban areas and the quality of life of their citizens (UN-Habitat, 2022a, 2022b). Among these challenges is the increase in traffic bottlenecks, waste management, higher demand for energy, light pollution, and reduced accessibility to natural areas (UN-Habitat, 2023). In this scenario, the idea of smart cities and sustainable development has grown during the last decades to reduce the threats of climate change and biodiversity loss (IPBES, 2019) by using new technologies.
Among the most prominent emerging tools implemented in smart cities during the last decade are the digital twins for urban cities or urban digital twins (DT) (Dembski et al., 2020; Deng et al., 2021; Deren et al., 2021). This tool is a 3D representation of an urban area that is integrated simultaneously with digital technologies, such as sensors, the Internet of things, and large computer processing capabilities (Hämäläinen, 2021; Ruohomaki et al., 2018; Shahat et al., 2021). Digital twin technologies often encompass components that allow them to capture and process data, simulate different what-if scenarios, and provide relevant information to support decision-making. The implementation of urban digital twins has the potential to improve our understanding of urban processes and therefore support the development of more sustainable solutions for cities.
However, sustainable development in cities is a towering and complex endeavor that requires an enormous effort in planning and communication through deep integration of various disciplines (Ramadier, 2004). One of the biggest challenges for finding solutions to urban problems is the competing needs of different stakeholders and thus the compromise between solutions (Bowen et al., 2017; Sharifi, 2020; Westerink et al., 2013). In this framework, today, stakeholders are not only human-based institutions (e.g., neighborhood associations, schools, municipalities, and private companies), but also organisms, such as animals and plants, and biodiversity as a whole (Fieuw et al., 2022; Rupprecht et al., 2020). A clear example of these challenges, where competing needs and solutions have to be balanced, is the development of critical urban infrastructure in cities, such as water management, road systems, and artificial light at night (ALAN).
The implementation of ALAN has allowed cities to improve the economy by increasing the hours of work and the security of the road system and buildings (Isenstadt et al., 2014; Mansfield, 2018). This infrastructure has also been implemented in natural areas inside or close to the cities to promote outdoor activities and thus enhance public health. Despite the positive impact of ALAN on urban development, substantial knowledge has emerged of the negative impact of light pollution on humans and on biodiversity. Light pollution is generated by the excessive use of lighting infrastructure in the outdoor environment (e.g., streetlight, architectural, and advertisement lighting), which disrupts the circadian rhythm and melatonin levels having therefore detrimental effects on physical and mental health (Cho et al., 2015; Svechkina et al., 2020). On wildlife, the negative impacts range from changes in physiology and behavior to changes in the population dynamics of several species (Jägerbrand and Spoelstra, 2023; Longcore and Rich, 2004; Pérez Vega et al., 2022). A sustainable design of the light infrastructure requires therefore not only the considerations of the society (e.g., cost of electricity) and people (e.g., security and accessibility) but also the requirements for biodiversity conservation (e.g., minimizing light pollution) (Zielinska-Dabkowska, 2022). The use of urban digital twins can help to support the design of critical infrastructure such as ALAN from two perspectives: data management and information visualization. Data and information management refers to capturing data, monitoring processes, and simulating different intervention scenarios. Information visualization can facilitate the communication and interaction between stakeholders through the 3D picturing of an urban area together with the visualization of data (raw or simulation results). Despite the potential benefits of using urban digital twins, there are several challenges to be faced in order to fully implement these tools to be utilized in urban planning tasks. To the best of our knowledge, no urban digital twin that integrates both perspectives has been proposed to support lighting infrastructure planning that accounts for multiple criteria (Hassan et al., 2022). This paper aims to bridge this literature gap.
In this article, we introduce NorDark-DT, an urban digital twin, which has been developed in the context of an interdisciplinary research project in Scandinavia, NorDark research project (https://nordark.org/ (As of July 2023)). First, we discuss the challenges related to the design, implementation, and validation that we have faced when developing this tool. Later, we present the main requirements that guided its design and implementation and describe its use in relevant practical scenarios related to lighting infrastructure planning.
Materials and methods
This section presents the general areas and requirements of the NorDark project. This serves as the main case for the design and implementation of the urban digital twin to support sustainable light intervention planning for smart cities.
The NorDark project
NorDark is a multidisciplinary research project funded by NordForsk in 2021. The aim of this research project is to provide knowledge for the design of light infrastructure in green urban areas in after-dark conditions, considering human needs and minimizing the negative impacts on wildlife. To reach the goals of the project an interdisciplinary collaboration framework was implemented with six research teams: environmental psychology, physiology, wildlife ecology, sustainable science, light design, and digital twin technologies. The project consortium also includes two municipalities, Ålesund (Norway) and Uppsala (Sweden).
A part of the project strategy is the implementation of an urban digital twin for the two study areas, one in Norway and one in Sweden. The execution of this tool was proposed to support not only the sustainable design and implementation of light infrastructure for outdoor areas but also to enhance collaboration and communication within the research groups and with other stakeholders.
The concept of “sustainable design of light infrastructure” is based on two components. The first component is a multi-species design framework in which the needs of humans and wildlife are balanced, while the second is the technical, electrical, and economic costs of the lighting infrastructure. Consequently, the urban digital twin must allow the integration of different domains of information, explore different research questions across a variety of scales, compare results from different light interventions, and facilitate communication with different stakeholders. Figure S1 presents the conceptual view of the sustainable design of light infrastructure in the NorDark project.
In the first stage of development, described in this paper, the DT includes the requirements for three domains: human perception, wildlife, and lighting design together with the implementation of tools for transformative knowledge generation. In this context, research teams are considered stakeholders whose different needs have to be balanced.
Study areas
The experimental settings of the project consider two study areas: one in Sweden, and one in Norway (Figure S2(a)). In these locations, simultaneous experiments are conducted to evaluate different luminaires, to assess the experience of people when walking in the path under different light conditions, and to investigate the changes in animal behavior under different environmental and light conditions. The study areas were selected by the research team and in collaboration with the respective municipalities based on the need for relevant information that can support the planning of urban green areas. Both locations encompass a green area with a path that is commonly used by residents to commute or for recreation.
The site in Norway is located in the middle of the urban area of the Ålesund Municipality. The core area corresponds to the Lerstadvatnet naturreservat, which contains a small lake surrounded by marshes, pine, and deciduous forest (Figure S2(b)). This reserve is surrounded by residential, school, and industrial areas and a highly transited road on the east side (E136). The path goes around the border of the reserve and the vegetation is dominated by pine (Pinus sylvestris) and areas with deciduous forest (Betula). 1
The site in Sweden is located in the southern part of Uppsala Municipality, between the Sävja suburb and the Norra Lunsen Nature Reserve (Figure S2(c)). This reserve is dominated by a pine forest with some portions of marsh and wetlands. The path is located about 20–50 m from the houses towards the forest and connects a school and a cultural center with the housing areas around. Therefore, the path is heavily used by the community to access these facilities and to access the natural reserve. The vegetation around the path is dominated by Furu (P. sylvestris) and some birch (betula) and spruce (Picea). The ground is covered by reindeer lichen (Cladonia rangiferina), lingonberry (Vaccinium vitis-idaea), and blueberry (Vaccinium corymbosum).
Requirements
This section presents the set of requirements that guided the design and development of the urban digital twin. These requirements are based on the research questions from the other research teams in the project, therefore, the implementation of different functionalities in the NorDark-DT is aimed to foster the exploration of different methods of analysis and promote research innovation. Figure S3 presents a diagram of the requirements connections of the different research domains in the design and development of the DT.
Support the evaluation of pedestrians’ perception when walking along a path in natural spaces
Understanding how people perceive walking on natural paths and how different light conditions might affect their experiences is fundamental to designing lighting infrastructure that promotes the use of an area or path, incentivizes physical activities, and bonds with nature (Johansson et al., 2016). This is one of the main questions that the Environmental Psychology Team (Lund University, Sweden) is exploring in the NorDark research project.
An urban digital twin that can support addressing such research questions needs to rely on a scene that resembles a natural environment under different light conditions. The scene needs to contain the relevant objects, such as the path, vegetation, and light poles, among others. Aspects such as texture, color, and resolution need to be explored and adjusted so they can provide visual scenes that resemble natural conditions. Different light conditions must be simulated considering the sources of natural light and sources of artificial light. Natural light conditions include elements such as the sun’s and moon’s position, and weather (e.g., cloudiness, rain), while artificial light conditions relate to light pole design and luminaire characteristics.
Support the assessment of the impact of light pollution on wildlife
The implementation of ALAN in natural environments is considered today a detrimental factor for biodiversity (Pérez Vega et al., 2022). Therefore, restoration practices include minimizing light pollution and securing dark areas for wildlife. To include the requirements for wildlife in a broader perspective, the Wildlife Ecology Team (Swedish University of Agricultural Sciences, Sweden) is exploring new methods to assess light pollution on a small scale and how the use of vegetation to minimize the light in the surrounding area an illuminated outdoor path. Therefore, the DT must allow the measurement of the amount of light on a local scale and allow the simulation of management intervention in the area close to the illuminated path. The management intervention refers to changes in the land cover (e.g., type of species, density) and light infrastructure (e.g., the height of the light pole, and luminaires). The DT should also support the definition of suitable sampling strategies for the placement of sensors that will be used in the registration of the occurrence of individuals of multiple species.
Support of the design of sustainable lighting infrastructure in natural areas
The environmental and energy crisis in the world has created the need to find new solutions for our cities. By bridging knowledge, the Light Design Team (KTH Royal Institute of Technology, Sweden) is exploring new after-dark outdoor lighting infrastructure that minimizes the consumption of energy and light pollution for humans and nature. The integration of information from different domains is crucial in this analysis and thus the requirement for the urban DT includes all aspects involved in the previous domains (e.g., Environmental Psychology and Wildlife) together with the possibility of simulating different technical aspects of light infrastructure (e.g., light pole design) and measure the economical cost of this infrastructure (e.g., energy cost).
Support collaboration and foster transformative knowledge
A central part of the NorDark project as well as the development of smart cities is the generation of transformative knowledge. This means knowledge that helps society and its institutions to understand the information and to change the way that we approach and manage our cities and their natural environments (Lang et al., 2012; Siebenhüner, 2018). The urban digital twin must therefore be reliable and transparent when visualizing information, and allow the integration of different sources of information to generate new understanding and awareness. The digital twin should also allow the analysis of the urban variables under different user perspectives (e.g., include requirements for low-mobility citizens) and/or different conflicting needs associated with different variables (e.g., human and more-than-human perspectives) to support better-informed decisions.
Results
This section presents the proposed urban digital twin addressing the implementation aspects as well as two case studies.
NorDark-DT
We built an urban digital twin to support the design, planning, and assessment of sustainable outdoor lighting infrastructure. NorDark-DT was implemented to operate in two specific study sites, although it can be implemented in other areas where information is available. The pillars for the design and functionalities were based on the research questions of the other teams and thus encompass an interdisciplinary research approach (see Figure S3).
The fundamental components in the NorDark-DT are the 3D scene visualization, the implementation of several functionalities that allow changing the conditions in the 3D scene, and the visual analytics tools that allow the assessment of luminance 2 values for the different simulated conditions. The 3D scene resembles the study areas and therefore relevant elements that compose the landscape were added, such as the path, vegetation, sun, light poles, and housing. Functionalities allow the simulation of different “natural light” conditions (e.g., sun and weather conditions) and “artificial light” conditions (e.g., luminaires). They also allow the incorporation of different vegetation types (e.g., pine forest, deciduous forest, and wetland) and the visualization of external data. A visual analytical tool functionality allows the easy assessment of the luminance values in different formats.
Architectural view of the NorDark-DT
Figure S4 presents an architectural view of NorDark-DT, which consists of four components: Data Management, Parameter Specification, Computation, and Visualization.
Data management
Data management is responsible for handling data generated by the digital twin, as well as data obtained from external sources. The most important data generated by the digital twin refers to a particular light infrastructure configuration. A configuration can be seen as a possible alternative for lighting intervention for a particular location. For example, the definition of light pole design, associated luminaires, and their location. Another example of data generated by the twin includes luminance calculation values according to different light configurations.
Parameter specification
This component contains the parameters and functionalities that allow the digital twin to simulate different environments or scenarios. Examples of parameters are sky conditions, such as the position of the sun and moon for a specific date and hour; weather conditions, such as the presence of clouds, rain, or snow; vegetation distribution that accounts for the definition of vegetation types (plant species), and their amount (plant density) and their locations.
Computation
Computational components comprise the modules dedicated to the assessment of luminance scores given the defined simulated environment. This layer also includes the calculation of aggregation functions responsible for the combination of different variables associated with a specific area. For example, for a specific road, scores related to luminance, slope, and speed limit may be combined based on weights (relevance) defined in the digital twin. We follow the weight-based aggregation scheme defined in (Leplat et al., 2022).
Visualization
This component is responsible for the visualization of the scene together with supporting the analysis of what-if scenarios based on different parameter configurations. This layer includes the visualization of luminance scores across pre-defined lines and regions of interest, side-by-side comparison of luminance maps, and map-based visualization of aggregated results related to the combination of variables.
Implementation aspects
NorDarK-DT was developed using Unity (https://unity.com/ (As of July 2023)) with the High-Definition Rendering Pipeline (https://unity.com/srp/High-Definition-Render-Pipeline/ (As of July 2023)) (HDRP). This choice was motivated by Scorpio et al. (2022); in their work, they demonstrated the use of a game engine as a tool for lighting design. Several Unity assets were used for this implementation. Among these, the Mapbox Unity SDK (https://www.mapbox.com/unity (As of July 2023), to display a map of any location; Photorealistic lights (IES) (https://assetstore.unity.com/packages/tools/utilities/photorealistic-lights-ies-59641 (As of July 2023).), to apply IES files to lights; Vegetation Studio Pro (https://assetstore.unity.com/packages/tools/terrain/vegetation-studio-pro-131835 (As of July 2023)), to create vegetation on the user-defined areas; and a collection of vegetation assets or 3D models for plants.
Overview of functionalities
This section presents the functionalities implemented in the first version of the NorDark-DT.
3D scene navigation
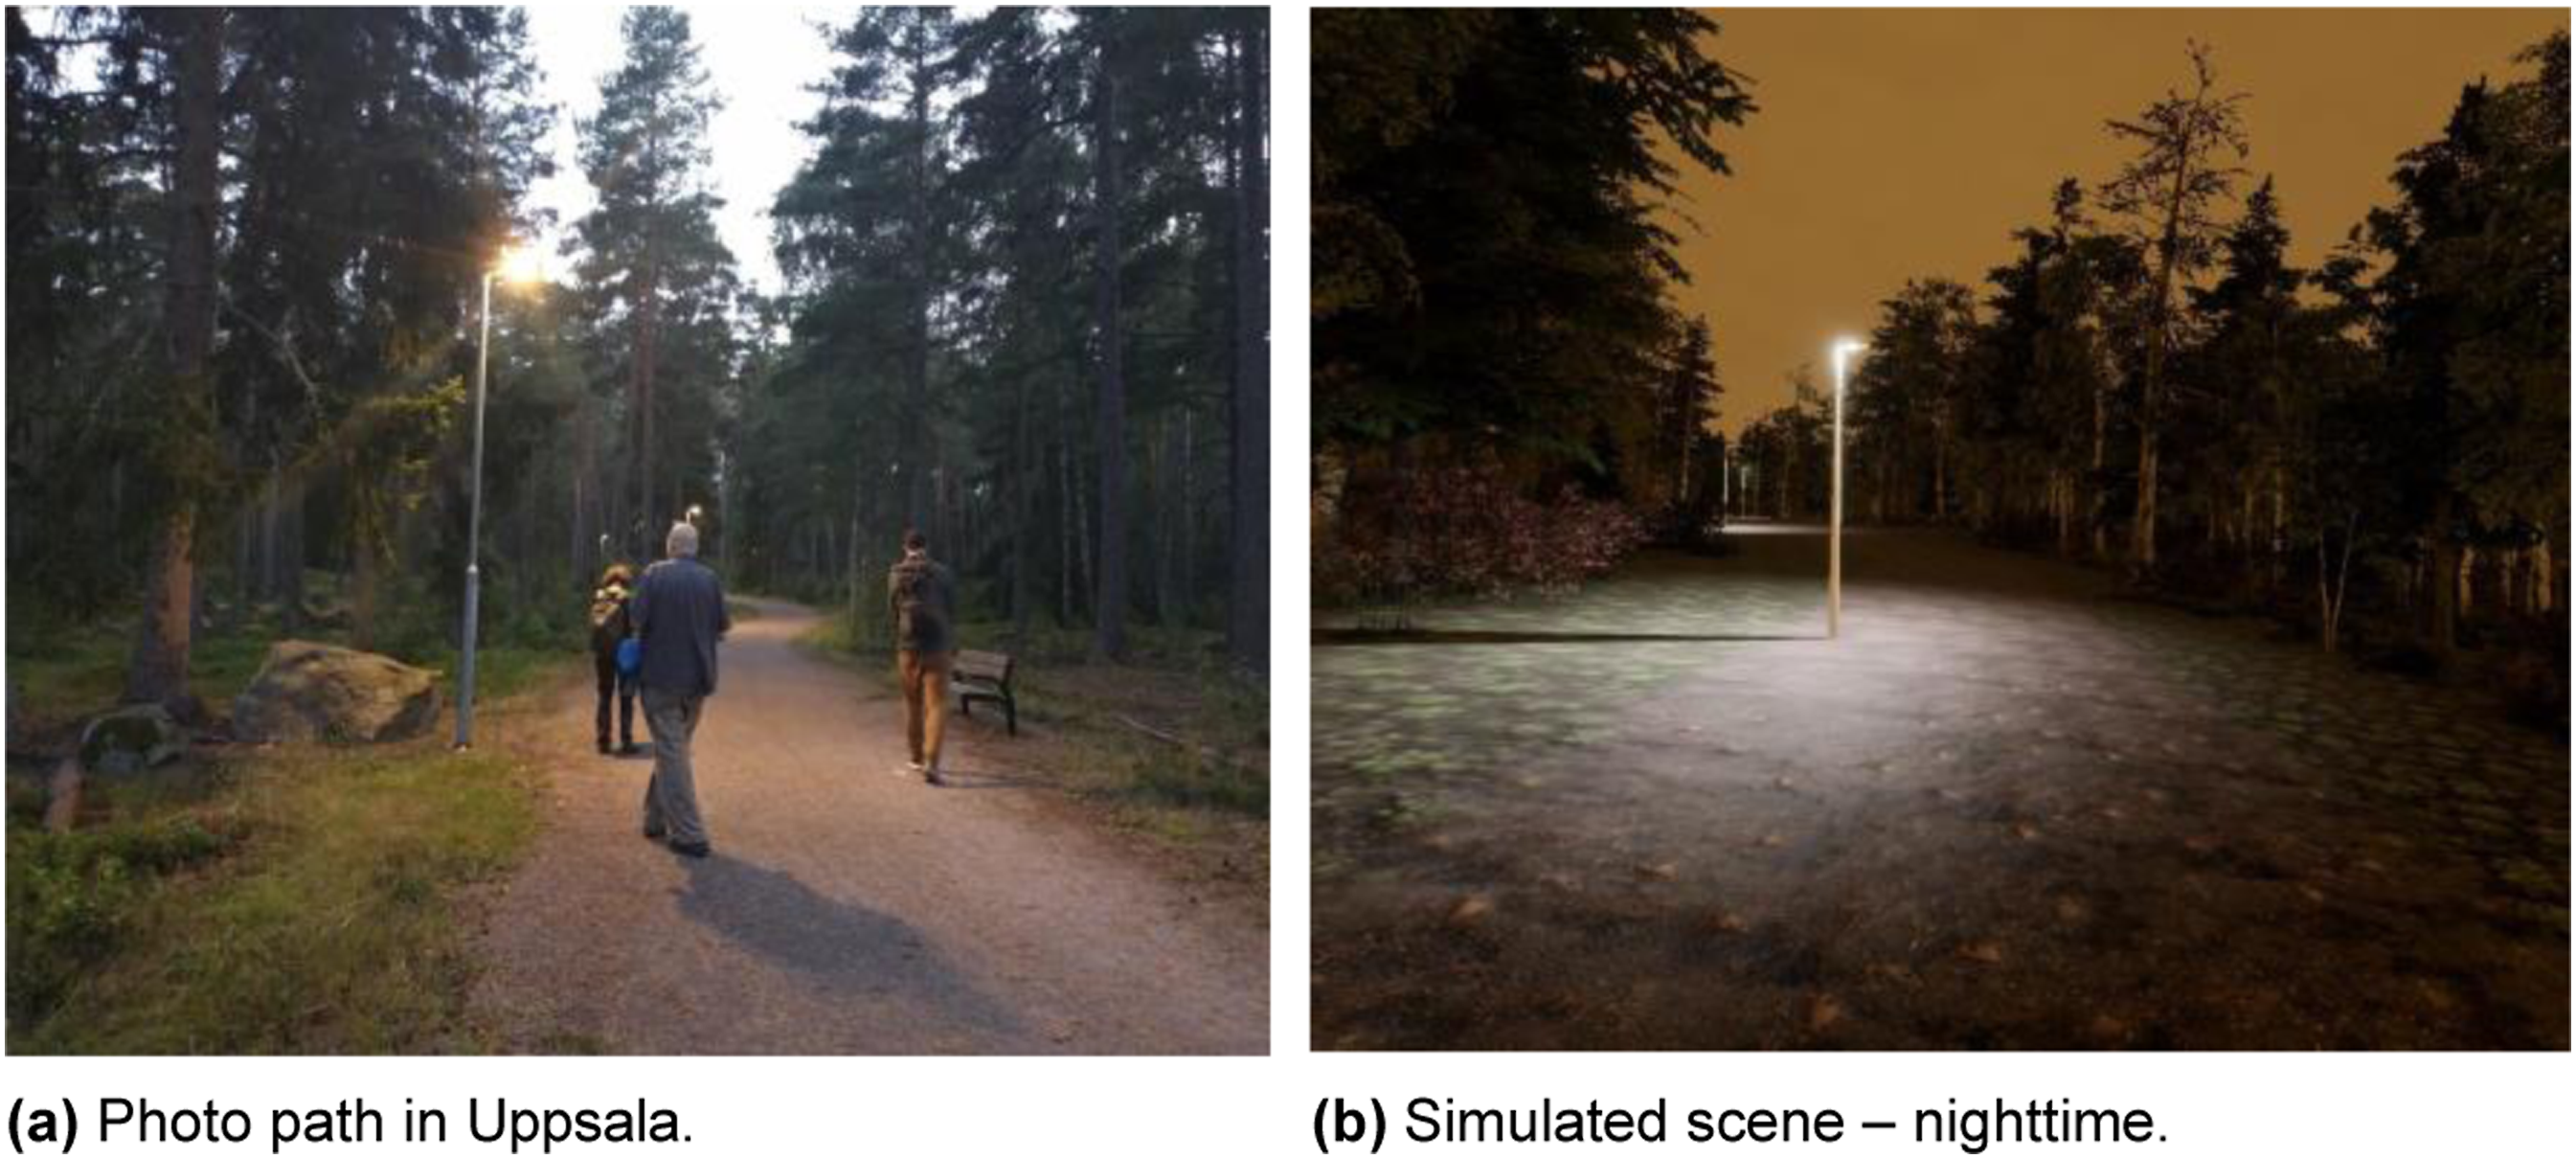
This feature concerns the navigation across the 3D representations of study sites on which the light intervention analysis is simulated. Figures 1 and 2 illustrate the 3D scenes associated with the study sites of Ålesund, Lerstad (Norway) and Uppsala, Sävja (Sweden). Simulated scene in the study site in Lerstadvatnet naturreservat in Ålesund Municipality, Norway. Figure (a) shows a photo taken on October 16, 2023, at 19:00 with the research team. Figures (b) and (c) show simulated scenes in the NorDark-DT under similar conditions. (a) Photo path in Ålesund, (b) Simulated scene—nighttime, and Simulated scene in the study site in Sa¨ vja, Uppsala Municipality, Sweden. Figure (a) shows a photo taken on August 17, 2022, at 21:00 with the research team. Figure (b) shows a simulated scene in the NorDark-DT under similar conditions. (a) Photo path in Uppsala and (b) Simulated scene—nighttime.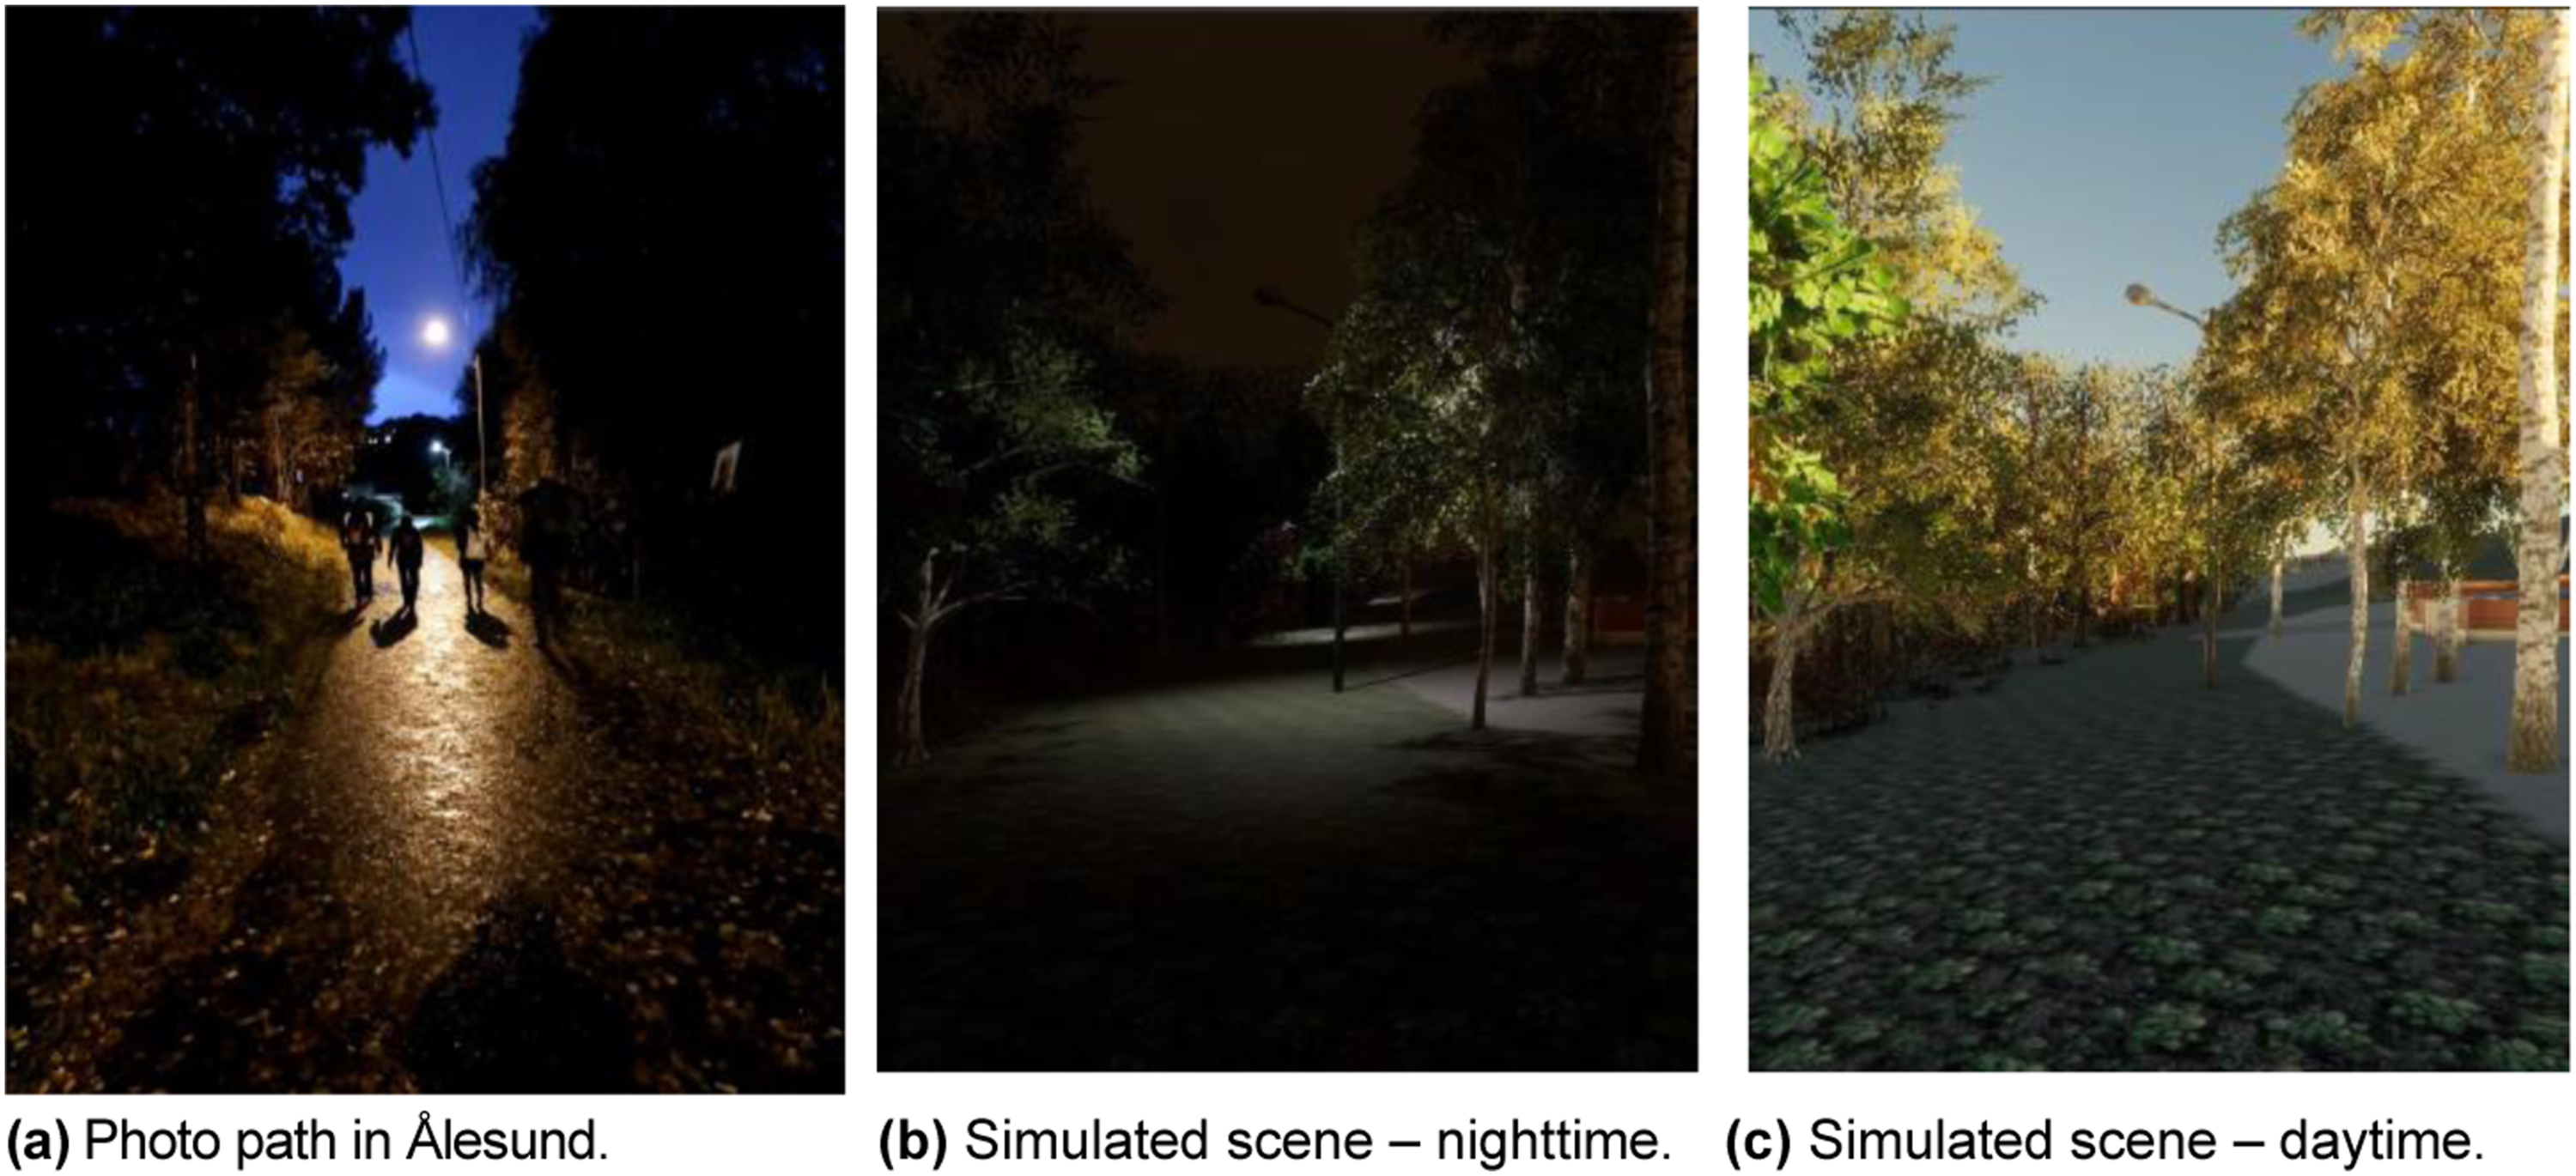
Environmental condition definition
These functionalities allow the definition of the environmental conditions in the scene and thus the analysis of the natural light conditions. It includes the definition of the sky, weather, and vegetation settings. Sky conditions are related to the position of the sun and moon, which are established from the geographical location, date, and time with the SAMPA algorithm (Reda et al., 2012). Weather conditions include the simulation of clouds (with the Unity volumetric clouds 3 ), fog (with the Unity fog volume 4 ), rain (with a Unity shader adding wetness to the ground following (Brinck et al., 2016)), and snow (with a Unity shader). 5
The user can set the amount of clouds and the intensity of fog, rain, and snow coverage of the ground. An example of the different environmental conditions can be seen in Figures S5 and S6 that illustrate different sky conditions for two different dates and different weather conditions (presence of fog, rain, snow).
Vegetation condition definition
There are two ways for defining vegetation conditions, first by assigning a biome in a particular area and second by using a map with the different types of ground. In the first case, the user defines an area by drawing a polygon in the scene and then by assigning a biome (see Figure S7(a)). A biome here is a collection of different 3D objects of plant species that resemble different types of plant communities (e.g., forest, wetland). These objects (plant species) are randomly spawned inside the polygon. The plant species were obtained from the Unity Asset Store (https://assetstore.unity.com/ (As of July 2023)).
In the second case, the user provides a map with polygons that represent different types of grounds (e.g., road, path, grass). The map is encoded as a GeoJSON file and is used to define different types of ground cover for the current scene (see Figure S7(b)).
Light infrastructure
This functionality supports the inclusion, change, and deletion of lighting infrastructure in the scene. The light infrastructure is characterized by the light pole design and the luminaires. Light poles are represented by 3D models. In this initial version of NorDark-DT, users are able to choose from a set of pre-defined 3D models for light poles. However, a future version will allow users to import their own 3D models. The luminaires are selected by choosing an IES file, which is the current standard for describing lights (Committee, 2019). The IES file contains information about the lamp and the luminous intensity (in candela) of the lamp for different angles. The definition of the light infrastructure is demonstrated in Figure S8(a).
Wildlife camera trap view
Lighting infrastructure alternatives should also account for the possible impact of light on wildlife. Properly recording the presence of animals before and after an intervention can provide relevant information to support this impact analysis. In the NorDark project, camera traps have been employed as sensors to register the presence of animals. NorDark-DT supports planning activities related to the position and distribution of camera traps for wildlife. Therefore, wildlife experts may explore different alternatives for placing cameras (sampling strategies) that would be suitable for addressing research questions related to the impact of lighting on wildlife (Figure S8(b)). As illustrated in Figure 3, we use NorDark-DT to test different heights in the position of the camera trap different heights in the position of the camera trap. Camera properties, such as sensor size, ISO, shutter speed, focal length, camera aperture, and shift, can also be defined. Camera trap: View from the camera trap functionality. Figures (a), (b), and (c) show the view of an installed camera trap in the same place, but changing the height from the ground. Figure (d) shows the comparison view between the scene at 30 cm from the ground in snowing conditions and the view from the camera at 6 m height (top right). (a) View from 30 cm height, (b) View from 2 m height, (c) View from 6 m height, and (d) Comparing views.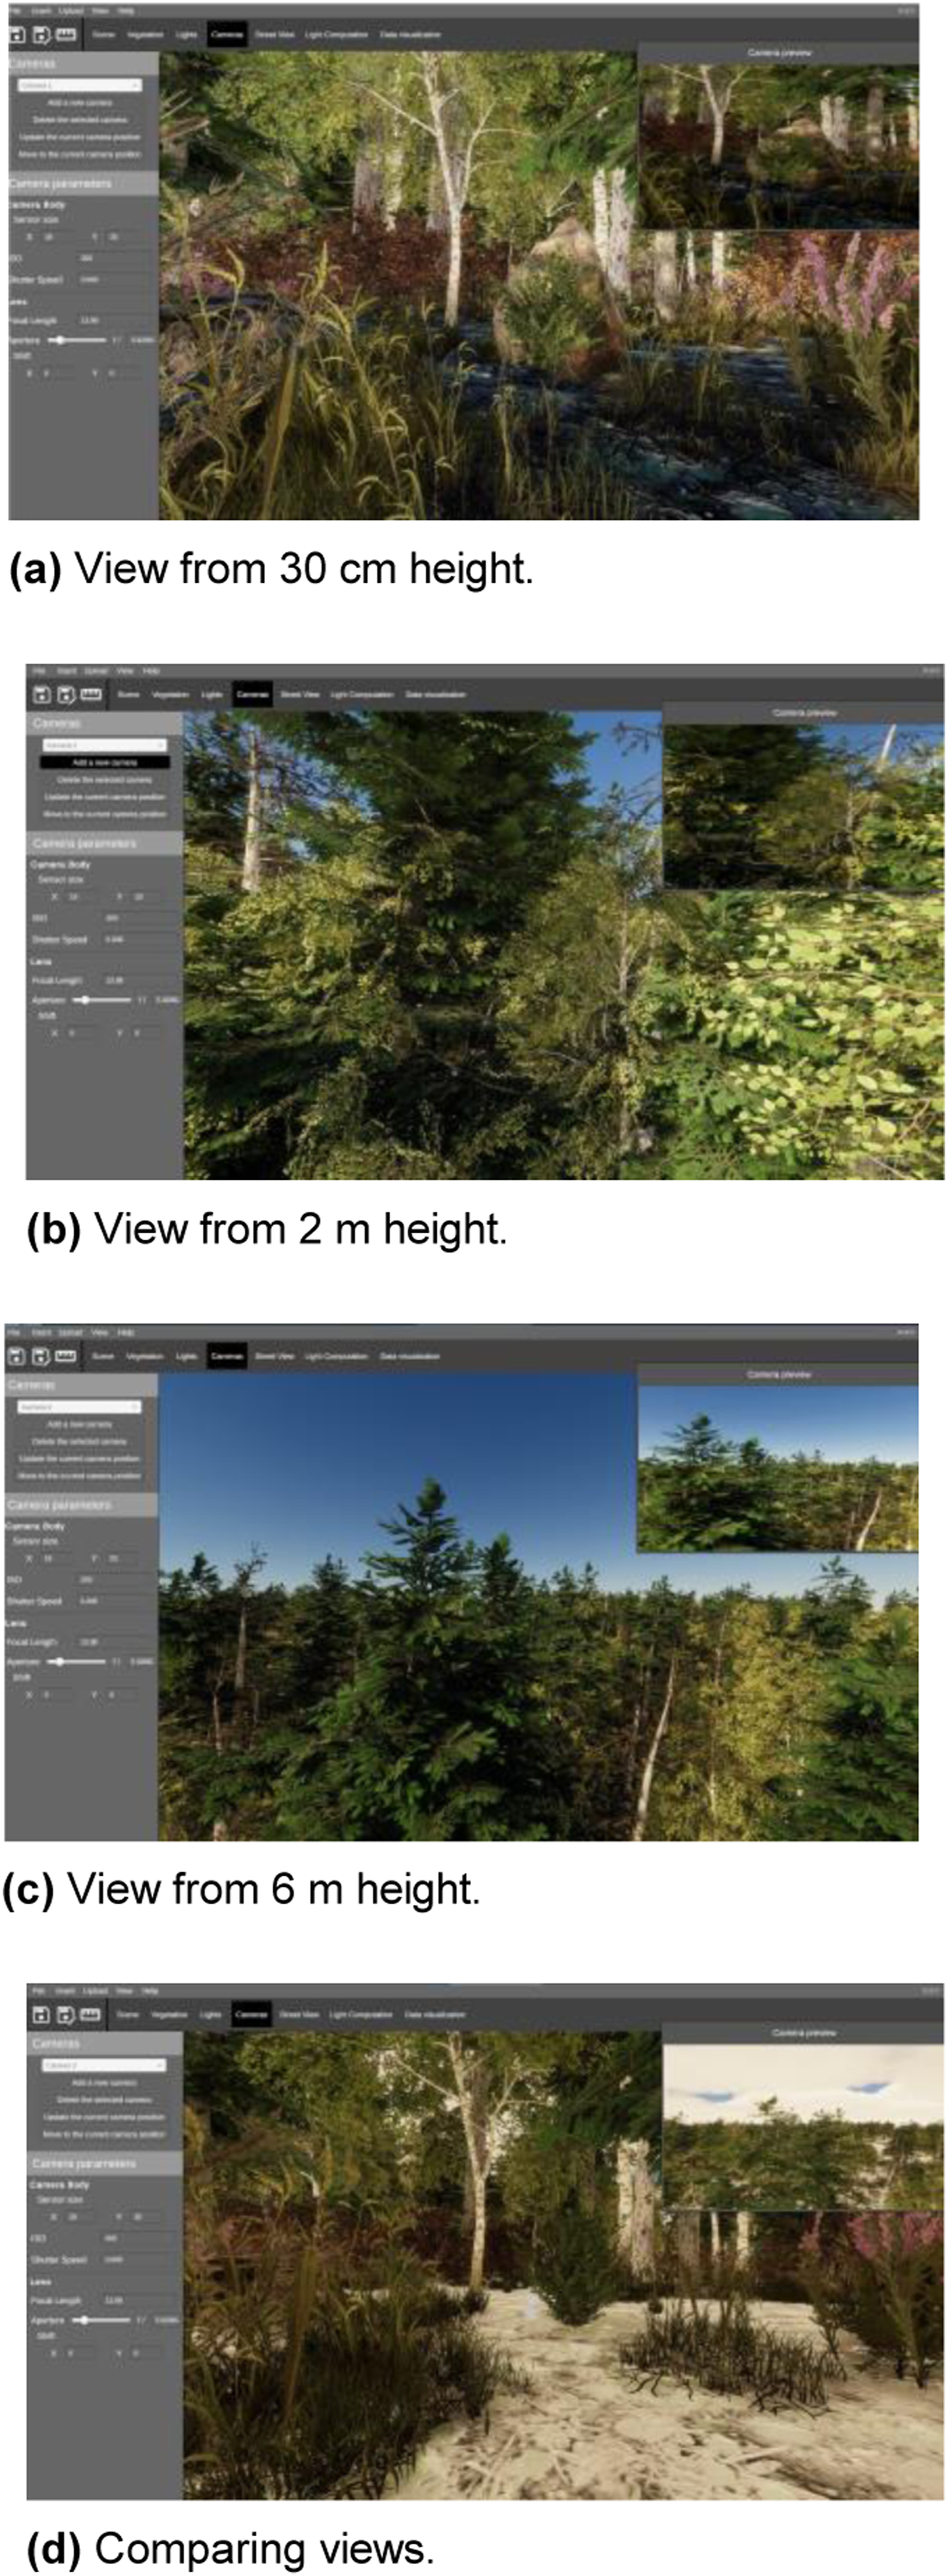
Luminance analysis
This feature refers to the calculation of luminance (cd/m2) in the scene and the visualization of computed scores. There are three ways to visualize luminance values and two of them allow export computed results. A luminance map displays the computed luminance for a specific area (see Figure S9(a)). The luminance can also be obtained along a line defined by the user in the scene. The results can be visualized in a graph (see Figure S9(b)) and can be exported in a GeoJSON or a CSV file. The third visualization relates to the computation of a luminance heatmap of an area (rectangular polygon) that is defined by the user (see Figure S9(c)). The results can also be exported in a GeoJSON or a CSV file.
Light infrastructure comparison
This feature supports a direct comparison of different lighting intervention alternatives. For example, Figure S10(a) illustrates the comparison of four luminance maps related to four different options for implementing a light intervention. Figure S10(b) exemplifies the comparison of the luminance scores associated with two different scenarios along a line.
Data visualization from external sources
This feature supports the visualization of geo-data imported by the user. The NorDark-DT supports the representation of datasets in both vector (containing lines, points, and polygons) and raster formats (grid).
Figures S11(a) and S11(b) show the visualization of two different datasets representing Walkability (Leplat et al., 2022) in Ålesund. The first (on the left) shows a visualization of a specific area of Ålesund with a set of lines. Each line color represents a different value, which refers to the aggregate score (weighted sum) considering different variables. The second (on the right) shows an example of raster data aggregation visualization in the whole city of Ålesund. Raster cells are associated with bars, whose color and height refer to different scores.
Case studies
This section presents three case studies that demonstrate the potential of NorDark-DT in supporting the analysis of sustainable lighting infrastructure alternatives.
Case study 1—Light design interventions for improving illumination conditions for pedestrians
In this first case, we used the NorDark-DT to evaluate different light design interventions to improve the illumination conditions in the study area of Uppsala, Sweden. This case relates to the investigation concerning spacing between light poles according to existing regulations (Dincel, 2023). In this area, the walking path is surrounded by forest, and it is only illuminated by the light infrastructure located on the side of the path. The distance between light poles ranges between 28 and 32 m (Dincel, 2023), which is somewhat greater than what is normally used in this type of environment. This means that at night the area between light posts is not completely illuminated.
We used the actual position of the light poles and height (4.5 m (Dincel, 2023), Figure 4(a) and (b)) and we simulated two light interventions. First, we increase the height of the light pole from 4.5 m (current height) to 6 m (Figure 4(c) and (d)). Second, we added light infrastructure thus reducing the distance between light poles from 28 m to approximately 14 m (Figure 4(e) and (f)). We evaluated the scenarios by estimating the luminance value in a line between the light poles (Figure 4(g) and (h)). Case Study 1—Light Design interventions for improving illumination conditions for pedestrians. The figure shows the visualization of the light intervention design to improve the illumination for pedestrians in the study area in Uppsala, Sweden. Interventions are based on the height of the light pole (H) and the distance between the light pole (D). Figure (a) shows the view in the path at 11:00 and Figure (b) at 20:00 (October 20, 2022). Figures (c), (d), (e), and (f) show the different light intervention designs and the estimation of the luminance values in a line (white line in the picture) between the light poles. Figures (g) and (h) summarize the evaluation of the luminance values between two light poles. (a) Path in daylight, (b) Path in night light, (c) H = 4.5 m.; D ≈ 28 m, (d) H = 6.0 m.; D ≈ 28 m, (e) H = 4.5 m.; D ≈ 14 m (f) H = 6.0 m.; D ≈ 14 m, (g) Light measurements for cases (b) and (c), and (h) Light measurements for cases (e) and (f).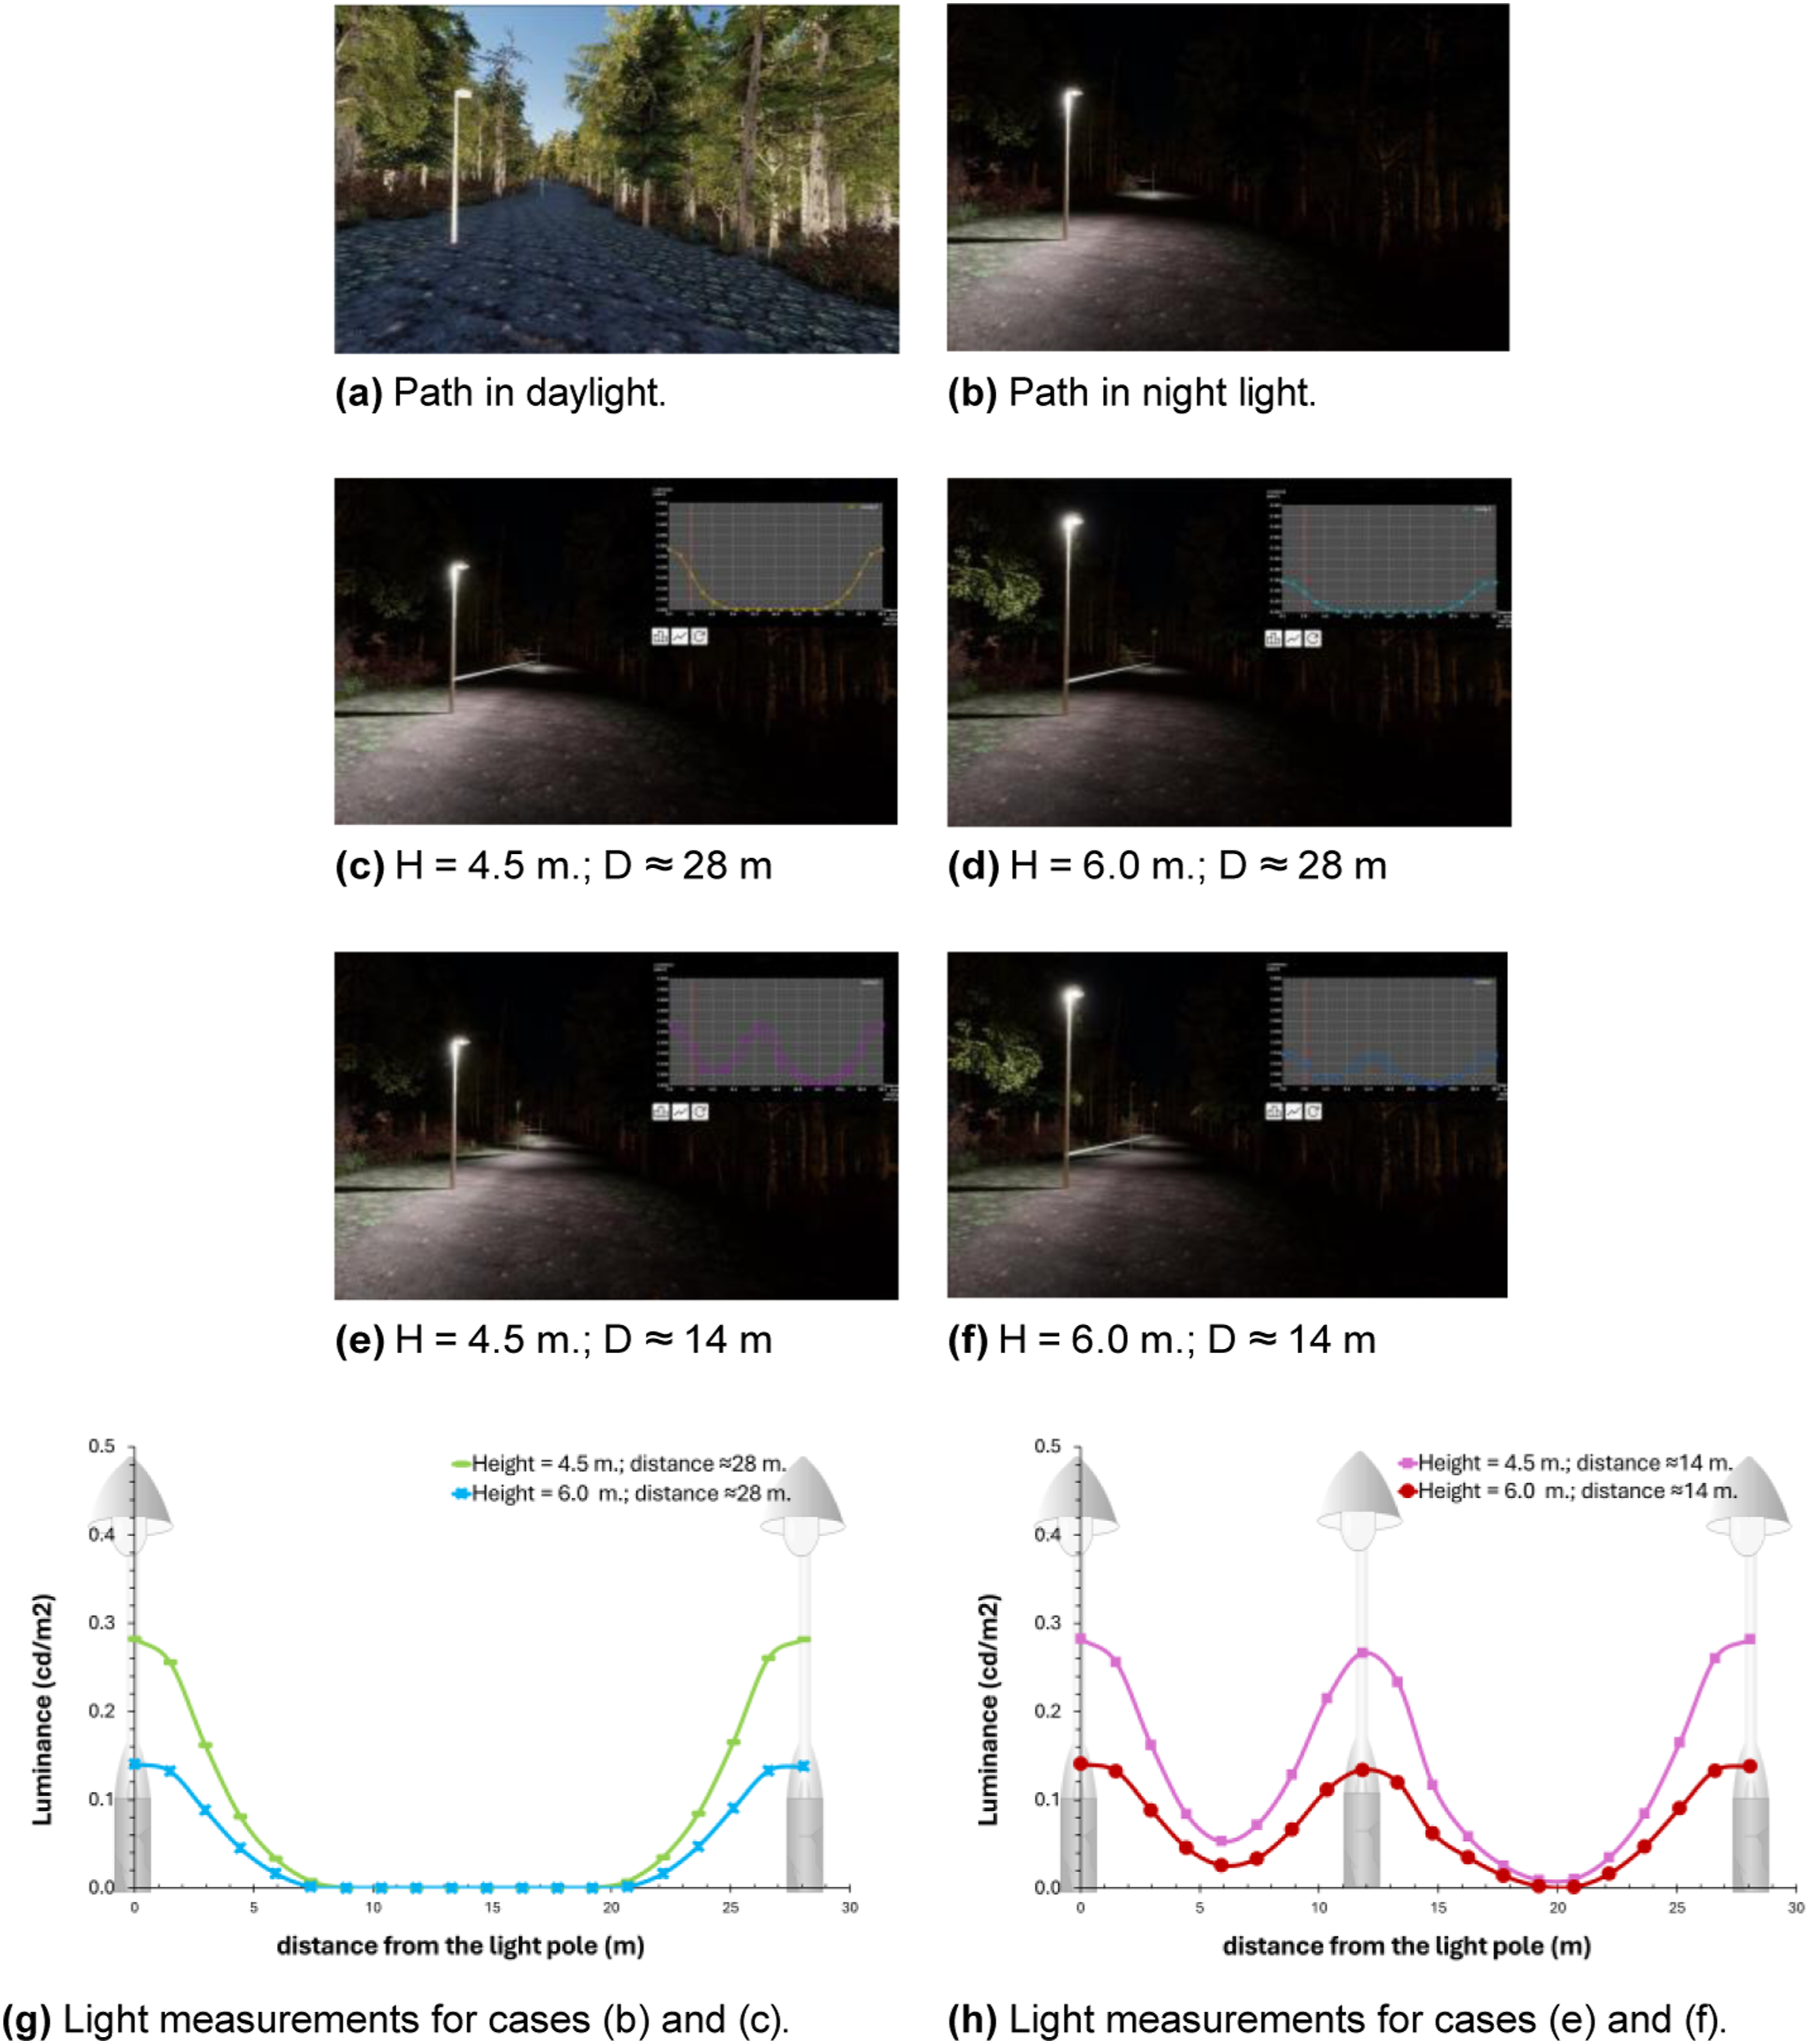
Case study 2—Minimizing light pollution for wildlife
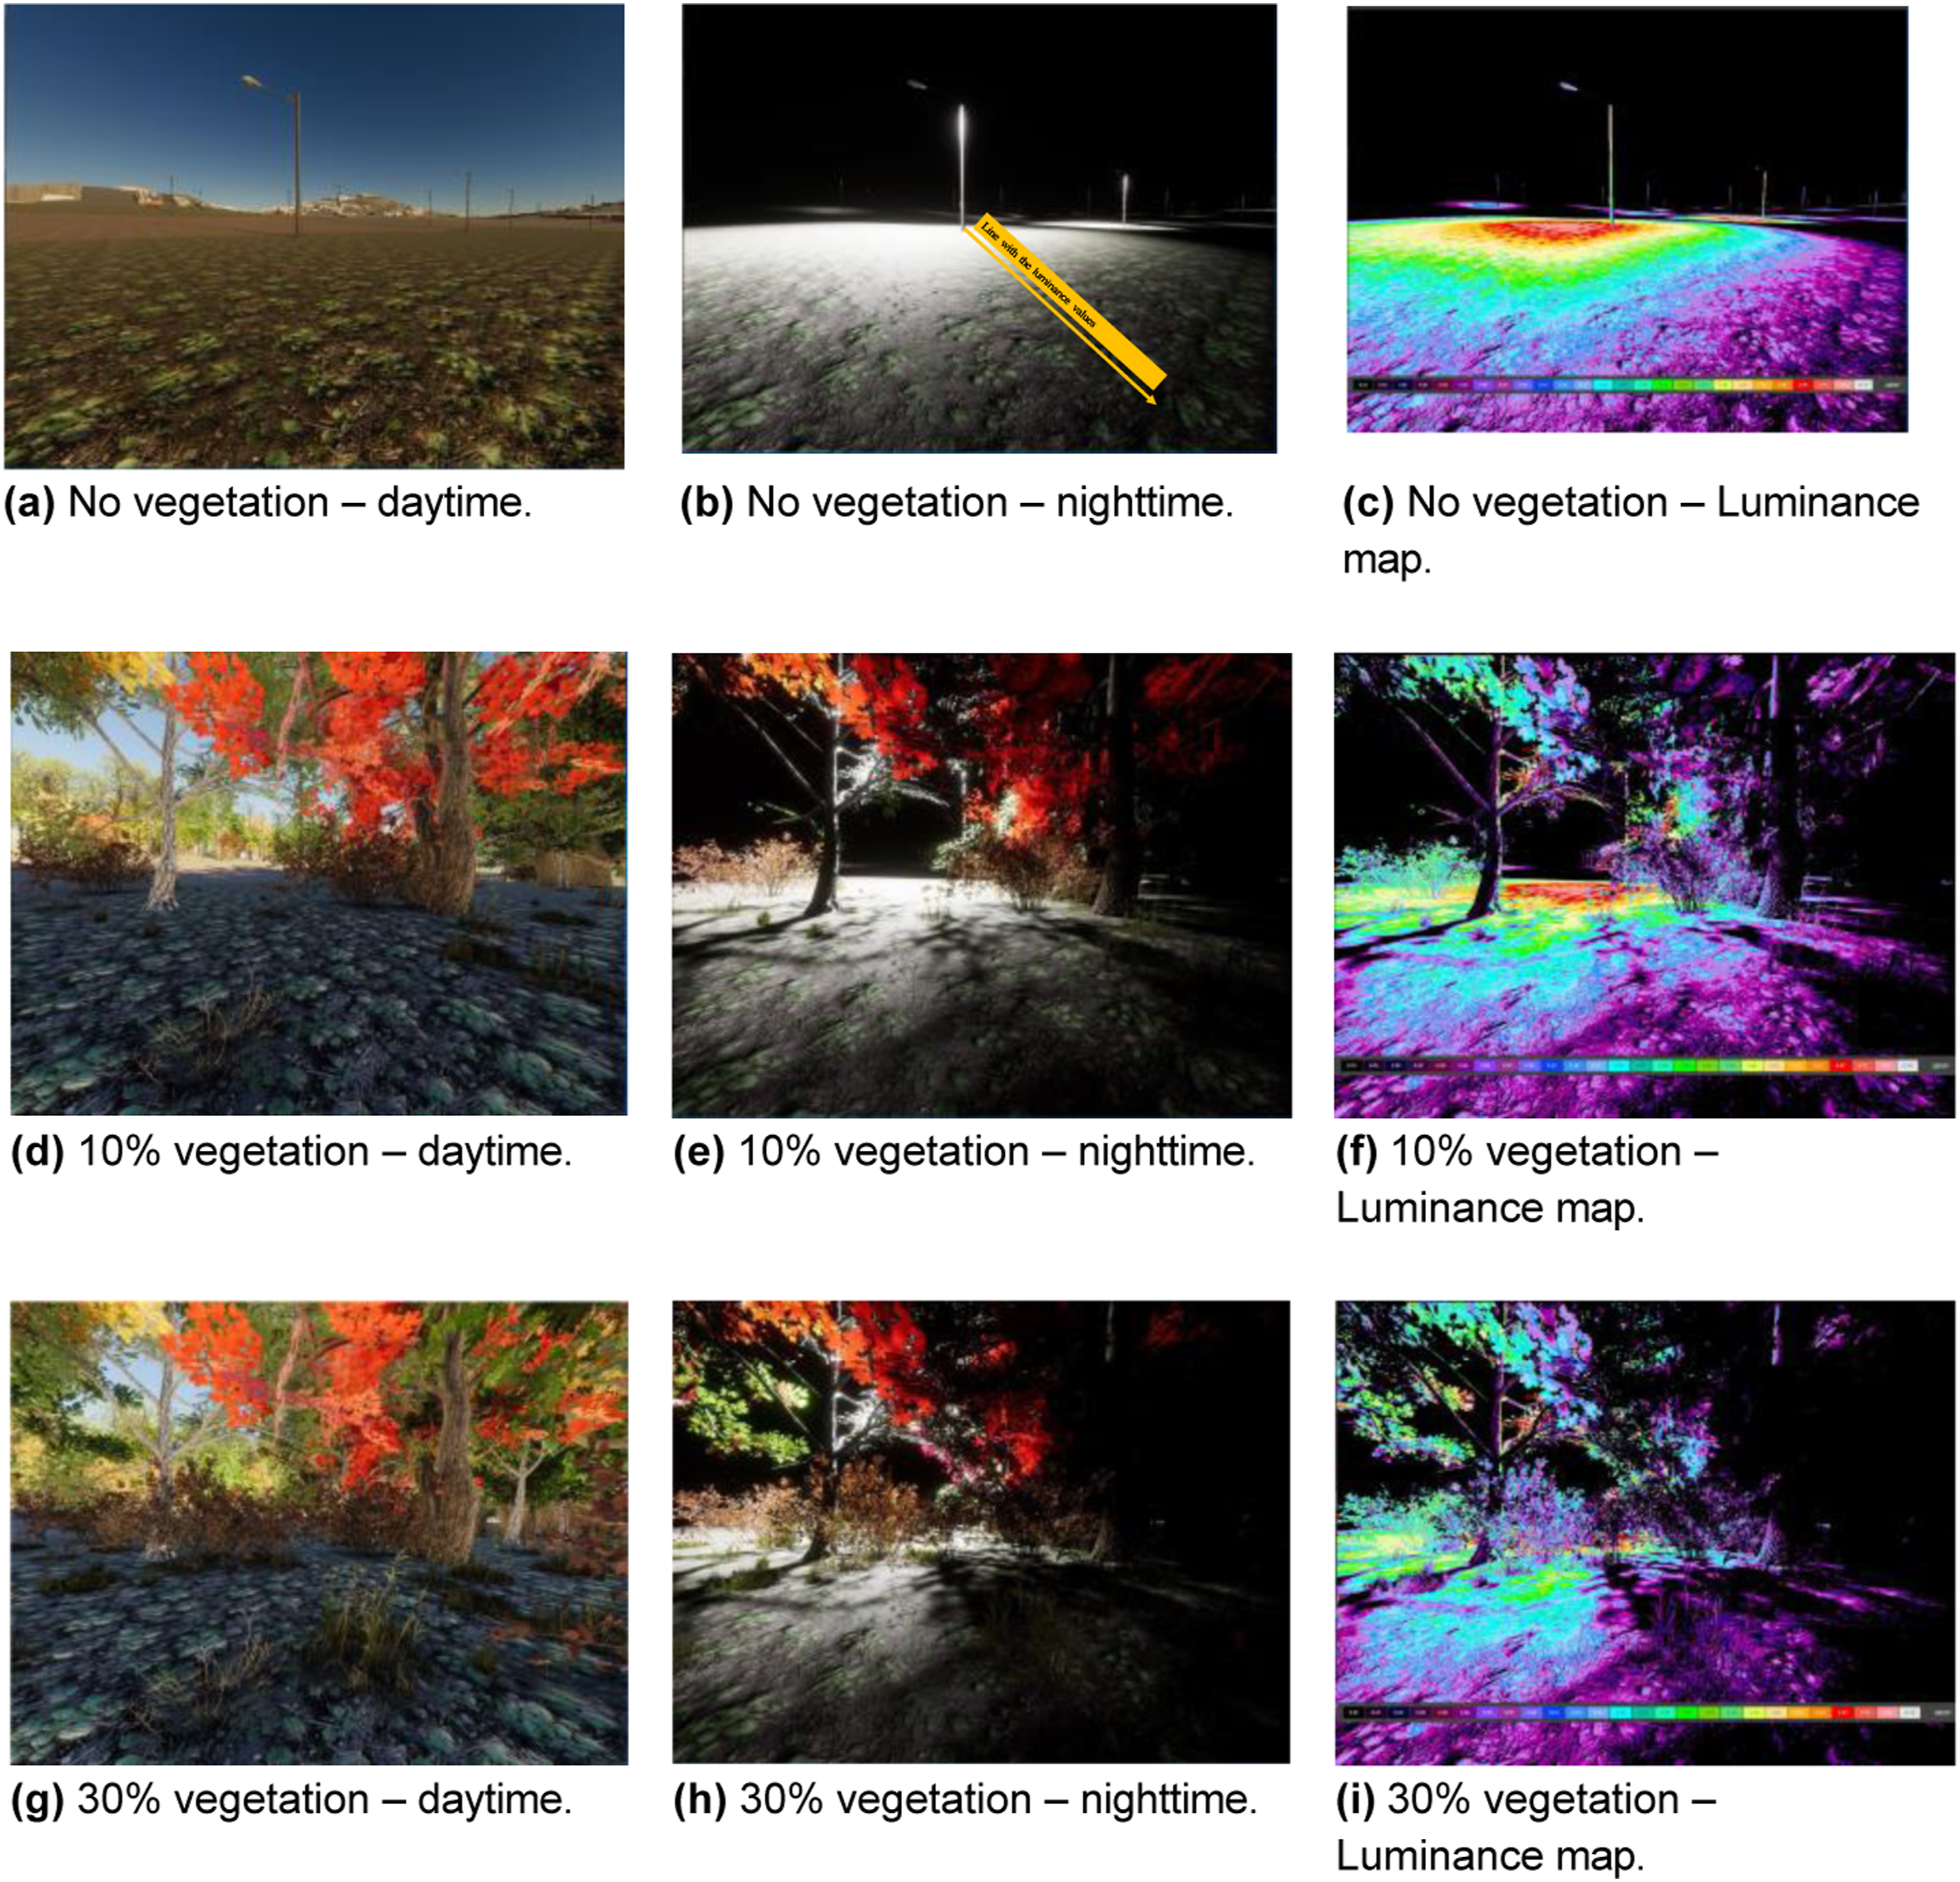
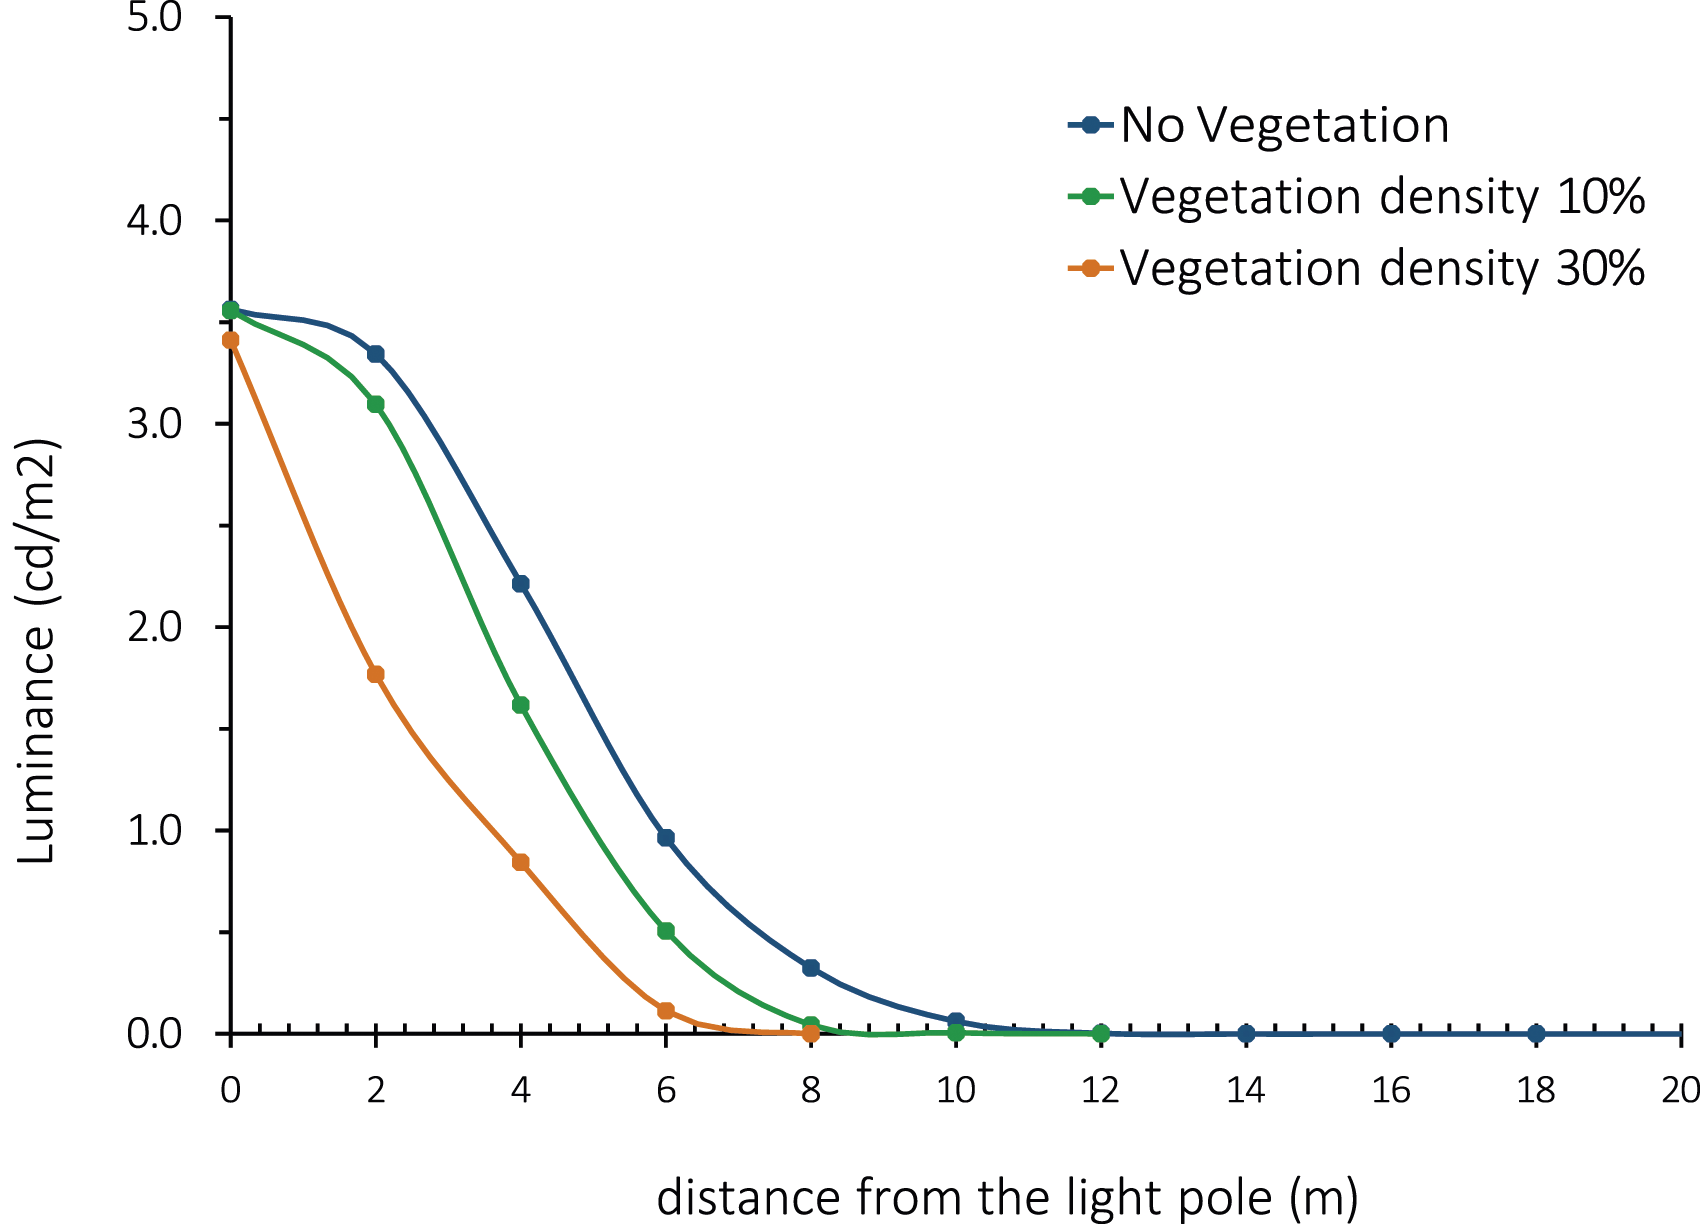
In this case study, we explored the use of the NorDark-DT to assess the light pollution that comes from the light poles into a forest area under different vegetation densities. Vegetation density is simulated as the number of trees and shrubs (objects) per area. We used a segment of the path in the Ålesund study site. This segment is located on the west side of the reserve where the path goes between a field football area and the water body (Figure 5). We simulated tree light intervention scenarios by varying the amount of vegetation: “no vegetation,” “10% of vegetation,” and “30% of vegetation.” We chose one specific light pole to illustrate the luminance results. We visualized the intervention scenarios at 20 m from the light pole at ground level during day and nighttime (Figure 6). We evaluated the amount of light using the luminance map (Figure 6(c), (f) and (i)) and extracted the values in a 20 m line from the light pole to the forest (Figure 6(b)). We presented the results in a graph (Figure 7) where differences in the amount of light over the ground (cd/m2) can be estimated. Case Study 2—Minimizing light pollution for wildlife. The figure shows the general area where three light interventions were simulated. The area is situated on the western side of the Lerstadvatnet naturreservat in Ålesund Municipality. The light intervention scenarios were simulated by varying the vegetation density while natural and light conditions were maintained constant. Vegetation scenarios varied from no vegetation (a), 10% vegetation density (b), and 30% vegetation density (c). We selected a light pole (oval with segmented line) to evaluate the luminance values during the night (see Figure 6). (a) No vegetation, (b) 10% vegetation, and (c) 30% vegetation. Case Study 2—Result visualization. The figure shows the visualization in the NorDark-DT from the ground at a 20 m distance from the selected light pole (b). The light intervention scenarios were simulated by varying the vegetation density, while natural and light conditions were maintained constant. Vegetation scenarios varied from No vegetation (a, b, c), 10% vegetation density (d, e, f), and 30% vegetation density (g, h, i). Figures a, d, and g show the view during the daytime (October 22, 2023, at noon). Weather conditions were maintained as an open sky with no clouds or fog. Figures (b), (e), and (h) show the view during night conditions (at 11 p.m.). Figures (c), (f), and (i) show the luminance map on a scale from 0 to 10 cd/m2 at night conditions. (a) No vegetation—daytime, (b) No vegetation—nighttime, (c) No vegetation—Luminance map, (d) 10% vegetation—daytime, (e) 10% vegetation—nighttime, (f) 10% vegetation—Luminance map, (g) 30% vegetation—daytime, (h) 30% vegetation—nighttime, and (i) 30% vegetation—Luminance map. Case Study 2—Result visualization. Luminance values in a 20m line starting from a light pole.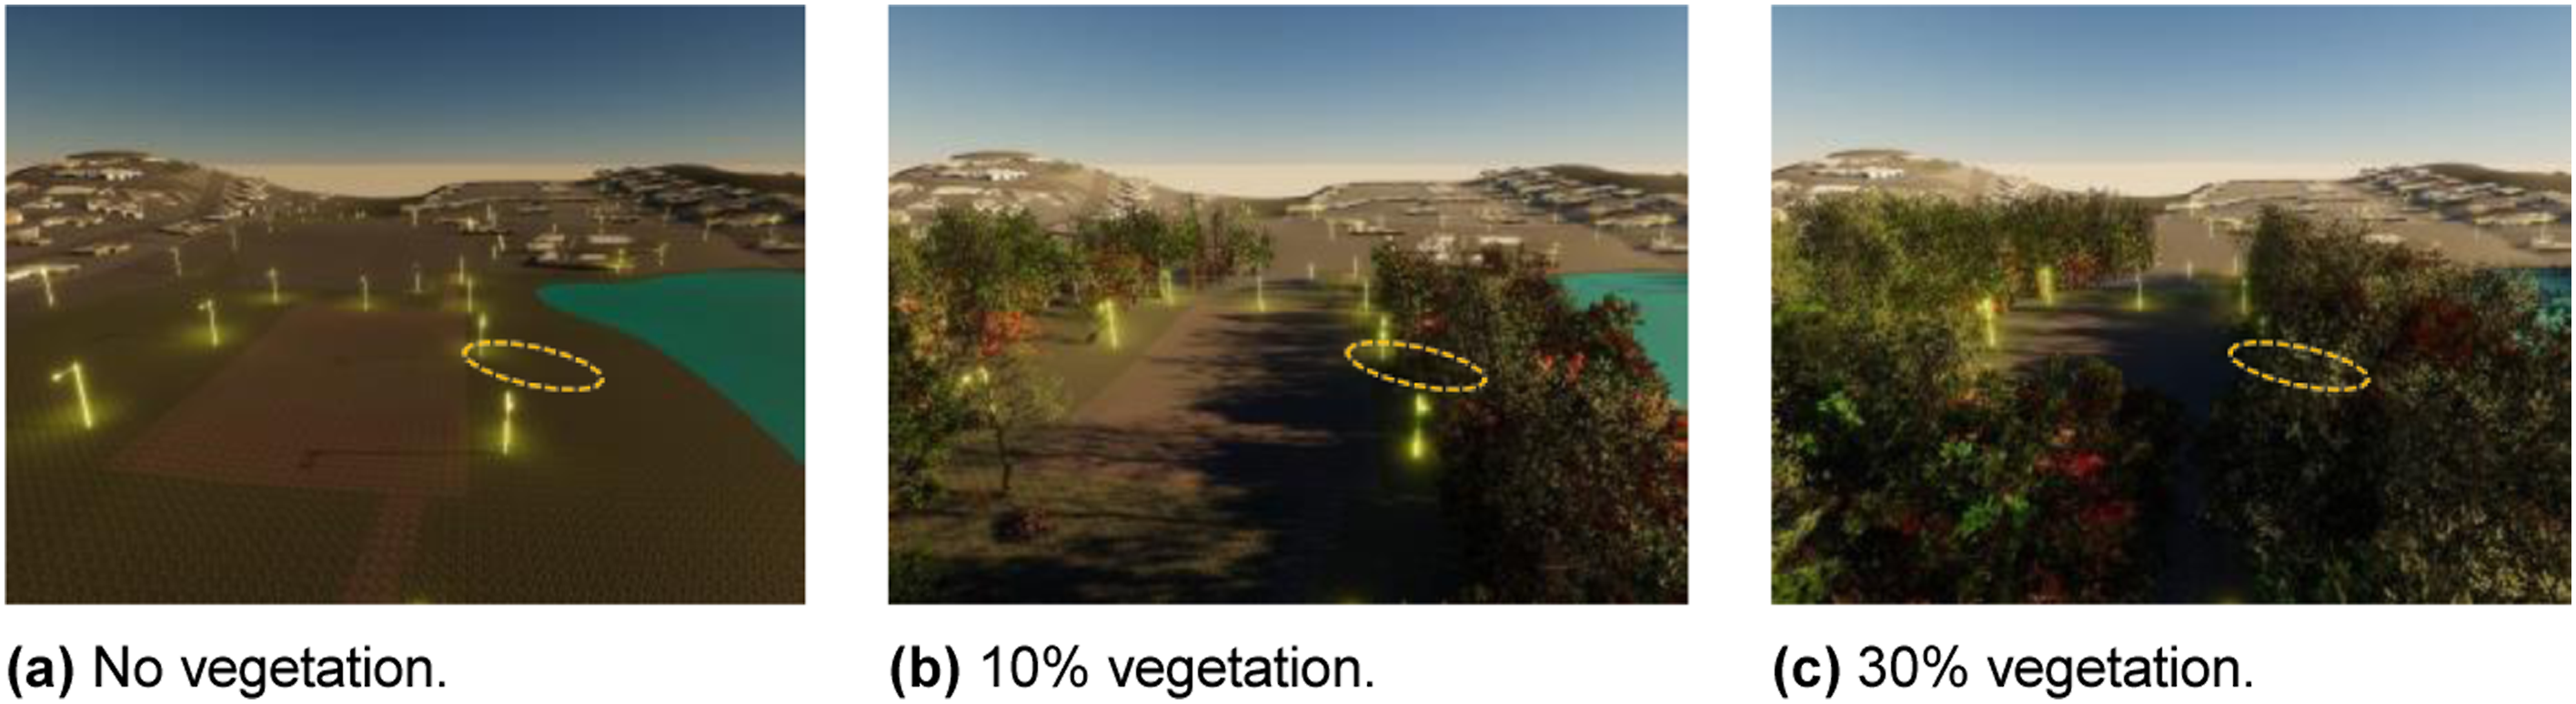
Case study 3—Transformative knowledge
In this study case, we explore the use of the NorDark-DT to support the visual analysis of multiple variables, combined into indices. This implementation allows the DT to incorporate external data and combine them with the light results in order to assess urban features. For example, we implement the assessment of a walkability index in the study area in Ålesund (Figure 8(a)). Wakability is a measure of to what extent the built environment (e.g., sidewalk or a path in a green urban area) is friendly to walk (Leplat et al., 2022; Wang and Yang, 2019). Case Study 3—Results visualization. The figure shows the visualization in the NorDark-DT of a walkability index in the study area in Ålesund (a). The best walkable conditions are in blue color and the worst are in red color. We simulated the actual light conditions in the path (b) and an intervention where we improved the illumination conditions by adding light poles and changing the luminaires (c). The walkability index is based on three variables that were standardized from 0 to 1: slope (d), illumination (e), and quality of the ground (f) and it was assessed for the actual conditions (g), and two simulated planned intervention considering the improvement of illumination (h) and the ground conditions (i) of the path. (a) Study area (Lerstadvatnet naturreservat, Ålesund, Norway), (b) Light infrastructure and actual illumination conditions, (c) Light infrastructure for simulated planned intervention, (d) Standardized slope map, maximum slope of 25%, (e) Standardized light map for the actual conditions, (f) Standardized path ground map for the actual conditions, (g) Walkability map for the current conditions, (f) Standardized path ground map for the actual conditions(h) Walkability map for the simulated light intervention, and (i) Walkability map for the simulated light intervention and path segment improvement.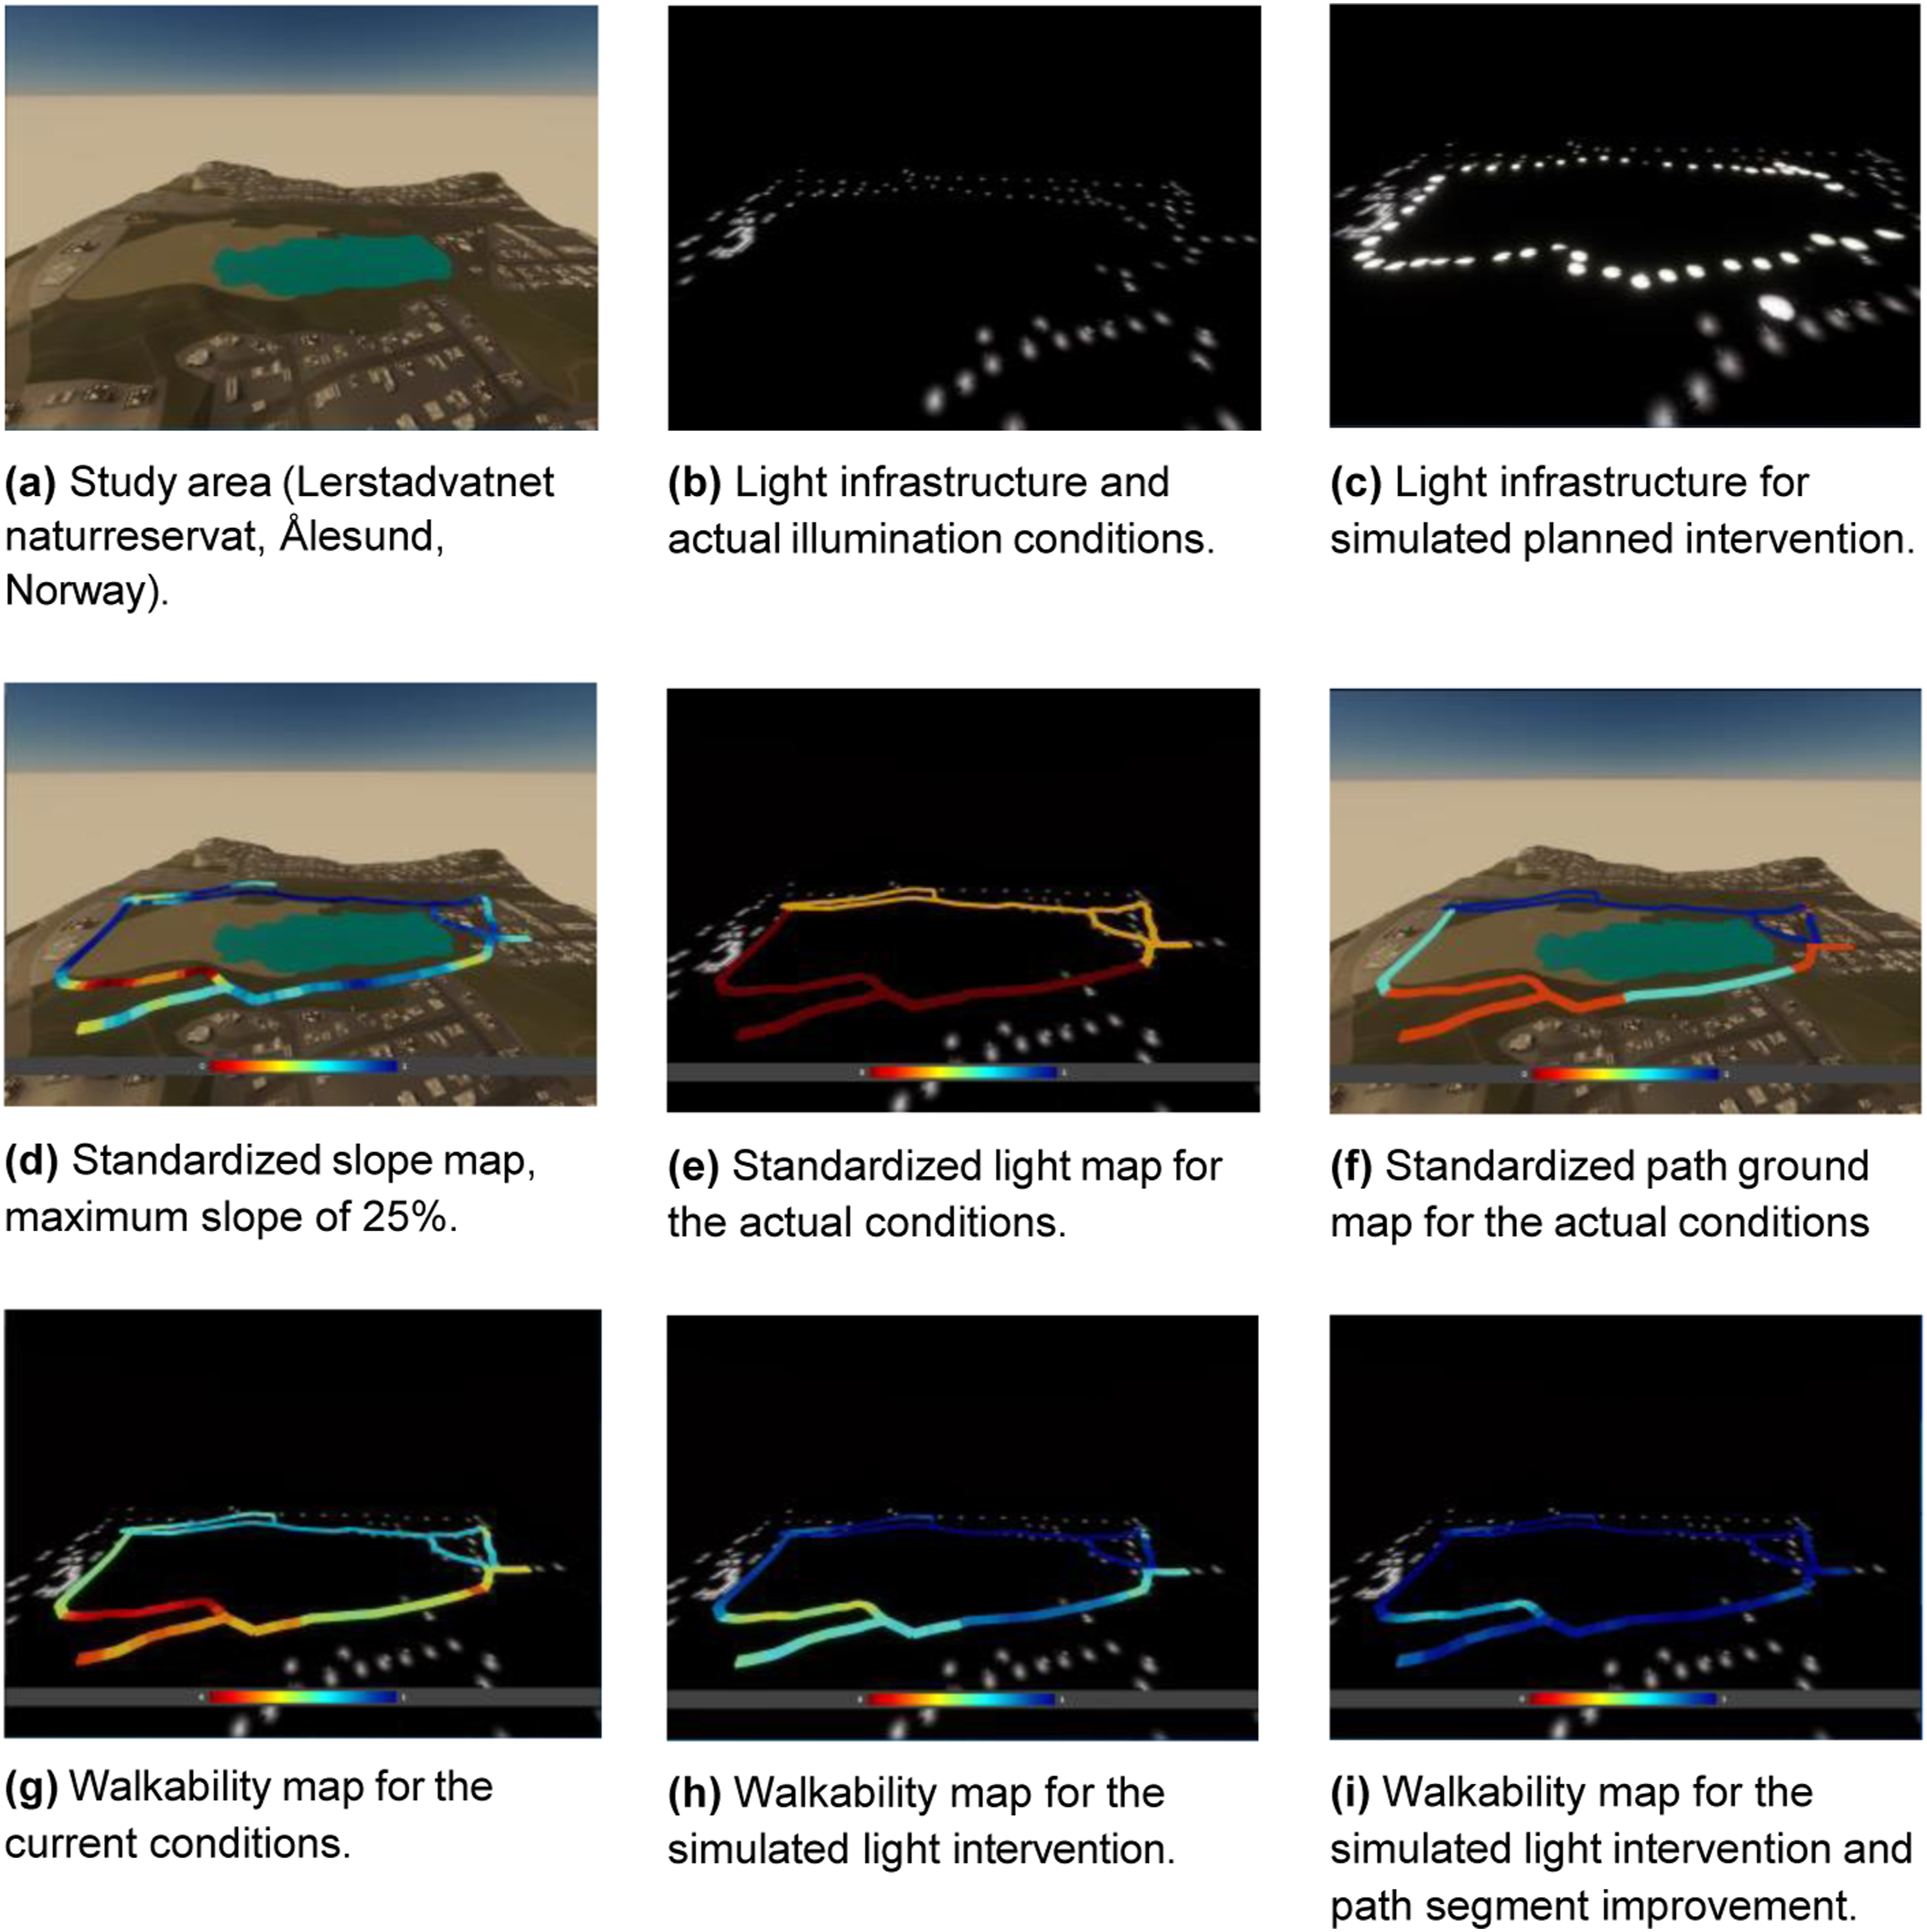
In this example, the walkability index is computed based on the weighted aggregation of three variables: illumination, slope, and quality of ground in the pathway (see (Leplat et al., 2022) for more details). The variables were first standardized to values from 0 to 1, where 1 is the best condition (blue color) and zero is the worst (red color). The best conditions for walking are those associated with regions/paths in flat areas or with lower slopes, properly illuminated, and whose ground is uniform and compact.
Two scenarios are considered for the illumination: one based on the light infrastructure currently available in the area (Figure 8(b)), and another defined based on a planned intervention using the DT (Figure 8(c)). The actual path around the Lerstadvatnet naturreservat has slopes that reach 20% (Figure 8(d)). Light infrastructure is located mainly on the northern side of the path (Figure 8(e)). The ground of the path differs widely; the most used parts have good quality allowing the transit for wheelchair users, while other segments are more rough and narrow (Figure 8(f)).
We estimate the walkability index in the current conditions, and we also simulate the improvement of the illumination in the path and in the ground conditions. The three simulated scenarios are presented in Figure 8(g), (h), and (i). The visualization of the Wakability index for the current conditions (Figure 8(g)) shows that most of the path has lower or poor conditions being difficult to use by citizens with low mobility, for example. When we simulate the installation of light infrastructure (Figure 8(c)), the index improves in most of the path segments (Figure 8(h)). When we simulate an improvement in the quality of the ground to an optimal condition, most of the path presents good quality for walking (Figure 8(i)).
In this study case, we exemplify how the proposed urban digital twin can be used not only to visualize the changes in the urban infrastructure but also to evaluate indices that combine results from simulated light interventions with other relevant variables that should be accounted for in the decision-making process. The use of such visualization tools can also be explored in the assessment of the relevance of multiple (potentially conflicting) variables, fostering better-informed discussion between stakeholders and promoting participatory planning and management of smart cities. For example, information on the presence of animals before and after an intervention can be encoded in a raster format (e.g., image) and combined with information related to the perception of human subjects (environmental psychological studies) or computed luminance maps (see Figure S11(b) for an example of a possible visualization).
The aggregated information could be used to assess lighting intervention alternatives considering different perspectives.
We acknowledge that analyses concerning changes over time play a pivotal role, especially concerning daylight differences depending on the location of the study site. Recently, we have been investigating new visualization methods Hu et al. (2023a, 2023b) to encode temporal changes related to lighting intervention analyses Hu et al. (2024) and their integration with Nordark-DT.
Discussion
Urban digital twins are promising rising tools for the design and management of sustainable cities. In this paper, we present the prototype of an urban digital twin developed to enhance the sustainable design of light infrastructure for the natural areas in cities. The NorDark project is, to our knowledge, one of the first attempts to provide a tool that can not only integrate information from different domains but also simulate different light infrastructure interventions. The preliminary results of this version have shown the large potential of using urban digital tools as a transdisciplinary tool to explore different research questions, explore management scenarios, and promote the sustainable development of our cities. However, several challenges have emerged regarding the design, implementation, and validation of digital twins for urban areas.
Challenges in the definition of requirements
The design of our urban digital twin has been based on a transdisciplinary approach and thus different knowledge domains have been integrated (Pohl, 2005; Ramadier, 2004). This approach is essential for the success of sustainable urban development and smart cities and thus transdisciplinary collaboration is a common element in building digital twins for urban areas (Caprari et al., 2022; Dembski et al., 2020; Mohammadi and Taylor, 2017; Schrotter and Hurzeler, 2020). However, one of the first challenges that arise when working with different domains is the lack of common semantics between disciplines and thus the potential misunderstanding of data and simulation results analyses (Gaziulusoy et al., 2016; Petrova- Antonova and Ilieva, 2019; Siebenhüner, 2018).
To lessen this problem, in our development, we focused on carefully defining the requirements and needs in the different domains (e.g., human perception, wildlife). We first focused on understanding the research questions and methodological approaches of the different teams and, later, explored how our urban digital tool could support them in properly addressing the envisioned research questions in their domains. This has required several collaborative meetings with each team of the NorDark research project to work and explore together the different functionalities. This phase demanded more time than we anticipated as additional meetings were needed to properly understand needs in terms of lighting infrastructure planning and information visualization.
At the same time, more time was demanded to align our own needs and views with those of our partners. It was not uncommon to redesign the features of the twin based on the creation or redefinition of requirements over time. To handle the definition of the requirements under this dynamic setting, we adopted an agile development strategy (Sommerville, 2019). Two-week development sprints were intercalated with reflection and planning meetings, some of them involving consortium partners. Furthermore, monthly meetings and annual workshops were used to present the urban digital twin and collect feedback.
We are confident that this time investment was essential for the development of this tool. Since we are still in the first stage of development, the envisioned usage scenarios need to be further investigated and validated. It is expected that the structure and functionalities of the NorDark-DT might change in the future.
Another challenge that emerges immediately in transdisciplinary work is the conflicting needs between different stakeholders (Gaziulusoy et al., 2016; Ramadier, 2004). Urban digital twins can help to explore these conflicts by simulating proposed solutions previous to any intervention and thus analyse the trade-off between different management alternatives. A clear example of this type of trade-off in the NorDark project is the need to have an illuminated and safer path for humans versus the need to maintain natural light conditions for animals.
To facilitate the discussion among stakeholders, we have implemented functionalities that allow the comparison of different simulated management interventions. Examples include the visual comparison of different lighting conditions (including natural and artificial light) and the luminance values that can be obtained in a graph and/or in a map (see Figures S10(a) and S10(b) e.g.). These alternatives to visualize simulation results can allow for better collaboration and communication between different disciplines, as well as a better understanding of how different disciplines interact with each other (Murphy et al., 2016; Vannier et al., 2022).
Challenges in the implementation
The implementation of the NorDark-DT relied on the use of Unity and other external libraries. The use of Unity led to a fast development process, as multiple pre-existing libraries and assets could be used in the implementation of key features (e.g., vegetation system) straightforwardly. One challenge imposed by the use of those libraries, however, refers to the lack of transparency concerning the implemented algorithms. In several cases, it is not possible to modify (extend or adapt) part of those algorithms to accommodate novel requirements. One alternative we consider refers to the use of well-established open-source libraries in the implementation of the different digital twin components. One example is the LuxPy Python Toolbox (Smet, 2020), recently proposed for lighting calculations. The use of open-source platforms (e.g., Godot 6 ) is also considered in future releases.
Challenges in the validation for different dimensions
NorDark-DT integrates data and simulation results to address needs defined across different disciplines. Analyses should support the assessment of several what-if scenarios that often consider conflicting factors (variables) and interests. Properly validating such a tool is very challenging, especially since its assessment must consider multiple evaluation dimensions and multiple stakeholders. One type of validation is the assessment of the usability of the tool. Usability studies (Sagar and Saha, 2017) are often based on pre-defined tasks conducted to ensure that the tool meets the most relevant requirements. Other important aspects are the usefulness of the tool, the efficiency in achieving goals, learnability, and subjective satisfaction. The selection of participants (involving key stakeholders with different backgrounds and expertise) and the definition of suitable tasks should account for the different possibilities of use of the tool. Another type of validation is the perception-based studies (Bellazzi et al., 2022; Rahm and Johansson, 2018). These validations are conducted to assess the extent to which simulated environments properly mimic reality (physical world). In the case of the NorDark-DT, we can investigate the extent to which the digital twin can be used to support lab-based assessments of different lighting conditions and avoid unnecessary costly field-based analyses at the early stages of the planning activities. Also, on-the-field assessment methodologies could be experienced, simulated, and tested in the DT beforehand. Finally, simulation results, related to light calculations and energy consumption predictions, need to be compared with real-world measurements (Xia et al., 2021). The definition of integrated suitable protocols that combine all those validation dimensions is lacking in the literature.
Future research directions
The identified challenges open up opportunities for relevant research directions. The investigation of integrative approaches for supporting the development and assessment of the digital twin is needed. Possible research directions include Design Thinking (Parizi et al., 2022) and Living Labs (Slingerlandand, n.d.), which have been demonstrated to be effective in the multi-factorial development of systems.
The DT itself will be further developed to accommodate the assessment of energy costs associated with designed light infrastructure alternatives defined in the tool. Mixed scenarios, which account for real-world data obtained by sensors and simulated data obtained in the twin, are expected to be supported. In another direction, more features related to the support of the definition of scenarios of analysis will be incorporated into the tool. One example is the (semi-)automatic generation of vegetation and buildings to compose scenes based on remote sensing images. The existence of such a module would speed up the customization of the digital twin to new locations.
Another promising research direction refers to tailoring NorDark-DT to the (semi-) automatic assessment of lighting intervention scenarios concerning existing standards and guidelines. For example, a designed light intervention for a Swedish location could be checked concerning existing regulations. Future work also encompasses enriching visualization tools to provide relevant contextual information. For example, in the next release, we plan to provide an interaction control to allow users to see overlaid labeled luminance contours on output maps. Not only animals but also the presence (occurrence) of people could be monitored through the tool, opening opportunities for analyzing the impact of a particular lighting intervention in security assessments.
Conclusions
This paper introduced NorDark-DT, an urban digital twin to support light intervention planning through transdisciplinary collaboration. Its design and implementation have been based on requirements defined according to different perspectives, involving insights from different disciplines: light design, environmental psychology, wildlife, and sustainability design. The DT is expected to support not only the planning of lighting interventions in green urban areas but also support transformative knowledge acquisition based on the analysis of potentially conflicting variables, such as the light impact on animals and humans, energy consumption, and aesthetic perception. The implementation of DT encompasses multiple features, ranging from the specification of environmental conditions (e.g., vegetation and weather conditions) that should be taken into account in the lighting intervention planning to the support of analyses based on the comparison of luminance maps considering different scenarios. 7
This paper also presented and discussed compelling usage scenarios that demonstrate the potential of the DT in fulfilling identified requirements. Challenges and lessons learned from the DT design and implementation process were also shared. They are expected to serve as valuable information for developers, stakeholders, and practitioners, interested in the creation of DTs, especially for urban planning applications.
Supplemental Material
Supplemental Material - NorDark-DT: A digital twin for urban lighting infrastructure planning and analysis
Supplemental Material for NorDark-DT: A digital twin for urban lighting infrastructure planning and analysis by Léo Leplat, Claudia López-Alfaro, Arne Styve, and Ricardo da Silva Torres in Environment and Planning B: Urban Analytics and City Science
Footnotes
Acknowledgements
We thank consortium partners of the NorDark project for their valuable contributions to the definition of the requirements addressed in the current version of NorDark-DT.
Declaration of conflicting interests
The author(s) declared no potential conflicts of interest with respect to the research, authorship, and/or publication of this article.
Funding
The author(s) disclosed receipt of the following financial support for the research, authorship, and/or publication of this article: This work has been conducted in the context of the NorDark project (grant 105116), funded by NordForsk. This work was also partially funded by the NFR SMARTPLAN (310056) and Twin Fjord (320627) projects.
Supplemental Material
Supplemental material for this article is available online.
Notes
References
Supplementary Material
Please find the following supplemental material available below.
For Open Access articles published under a Creative Commons License, all supplemental material carries the same license as the article it is associated with.
For non-Open Access articles published, all supplemental material carries a non-exclusive license, and permission requests for re-use of supplemental material or any part of supplemental material shall be sent directly to the copyright owner as specified in the copyright notice associated with the article.