
Abstract
The importance of urban form as a key factor affecting future development and transformation patterns is well-recognised in urban morphology. However, despite the need for a diachronic approach to rigorously understand the form-change relationship, studies utilising longitudinal datasets remain scarce, and only a small fraction employs quantitative methodologies and morphometric approaches. This paper aims to quantitatively examine how the character of urban form elements and their spatial arrangements influence patterns of physical change, and to assess the performance of geometric and configurational urban form measures of plots, buildings, and streets in explaining physical change patterns over time. We hypothesise that configurational measures, being more sensitive to the relations between urban form elements, can better explain physical changes compared to conventional geometric measures predominantly adopted thus far. To test this hypothesis, we present a diachronic and quantitative methodology to measure urban form conditions and the patterns of physical change in Midtown Manhattan through four time frames (1890, 1920, 1956, and 2021), using a longitudinal geospatial database generated from historical cartographic resources and recent digital datasets. The association between urban form and physical change is demonstrated through statistical analysis. The findings prove that while the prevailing hypotheses emphasising the effect of geometric measures, such as size and shape, are often off the mark, configurational and access-based measures of plots and streets can accurately describe the dynamic relationships between form and change. The character of urban form patterns and structures measured by configurational variables is more reliable than the individual and geometric quality of urban form elements in explaining the dynamics of physical change and persistence. Our empirical findings add to the rapidly expanding fields of urban morphometrics and provide data-informed insights to improve the resilience and adaptive capacity of urban spaces.
Introduction
Understanding the relationship between urban form and change is central to urban morphology. The common approach among the fundamental schools of thought is to develop generalisable knowledge of urban form and theories of autonomous change describing how form changes under different conditions (Moudon, 1986; Scheer, 2015). To that end, while externalist approaches conceptualise urban form as a dependent variable shaped by historical, geographical, and economic factors, internalist approaches aim to find ‘the primary explanation for morphogenesis in the constraints and potential for change present within the system itself’ (Gauthier and Gilliland, 2005: 44). Adopting the latter approach, we argue that urban form should not be understood as a passive resultant of external processes. Instead, urban form is an active component that sets the spatial conditions and affects future development patterns by hindering some choices and promoting others. As the socio-spatial processes never occur tabula rasa but within the inherited space constituted by the configuration and distribution of physical elements, ‘space makes a difference’ (Sayer, 2000: 144) and measurement and geometry are valuable means to understand its capacity to accept change (Martin and March, 1972).
Although it is a fundamental component of urban morphology, the lack of diachronic investigation on change has widely been recognised because ‘it requires a long-term perspective and a time consuming search to uncover reliable information about its nature and incidence’ (Whitehand and Carr, 1999: 1662). The scarcity of longitudinal datasets, which are hard to compile from historical resources, constitutes a significant barrier for diachronic urban form studies. A comprehensive review of two leading journals of urban morphology, Environment and Planning B and Urban Morphology, revealed that 95% of quantitative urban form studies are synchronic – that is, they are not interested in the dimension of time and processes of change (Fleischmann et al., 2021).
Not only are diachronic urban form studies scarce, but these exceptionally few studies also exhibit significant constraints. Most of the existing studies focus on urban growth at the metropolitan scale and leave the plots, buildings, and other fine-grain details of urban form underrepresented (Galster, 2001; Serra and Pinho, 2011; Song and Knaap, 2004). In addition, the most influential diachronic studies focussing on the fine-grain components of urban form have predominantly been of a historical-qualitative kind (Caniggia and Maffei, 2001; Conzen, 1960; Moudon, 1986). While these studies bring a profound understanding of how the form of cities evolves, they do not offer quantitative methods to systematically define urban form and measure its relationship with the patterns of change.
Although the recent diachronic studies lean more towards quantitative approaches, they predominantly utilise a few conventional geometric variables to describe urban form conditions, such as the size and shape of plots and building footprints (Törmä et al., 2016; Hallowell and Baran, 2020) or width of streets (Scheer and Ferdelman, 2001). On the other hand, the recent quantitative morphology research demonstrated the reliability of configurational urban form descriptions in explaining various socio-spatial processes (Berghauser Pont et al., 2019; Bobkova et al., 2021). While conventional geometric variables describe the quality of individual urban form elements in isolation, configurational variables describe those elements’ relational pattern and contextual character. We argue that operationalising configurational measures in longitudinal analysis of urban form holds the potential to reveal new insights about the evolution of urban form.
In this paper, we aim to compare various measures of plots, buildings, and streets to assess their reliability in explaining physical change patterns. We hypothesise that configurational measures, being more sensitive to the relations between urban form elements, can better explain physical changes than conventional geometric measures. To test this, we present a diachronic and quantitative methodology examining the relationship between urban form and physical change in Midtown Manhattan over four time frames: 1890, 1920, 1956, and 2021. The proposed approach differs from earlier historical-qualitative studies by incorporating the recently advanced configurational measures and utilising a comprehensive longitudinal dataset. The findings contribute to the underrepresented form-change relationship from a quantitative and evidence-based perspective and demonstrate the reliability of configurational measures in explaining physical change patterns in cities.
In the next section, we briefly review diachronic studies examining the relationship between urban form and physical change to frame the prevailing hypotheses within the field. The methodology section describes the identified urban form descriptions and main steps of the spatial and statistical analyses. In the last section, the critical discussion of the findings provides a data-informed and empirical understanding of the relationship between urban form and change and highlights the influential role of urban form in guiding long-term physical change in cities.
Measuring urban form and change
Role of urban form in guiding spatial dynamics
Urban morphology not only studies the form of cities but aims to describe how they change. Besides the key elements and scales of resolution that make up the physical structure, the concepts of time and change are central to the discipline (Moudon, 1997). According to Scheer (2015), urban morphology does not aim to achieve a complete description of the spatial dynamics which are potentially affected by various non-formal and external conditions. Instead, it is interested in ‘describing, defining, and theorising a single segment of urban knowledge: form and formal change’ (ibid: p.3).
The existent literature focussing on the relationship between form and change has widely recognised that the spatial dynamics are not haphazard but follow a set of discernible laws guiding the rate of change and persistence (Levy, 1999). According to Conzen (1960), street network is the most persistent element of the town plan, as it requires centrally coordinated efforts and investments to be changed. While buildings are the most transient aspect of urban form, plots are considerably permanent, reflecting their importance ‘in shaping city form and in controlling the nature and the extent of changes over time’ (Moudon, 1986: xvii).
Furthermore, several models of change demonstrated that the growth and change of urban form tend to occur in cyclical processes. While the Burgage Cycle describes the relationship between the progressive subdivision of urban land into plots and the parallel increase in built density (Conzen, 1960), the Territorial Development Cycle highlights the role of streets in forming urban tissues and organising gradual evolution within a broader territorial scale (Caniggia and Maffei, 2001). Both models share a common ground in highlighting the importance of initial spatial conditions on the processes of change, as ‘every cycle and phase have to accept conditionings enforced by previous phases and cycles’ (Caniggia and Maffei, 2001: 238). This understanding brings the urban form to centre stage as one of the critical ingredients limiting or expanding processes of change.
Research in form and change relationship
Overview of existing diachronic studies focusing on the relationship between urban form and physical change.
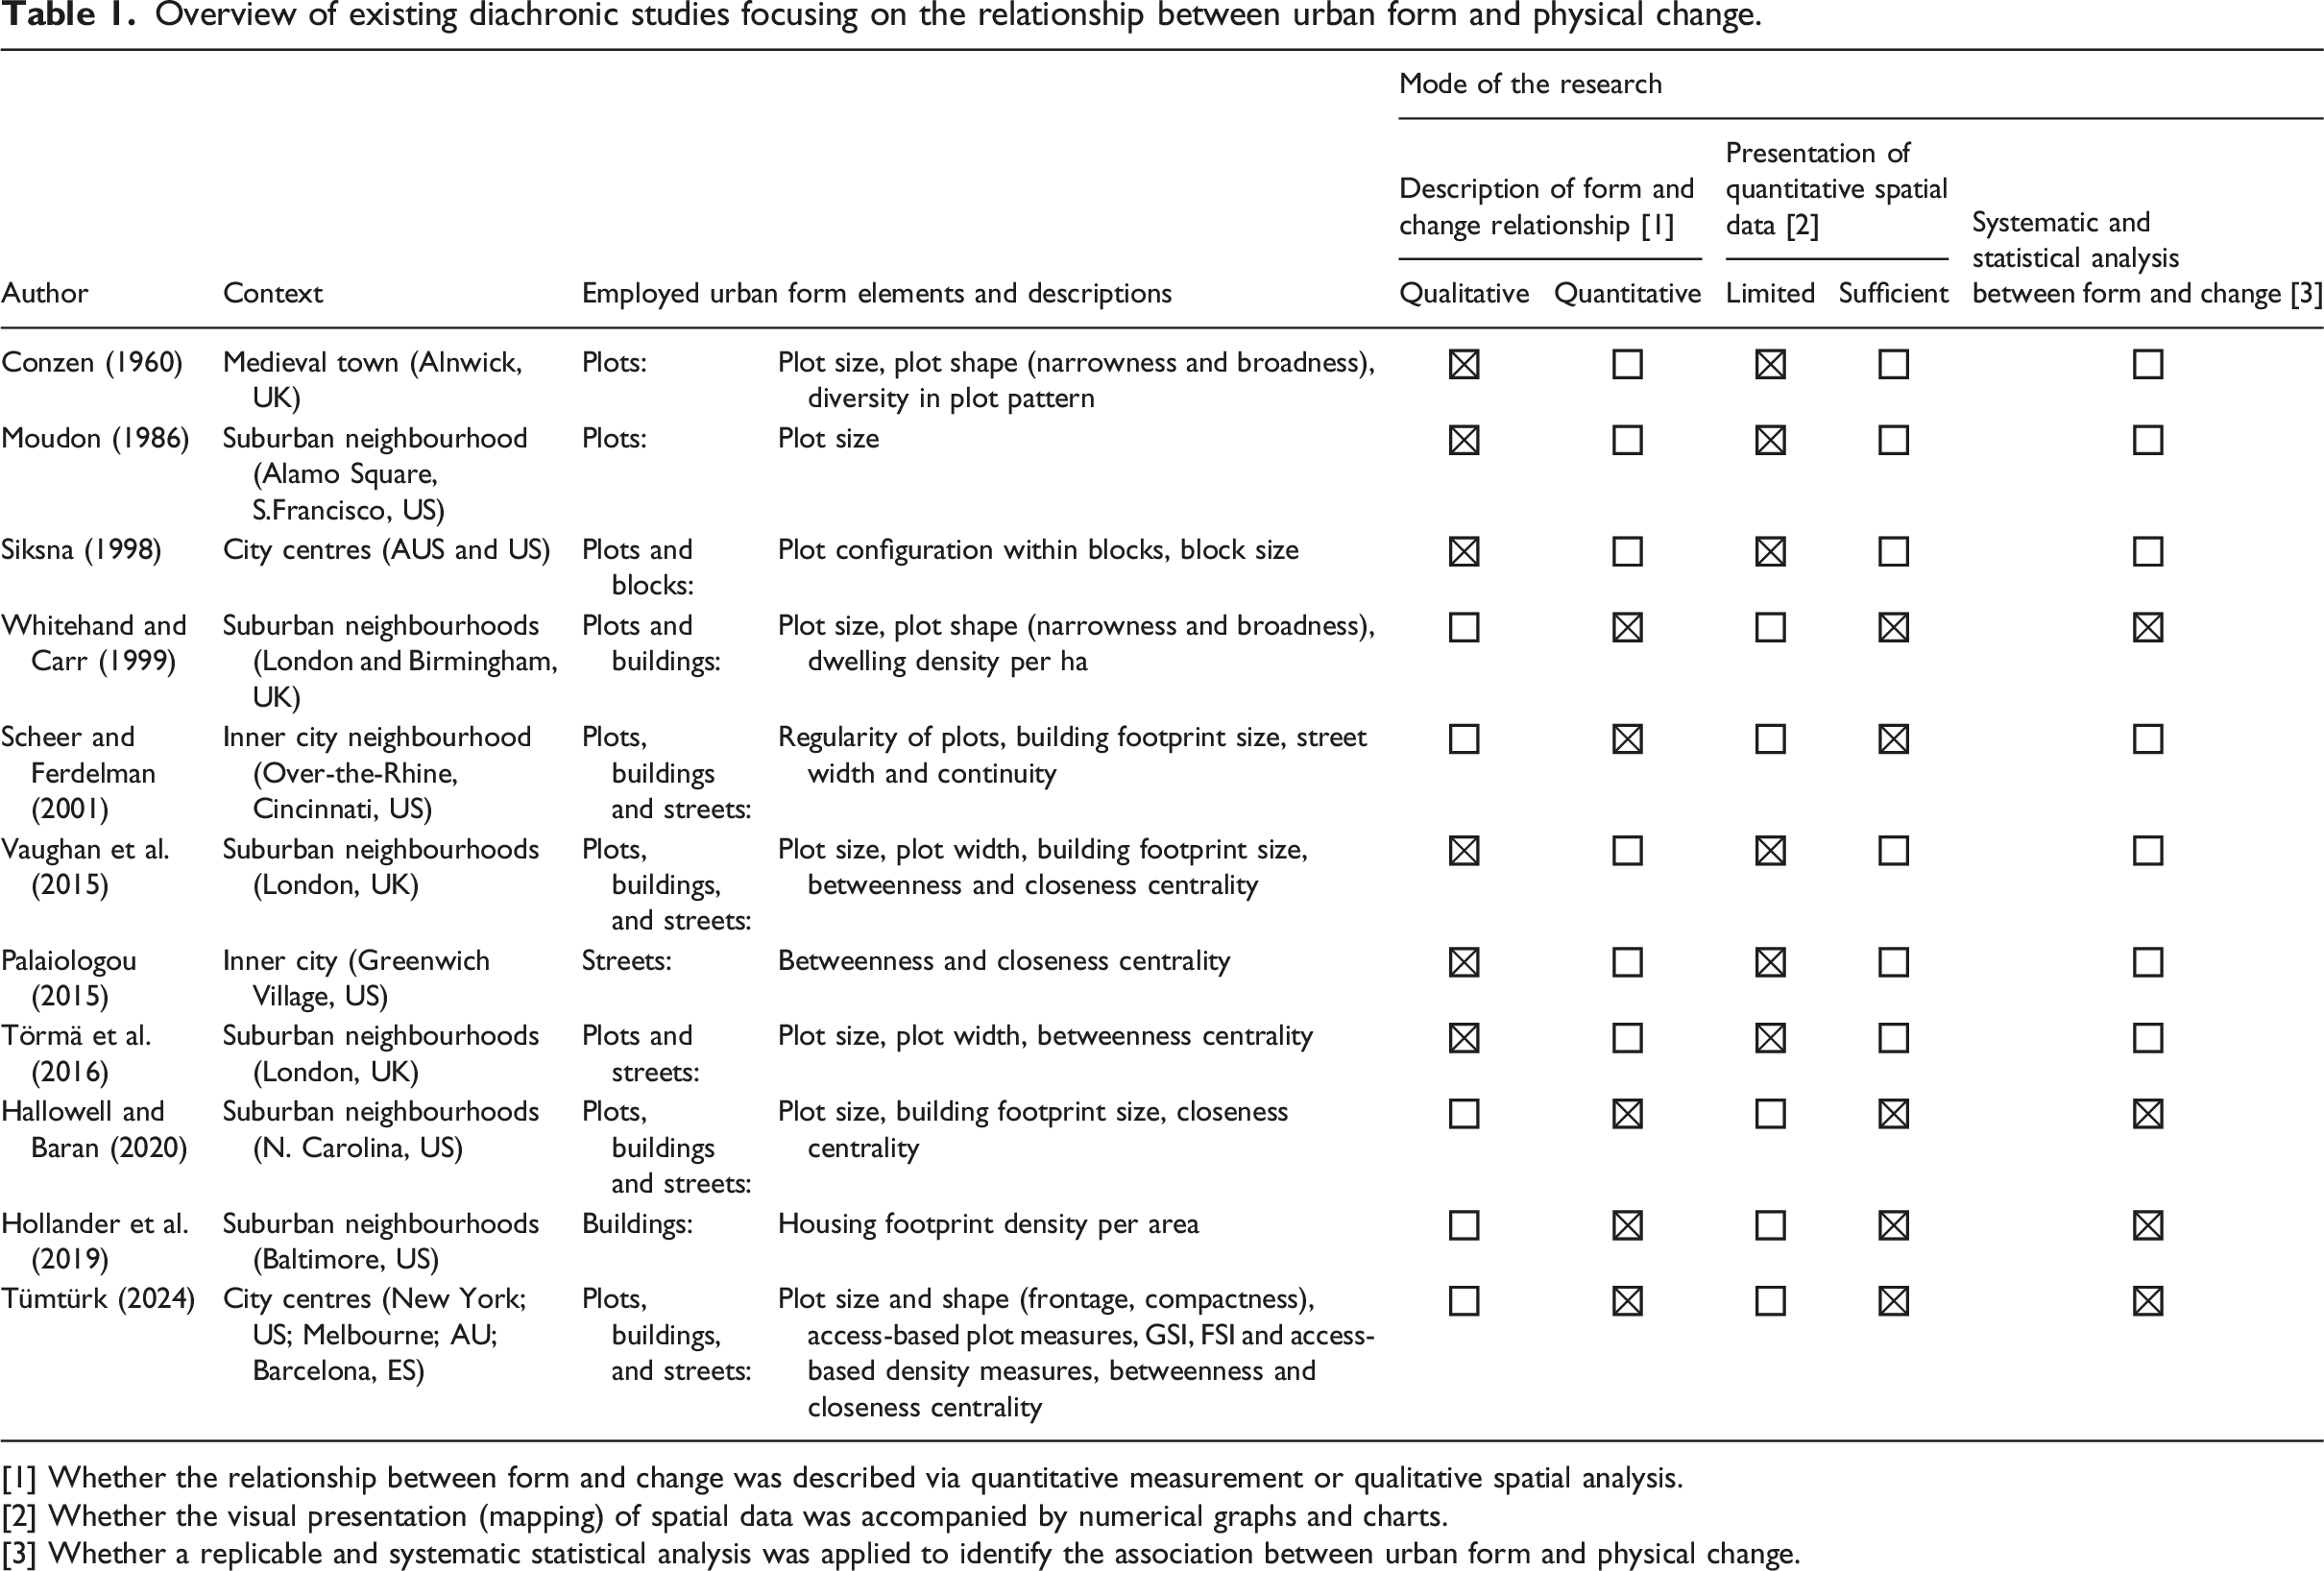
[1] Whether the relationship between form and change was described via quantitative measurement or qualitative spatial analysis.
[2] Whether the visual presentation (mapping) of spatial data was accompanied by numerical graphs and charts.
[3] Whether a replicable and systematic statistical analysis was applied to identify the association between urban form and physical change.
Within these studies, the most influential variables were recognised as plot size and shape. According to Moudon (1986), as the amalgamation of smaller and many plots requires more effort, time, and cost, ‘the smaller the typical lot in any given area, the greater the difficulty of changing the environment’ (p.141). Furthermore, while broader and spacious plots were more susceptible to physical change, narrow plots were more persistent and had less scope for physical alterations (Whitehand and Carr, 1999; Törmä et al., 2016). Smaller and narrower plots were also widely recognised as more successful in accommodating functional adaptations contributing to their physical longevity (Cantarino and Netto, 2017; Vaughan et al., 2015).
The effect of building characteristics on physical change tends to be underrepresented in the field, and existing research often presents inconclusive findings. While several studies demonstrated that the rate of demolishment in smaller building footprints is comparatively higher than larger ones (Kolkwitz et al., 2023; Scheer and Ferdelman, 2001), Hallowell and Baran (2020) showed that the relationship between footprint size and physical change varies significantly at different analysis periods. Furthermore, the relationship between built density and physical change exhibits variations depending on the metrics employed. Whitehand and Carr (1999) argued that there is a negative relationship between dwelling density per hectare and physical change. By employing the measure of footprint density, Hollander et al. (2019) conversely demonstrated that denser neighbourhoods are more likely to experience physical change.
Examining the effect of street network on physical change, Scheer and Ferdelman (2001) argued that streets with greater width and continuity accommodate higher rates of physical change. Integrating configurational analysis with geometric measures of Conzenian analysis (Griffiths et al., 2010), several studies confirmed the positive relationship between street centrality and physical change in suburban neighbourhoods (Törmä et al., 2016; Hallowell and Baran, 2020). On the other hand, Palaiologou (2015) demonstrated that streets having higher closeness centrality ensured physical persistence in Greenwich Village, New York. It suggests that the effect of street configuration on physical change could be somewhat different in various contexts and requires further empirical research.
Building upon Fleischmann et al.’s (2021) prior finding on the scarcity of quantitative diachronic research in urban morphology, our review in Table 1 further underscores the persisting limitations in the field. Firstly, the majority of the existing studies were predominantly conducted in suburban and relatively less dense residential neighbourhoods, manifesting rather slow dynamics of change. Further examination of the prevailing hypotheses within more dynamic urban settings remains valid. Secondly, apart from a few notable exceptions, most of these studies adopt qualitative approaches rather than quantitative methods and statistical analysis techniques. Thirdly, the majority of the utilised metrics and measures within existing research lean towards conventional geometric measures and do not incorporate configurational measures of plots and buildings.
Geometric and configurational urban form descriptions
In response to the identified limitations, we not only present a quantitative method but also expand the array of common geometric variables with configurational urban form descriptions. Configuration principally describes the relative position of an element within the entire structure (Hillier and Hanson, 1984) and analyses the relation between parts and whole, as it is common in network analysis research. While conventional typo-morphological studies in urban morphology tend to examine the geometric qualities of individual elements (such as size and shape), the configurational approach stresses the relational dimension of urban structure and measures the character of patterns rather than individual elements (Berghauser Pont and Marcus, 2014; Marcus, 2010). Thus, configurational measures capture contextual characteristics of urban form elements rather than their individual qualities – for example, the quality of plot patterns within a relevant catchment instead of individual plots.
The recent shift from area-based (geometric) to location-based (configurational) measures in quantitative urban form studies proved the reliability of configurational urban form descriptions in explaining various socio-spatial phenomena (Berghauser Pont et al., 2019; Bobkova et al., 2019, 2021). Given that these recent studies are typically synchronic, we argue that utilisation of configurational measures in longitudinal research holds a significant potential to reveal novel understandings about form and change relationship.
In this paper, we aim to quantitatively examine the relationship between urban form and physical change by comparing the performance of geometric and configurational measures in explaining physical change patterns. Acknowledging that urban form elements and their spatial arrangements influence the likelihood and patterns of change, we hypothesise that configurational measures, accounting for relational and contextual properties, are more reliable predictors of change than geometric measures focussing on individual elements. To test this, we conceptualise geometric and configurational measures of plots, buildings, and streets as independent variables, and the occurrence of physical change, identified through building demolition or new construction, as the dependent variable. In the following section, we proposed a methodological framework employing statistical analysis to uncover the relationship between urban form characteristics and the likelihood of change or persistence.
Methodology: Quantitative and diachronic analysis of urban form evolution
The main methodological steps taken in our study are (a) identification of spatial and temporal boundaries of the case study; (b) preparation of the longitudinal geospatial database; (c) identification of the quantitative urban form descriptions and measure of physical change; and (d) statistical analysis to test the association between form and change.
Case study: Midtown Manhattan, 1890–2021
Our study focuses on Midtown Manhattan, which has experienced highly dynamic patterns of physical transformation after it was established with a uniform street grid and parcellation of the 1811 Commissioners’ Plan (Stern et al., 1999). The exceptional morphological variety proliferating from these simple preconditions makes the identified study area (2.5 km2) an ideal test bed to investigate how urban form evolves under different material conditions (Figure 1). In order to overcome the edge effect (Gil, 2017), defined spatial boundaries were extended by 400 m and aligned with the shoreline of Manhattan Island as the natural boundaries of the context. Methodological framework of the study.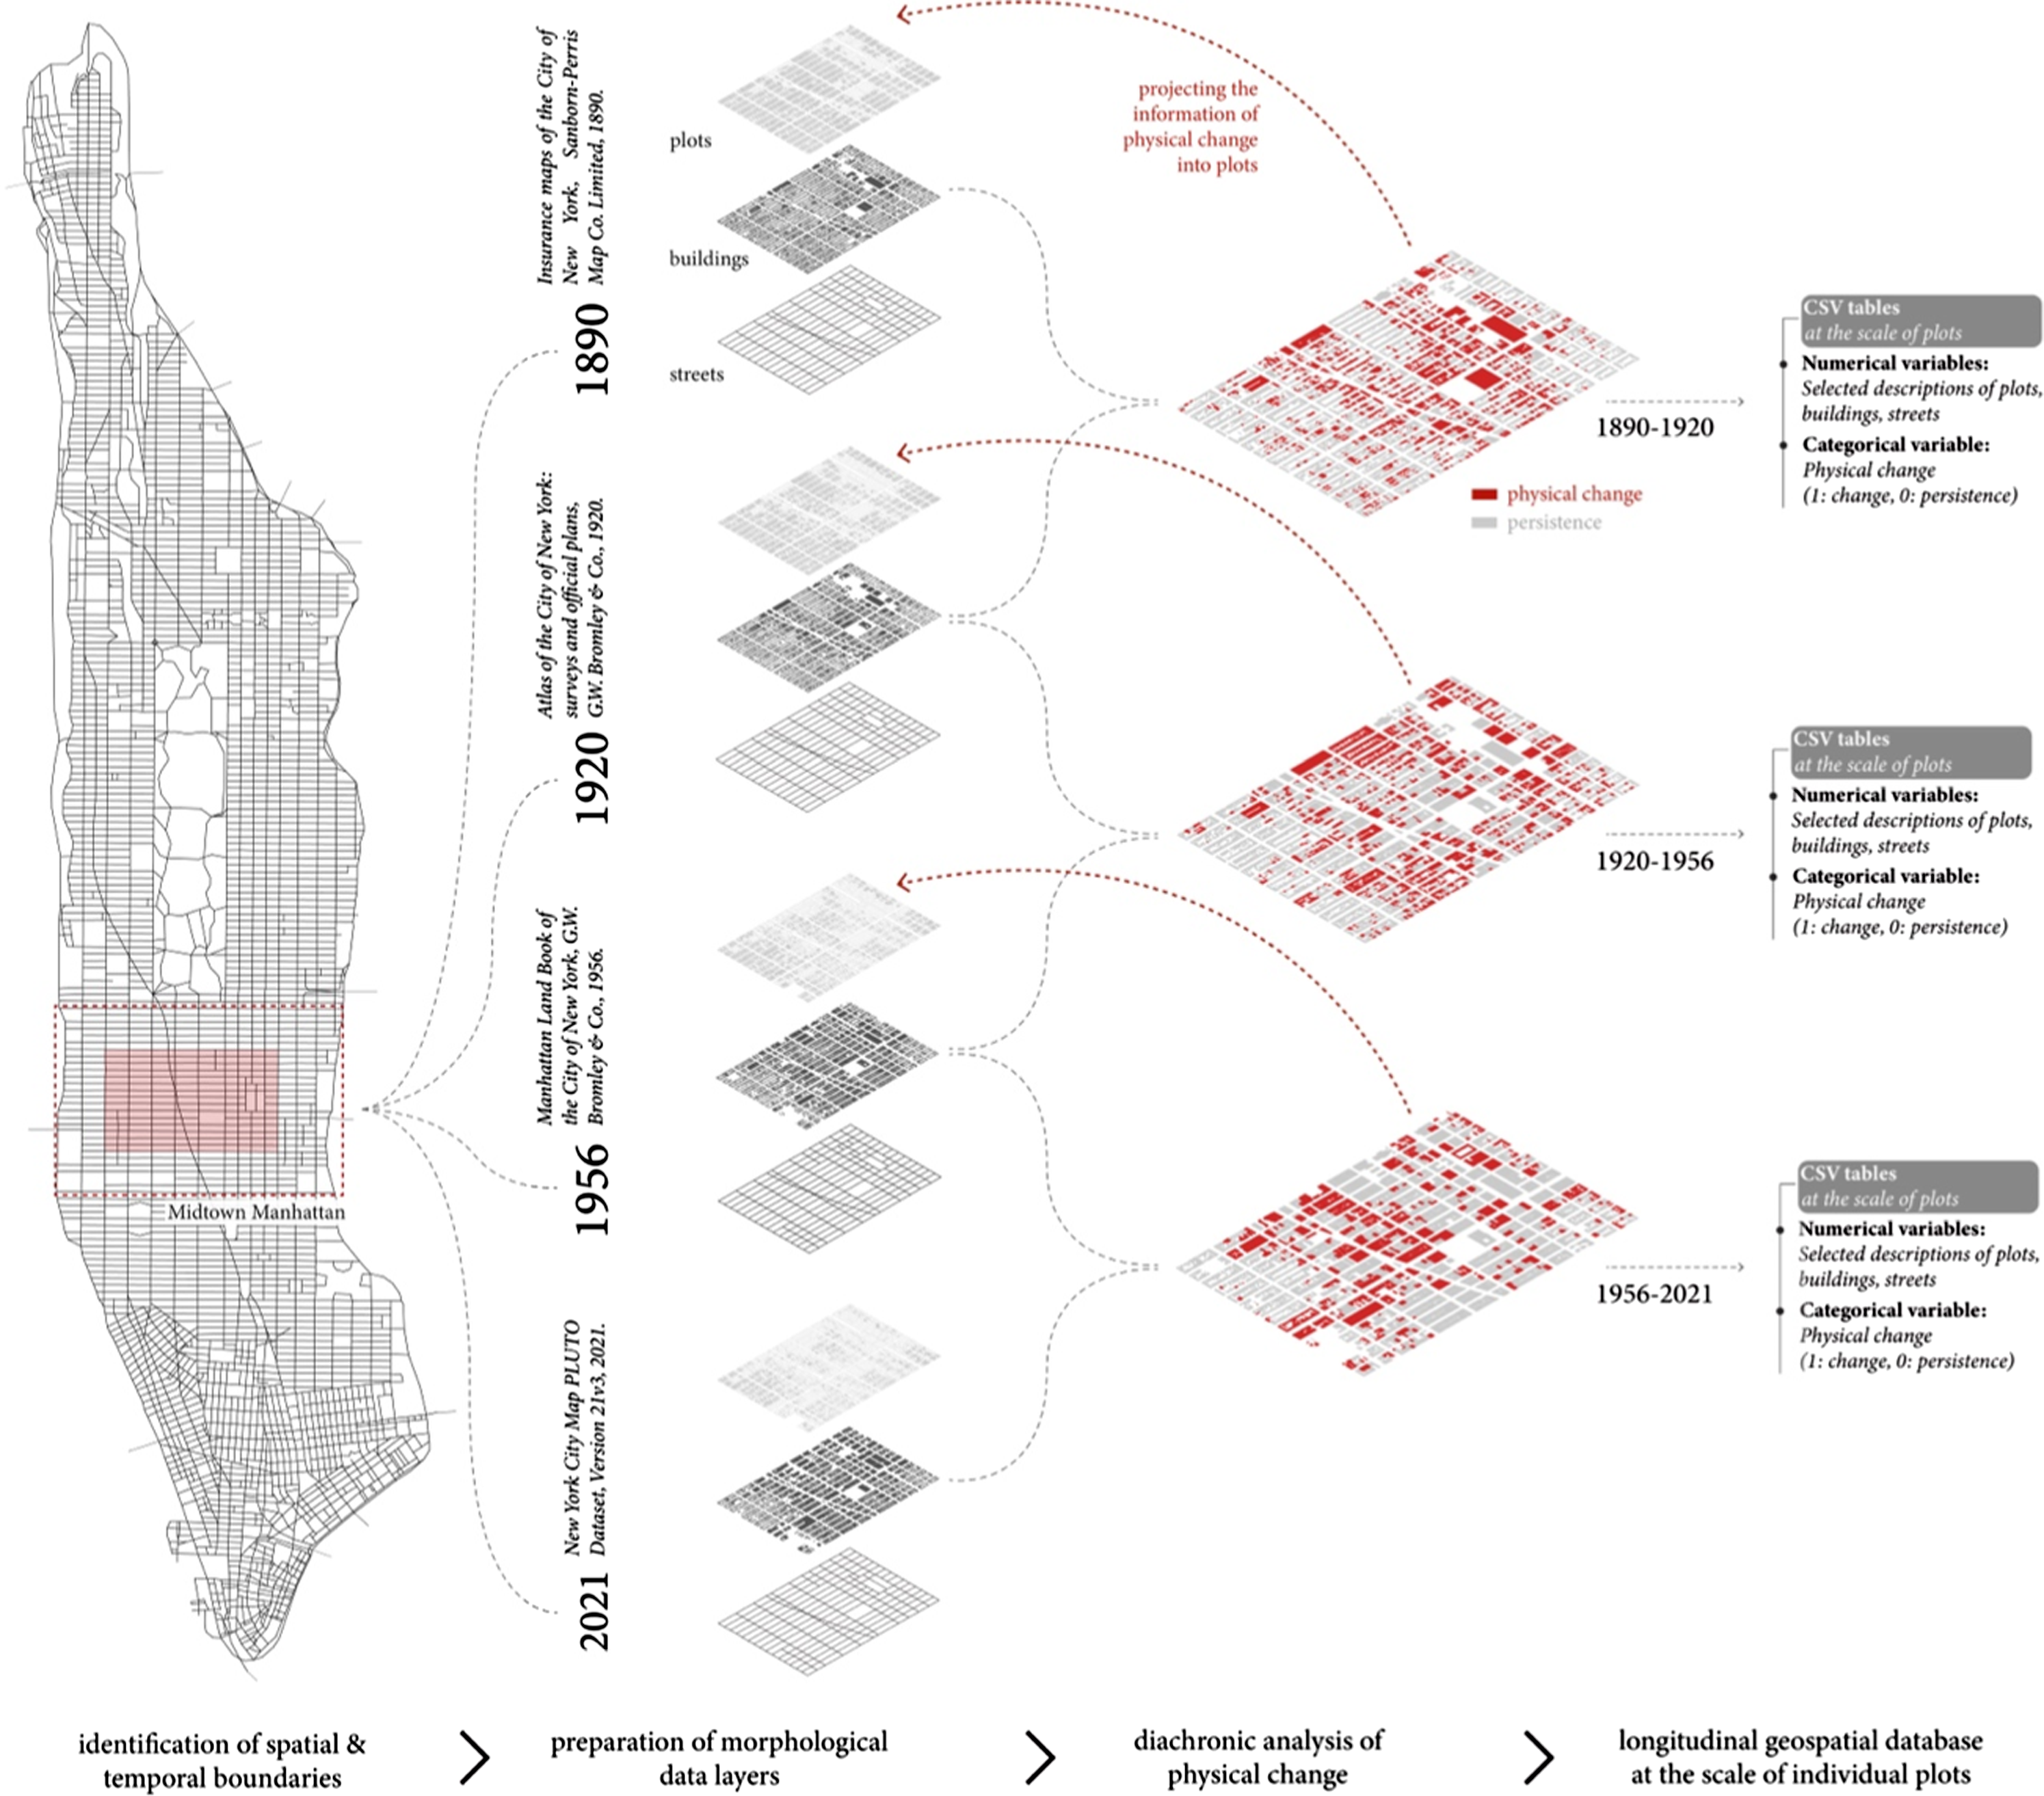
Temporal boundaries were defined by four different years: 1890, 1920, 1956, and 2021. The chosen timeframes overlap with the pivotal historical junctures in the urbanisation process of the city, such as the introduction of major zoning regulations. Furthermore, the selected timeframes align well with the recurrent moments of alteration in the structure of urban form put forward in various urban form studies: transition from industrial to modernist and towards contemporary urban form typologies (Boeing, 2021; Fleischmann et al., 2022; Porta et al., 2014).
Preparation of longitudinal geospatial database
The data was compiled from cartographic resources retrieved from New York Public Library and PLUTO geospatial datasets (Tümtürk, 2023) (Figure 1). To that end, the geometrical features were meticulously digitised from georeferenced historical maps and integrated with the most recent geospatial dataset in the QGIS platform. An additional layer of address points was created to link plots, buildings and the closest street segments they face. If a plot has more than one frontage and could be associated with multiple street segments (such as corner parcels), the hierarchically more important street segment is assigned as the primary address point. Thus, the information transfer between data layers was ensured, and a fine-grain database was achieved at the scale of plots.
Measuring urban form and physical change: Variables and definitions
Definitions and equations of the dependent and independent variables (see Supplementary Material Table S1 for a detailed description of quantitative urban form measures).
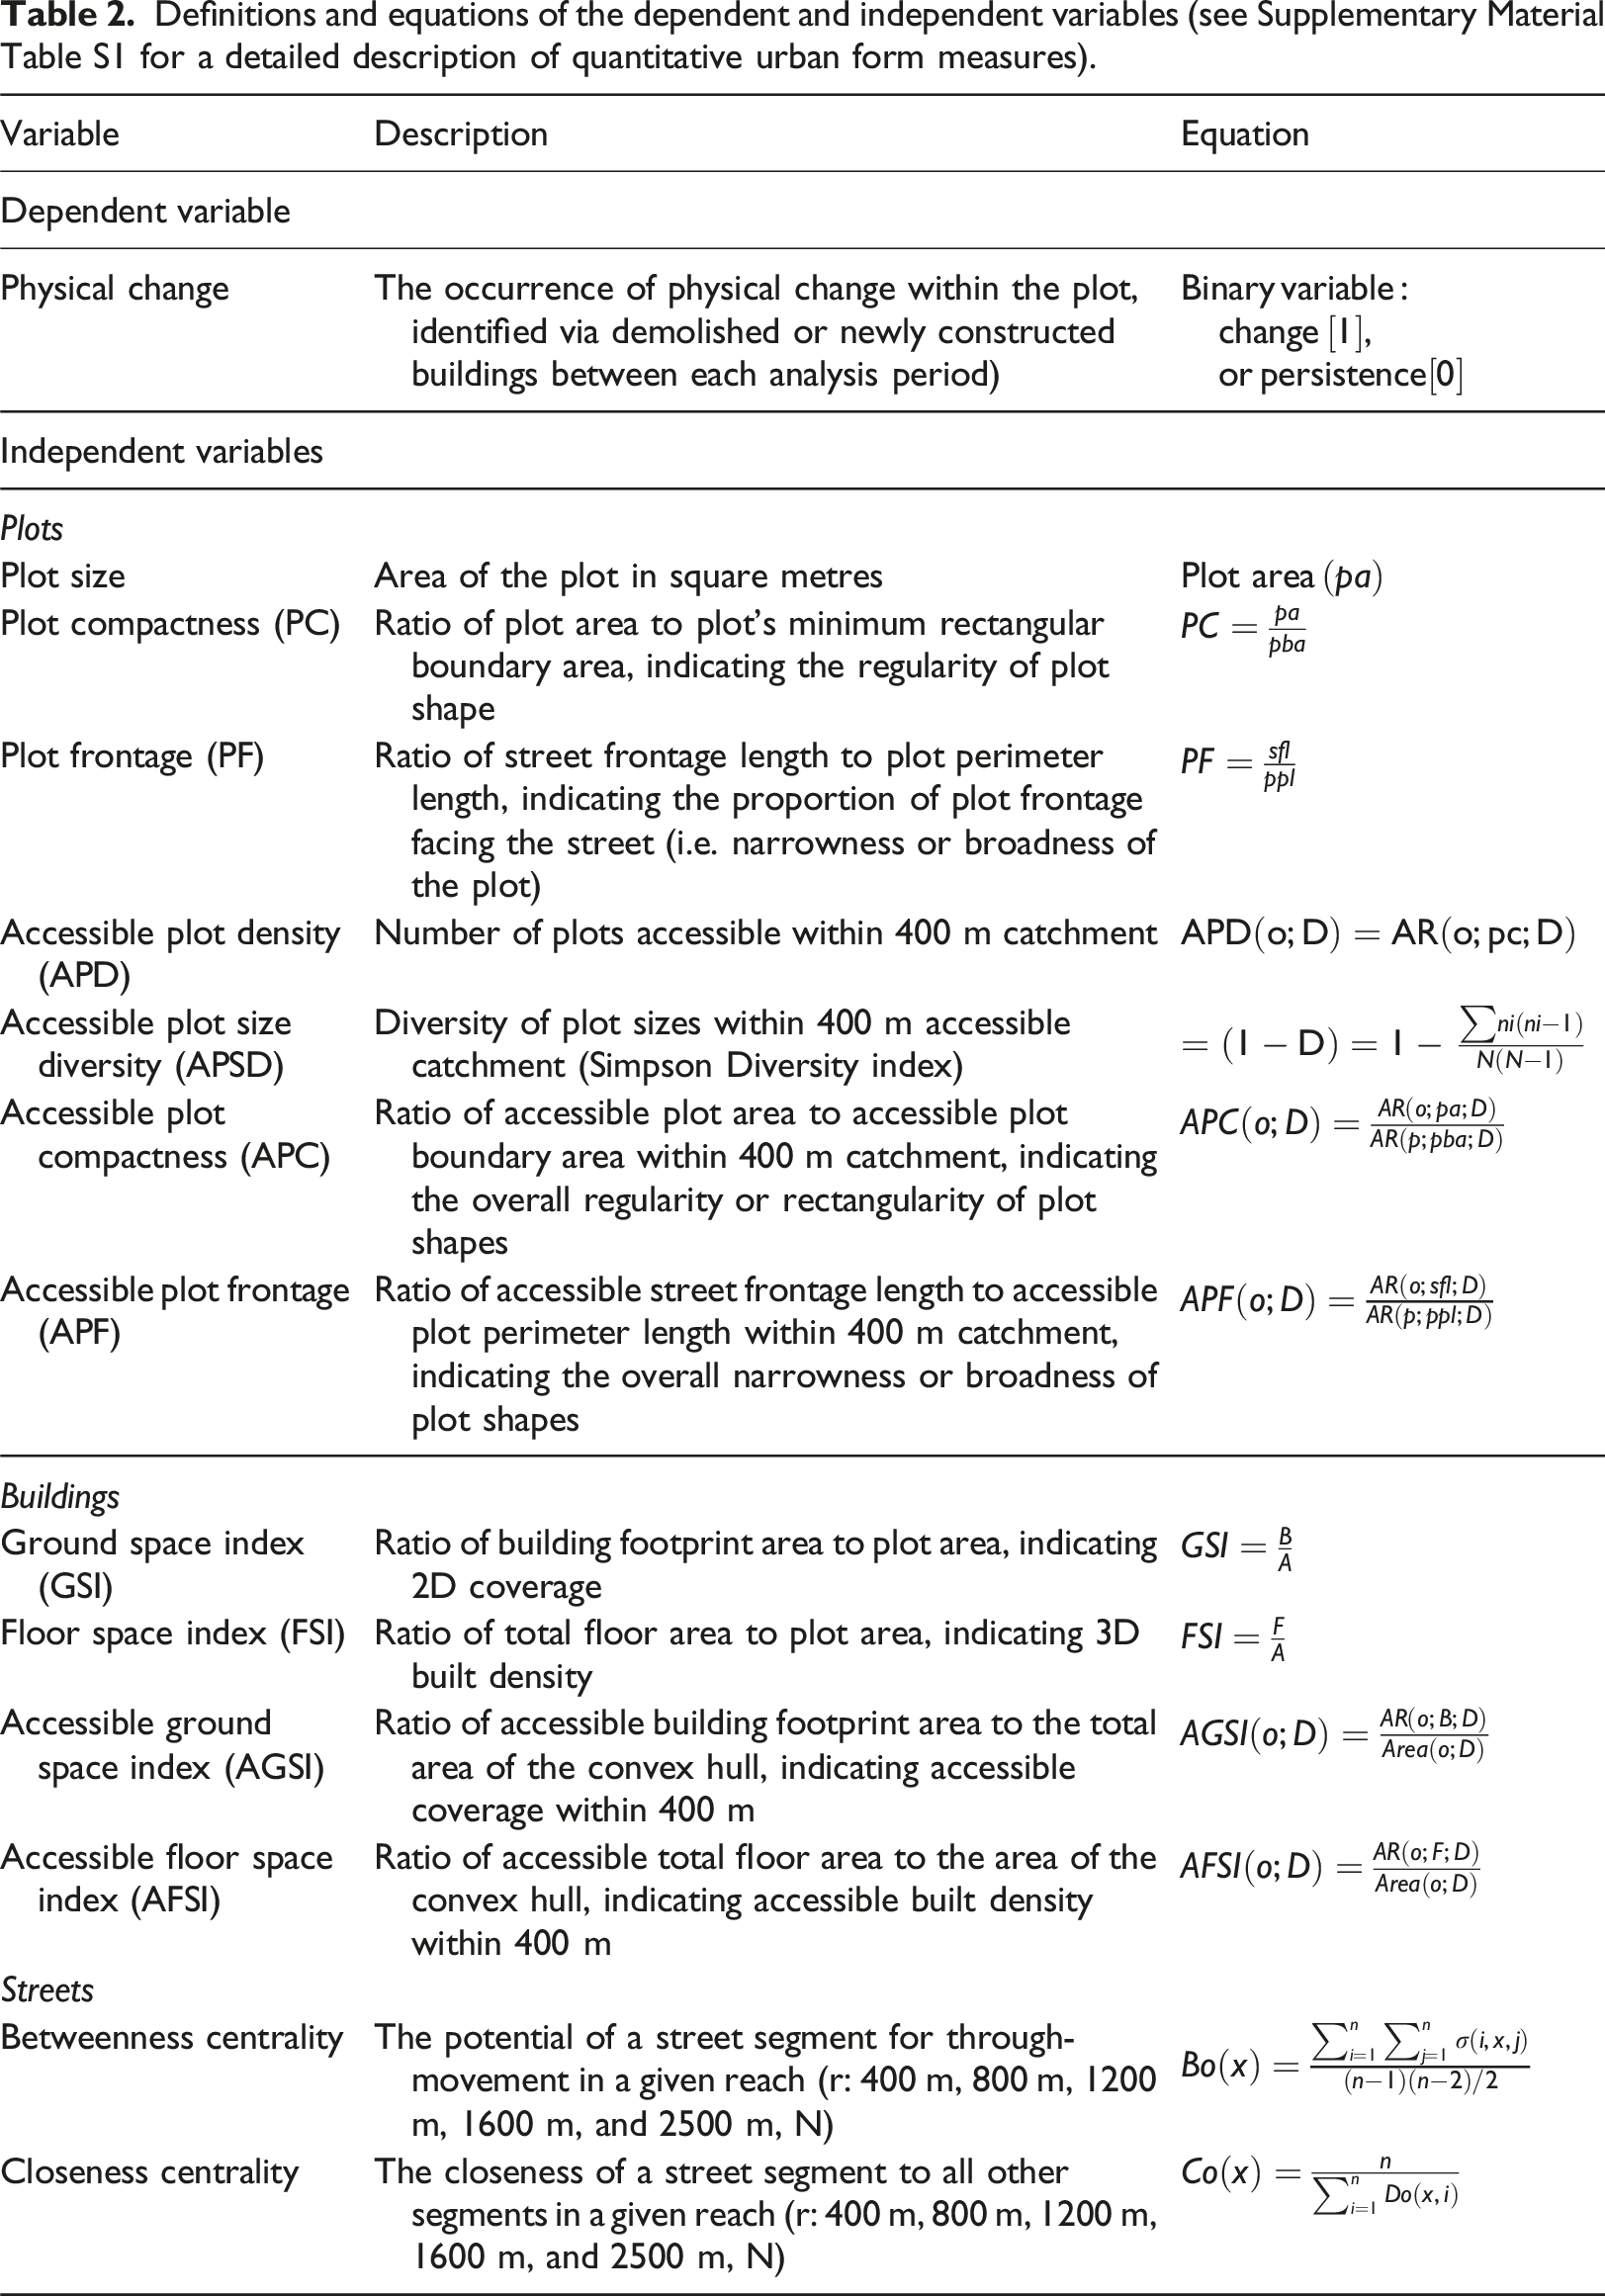
Independent variables were computed for plots, buildings, and streets in their individual layers. As plots spatially contain buildings, building variables were assigned to their corresponding plots. To associate street networks with other morphological elements, an additional layer of line features was created, linking each plot to the closest street segment it faces. For plots with multiple frontages, the hierarchically more important street segment was selected as the main address point. Using vector analysis tools in QGIS, information was transferred from line features (street segments) to polygon features (plots and buildings). Consequently, plots served as the basic unit of analysis, containing all the numerical values of urban form descriptors for each analysis period.
Physical change, the dependent variable, describes the transformation of the built form through the demolition of existing buildings or the construction of new ones. By overlaying two consecutive timeframes, changing and persisting buildings were identified and projected into each origin year’s plots which serve as the main unit of analysis (Figure 1). This process creates a longitudinal database containing quantitative variables of plots, buildings, and streets, as well as binary information indicating physical change (1: change and 0: no change) for each plot. As exemplified in Figure 2, for each analysis period, plots contain quantitative information on all independent variables and binary information indicating whether it accommodated physical change or not. This approach allows us to understand the morphological character of each piece of land and its association with physical change or persistence. The relationship between physical change and quantitative urban form descriptions at the scale of plots.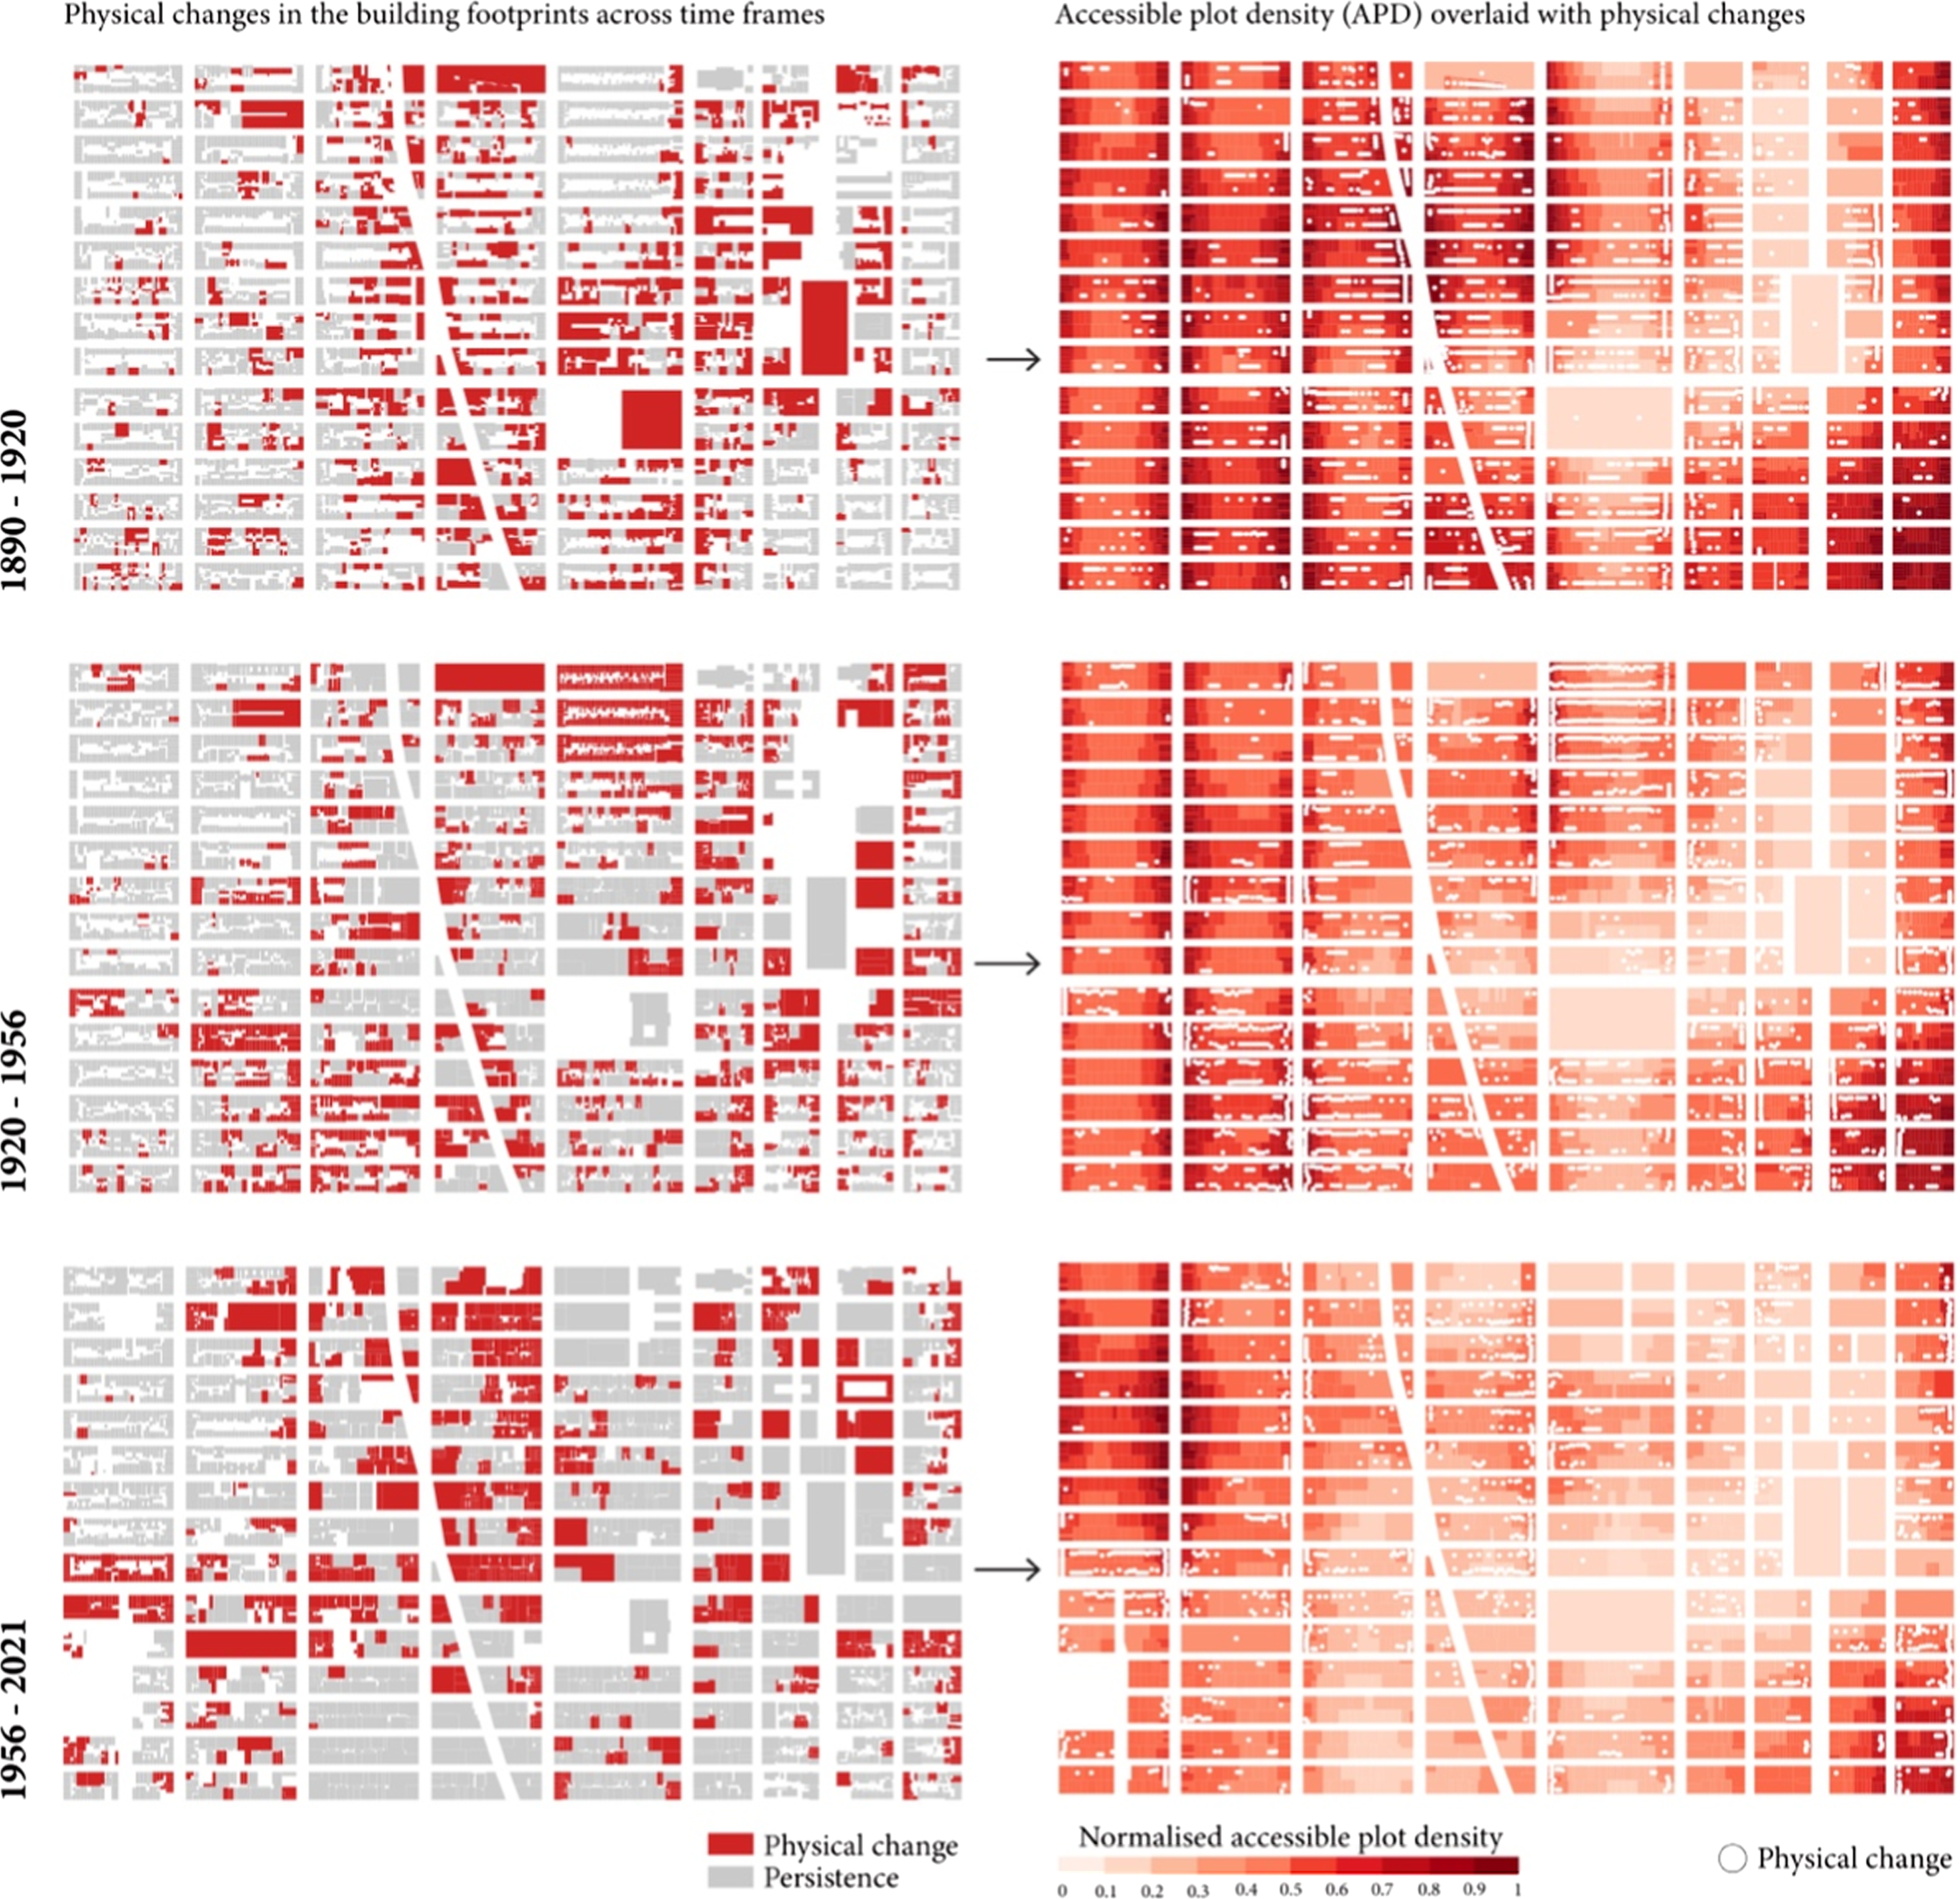
Statistical analysis
Our database consists of numerical independent variables describing urban form characteristics and a categorical dependent variable indicating the occurrence of physical change or persistence. To determine the relationship between urban form and physical change, we compare morphological characteristics of plots that accommodated physical change with those that remained persistent. Welch’s t-test, a statistical method, is employed to assess whether the means of two groups (plots with change and plots with persistence) in terms of urban form variables are significantly different. Applying this test to each urban form variable, we can identify which morphological characteristics most strongly associated with the likelihood of physical change. The test results allow us to quantify the statistical significance of these associations and determine which urban form variables consistently related to physical change across different time periods.
Results
Descriptive analysis of urban form evolution in Midtown Manhattan
We present the evolution of three selected independent variables (plot size, FSI, and betweenness centrality) in Figure 3, which reveals a few important patterns. First, the visual inspection showed that urban form elements have inherent rates of change and persistence. While the higher degree of changeability of plots and buildings became evident, streets were found to be relatively intact and persistent over time. Second, morphological transformation started along the hierarchically more central corridors in Midtown and gradually spread to the rest of the study area. Moreover, the northwest and southeast sections of the study area remained distinct spatial enclaves, retaining their original finer-grain spatial characteristics. Diachronic comparison of plots, buildings, and streets via selected descriptions.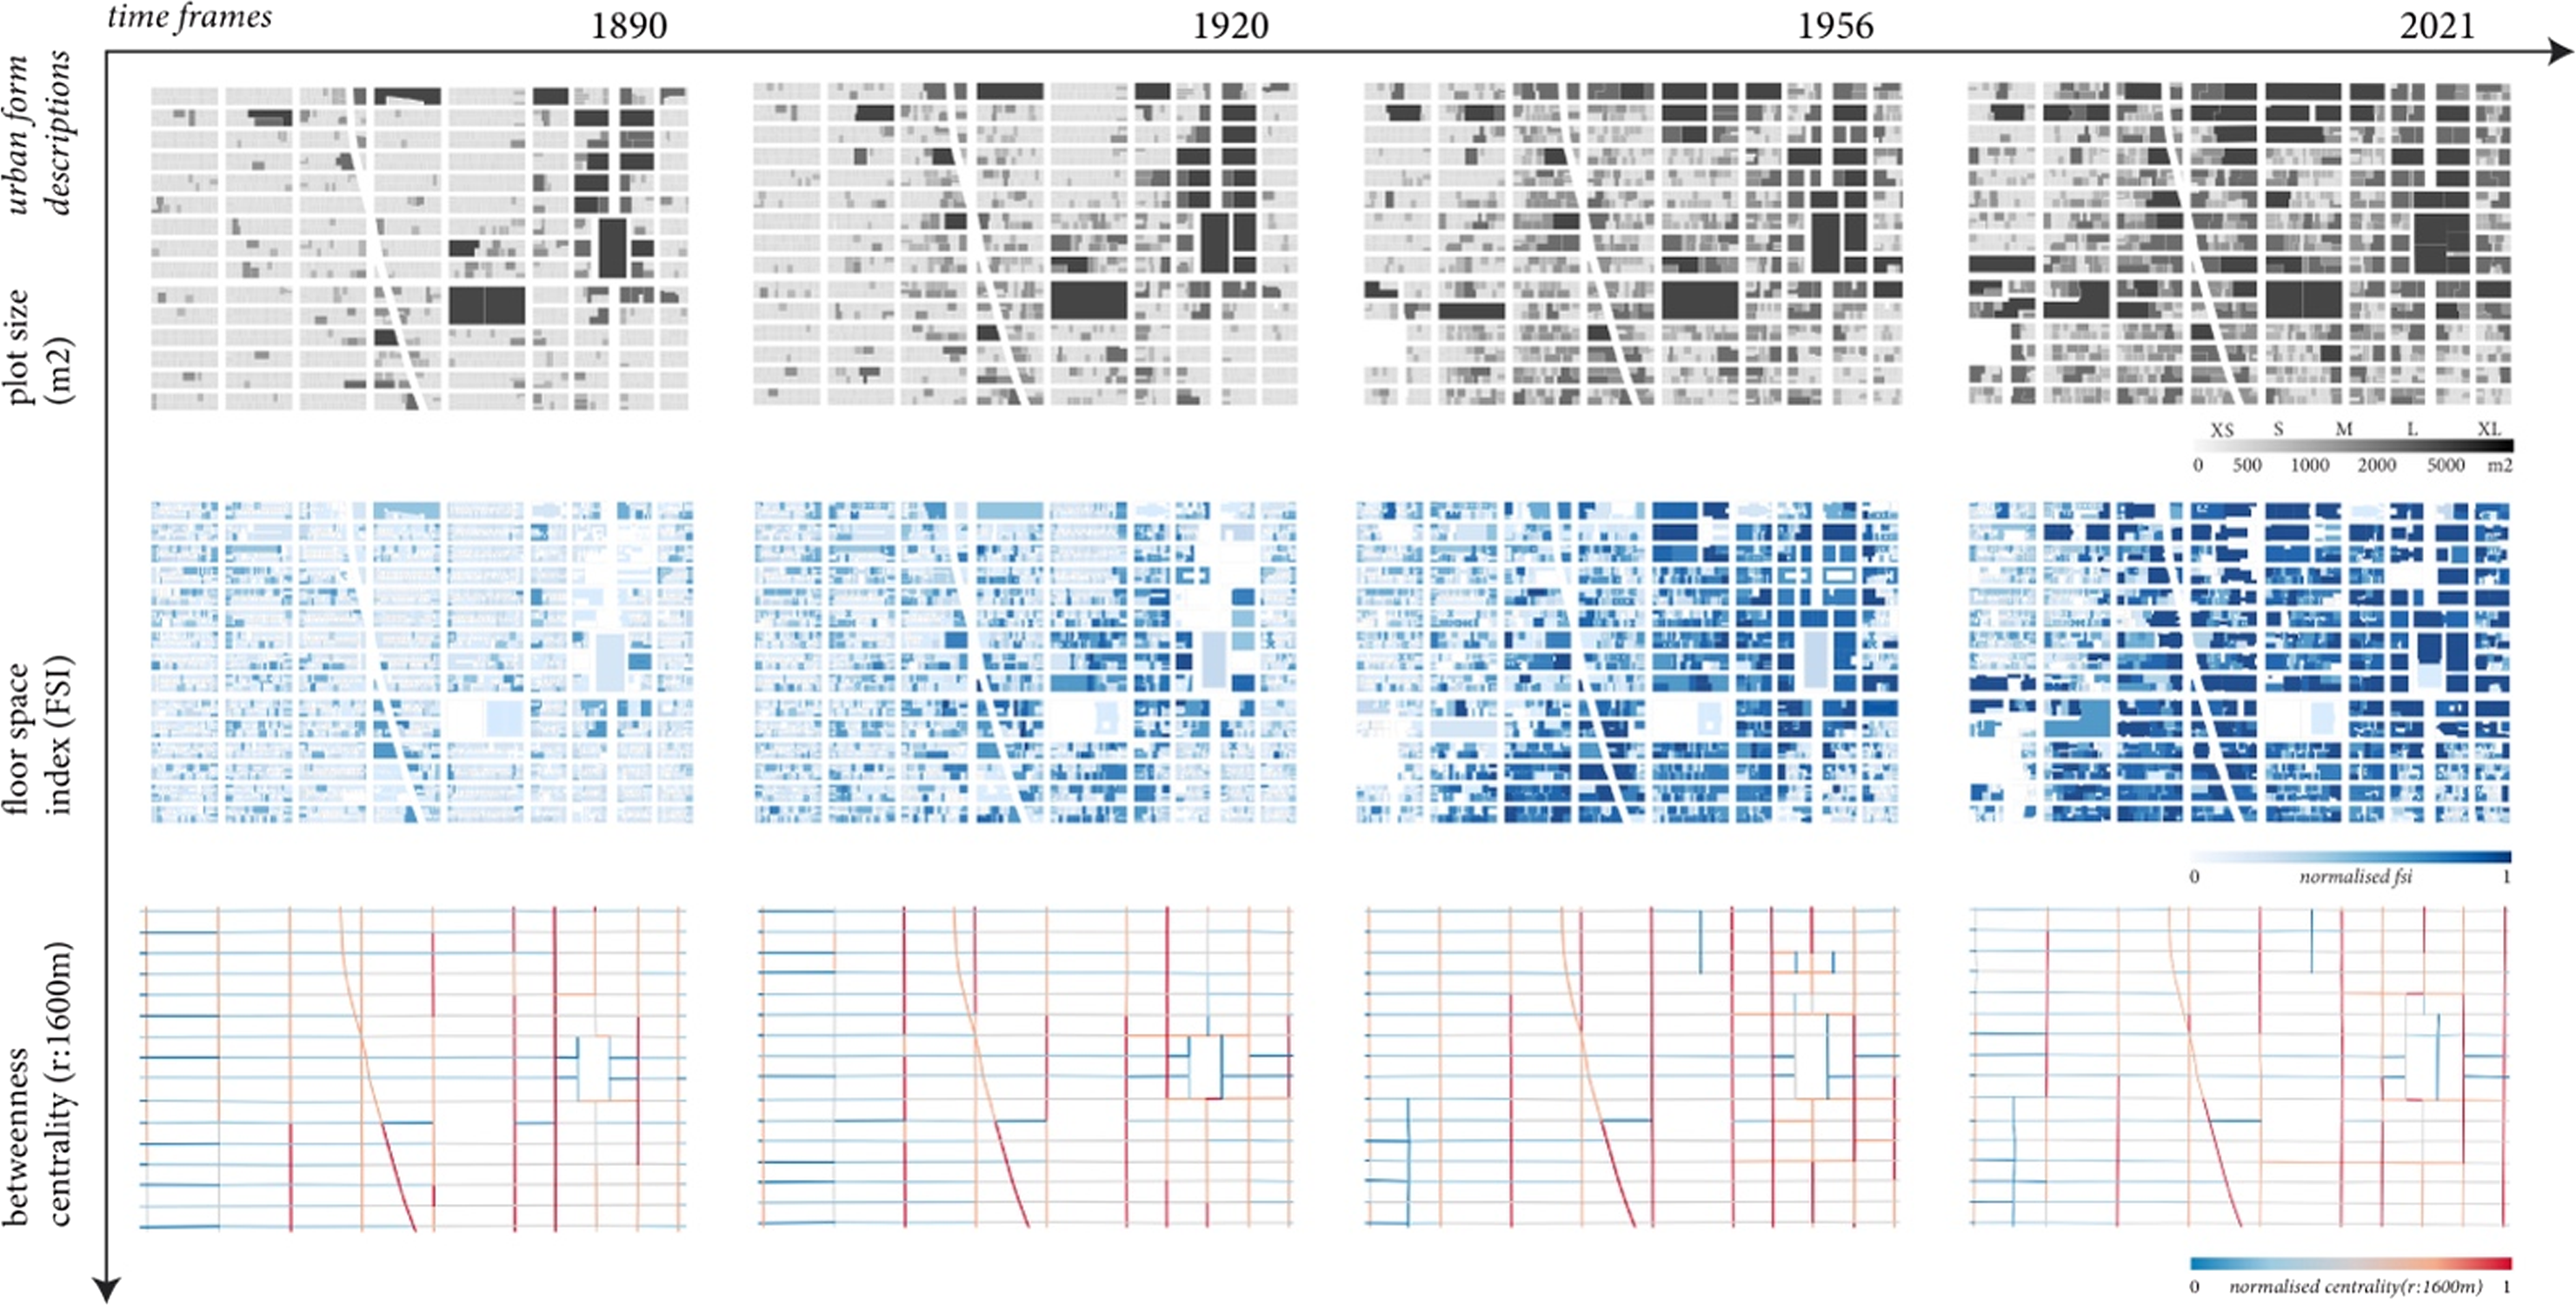
To complement the visual inspection with a quantitative understanding, we present descriptive statistics of the variables in Table S2 in Supplementary Materials and descriptive analysis based on boxplots in Figure 4. Quantitative comparison revealed that plot configuration in Midtown changed dramatically over time. Between 1890 and 2021, the total number of plots in Midtown decreased by nearly 70% and the average plot size increased almost threefold from 257 m2 to 804 m2 (Table S2). A similar coarsening process in plot configuration could be observed from an almost 50% reduction in accessible plot density (APD), with the average number of accessible plots decreasing gradually from 565 in T1 to 217 in T4 (Figure 4). These shifts highlight a notable trend in the urbanisation of Midtown, marked by a transition from fine-grain plot structures to coarser-grain subdivisions. Distributions of urban form descriptions across four time frames.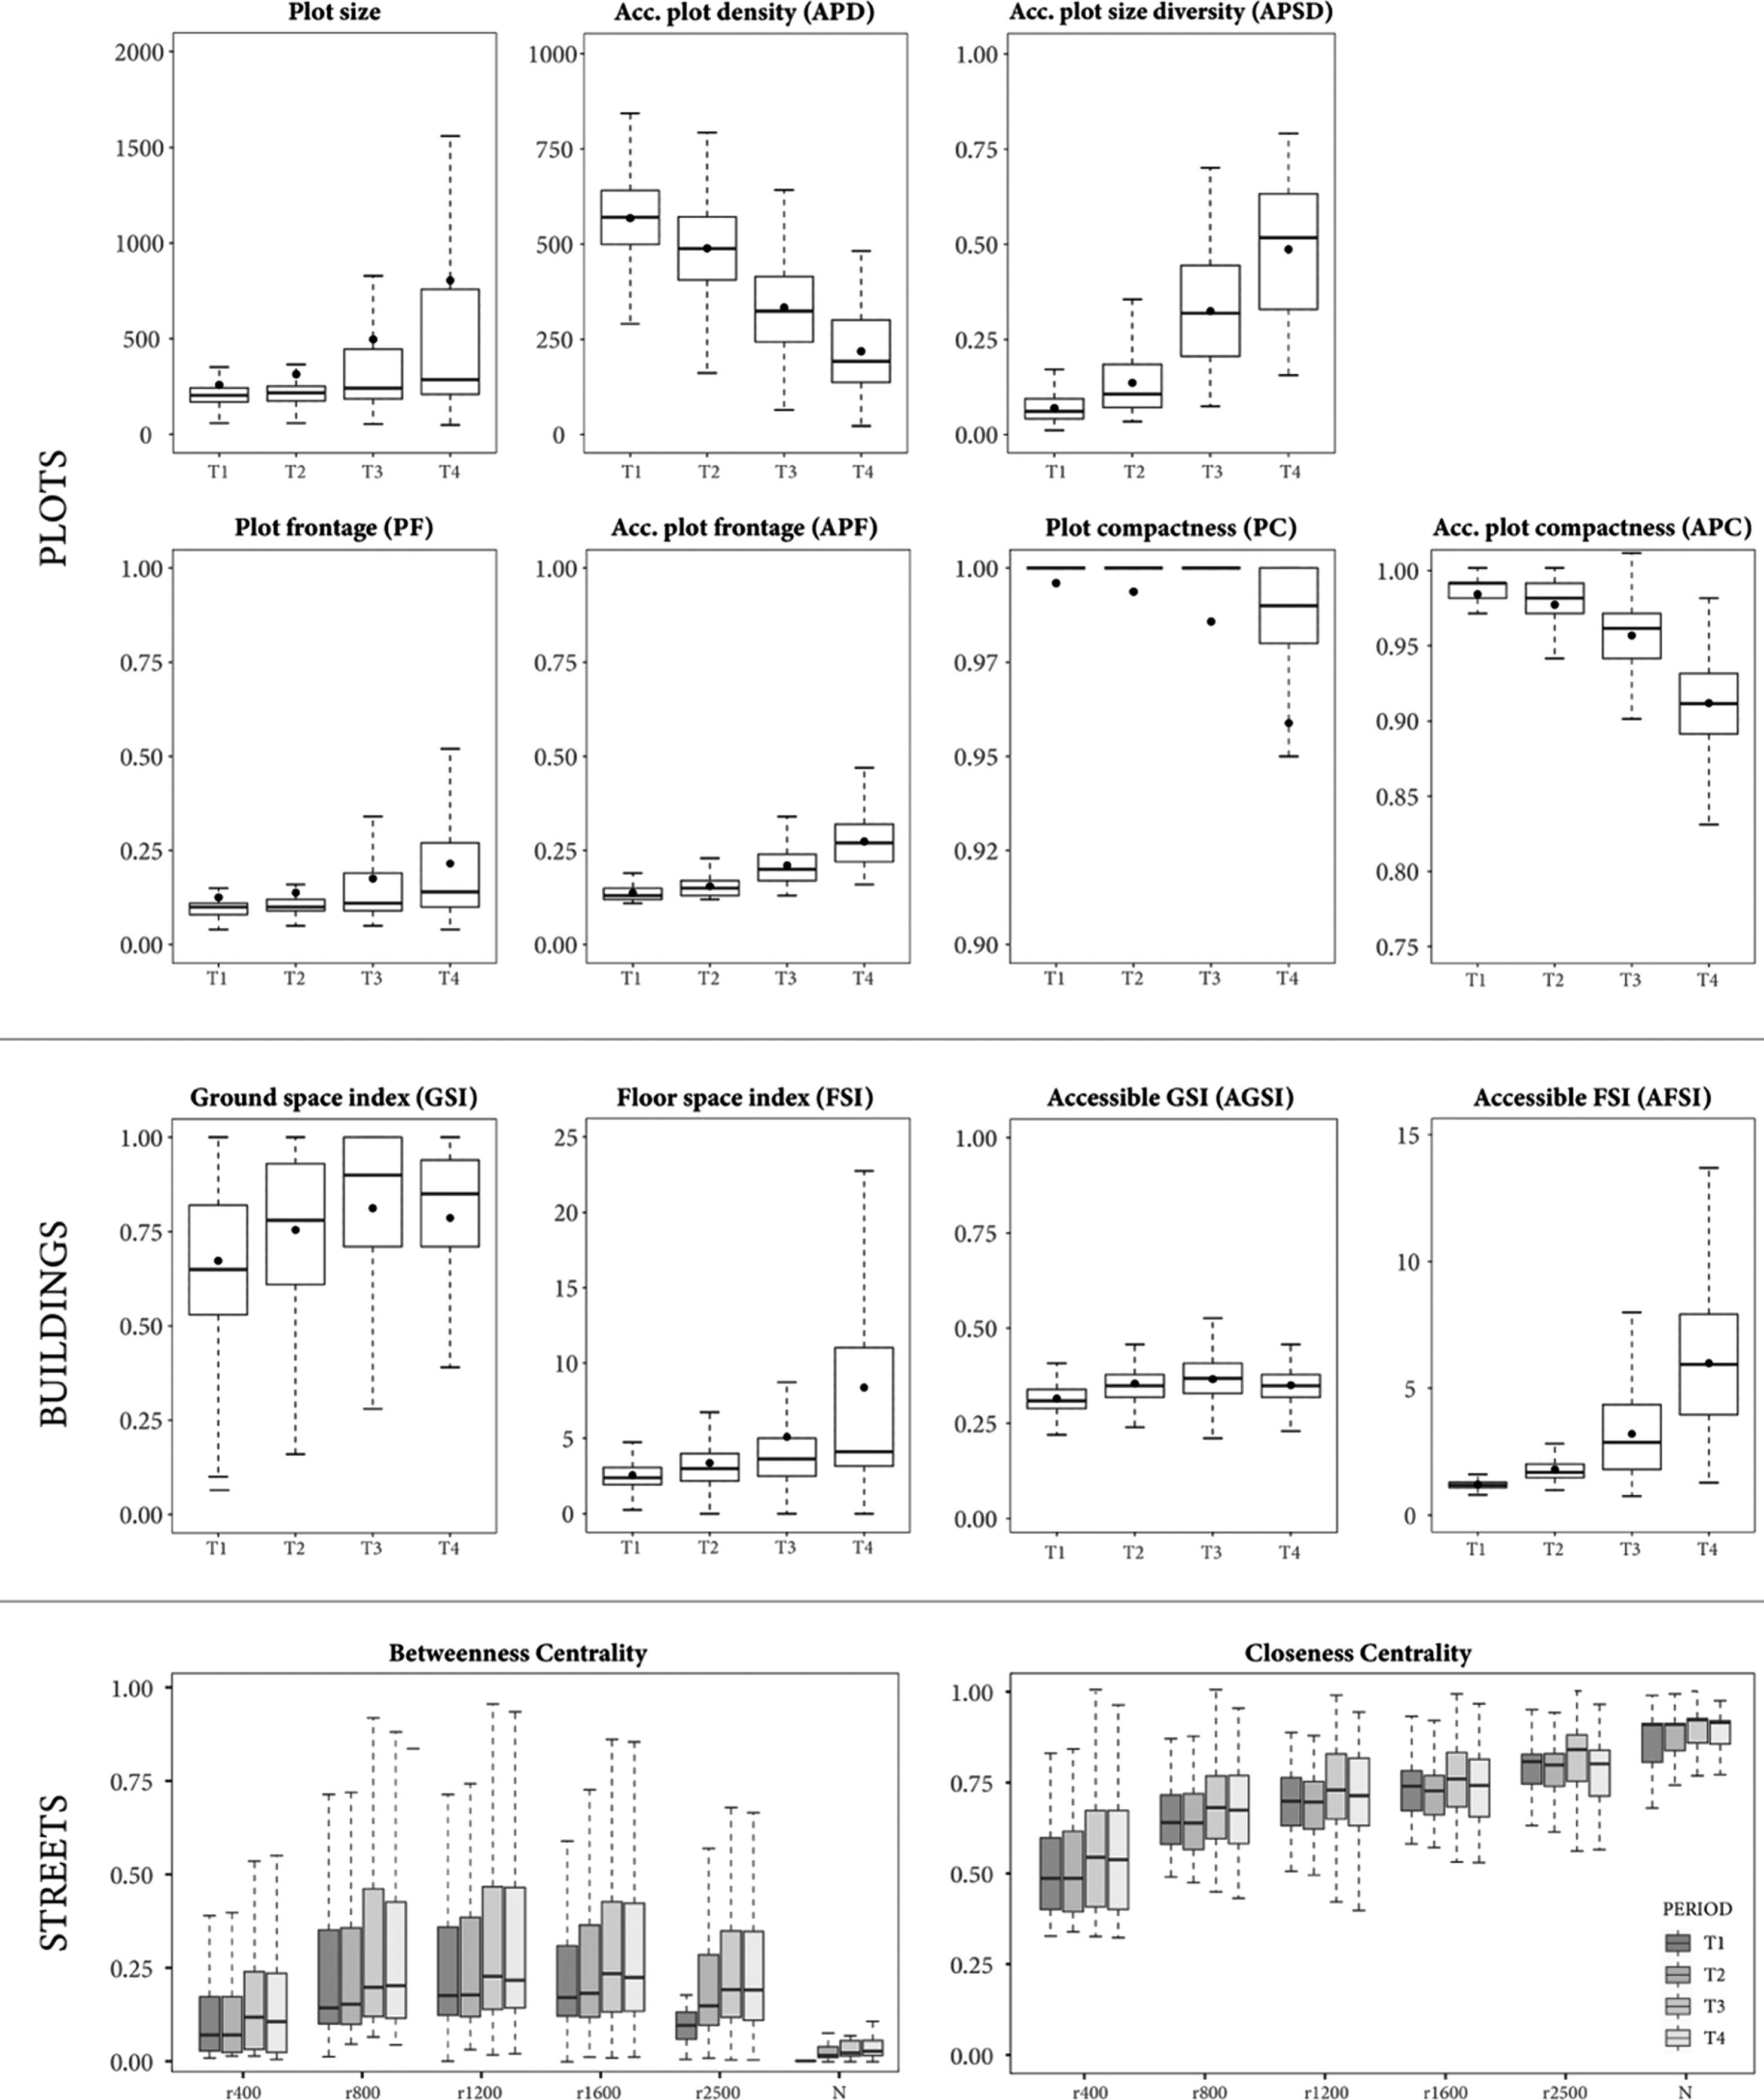
The gradual coarsening in plot structures accompanied a diversification in plot sizes and shapes. As illustrated in Figure 4, the steady increase in accessible plot size diversity (APSD) demonstrated the transition from initially homogenous plot subdivisions to more heterogeneous plot structures over time (0.07, 0.14, 0.32, and 0.48, respectively). Furthermore, the incremental changes in plot frontage and compactness variables (PF, APF, PC, and APC) indicate a gradual shift away from narrow and rectangular plots, giving way to broader and irregular plot shapes. We also note that the steady increase in the standard deviations of plot variables provided compelling evidence of the increasing variability in plot sizes and shapes over time (see Table S2 in Supplementary Materials).
Turning now to the change in the character of buildings, the employed variables in our analysis are quite revealing in several ways. The comparison of time frames demonstrated the steep increase in the average built density (FSI) in Midtown, from 2.56 in the first period to 8.37 in the final period (Table S2). What stands out in the boxplot analysis (Figure 4) is that the gradual increase in built coverage (GSI and AGSI) was followed by a sudden drop after 1956. This trend aligns with the implementation of the Floor-Area-Ratio (FAR) regulation introduced in the 1961 Zoning Resolution of New York, which incentivised less built coverage but more verticalisation for new constructions in Manhattan (Stern et al., 1999). The results demonstrate that the selected variables are morphologically informative and reliably capture the locality’s distinct dynamics.
Contrary to plots and buildings, the street network remained intact over centuries, except for a few street additions and eliminations. The north-south oriented boulevards in Midtown persistently had the highest betweenness centrality across time, demonstrating their potential as thorough movement corridors of the study area. Diachronic comparison of betweenness and closeness centrality reflects the persistency in the street network by presenting nearly identical average centrality values across analysis periods (Figure 4).
Association between urban form conditions and physical change
Turning our attention to the core objective of our paper – understanding the relationship between urban form conditions and patterns of physical change – we demonstrate how changing and persistent buildings were identified and how this binary information was projected onto plots (see Figure 2). The visual inspection of the figure reveals an intuitive pattern: the incidents of physical change tend to concentrate around coarser-grain plot structures with lower accessible plot density (APD), while fine-grain plot structures with higher APD tend to persist over time.
Relationship between urban form descriptions and physical change across three analysis periods based on the results of Welch’s t-test.
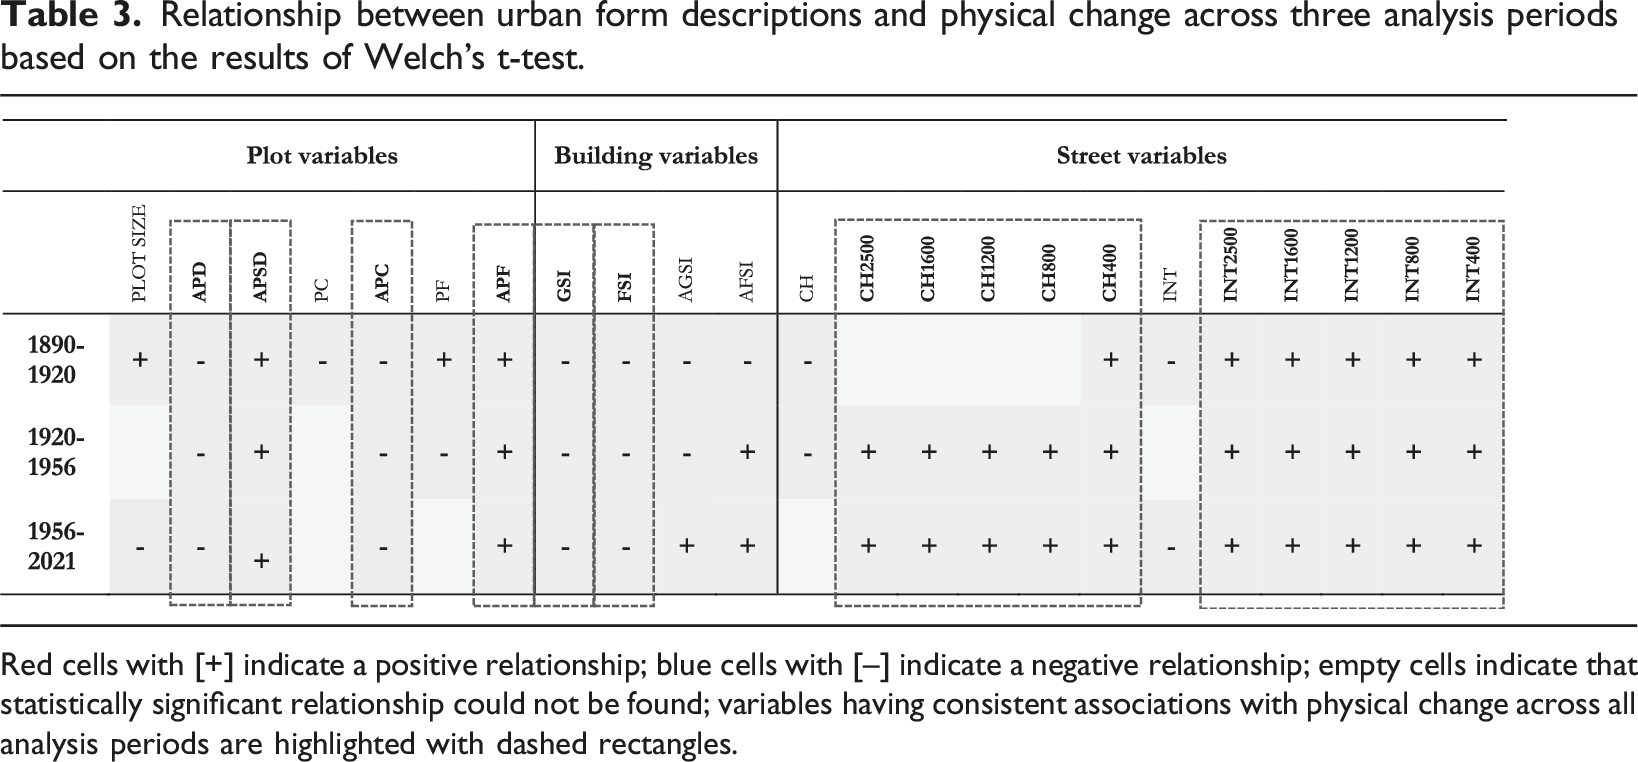
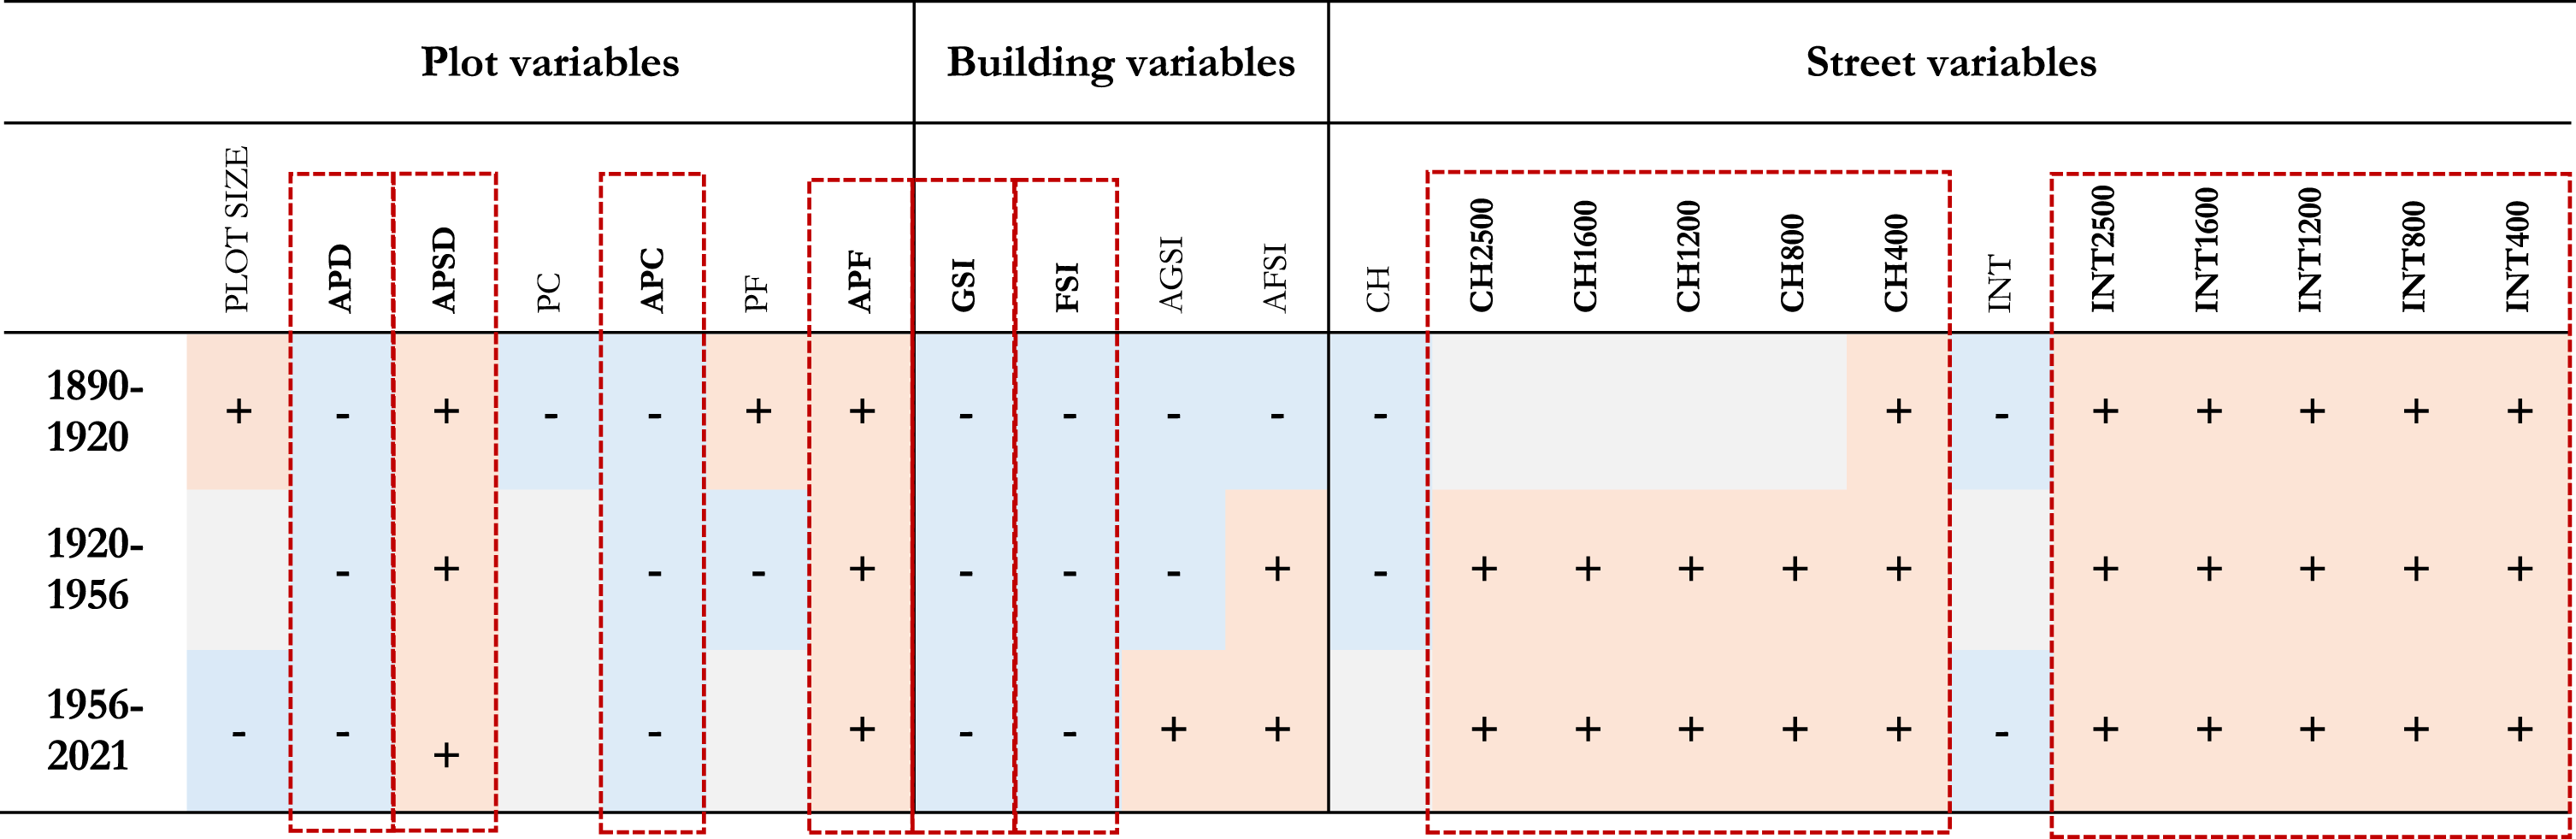
Red cells with [+] indicate a positive relationship; blue cells with [–] indicate a negative relationship; empty cells indicate that statistically significant relationship could not be found; variables having consistent associations with physical change across all analysis periods are highlighted with dashed rectangles.
Plot variables and physical change
The most striking result of our analysis is that all configurational plot variables (APD, APSD, APC, and APF) demonstrate statistically significant and consistent relationships with physical change across three analysis periods. In contrast, the geometric measures of individual plot size and plot shape – compactness (PC) and frontage (PF) – either lack statistically significant relationships during specific periods or present variably inconsistent associations over time (Table 3). This result is somewhat counterintuitive, considering that plot size and shape have widely been considered the primary determinants of physical change in earlier urban form studies (see Table 1). Our findings suggest a departure from these prevailing hypotheses and provide evidence that configurational plot descriptions are more reliable in explaining the patterns of physical change in Midtown.
More specifically, plots accommodating physical change consistently had a lower average accessible plot density (APD) than persisting ones across three analysis periods (p < .01). This finding suggests a consistent negative relationship between APD and physical change, indicating that coarser-grain plot subdivisions tend to change physically more often than fine-grain plot structures. Accessible plot compactness (APC) demonstrated a statistically significant negative relationship with physical change, indicating that irregular plot structures with lower APC experienced more frequent physical changes. Accessible plot frontage (APF) showed a statistically significant positive relationship with physical change, suggesting that broader plot structures with higher APF accommodated physical changes more than narrower plot structures. Finally, plots accommodating physical change consistently had a higher average accessible plot size diversity (APSD) than persisting ones across all time frames (p < .01). It demonstrates that heterogeneous plot structures tend to accommodate physical changes more often compared to homogenous subdivisions.
Street variables and physical change
Plots accommodating physical change demonstrated higher average betweenness and closeness centrality than persisting ones in all analysis periods (p < .01). This implies that the configuration of the street network plays a pivotal role in guiding physical change. However, the first analysis period between 1890 and 1920 emerged as an exception to this general trend. This particular inconsistency will be further discussed in the next section.
Building variables and physical change
As shown in Table 3, built density measures of GSI and FSI exhibited a statistically significant negative relationship with physical change consistently in all analysis periods (p < .01). Plots accommodating physical change had lower average GSI and FSI than persisting ones in all analysis periods (see Table S3 in Supplementary Materials). These findings suggest that built density is a reliable determinant for physical change, as the areas characterised by lower built density tended to experience more physical change over time in Midtown.
Discussion
In this paper, we developed a quantitative framework to demonstrate the effect of various urban form conditions on the patterns of physical change in Midtown Manhattan across four subsequent time frames. Confirming our hypothesis, the analysis results proved that particular qualities of plots, streets, and buildings have a definite effect on the patterns of physical change.
The most striking finding in our study challenges the established notions of earlier research. As summarised in Table 1, previous studies heavily emphasised the role of geometric qualities of plots (such as plot size and plot shape) in guiding the patterns of physical change (Conzen, 1960; Hallowell and Baran, 2020; Moudon, 1986; Scheer and Ferdelman, 2001; Törmä et al., 2016). Contrary to these prevailing hypotheses, we demonstrated that geometric measures of individual plot size and shape (PC and PF) often lack consistency and precision in illustrating the physical change. Instead, our findings demonstrated that configurational plot measures (APD, APC, and APF) can accurately describe the relationship between plot characteristics and physical change. There are several possible explanations for this novel finding.
First, configurational measures capture the relational dimensions of urban form that geometric measures cannot. Contrary to geometric measures that describe individual urban form elements in isolation, configurational measures show how these elements relate and describe the overall character of urban form patterns (Berghauser Pont and Marcus, 2014). For instance, while APD indirectly measures the size of a plot (smaller plots naturally increase the likelihood of accessing more plots within a given reach), it also gives an extra layer of information about that particular plot: the character of the surrounding subdivision pattern it is a part of. From this perspective, our findings imply that the character of plot patterns is more reliable than the quality of individual plots in explaining the patterns of physical change.
Second, as emphasised in Table 1, previous studies have predominantly centred on suburban neighbourhoods characterised by spatial homogeneity and lower dynamism. Considering that some of the widely known urban form conditions ‘may not as forcefully curtail change in non-residential areas because of the shorter cycles of business change’ (Moudon, 1986: 141), the need to validate existent hypotheses within more dynamic urban settings has been overlooked in urban morphology. Our findings show that configurational plot measures are more reliable in explaining patterns of physical change in more dynamic urban settings. Although a single-case study may not justify far-reaching generalisations, our findings underscore the need to subject prevailing hypotheses, typically crafted in similar contexts, to rigorous testing and validation in various settings.
Further supporting the reliability of configurational plot measures, another important finding is that accessible plot size diversity (APSD) exhibited a statistically significant positive relationship with physical change. This finding suggests heterogeneous plot structures tend to undergo more physical change than homogenous ones. It provides empirical support to the overlooked hypothesis of Conzen (1960), who argued that diversity in plot patterns has a definite effect on the Burgage cycle and adaptive transformation processes. The positive relationship between plot size diversity and physical change might be attributed to the adaptability of heterogeneous plot structures in accommodating buildings of varying scales and sizes, which exhibit different propensities for physical transformation under changing external urban conditions, such as shifts in land use patterns, economic activities, or planning regulations. Our finding provides empirical evidence for recent studies on urban form resilience, which hypothesise that diversity in urban form elements could enhance the adaptability of urban spaces (Marcus and Colding, 2014; Feliciotti et al., 2016; Garcia and Vale, 2017; Sharifi, 2019; Tümtürk, 2024).
Addressing the association between street configuration and physical change, our findings reveal that streets with higher centrality tend to accommodate more physical change across time. This finding aligns with earlier space syntax studies, which demonstrated the pivotal role of street network in affecting various urban form processes (Hillier, 1999) and more specifically the patterns of physical change (Griffiths et al., 2010; Hallowell and Baran, 2020). However, during the first period of our analysis (1890–1920), we observed an exception to this trend, which could be attributed to the temporary presence of elevated railways along some of the most central streets. These elevated railways brought noise and air pollution, which discouraged property investments and urban development along these streets until their eventual demolition (Stern et al., 1999: 78). This discrepancy implies that contextual circumstances could potentially exert contingent effects on how street configuration influences spatial processes (Netto et al., 2012).
Addressing the association between characteristics of buildings and physical change, our findings demonstrated that areas with lower built density experienced more physical change over time. The results unsurprisingly suggest that underexploited areas tended to change more often to meet the increasing density needs and standards of Midtown Manhattan. Our findings align with Whitehand and Carr’s (1999) study but add further by employing morphologically more informative density measures. GSI and FSI have been widely utilised to identify building typologies via multi-variable density measures (Berghauser Pont and Haupt, 2010). Therefore, although it exceeds the scope of this paper, our results provide a promising ground for future typo-morphological research aiming to investigate the changeability and adaptability of particular building typologies.
Conclusion
Contribution to scholarship
This paper was driven by the scarcity of quantitative and diachronic urban form studies and the persisting limitations in understanding the relationship between form and change. The results provided substantial empirical support for the hypothesis that urban form is an active component setting the spatial conditions for future dynamics and has a pivotal role in limiting or expanding processes of physical change. Furthermore, our findings provide the first empirical evidence for the reliability of configurational plot descriptions in understanding the temporal transformations of urban form (Berghauser Pont et al., 2019; Bobkova et al., 2021). Our study adds to the rapidly expanding field of quantitative urban form studies – urban morphometrics – and contributes to the recent debates concerning the reliable descriptions of urban form (Dibble et al., 2019).
Implications for urban design and planning
The variables we employed hold the potential to be translated into numeric indicators and help practitioners develop design support and assessment tools. Accordingly, decision-makers can choose particular spatial patterns over others to guide the long-term evolution of urban form. This evolutionary understanding can potentially encourage design practitioners to design with and for change rather than against it (Campbell, 2018; Porta and Romice, 2014; Romice et al., 2020). Moreover, our findings contribute to the resilience transition in cities. We provide evidence-based insights for improving cities’ capacity for change (Vale and Campanella, 2005) and creating necessary conditions for adaptable urban spaces (Bentley, 1985; Cozzolino, 2020).
Limitations and future steps
The generalisability of our findings is subject to certain limitations, as we focused on a single-case study. Notwithstanding this limitation, we note that the diachronic analysis framework allowed us to test the reliability of our findings across various historical periods. Considering that the morphological conditions of Midtown have been dramatically different across these periods, our findings hold the potential of being generalisable to various contexts. Repeating cross-case studies on distinct cities having typically different spatial dynamics and conditions would be a fruitful area for further work. Furthermore, future studies could add new quantitative variables and explore their association with physical change. While our paper focused on the relationship between urban form and physical change, investigating functional adaptation processes is equally crucial to better understand how urban form guides spatial dynamics. Given that existing studies on the relationship between urban form and functional change rely on similar geometric descriptions, such as plot and building footprint size and shape (Törmä et al., 2016; Vaughan et al., 2015; (Tümtürk et al., 2022)), adopting the configurational urban form measures presented here could provide novel insights. As the configurational variables in our study were based on a walkable reach (400 m), measurement at larger radii, developing multi-scalar configurational descriptions, and comparing their association with patterns of physical change would offer valuable insights. Finally, using clustering techniques and developing particular types of plots, buildings, and streets via multi-variable measures of urban form could provide more definitive evidence of the changeability and adaptive capacity of particular types of urban forms and structures.
Supplemental Material
Supplemental Material - The impact of urban form on physical change: A quantitative and diachronic analysis of urban form evolution in Midtown Manhattan
Supplemental Material for The impact of urban form on physical change: A quantitative and diachronic analysis of urban form evolution in Midtown Manhattan by Onur Tümtürk, Justyna Karakiewicz, and Fjalar J de Haan in Environment and Planning B: Urban Analytics and City Science.
Footnotes
Acknowledgements
The authors would like to express their sincere gratitude to the two anonymous reviewers for their constructive feedback and valuable suggestions which have greatly contributed to improving the overall quality of this manuscript.
Declaration of conflicting interests
The author(s) declared no potential conflicts of interest with respect to the research, authorship, and/or publication of this article.
Funding
The authors disclosed receipt of the following financial support for the research, authorship, and/or publication of this article: The research presented in this paper was conducted at the University of Melbourne, Faculty of Architecture, Building and Planning and funded by the University of Melbourne’s Doctoral Research Scholarship (Melbourne Research Scholarship) from July 2019 to May 2023.
Data availability statement
Supplemental Material
Supplemental material for this article is available online.
References
Supplementary Material
Please find the following supplemental material available below.
For Open Access articles published under a Creative Commons License, all supplemental material carries the same license as the article it is associated with.
For non-Open Access articles published, all supplemental material carries a non-exclusive license, and permission requests for re-use of supplemental material or any part of supplemental material shall be sent directly to the copyright owner as specified in the copyright notice associated with the article.