
Abstract
Urban research has long recognized that neighbourhoods are dynamic and relational. However, lack of data, methodologies, and computer processing power have hampered a formal quantitative examination of neighbourhood relational dynamics. To make progress on this issue, this study proposes a graph neural network (GNN) approach that permits combining and evaluating multiple sources of information about internal characteristics of neighbourhoods, their past characteristics, and flows of groups among them, potentially providing greater expressive power in predictive models. By exploring a public large-scale dataset from Yelp, we show the potential of our approach for considering structural connectedness in predicting neighbourhood attributes, specifically to predict local culture. Results are promising from a substantive and methodologically point of view. Substantively, we find that either local area information (e.g. area demographics) or group profiles (tastes of Yelp reviewers) give the best results in predicting local culture, and they are nearly equivalent in all studied cases. Methodologically, exploring group profiles could be a helpful alternative where finding local information for specific areas is challenging, since they can be extracted automatically from many forms of online data. Thus, our approach could empower researchers and policy-makers to use a range of data sources when other local area information is lacking.
Introduction
Since its early days, urban research has grappled with the challenges inherent in understanding the internal complexity of cities. On the one hand, cities are composed of distinct areas, such as neighbourhoods and districts, which have their own histories, identities, and impacts on local residents’ and businesses’ fates and fortunes. On the other, neighbourhoods are interconnected with one another, and movement among them occurs frequently and relatively freely. In terms elaborated by the early Chicago School, neighbourhoods are fully contextual. Their inner social organization is bound up with their pasts and futures, just as much as their histories are shaped by other communities around and connected to them; they are always making new versions of themselves, but the degree to which the new version resembles the previous one varies (Abbott, 2017).
While early Chicago school researchers, among others, articulated the idea of full neighbourhood contextuality theoretically, incorporating it into research proved difficult. Local ethnographies could examine how the life of single neighbourhoods link out beyond themselves in space and time (Zorbaugh, 1983). But a formal quantitative examination of neighbourhood relational dynamics was hampered by a lack of data, methodologies, and computer processing power. Flows (of people, finances, and more) between cities offered new research opportunities (Duncan et al., 2013) and opportunities to conceptualize cities as embedded in graphs/networks (Sassen, 2013).
The advent of geo-referenced big data, such as location-based social networks, opened up corresponding possibilities to study neighbourhoods in a similarly relational way (Phillips et al., 2019; Poorthuis et al., 2021; Shelton and Poorthuis, 2019). Joining these data sources with modern network-analytical methodologies, in turn, has inspired more precise conceptualizations of cities in terms of their structural connectedness, understood as the degree to which their neighbourhoods are linked by the movements of residents. The city itself is conceived as a graph where vertices are neighbourhoods and edges are movements between them by persons, businesses, ideas, money, and more (Candipan et al., 2021; Daepp, 2021; Graif et al., 2019; Papachristos and Bastomski, 2018; Phillips et al., 2021; Sampson, 2012).
Many studies on the relational dynamics of neighbourhoods have been descriptive. These tend to identify clusters or sets of more or less interconnected neighbourhoods, often highlighting how parts of cities thought to be isolated are more related than one might think, or how some areas, while physically close, can be socially distant (Andris et al., 2019; Shelton et al., 2015). Other research aims to incorporate neighbourhood graphs into predictive models, which often feature gentrification, crime, and disease (Papachristos and Bastomski, 2018; Saxon, 2021), and typically use traditional methods, such as regression analysis. A few studies (Gilling et al., 2021; Ilic et al., 2019; Palafox and Ortiz-Monasterio, 2020; Reades et al., 2018; Thackway et al., 2023) have explored the use of various machine learning models, including standard neural networks, to predict future neighbourhood states based on past conditions. However, ours is the first to our knowledge to explore Graph Neural Networks (GNN) in this context.
Our study seeks to make two contributions to this research literature. We: (1) Show the potential of graph neural networks (GNN) to predict local cultural characteristics, building models that incorporate (a) local area information (e.g. FSA socio-economic data), (b) neighbourhood mobility graphs, and (c) group profiles (or any other sophisticated information) of individuals who move between neighbourhoods. (2) Show the potential of Yelp as a data source for revealing structural connectedness in urban research.
Our GNN approach permits combining and evaluating multiple sources of information, providing greater expressive power to study neighbourhood evolution. Using our proposed model, we find, for instance: (i) either local area information or group profiles give the best results in predicting local cultural dimensions (or scenes), and they are nearly equivalent in all studied cases; (ii) while local area information is commonly used in similar tasks, group profiles have not been examined previously. This type of information could be a helpful alternative where it is hard to find local information for specific areas, since group profiles can be extracted automatically from many forms of online data, in ways that we illustrate in this study. Therefore, this modelling approach could empower researchers and policy-makers to use a range of data sources in situations where other local area information is lacking, such as in areas with poor census coverage or in the years between census data collection.
The paper proceeds in the following sections. First, we discuss related work. Second, we review data and methods, featuring the GNN model we develop. Third, we present results. Our primary focus is on model evaluation, but here we also offer a tentative illustration of how GNN models can aid in substantive understanding. The fourth section discusses conclusions, limitations, and future directions.
Related work
Relational approaches to neighbourhood research
In the classical conception of the early Chicago School, “Social facts are located. This means a focus on social relations and spatial ecology in synchronic analysis, as it means a similar focus on process in diachronic analysis” ((Abbott, 2017): 197). Applied to neighbourhoods, this principle implies considering a neighbourhood as a vertex within an ‘interactional field’ in which every location and group is part of a ‘whole network of intertwined processes’ ((Abbott, 2017): 200) whereby any given location is bound up both with what happens elsewhere and before.
Yet while this insight informed much ethnographic and historical research through the 20th century, predominant forms of quantitative research have often faced challenges in incorporating it. ‘Most sociological articles presume unrelated individuals, whether workers, firms, or associations’ or neighbourhoods ((Abbott, 2017): 197). These difficulties are largely due to limitations imposed by traditional data sources and methods. For example, in a national sample survey of 1500 individuals, it is often not possible to examine these individuals’ contexts and relations in a statistically meaningful way. Likewise, standard regression analysis treats each observation as independent. In the case of neighbourhoods, this often results in considering administrative units such as census tracts as if they were unrelated to others, even those nearby or with which they routinely exchange individuals, businesses, money, or ideas – or proceeding as if an area’s current state was not a single moment in an unfolding process of other preceding and following states.
Recent methodological advances and new fine-grained geo-referenced data sources have catalyzed a resurgence in quantitative studies of neighbourhoods that have given new empirical life to classical relational theories of neighbourhoods, both spatially and temporally (Silver et al. (2022a) and Knaap et al. (2019)). This work joins with rich bodies of multi-method research on local ‘activity spaces’ that spill across neighbourhood boundaries (Cagney et al., 2020). Spatially, researchers have developed applications of graph methods to consider any given neighbourhood concerning others (Browning et al., 2017; Hipp and Boessen, 2017; Neal, 2012; Papachristos and Bastomski, 2018; Sampson, 2012), often defining the interconnectedness of neighbourhoods in terms of movements of people and firms between them (Phillips et al., 2021). Temporally, researchers experiment with various methods to situate any given neighbourhood concerning its past and future, such as Markov chains, spatial Markov chains and sequence analysis, or related methods (Silver and Silva, 2021). At the cutting edge are efforts to combine both in spatio-temporal models (Delmelle and Rey, 2021; Dias and Silver, 2021; Olson et al., 2021b; Silver and Silva, 2023). A number of spatial and contextual regression models enable the independence assumption to be relaxed and probed.
Given the novelty of the data and rapid methodological innovations, much research on relational dimensions of neighbourhoods has been descriptive. This work has revealed important features of cities and communities. For example, Candipan et al. (2021) use geo-tagged Twitter data to build a ‘segregated mobility index’ to measure the degree to which neighbourhoods of various racial compositions are connected to others with similar or different compositions and use that index to characterize 50 US cities. Andris et al. (2019) reveal neighbourhood graphs that span socio-economic differences via ties built by youth mentoring programs, while Shelton et al. (2015) use Twitter data to reveal the extent to which Louisville neighbourhoods are often thought to be separate and apart and are fluidly interconnected. Athey et al. (2021) show that ‘experienced isolation’ based on neighbourhood mobility graphs is much lower than that revealed by studying residential isolation within neighbourhoods alone. Daepp (2021) uses consumer credit data and community detection methods to reveal clusters of strongly interconnected Massachusetts neighbourhoods. Brazil (2022) shows that poor neighbourhoods tend to be connected via mobility graphs to other neighbourhoods with higher pollution levels. Poorthuis et al. (2021) map how neighbourhood mobility graphs in Lexington, KY, evolved during gentrification. A significant body of related work aims to create novel metrics of neighbourhoods that do not rely on pre-determined administrative boundaries but rather activity spaces (Chen et al., 2019). Similarly, research examining temporal relations often primarily seeks to identify trajectories (Delmelle and Rey, 2021), showing, for example, that areas which might look similar at a given time point are on different evolutionary trajectories or, conversely, that areas which might look different at a given time point are moving in similar ways (Olson et al., 2021b).
As research has generated new relational neighbourhood metrics, new opportunities have emerged to incorporate those metrics into predictive models. Gentrification, crime, and disease spread have been key outcomes of interest. For example, Papachristos and Bastomski (2018) show that criminal co-offending generates stable neighbourhood graphs and predicts spatial patterns in crime better than traditional spatial models. Levy et al. (2020) demonstrate that, across over 30,000 US neighbourhoods, those with greater levels of ‘mobility based disadvantage’ experience more homicides, controlling for several crucial variables; Levy et al. (2022) build similar metrics out of daily mobility data in Wisconsin, San Francisco, and Seattle, and shows mobility disadvantage strongly predicts COVID-19 caseloads. Saxon (2021) uses cellphone data to build neighbourhood mobility graphs in Chicago and shows that more strongly connected neighbourhoods experience lower levels of crime and greater educational and economic attainment; Graif et al. (2019) use commuting patterns and obtain similar results. Greenlee (2019) goes beyond assessing the impacts of mobility graphs (based on longitudinal household records) on distinct variables to show that a neighbourhood’s multi-dimensional temporal trajectory strongly influences its residential mobility flows.
Neighbourhood research with machine learning models
While many of the aforementioned studies utilize sophisticated modelling techniques, the use of graph neural networks (GNNs) to leverage mobility data and predict features of neighbourhoods has not yet been explored. Machine learning methods have begun to make their way into urban studies research in general and neighbourhood studies in particular. For example, Gilling et al. (2021), Reades et al. (2018), and Thackway et al. (2023) train various models to predict gentrification, including Decision Trees, XGBoost, Linear Regression, and Random Forests. Noh and Park (2021) use an XGBoost model to predict commercial store opening locations in Seoul, Korea. Other studies have examined the potential of neural network models to predict land-use patterns (Pijanowski et al. (2005)). Ilic et al. (2019) use a Siamese convolutional neural network to predict gentrification based on Google Street View images. Palafox and Ortiz-Monasterio (2020) use neural networks to predict gentrification in Mexico City and explore an Interpretability Method called LIME to understand which factors are driving the classification, while Papadomanolaki et al. (2019) combine fully convolutional networks and recurrent networks to detect urban stability and variability over time, using satellite data.
Recently, scholars have been exploring the power of GNNs for urban studies (Guo et al., 2020; Hu et al., 2021; Li et al., 2021; Li and Zhu, 2021; Xiao et al., 2021; Xu et al., 2022; Yu et al., 2022). For instance, Xiao et al. (2021) explore GNNs to predict urban vibrancy, for example, the presence of lively street life or the perception of social life in public spaces around subway stations. Yu et al. (2022) propose using GNNs for the problem of drainage pattern recognition, showing that their approach outperforms other machine learning methods, including other deep learning approaches, for example, convolutional neural networks. Guo et al. (2020) propose using GNNs to extract traffic networks’ spatial and temporal features for improving traffic prediction (see also Li and Zhu (2021)). Hu et al. (2021) use GNNs to predict urban functions at the road segment level, exploring traffic interaction data obtained from taxi trajectories. Li et al. (2021) propose an approach based on GNN to predict human activity intensity, which enables them to consider both spatial and social perspectives. Xu et al. (2022) showed considerable performance improvement when using GNNs to classify areas into neighbourhood types (e.g. industrial, residential, commercial, or educational zones) based on visual cues.
This work indicates the relevance and promise of graphs to represent complex relationships in modelling urban and neighbourhood patterns. There are also several proposals for new variants of GNNs to deal with spatial data (Song et al., 2020; Zhu et al., 2021). For example, Zhu et al. (2021) propose a model for spatial regression based on GNNs, which could be useful in various spatial regression analyses. Song et al. (2020) propose a GNN for handling spatial-temporal data simultaneously. Even so, no previous study, to the best of our knowledge, has focused on applying GNNs in the context of predicting cultural dimensions of neighbourhoods from a mix of socio-demographic, mobility, and group profile information. In addition, not all GNN models support expressive graphs, that is, those with vertex and edge attributes; hence, another key contribution of our study is exploring the potential of such graphs in the context of neighbourhood research. Nevertheless, it must be stressed that the approach we evaluate here is one among many emergent machine learning techniques that may hold promise for neighbourhood research. Building a toolkit that compiles and makes available a range of methods is an important avenue for further research.
Local cultural dimensions
While mobility graphs have begun to be utilized to predict outcomes such as gentrification, crime, and disease spread, they have not thus far been used to model local cultural dimensions. Even so, existing work points to the importance of this topic. Thus, Phillips et al. (2021) suggest (but do not empirically test) the proposition that connected neighbourhoods should foster cultural diffusion, through the spread of ‘tastes, fashion, values, attitudes, and cultural practices’ (Harding et al., 2010). Cultural tastes spread both through personal ties, but also through the creation of and exposure to public displays of cultural dimensions in, for example, cafes, restaurants, parks, sidewalks, and various other amenities (Brown-Saracino and Parker, 2017; Ghaziani, 2016). Such displays can include indications of acceptance of gay couples (e.g. rainbow flags), affirmations of transgressive or counter-cultural values (e.g. through body piercing studios), celebration of ethnic cultures (through themed restaurants or shops), or more (Silver and Clark, 2016).
These suggestions indicate that local cultural dimensions are the result of diverse and complex processes. Silver et al. (2022c) synthesize multiple strands of research under the heading of the ‘4 Ds’: development, differentiation, diffusion, and defence. Development processes occur when local areas exhibit increases in income and education, which often generates a shift from more traditionalistic and communal cultural dimensions to more expressive and individualistic ones (Inglehart, 2007). Differentiation is driven by competition among local businesses and services, pushing them to more specialized and unique offerings relative to elsewhere (Durkheim, 2014). Diffusion happens when new ideas are transmitted by people or communications technologies from one area to another (Tarde, 2010). For example, Somashekhar (2021) finds that group profiles of new residents across gentrifying neighbourhoods vary greatly, spanning lifestyles such as ‘Urban Achievers’, ‘Bohemian Mix’, and ‘American Dream’, presumably contributing to distinct local cultures in their destinations despite similar socio-economic conditions. ‘Defense’ processes occur when established locals respond to newcomers with divergent tastes by reasserting their local cultural dimensions to maintain their current dimensions over time. Silver and Silva (2023) develop quantitative models to identify when and where defence succeeds or fails to maintain existing local cultural dimensions, formalizing insights from several qualitative studies of single cases.
Silver et al. (2022c) gather evidence for each of these mechanisms, inspired by both classical and recent theories. However, while this and other research have articulated some mechanisms that may predict where and when some cultural styles are more or less likely to appear, the study of local cultural styles has not been formally integrated into neighbourhood graph research. Nor has the potential of machine learning in general or the expressive power GNNs in particular to combine multiple processes into a single model been explored. Instead, prior research on neighbourhood culture has examined various processes separately. Therefore, we build a model that combines (a) local area information (e.g. postal area socio-economic data), (b) neighbourhood mobility graphs, (c) group profiles of individuals who move between neighbourhoods to predict future, and (d) local public cultural dimensions or ‘scenes’ (Silver et al., 2010) embodied in venues such as cafes, restaurants, churches, night clubs, and more. More details on modelling and measurement are below. More details on cultural dimensions can be found in the Extra Information on Cultural Dimensions section in the Supplemental Material.
Yelp as a source for studying neighbourhood variation and mobility graphs
Many of the aforementioned studies have leveraged the analytical potential of social media to build neighbourhood mobility metrics (Ferreira et al., 2020; Rodrigues et al., 2017; Santos et al., 2018; Senefonte et al., 2020, 2022). Geo-referenced tweets have been the most common source, along with mobile phone data and fine-grained administrative data. While Twitter holds great potential for mobility graph studies, it also has limits for some purposes, in that there is no guarantee that a tweet posted from a given location is about that location. In principle, many online activities, including location-based social networks, leave digital traces out of which mobility graphs could be constructed and which include information about places and activities that occur in the visited areas. For example, Santala et al. (2020) explore Untappd check-ins to demonstrate the potential of using such type of data to uncover uses of urban areas that can change dynamically, Senefonte et al. (2022) and Ferreira et al. (2020) have used Foursquare check-ins to trace tourists’ group profiles internationally, and similar data could be used potentially at the neighbourhood level (see also Arribas-Bel et al. (2016) for another use of Foursquare data).
While it has not featured prominently in neighbourhood graph studies, Yelp.com also has great potential to join mobility graph research with the study of local culture. Yelp is one of the most popular consumer review social media sites, with more than 150 million unique users providing millions of reviews in several different languages (Ranard et al., 2016). Yelp has much to offer as a source of data for studying neighbourhood change. In particular, it contains information about (i) venues and (ii) their users. Venues are mainly businesses such as restaurants and coffee shops, but they also may include public spaces such as parks or hiking trails. Each venue is classified within a hierarchical list of categories and may contain user reviews containing evaluative assessments. The reviews are date stamped and correspond to a venue GPS location, enabling geospatial and temporal analysis. Furthermore, each user reviewer accumulates a portfolio of reviews and their locations.
Yelp has been utilized to study local neighbourhood culture. Such work tends to feature neighbourhood culture as revealed by local aggregations of review texts, characteristics of restaurants, or attributes of reviewers. For example, Rahimi et al. (2018), Suresh and Locascio (2015), and Olson et al. (2021a) use computational text analysis to identify neighbourhood boundaries from review texts while creating metrics of local cultural similarity and difference; Chen and Park (2021) show that regional culture influences which cuisines tend to be combined in reviews. Rahimi et al. (2017) home in on keywords around romance, dating, marriage, and family, finding that different parts of cities are more or less associated with different modes of romantic experience. Zukin et al. (2017) examine how the sentiment of reviews varies across predominantly white or black New York neighbourhoods. Glaeser et al. (2018), by contrast, examines changing distributions of venue types (e.g. restaurants, grocery stores, bars, cafes), finding that changes in the business landscape are leading predictors of housing prices and that such dynamics can be observed in closer to real-time as compared to standard census sources (see also Dong et al. (2019) and Rahimi and Bose (2018)). Group profiles of reviewers (users) have been less frequently studied, but Silver and Silva (2023) suggest a method for doing so, and use that method to study how the local amenity mix of neighbourhoods is affected by the appearance of newcomers with tastes that do or do not diverge from those of the current residents.
A key contribution of our study is to develop methods for combining the rich information contained in Yelp group profiles and to suggest directions for extending these methods to other sources. In particular, we combine four types of information. First, following Silver and Silva (2023), we build group taste profiles based on the sets of venues that individuals review. Reviewers who visit similar sets of venues are grouped together. Second, following Silver and Clark (2016), we build profiles of neighbourhood public culture or ‘scenes’ based on their overall sets of venues (e.g. tattoo shops, night clubs, fashion houses, community centres), featuring the cultural orientations they support (e.g. transgression, glamour, neighbourliness). Third, we use the location information associated with reviews to build neighbourhood graphs based on review co-location, where two neighbourhoods are considered connected when reviewers visit both of them. In addition, we use the date stamps on reviews to make these neighbourhood graphs dynamic, thereby combining spatial and temporal contextuality. The present study does not explicitly leverage review text, but we suggest directions for doing so in the conclusion. The GNN enables us to join and evaluate all this information into a single model alongside traditional census of population data.
Building on the above review, we pursue this main research question: In predicting local cultural dimensions, what is the relative predictive power of (i) area socio-economic data (ii) group taste profiles and (iii) mobility graphs?
Data and method
Overview
Figure 1 illustrates the overall workflow of this study. We first collect Yelp data on user review activity – note that other systems could be explored. Second, we extract for each user a group profile from the set of venues they visit, and define groups in terms of users sharing a similar group profile. Third, we use review co-location to construct mobility graphs for each year and each city in our dataset. Finally, we join the mobility and group profile information with census FSA socio-economic data in a GNN to predict neighbourhoods’ future cultural dimensions – neighbourhoods are represented in this study as FSAs. Details about data, measures, and methods are below. For the sake of simplicity, we explain our methodology for a specific city p. However, we repeat the same steps for all cities. Overall workflow of the study. Steps were numbered to indicate precedence order. Proceedings represented in Step 1 refer to data collection. However, those represented in Step 2 refer to information extraction on LBSN data. Steps 1 and 2 are necessary to build mobility graphs (Step 3), which, in turn, are explored in the cultural dimension predictions (Step 4). [Best in colour].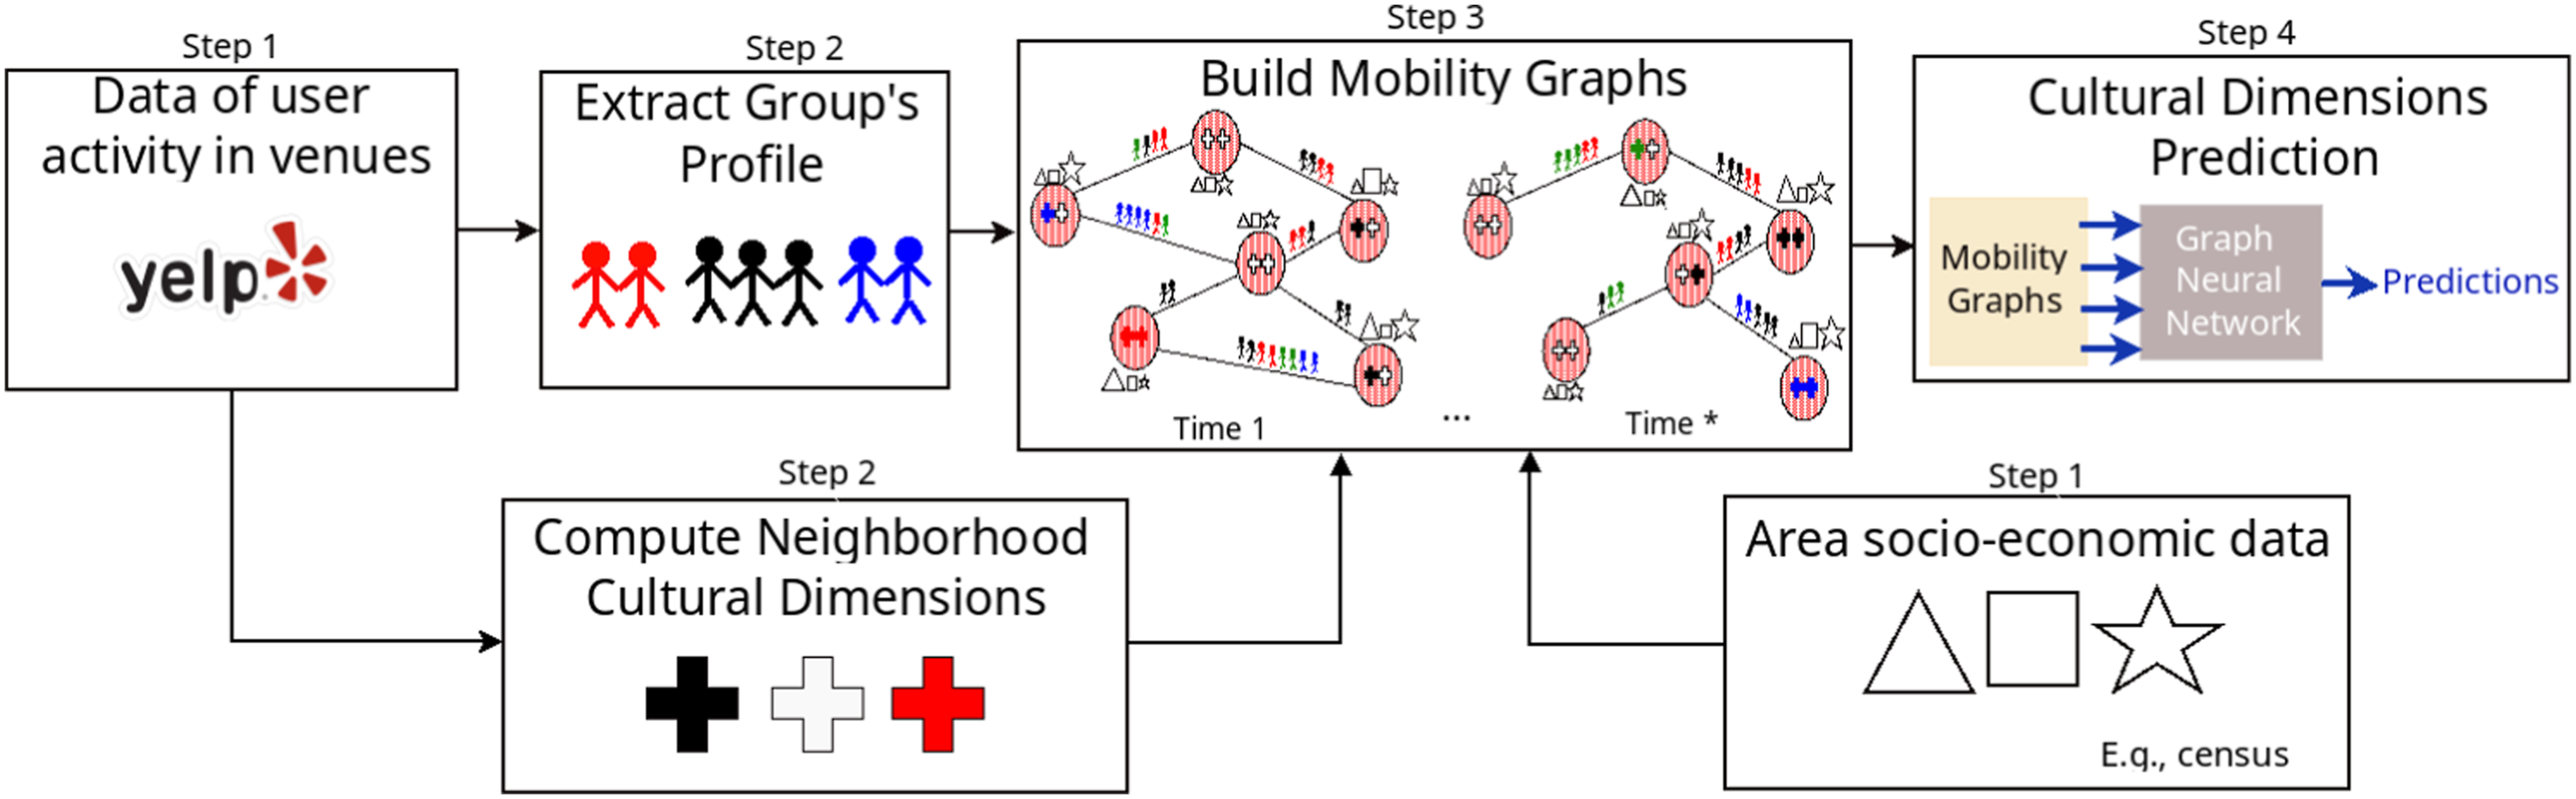
Yelp dataset
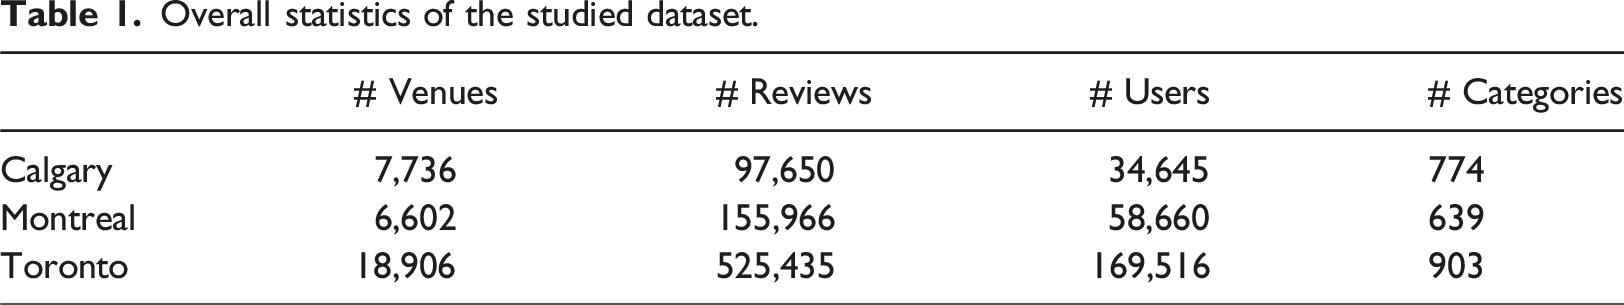
Overall statistics of the studied dataset.
Group profile
We identify group profiles in three steps, adapting for this application text analysis methods and following (Silver and Silva, 2023).
First, we characterize each user by the categories of the venues they review. Users are considered as ‘documents’, and the categories of the items they review are treated as words. For example: d1 = {Nightclub, Cafe, Sushi Restaurant, Mechanic}, where d1 ∈ D represents a document describing user1.
Second, after applying standard pre-processing techniques (removing numbers, special characters, blank spaces, etc.), we identify latent topics in these cleaned documents using Latent Dirichlet Allocation (LDA) (Blei et al., 2003). In this application, each user can be associated with topics; in this case, topics can be interpreted as the user’s interests. To determine the number of topics to include in our analysis, we use the UMass topic coherence measure (Mimno et al., 2011) to evaluate 1 to 30 topics. This measure trains the topic model using the original corpus rather than relying on an external corpus, as in other coherence methods. We look at this distribution of coherence scores to identify a suggested number of topics, that is, the highest score. We then map each document onto the topic space: u = {x1, x2, …, xs}, where u ∈ U is a feature vector representing a particular document, and xi represents the probability that this user is associated with a certain topic among s topics considered.
Third, we identify groups based on users’ topics of interest. To do so, we find groups of users C = {c1, …, ck} in the space represented by the feature vector U. We rely on the k-means algorithm, where k is identified according to the silhouette heuristic (evaluating k from 2 to 15). Each group identified is referred to as a group profile in this study.
Area socio-economic data
To measure socio-economic conditions in each area, we use data from the Canadian Census of Population (2016) and the National Household Survey (2011). We consider the following variables: percent with a BA or higher, average rent, percent classified as ‘visible minorities’, median income, percent age 20–34, percent who walk to work, and percent who work in arts, entertainment, and culture. We map the socio-economic data to the closest year of Yelp data. This set of variables captures neighbourhood socio-economic features, including ethno-racial composition, class, youth culture, housing affordability, walkability, and arts activity. While one might consider additional variables, these are similar to those used in past work on Canadian neighbourhood identity and change (e.g. Silver and Clark (2016), Doering et al. (2021), and Silver and Silva (2021)). Census Files section, Figure S6, in the Supplementary Material shows the differences between the census.
Neighbourhood cultural dimensions
The target of our prediction models is the local cultural dimensions or scenes for each FSA – Extra Information on Cultural Dimensions section in the Supplemental Material for more information. Following research on local ‘scenescapes’, we measure local scenes by aggregating the set of venue categories available in an area in terms of qualitative meanings they express. Detailed descriptions of the theoretical meaning of each dimension can be found in (Silver and Clark, 2016) and elsewhere with a focus on the Canadian context (Silver, 2017). To translate these concepts into measurements, for each venue category (e.g. tattoo parlour, fashion house, or farmers market), a team of trained coders assigned a score of 1–5 on a set of 15 cultural dimensions t
i
∈ T = {t
1
, t
2
, …, t
15
}, such as tradition, transgression, local authenticity, or glamour (described in (Silver and Clark, 2016)). Each area (i.e. FSA) then receives a score for each of the 15 dimensions, calculated as a weighted average. More specifically, for a particular FSA, we have a vector
Mobility graph
Each city is characterized by an aggregated mobility graph per year describing users’ visit patterns manifested in Yelp reviews. The mobility graph is an undirected weighted graph G = (V, E) with a set V = {v
1
, v
2
, …, v
n
} of vertices corresponding to urban FSAs, and a set E ⊆ V × V of edges. If an edge (v
i
, v
j
) ∈ E, e
ij
represents two reviews made by the same user in the FSAs v
i
and v
j
. All unique venues a user reviews in a certain time window will produce a complete graph pattern. That is, if a user made reviews in v
1
, v2, and v3 in a specific time window, then the graph referring to this period will have the edges (v
1
, v
2
), (v
1
, v
3
), and (v
2
, v
3
). A vertex v is associated with vertex attributes/features
Scenarios exploring GNNs considered in this study.
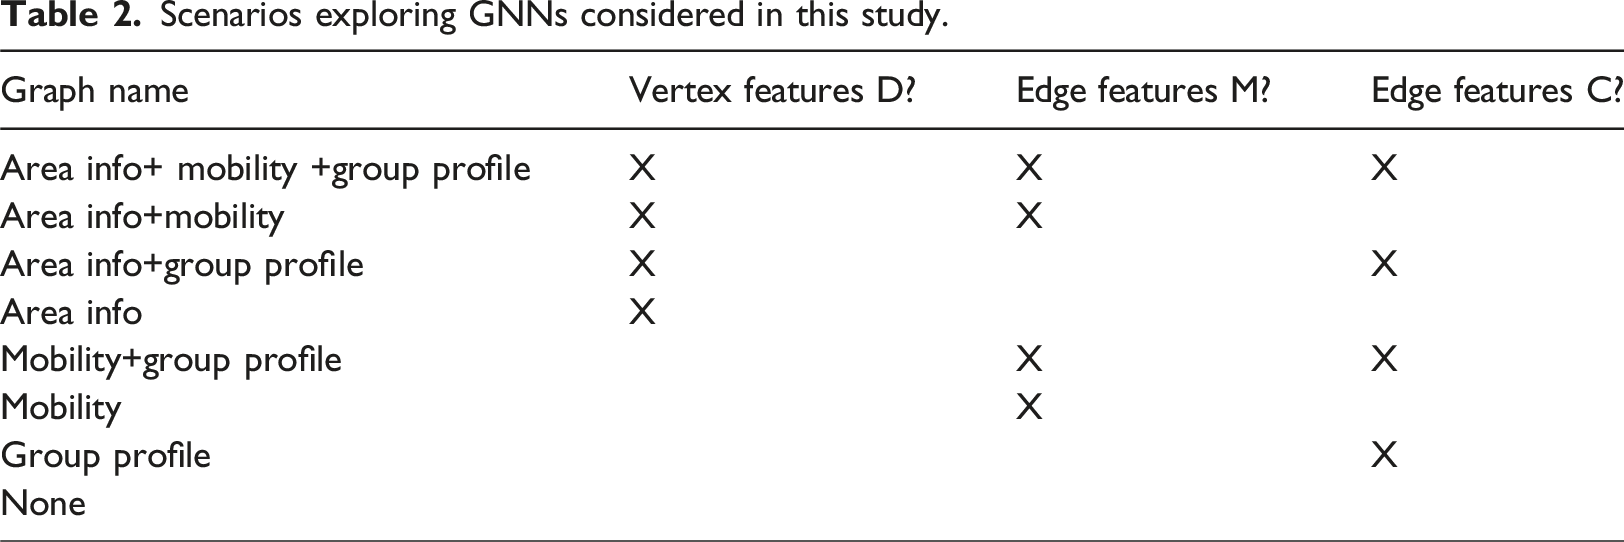
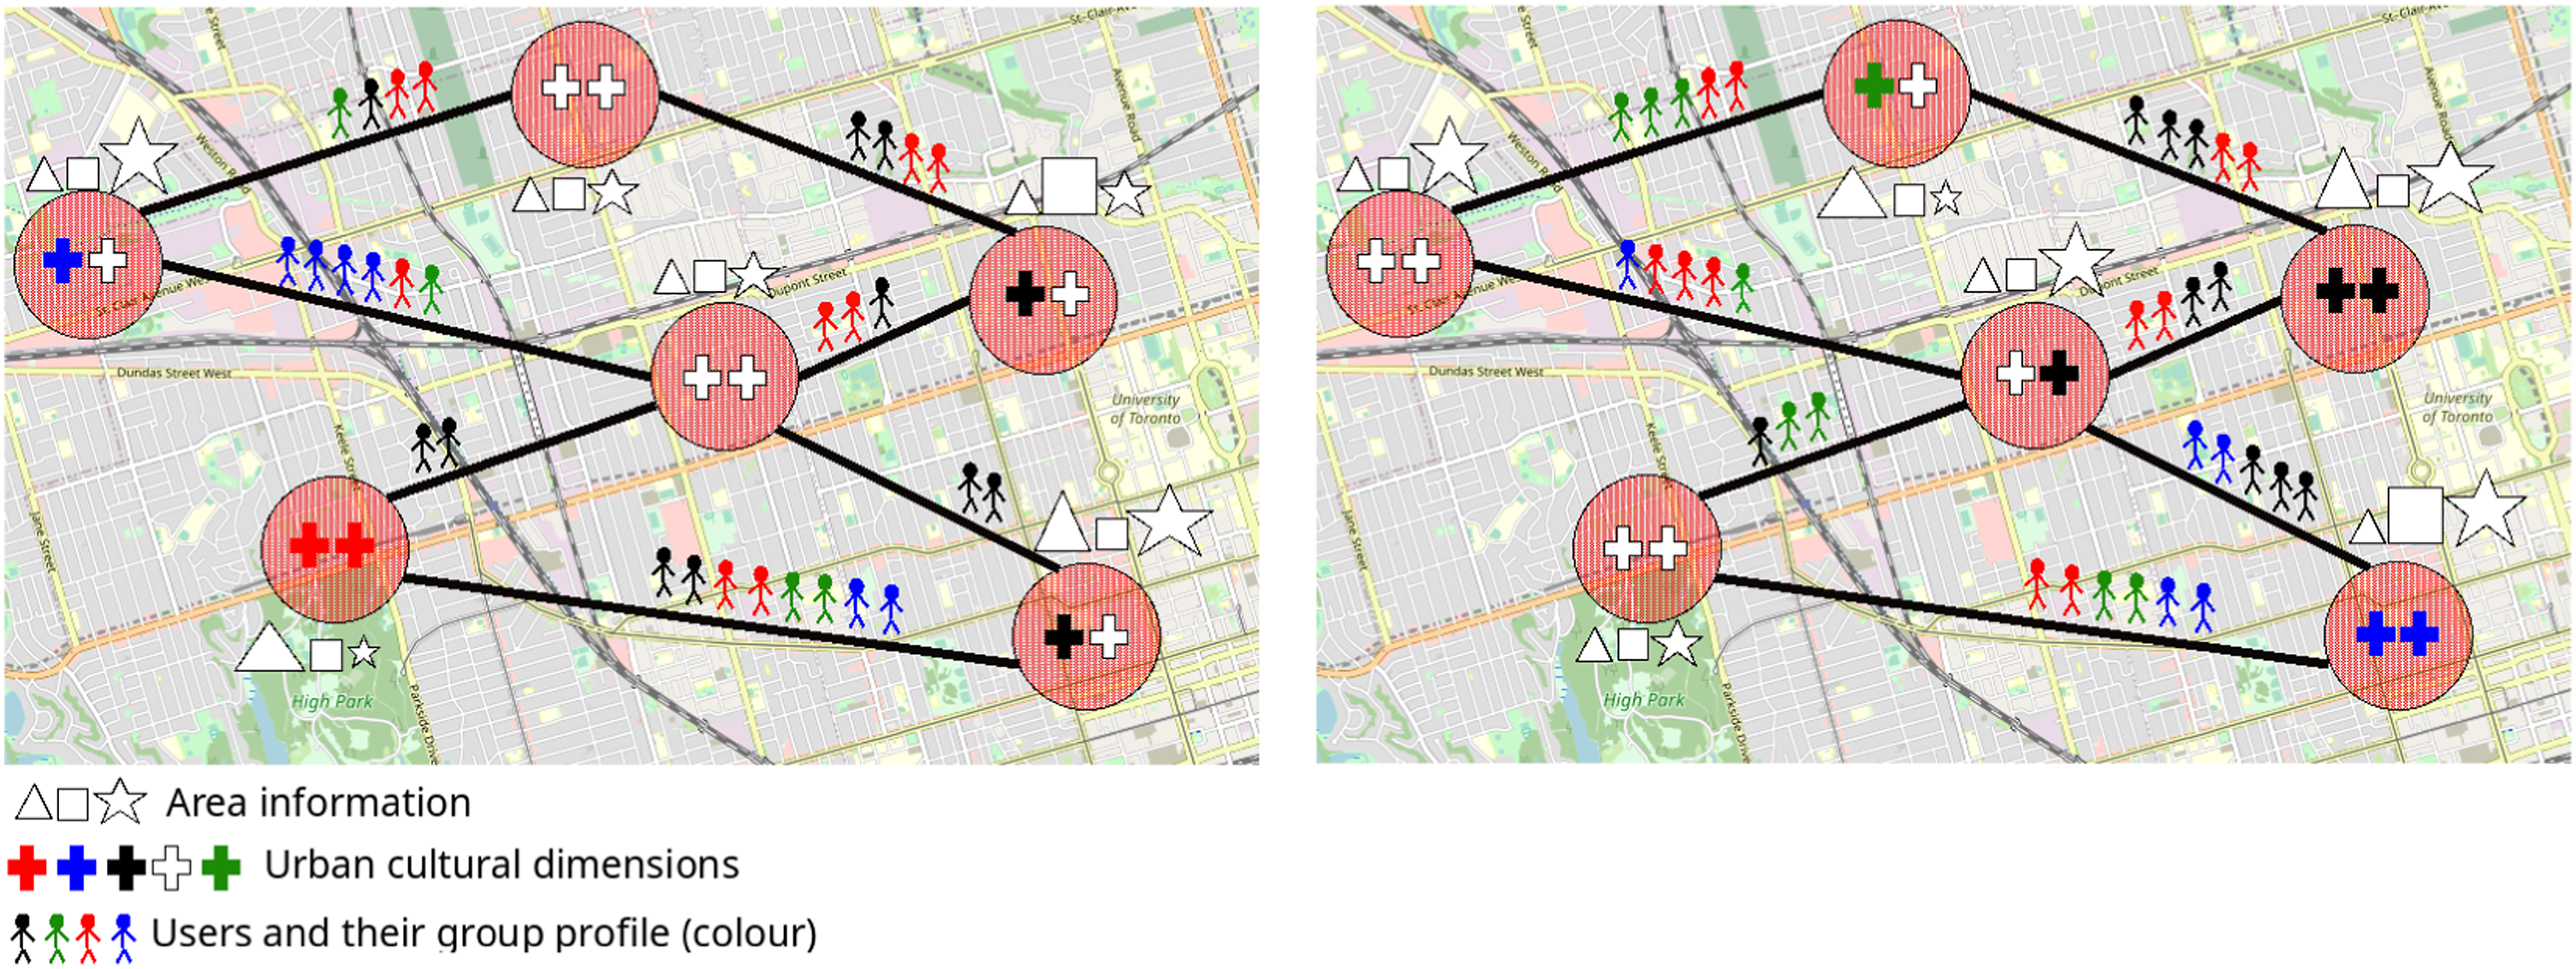
Illustration of our mobility graph. Both figures represent the same city. On the left, we have data for year y, and, on the right, year y + 1. For each year, we consider the same areas (vertices), shown as red circles. Note that areas can have attributes (i.e. the vertex attributes of the graphs), which are represented by the symbols triangle, square, and star, where the size indicates the importance of the attribute. Crosses inside areas represent urban cultural dimensions. Edges can express the number of people that visited both areas (in all graphs) and the type of people that visited both areas, represented by the stick figure’s colour (i.e. the edge attributes of the graph). [Best in colour].
Prediction model
Overview
The success of deep learning in many domains is partially attributed to the rapidly developing computational resources (e.g. GPU), the availability of big training data, and the effectiveness of deep learning in extracting latent representations from Euclidean data (e.g. images, text, and videos). While machine learning techniques such as deep learning effectively capture hidden patterns of Euclidean data, there is an increasing number of applications representing data in graphs/networks. Graphs are a type of non-Euclidean data structure that models a set of objects (vertices) and their relationships (edges). They offer a high level of expressive power, suitable for studying systems across various areas, especially complex systems such as social networks, molecular interaction in chemistry, and, as we argue in this study, neighbourhood change. Graphs can have a variable amount of unordered vertices, that is, they can be irregular, and vertices may have a different number of neighbours. Therefore, some critical operations (e.g. convolutions) are challenging to apply to the graph domain.
For these and other reasons, there is growing interest in developing deep-learning techniques for graph data. Accordingly, newer models are emerging to handle the complexity of graph data (Wu et al., 2020; Zhou et al., 2020). A Graph Neural Network (GNN) is a class of deep learning for processing data that can be defined as graphs/networks. Thus, GNNs improve other deep learning techniques that work with Euclidean data, offering the ability to learn complex patterns associated with connections between components (Wu et al., 2020; Zhou et al., 2020). For instance, in social networks, a graph-based learning system can leverage the interactions between users and content to make highly precise recommendations.
Our study investigates whether neighbourhood research can also benefit from this type of model. GNNs are especially promising in this setting, because we are attempting to model complex interactions, as illustrated in Figure 2. More specifically, we show the power of GNNs for this type of application by examining the degree to which the interaction of groups of users with different types of urban areas influences the prediction of local cultural dimensions/scenes. Figure S4 in the Supplementary Material illustrates this model visually.
Studying these sorts of complex relationships without graphs, while possible, is highly challenging. By using GNNs, however, our model can relatively straightforwardly handle complex mobility graphs that include (multiple) vertex and edge attributes. In this study, we consider eight different scenarios (i.e. graphs, as defined in Section ‘Mobility Graph’). All graphs have information on urban cultural dimensions in the areas (vertices). We aim to predict the urban cultural dimensions for all areas under evaluation.
Technical details
The key idea of GNNs is to generate representations of vertices that depend on the graph’s structure and any available feature information (Hamilton, 2020). Motivated by the success of Convolution Neural Networks (CNNs) in the computer vision discipline, many approaches re-define the idea of convolution for graphs (Wu et al., 2020). Thus, Graph Convolutional Network (GCN), outlined by Kipf and Welling (2017), has proven to be one of the most effective and popular baselines of GNN architectures (Hamilton, 2020). In this study, we explore the architecture proposed by Li et al. (2020), called DeeperGCN, where the authors define, among other things, a novel generalized graph convolution (GENConv). This architecture enables training deep GCNs, overcoming a limitation in early versions of GCNs (Li et al., 2020). In addition, GENConv allows learning on graphs with vertex attributes – as in all the architectures – and edge attributes beyond weights, whereas weights are the only edge attribute supported by the original GCN. Having a model that supports graphs with richer information is very important to tackle the neighbourhood change problem studied in this paper.
The GNN design examined in this study is outlined in Figure S5 in the Supplementary Material. Edge and Vertex features of the input graph are encoded by a linear transformation. Multiple DeeperGCN layers then convolve the resulting encoded graph. One DeeperGCN layer consists of a batch normalization layer (LayerNorm), an activation function (ReLU), one dropout layer, one GENConv layer, and a residual connection layer – details can be found in (Li et al., 2020). We used five DeeperGCN layers. The evaluation of different configurations, for example, with more/less layers, is out of the scope of this paper. After that, a final linear layer maps the encoded information to generate a prediction for all 15 cultural dimensions.
Evaluation
To evaluate each of the eight scenarios (graph types, see Section ‘Mobility Graph’) considered, we conducted different experiments by varying our data. The first step is to divide our dataset in two. If we envision predicting local cultural dimensions for year y, then we consider data for year y as the Test set. Next, we use all information on previous years available in our dataset to compose the Training set. In other words, when aiming to predict the local cultural dimensions for
Figure 3 helps to illustrate our training and test process for the aforementioned scenario. As time is crucial in our dataset, we must consider it. We do so by adjusting our model by learning and validating on consecutive pairs of years of the Traning set. That is, we start by learning parameter values for a candidate model on data for 2011; then, we validate this model by trying to predict local cultural dimensions for 2012. We then calculate errors and adjust the parameters of our model. We repeat this process considering 2012 data for learning and 2013 for validating, and so on, for all data in the learning dataset. We repeat this process X times – in this study, we consider 10,000 epochs. Diagram depicting the division of our dataset and procedures performed. This example assumes that we want to predict local cultural dimensions for the year 2015, thus, it becomes our test set. In this example, we train our model using all previous years: 2011 to 2014. One epoch (one complete cycle) in the training phase comprises learning and validation steps with all consecutive pairs of years, alternating learning and validation in each step, as depicted in the detailed part of the training set in the figure.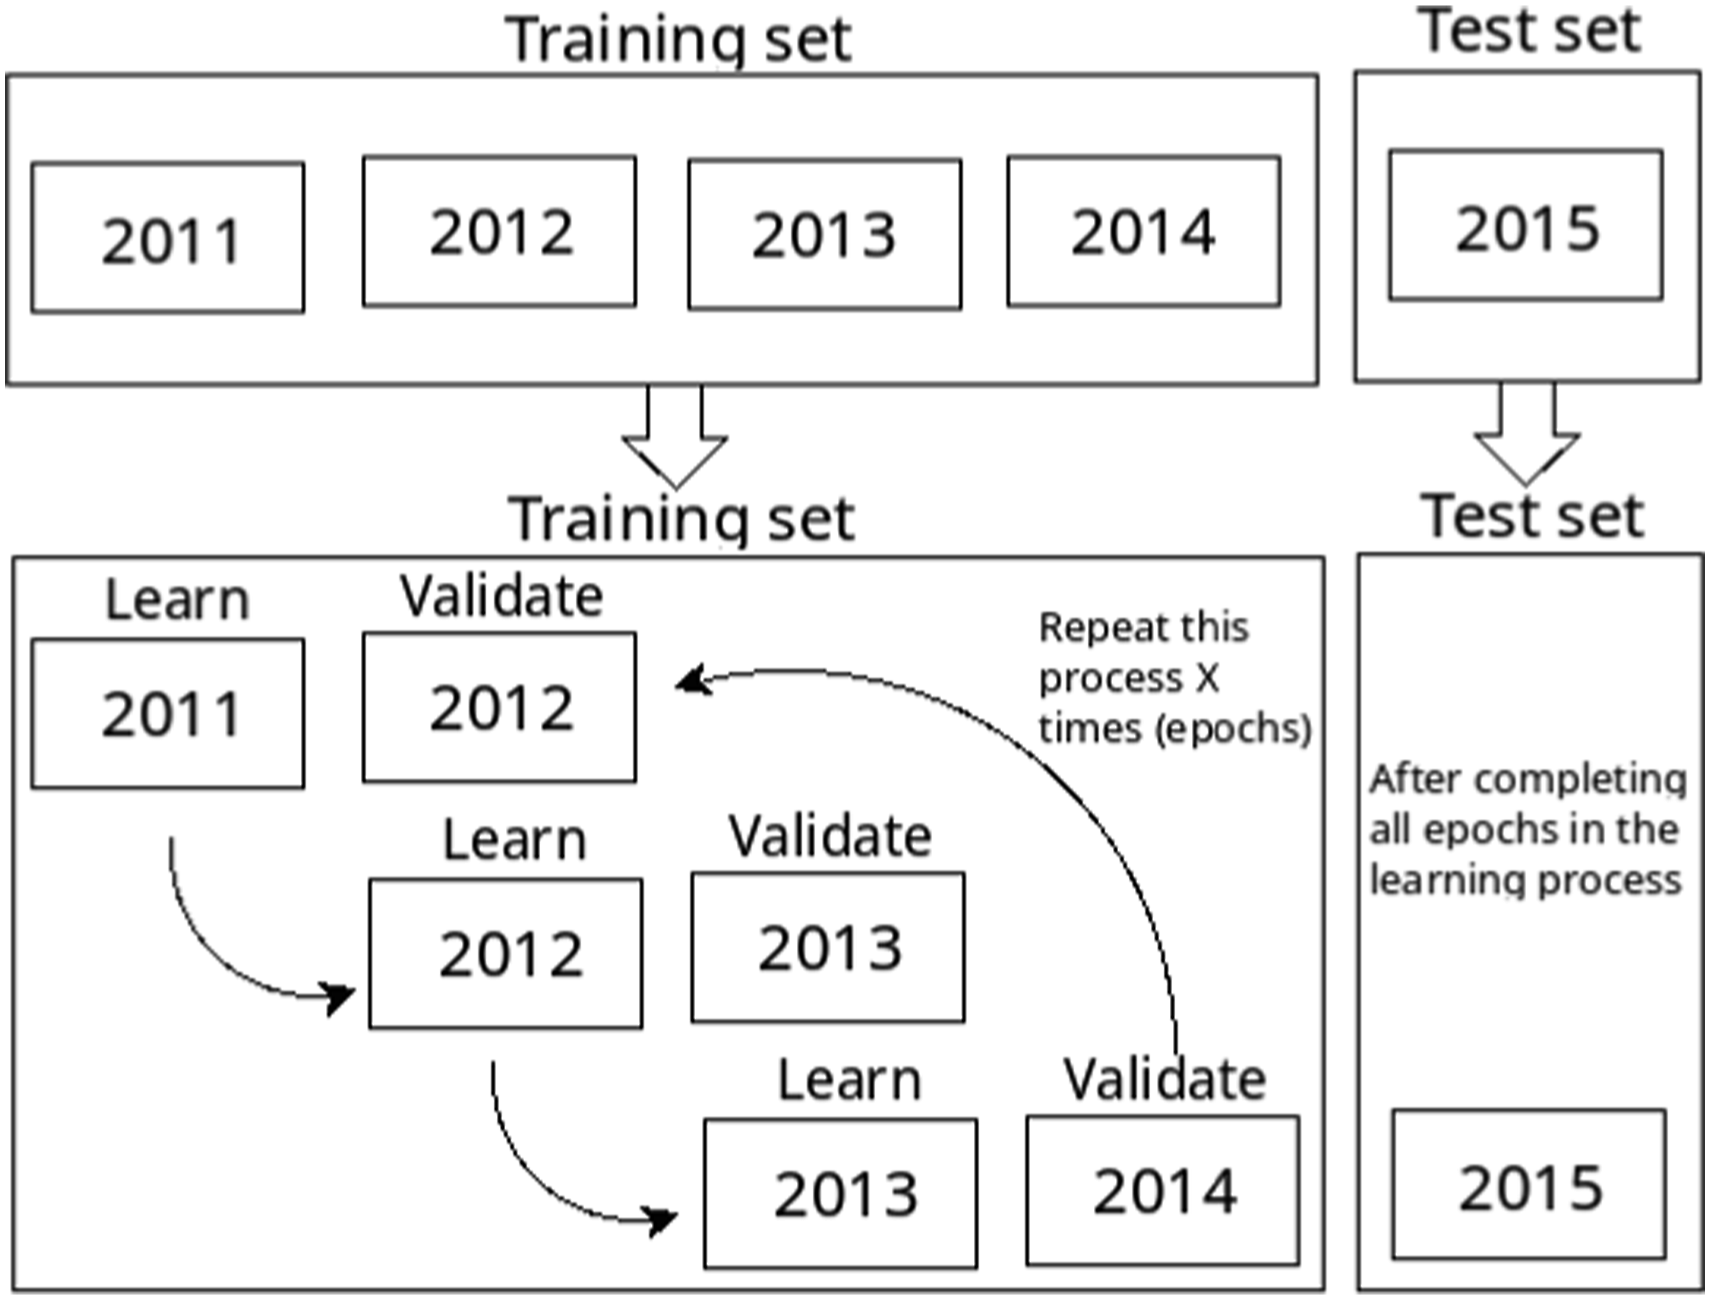
We predict local cultural dimensions for 2016, 2017, and 2018 for each scenario. In other words, these represent our Test set in a specific configuration, repeating experiments 25 times for each case. After that, for all experiments regarding a particular scenario in the city, we perform two types of analysis on the errors: i – aggregated view, computing the average RMSE (plus the confidence interval of 95%) for all FSAs and cultural dimensions; ii – errors by FSA, computing the average RMSE by each FSA for all dimensions – here we also group FSAs by east and west regions to evaluate their distribution.
Alternative models
We also evaluate strategies not exploring graphs to contrast with the GNN approach. For these strategies, an FSA f is associated with features
The evaluation process has similarities to the one presented in the previous section. The first step is dividing our dataset in two, where the year y we want to predict is the Test set, and prior years are the Training set. We also predict local cultural dimensions for 2016, 2017, and 2018 for each alternative model. So, for instance, when predicting 2016, we consider
The first strategy is called Naive Baseline. It considers the average cultural dimensions for each FSA of training data as a predictor. For instance, the predictions for the year 2016 is
We also consider classical strategies: XGBoost (Chen and Guestrin, 2016), Random Forests (Tan et al., 2016), and Lasso (Tibshirani, 1996). We tuned each model’s hyper-parameters, that is, performing an exhaustive search over specified parameter values to find the best model in 5-fold cross-validation. Note that this process was not applied in the GNN strategies. that is, it could be improved.
Results
Figure 4 shows results for model evaluation. First, we look at the results based on GNNs – scenarios described in Table 2. As expected, across all cities, not using any information other than the base structure of the graph – the ‘None’ scenario – produces one of the worst predictions of local cultural dimensions. The other situations we considered add content to the graph. In all cases, mobility information alone provides the worst predictions – mobility cannot be reliably differentiated from ‘None’. This result implies that simply knowing about the degree of connectivity among neighbourhoods does not provide much information about their cultural characteristics. Prediction errors (RMSE) for different scenarios (graphs) – the higher, the worse. Scenario None, a graph without census information, group profile, and mobility information, presents the worst results for all cities. Note that we zoomed in on the y-axis to favour legibility. Note on group profiles: for Calgary and Montreal, we found five group profiles considering five topics; for Toronto, we found four group profiles considering seven topics. Recall that the GNN scenarios names are represented in Table 2 – for instance, ‘area info’ is a scenario that only includes vertex features D. (a) Calgary. (b) Montreal. (c) Toronto.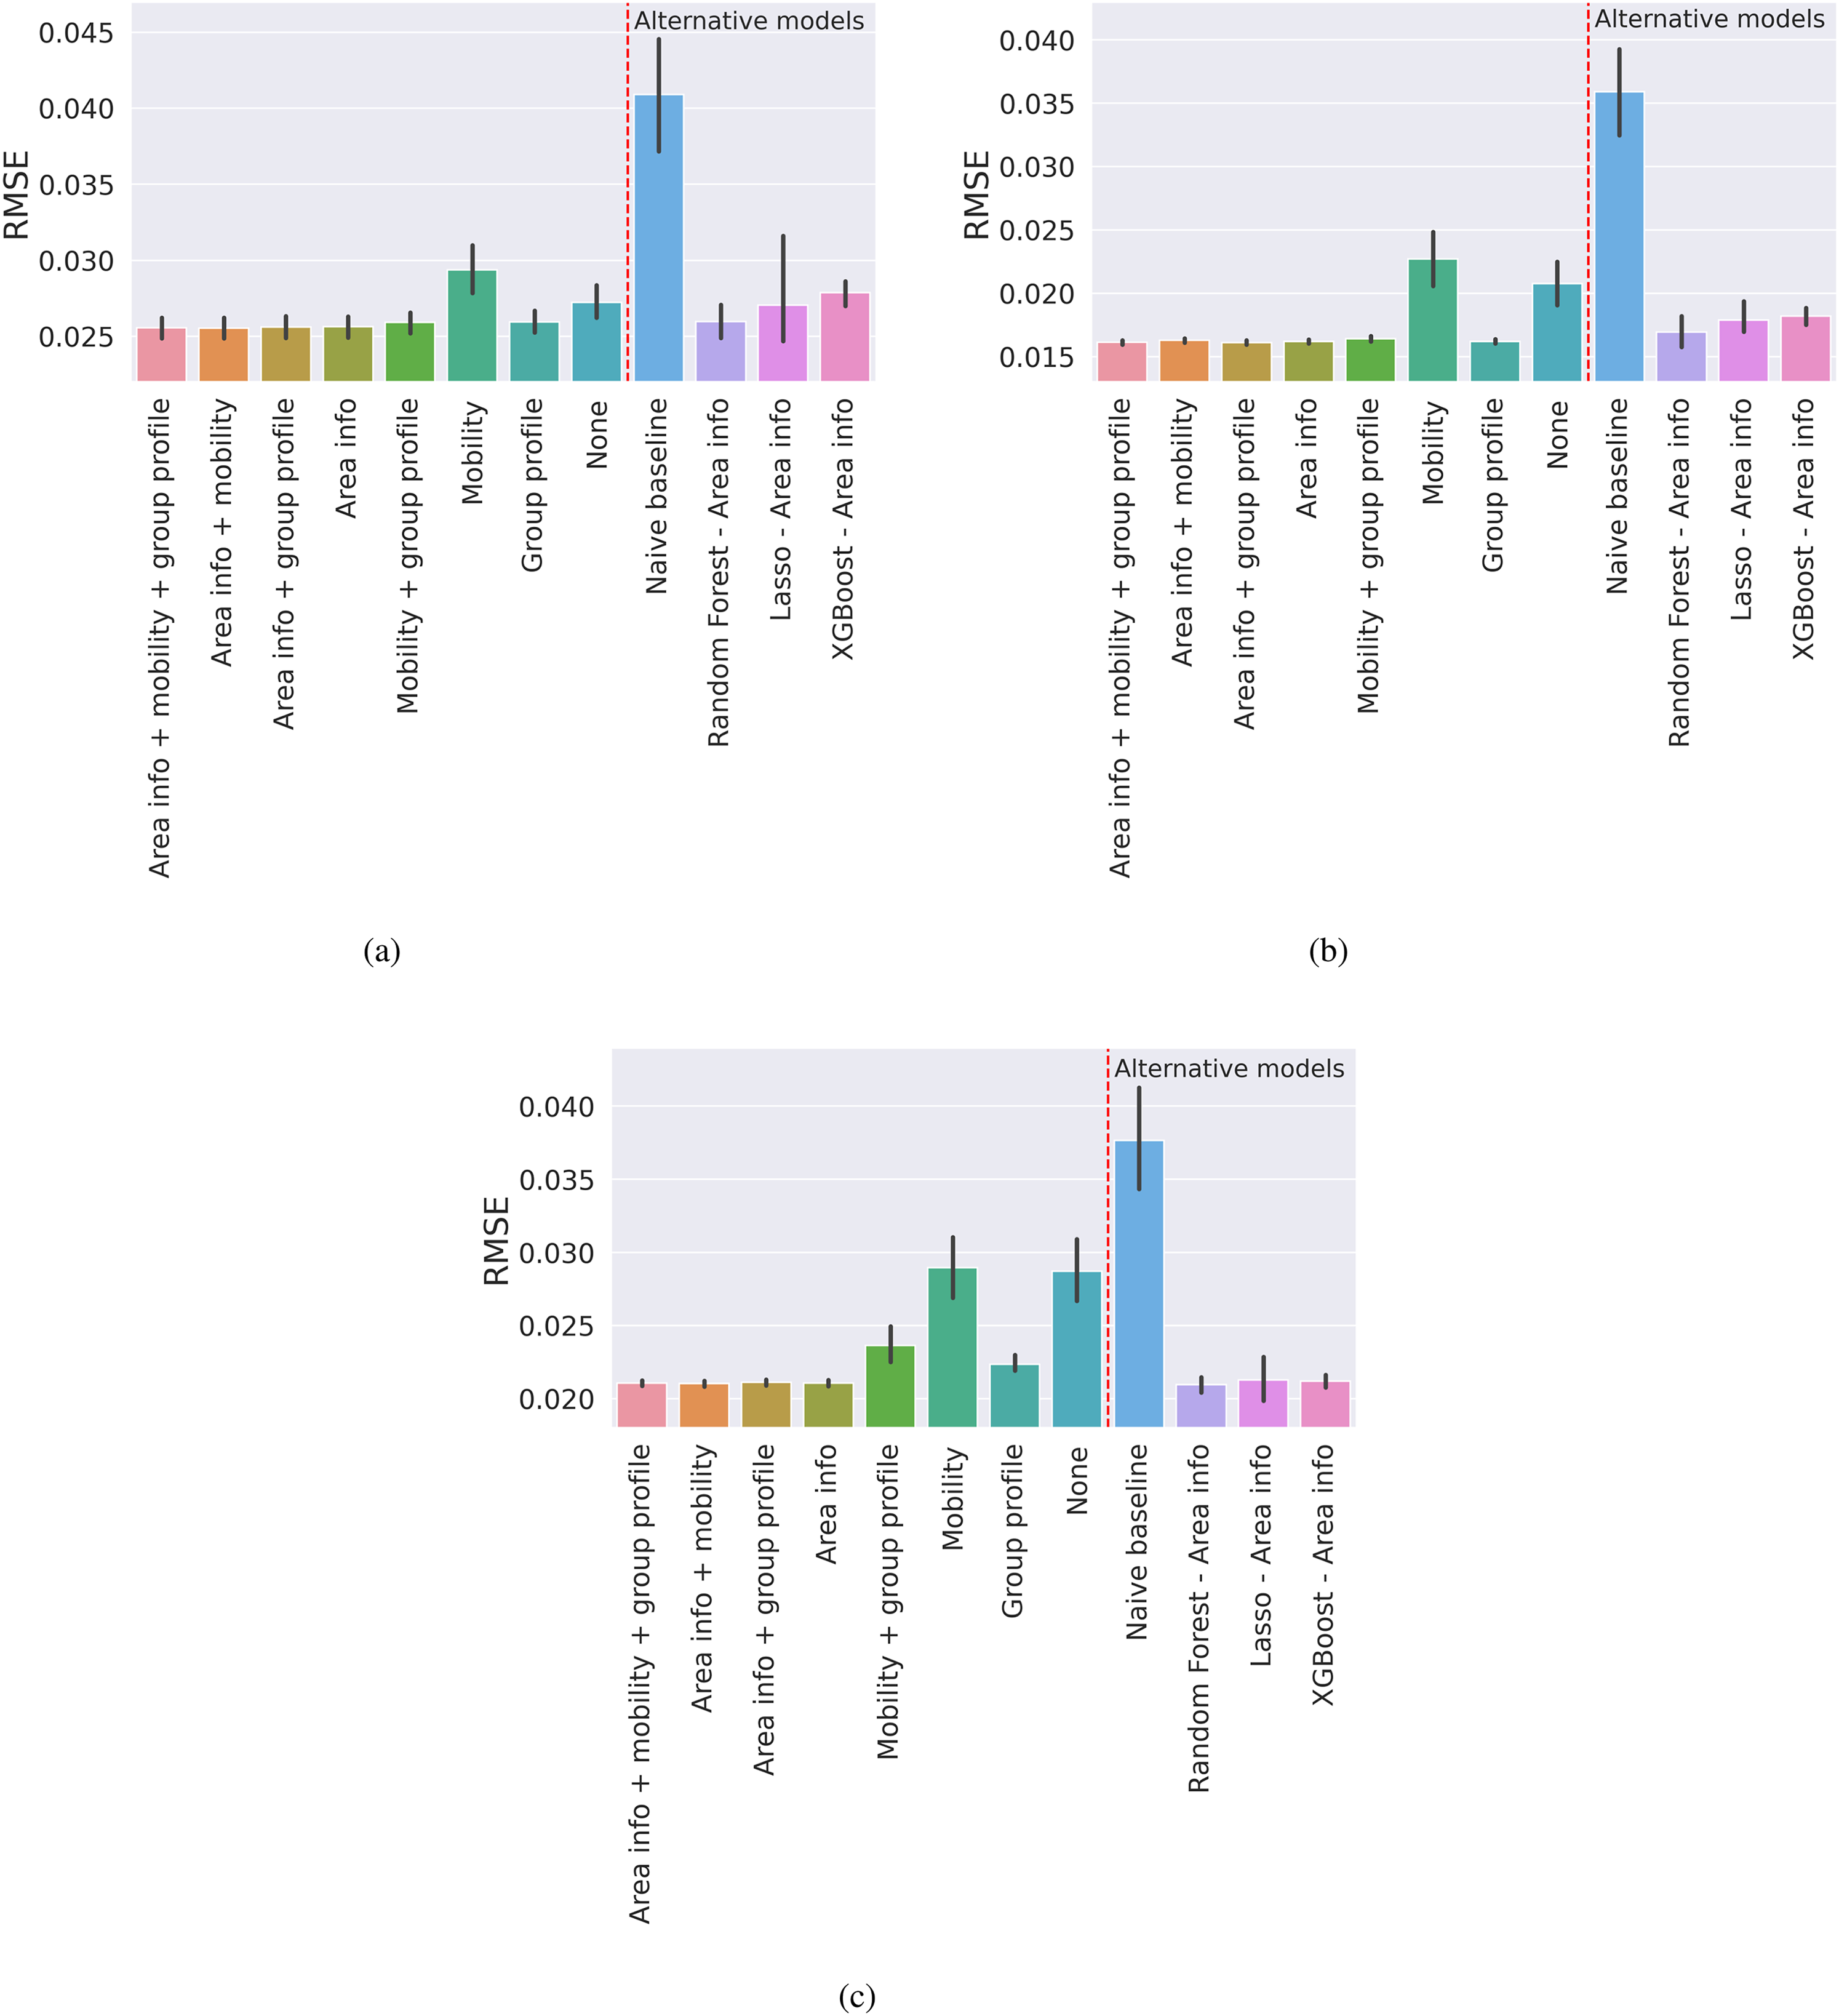
Adding more contextual information about areas or the groups that move among them improves the predictions. In general, area socio-economic information provides the best predictions. However, group profile information (taste profiles of groups associated with edges) gives statistically indistinguishable results in Calgary and Montreal. In Toronto, the difference is quite small (around .001 in terms of RMSE). Across all scenarios, there is no discernible improvement from combining information (e.g. mobility plus group profile does not perform better than group profile alone, area information plus other information does not perform better than area information alone).
Now we concentrate on the analysis regarding the alternative models (not considering GNNs). First, we observe that the Naive baseline approach consistently produces the worst results – around two times worse than the best results with GNNs. We also observe that there is always at least one result provided by Random Forest, Lasso, or XGBoost – that only considers socio-economic data – not distinguishable from the ‘Area info’ scenario. This shows that if we are in possession of socio-economic census data, there is no evident advantage in using our studied GNNs approaches – at least for the GNNs models we evaluated, without fine tuning as done for the alternative models.
These findings with regard to model evaluation are the central results of the paper. They show that in most cases, census socio-economic information is the best predictor of what the cultural dimensions in a neighbourhood will be. But, crucially, they also show that Yelp group profiles are generally as good. Thus, where census data might not be accessible – between censuses or in places where socio-economic information might not be reliable – if online review information is available, we may use them to learn about where the local culture of a place is likely to head.
Nevertheless, while model evaluation is our primary goal here, we may also derive substantive insights from GNN models. We briefly illustrate a direction for doing so. These examples are offered in a tentative and experimental way to indicate possible directions for pursuing further social research questions.
To do so, we may examine where the model’s predictions are most accurate, that is, variation in the error term. Here, we focus on Toronto for clarity – see Figure 5. What this map indicates is that ‘error’ is not always or necessarily synonymous with ‘bias’. In fact, the areas of Toronto where the errors are higher seem to be those areas that are undergoing rapid transformations, which are less predictable from their pasts. For example, M6S and M6R (which encompass neighbourhoods such as Parkdale, Roncesvalles, Bloor West Village, and Runnymede) have experienced significant increases in new venues such as restaurants, bars, and arts establishments. Similarly, M4M includes Leslieville, where film studios have concentrated and new cultural dimensions have grown up around them. Also, errors tend to be higher in the west-end region – see Figure S7 in the Supplementary Material. While these results are not definitive, they suggest that we can use GNN findings as a starting point for deeper investigations of where and why the future is less strictly resembling the past (Fox et al., 2022a, 2022b; Silver et al., 2022a, 2022b).
2
Prediction errors (RMSE) for each FSA in Toronto. Errors are presented in scenario ‘Area Info’. [Best in colour].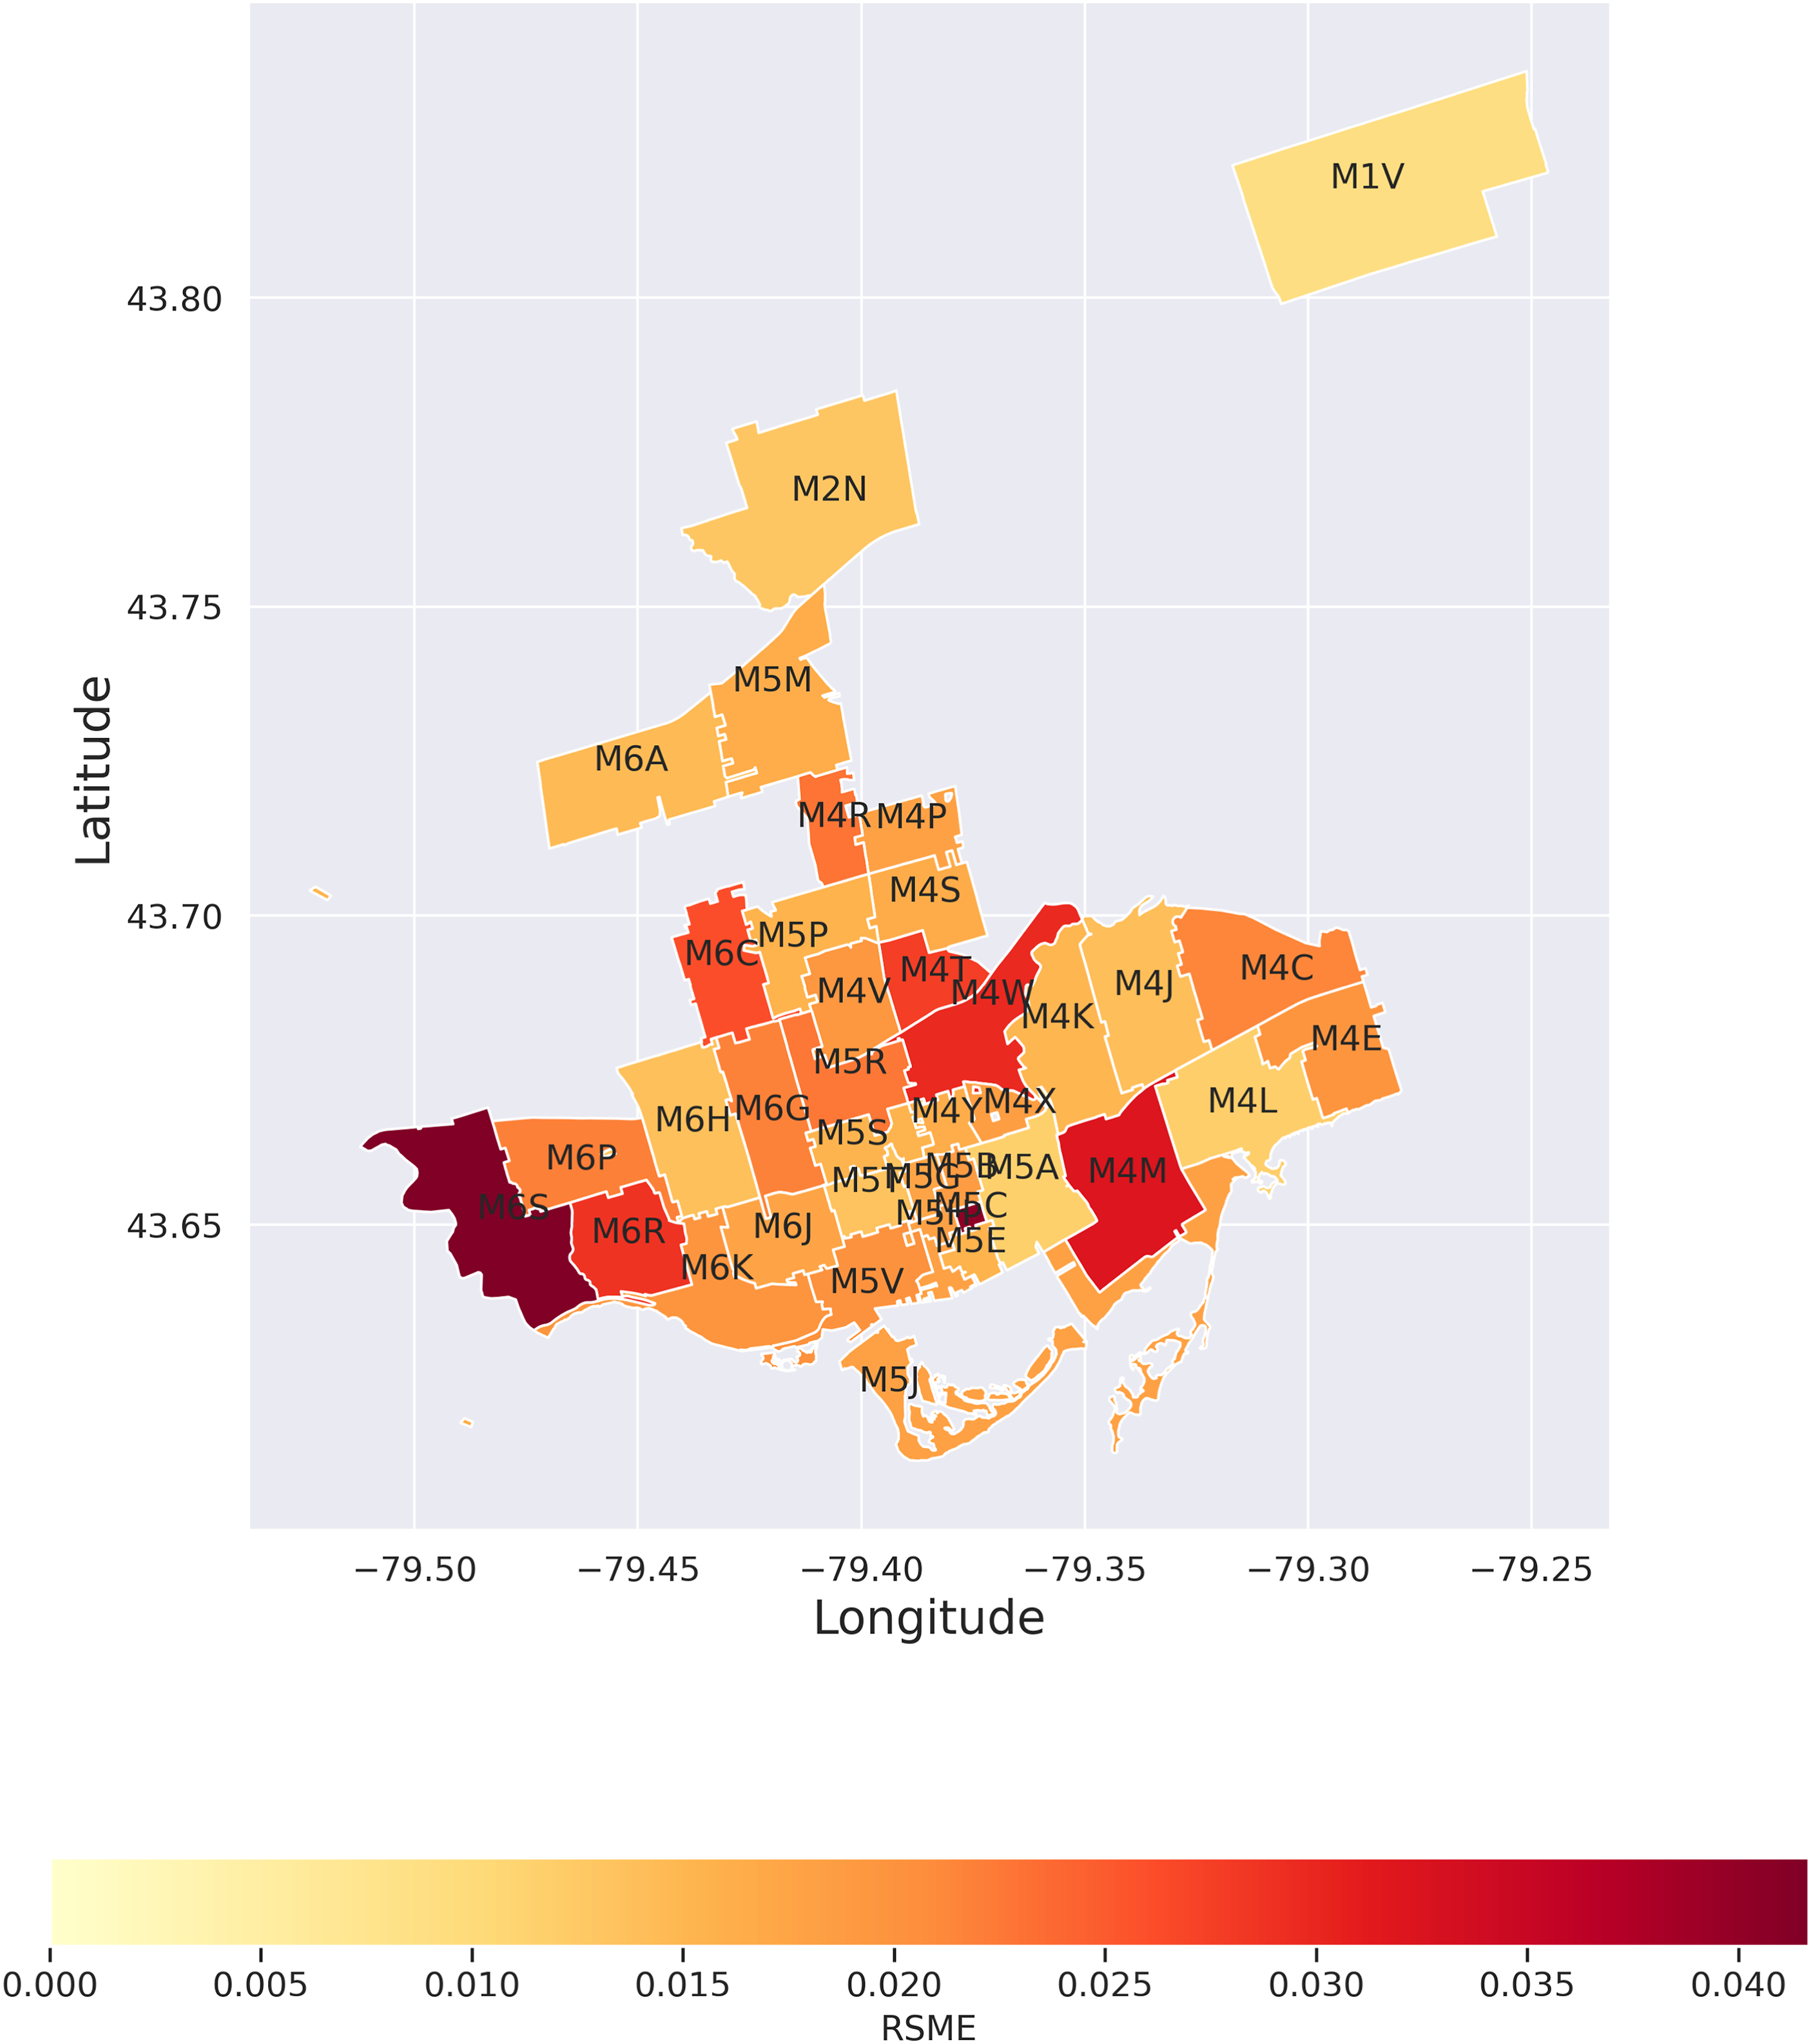
Discussion and conclusion
The primary contribution of this study is to demonstrate the potential of Graph Neural Networks for studying neighbourhoods in general and local culture in particular. Previous research has investigated features of neighbourhoods (such as socio-economic profiles), mobility graphs (often from Twitter and other location-based services), and the groups that move between them. Even in sophisticated prior efforts, these have rarely, if at all, been joined into a single model. The GNN approach we have proposed enables researchers to do so, in order to evaluate richer and more complex scenarios that would be hard (if possible at all) using other strategies.
Moreover, the experiments we conducted to test this method have substantive significance for urban and neighbourhood researchers. On the one hand, our findings indicate that, at least for predicting local cultural dimensions overall, traditional data sources such as national censuses remain critical. Socio-economic indicators from the census performed the best in all our experiments. On the other hand, our findings also suggest that researchers proceed with caution in treating mobility data alone as a strong predictor of neighbourhood cultural change. In our experiments, neighbourhood connectivity was the weakest predictor and, in some cases, not statistically distinguishable from the empty graph. In the middle are the taste profiles of groups who move among neighbourhoods.
Our findings suggest that certain groups of people could be a proxy for predicting urban cultural dimensions/scenes. While this should be taken with caution and further investigated, this result sheds light on avenues for exploring this type of feature in new ways. In situations where we do not have area attributes (our vertex features), we have the extra possibility of using group profiles to study neighbourhood change. For example, it provides a chance to observe changes occurring in the period between the US decennial census. At the same time, we found that for some cultural dimensions – such as those that feature personal self-expression – Yelp group profiles provide better predictions than census data. In such cases, we may perhaps gain greater insight and predictive power from the information in online review group profiles than from census socio-economic information. Nevertheless, for some dimensions – such as ethically oriented scenes – our results point toward opportunities for more refined data to improve model performance.
These findings open up opportunities for a number of future directions. For example, we may investigate whether certain groups (more than others) tend to produce outcomes, for instance, by causing a neighbourhood to take on cultural features that are conducive to their tastes, or sparking resistance (Silver and Silva, 2023). In addition, we can create richer group profiles from Yelp data, and other internet data sources. For instance, the characterization of group profiles could be enriched by integrating information from users’ reviews and more information about the venues they visit (such as price, ratings, ambiance, and the like). One could also create scene profiles for users, similar to scene profiles of areas. Other location-based social networks offer similar possibilities. In these and similar ways, a richer characterization of group profiles may match or surpass traditional area profiles from socio-economic data. We also can extend the analysis from single cities separately to sets of cities by combining them into a single graph. This would allow us to study the potential impact of inter-city and intra-city mobility graphs, as well as to pursue muti-level modelling frameworks. This would enhance the results we have presented regarding where the local cultural dimensions appear to be exhibiting the most or least variability. Finally, we could evaluate the creation of a single model to predict cultural dimensions for different cities in the same country instead of different models for that. This could be used for cities with fewer data. These are exciting possibilities that the GNN approach opens up.
Despite the strong potential of GNN’s for studying neighbourhood change revealed by this study, it is important to note some limitations. One of them is related to causal ordering. Based solely on our results, it is not possible to determine whether urban forms attract certain groups’ profiles and, consequently, their change attracts different groups, or the other way around: new groups enter areas that generate pressure to change urban forms. This is a classic ‘chicken and egg’ problem, and addressing it is not a trivial task; often, the answer is ‘both’ (Silver and Clark, 2016). Researchers have historically pursued various regression-based frameworks for handling it, but exploring new avenues in a GNN context could prove illuminating. This would enhance certain existing theoretical and methodological frameworks that involve more non-linearities and feedback processes, such as the one proposed by Silver and Silva (2023). Moreover, other strategies could be applied for identifying group profiles in addition to the one pursued here based on LDA. While any number of such strategies could be evaluated, our focus here is simply to demonstrate that one possible strategy to extract group profiles shows promise. Similarly, other cultural dimensions could be studied. Here, we featured the concept of scenes, but other representations could be considered with the necessary adaptations in the proposed framework. Also, while GNNs have great express power, they suffer from poor explainability, as other complex models.
While these are all exciting and promising directions, the present paper lays the ground to pursue them. We describe how to apply Graph Neural Network in predictive models of neighbourhood features in general and local cultural dimensions in particular, and demonstrate the potential of this approach. The technique shows considerable promise, both methodologically and substantively.
Supplemental Material
Supplemental Material - Using graph neural networks to predict local culture
Supplemental Material for Using graph neural networks to predict local culture by Thiago H Silvas and Daniel Silver in Environment and Planning B: Urban Analytics and City Science.
Footnotes
Declaration of conflicting interests
The authors declared no potential conflicts of interest with respect to the research, authorship, and/or publication of this article.
Funding
The author(s) disclosed receipt of the following financial support for the research, authorship, and/or publication of this article: This work was supported by the project SocialNet (Process, 2023/00148-0 from Sao Paulo Research Foundation - FAPESP), and National Council for Scientific and Technological - CNPq (grants 314603/2023-9 and 441444/2023-7).
Data availability statement
Supplemental Material
Supplemental material for this article is available online.
Notes
References
Supplementary Material
Please find the following supplemental material available below.
For Open Access articles published under a Creative Commons License, all supplemental material carries the same license as the article it is associated with.
For non-Open Access articles published, all supplemental material carries a non-exclusive license, and permission requests for re-use of supplemental material or any part of supplemental material shall be sent directly to the copyright owner as specified in the copyright notice associated with the article.