
Abstract
The use of land parcel data, 3D visualisation and urban theories offers a significant opportunity for advancing simulations of urban densification. This paper presents a 3D agent-based model (ABM) to explore future urban densification dynamics in Toronto based on stakeholder behaviour and interactions, the impact of zoning regulations, and profit expectations. The ABM establishes residents, developers, landowners, and the local zoning authority as primary actors involved in urban densification. This model replicates the Toronto urban development process through a structured framework of submodels which represent different stages of this process, based on the literature and gentrification theories. Three different scenarios are developed which show the city is projected to experience between 46 and 98 new developments by the year 2040. Average building height could increase by 17% to 56%, and the city could have 10,238 to 25,070 new units to meet future population demand. These simulations characterise Toronto’s future capacity for urban densification, realise the levels of densification required to meet Toronto’s growing population, and ultimately provide a more comprehensive understanding of the city’s future transformation.
Introduction
Background
Urbanisation is increasing worldwide. In 1950, 30% of the global population resided in cities, in 2018 this increased to 56%, and by 2050 this is projected to increase to 68% or 6.68 billion people (Kundu and Pandey, 2020). This rapid urbanisation has introduced many challenges unique to the urban environment, such as increased air pollution, water pollution, flood risk, and infrastructure demand (Johnson, 2001; Pitt, 2013). The United National Human Settlements Programme (UN-Habitat) has identified compact cities as an appropriate strategy to manage growing urban populations by focussing on planned city infill, redevelopment, and densification. Cities worldwide have forfeited agglomerations benefits and expanded into sprawled, congested, and segregated urban areas (UN-Habitat, 2017). Compact cities offer numerous benefits: decreased energy consumption and greenhouse gas emissions; protection of agricultural land to ensure food security; and reduced reliance on vehicles (Johnson, 2001; Pitt, 2013).
Currently, the most urbanised region in the world is North America with an urban population of 82% (Leeson, 2018). Toronto is one of the top three fastest growing central cities in North America (Clayton et al., 2021). Between 2006 and 2016, Toronto’s population grew by 9%, and by 2030 the population is projected to grow by an additional 13% (Clayton et al., 2021). The City of Toronto’s Official Plan identifies the need to offer a broader choice of housing and provide housing choices in mixed-use environments to create more opportunities for people to live and work locally (City of Toronto, 2022). This indicates that a suitable approach to accommodate growing populations is by providing a greater range and supply of housing opportunities.
However, Toronto’s Greenbelt covers more than 7300 km2 of land around the city which has limited its capability to expand outward (City of Toronto, 2022). The city needs to densify, reurbanise, and redevelop within the existing urban footprint to protect natural land within the Greenbelt. Like UN-Habitat (2017), the City of Toronto (2022) also identifies specific agglomeration benefits of densification within Toronto, such as enhanced community-based services, parks, and infrastructure which will promote walking and cycling, contributing to healthier communities. Increased density would also make land more valuable and provision more affordable housing as more development could occur on the same parcel of land (Nzau and Trillo, 2019). Prioritising densification to create a more compact housing supply and can thus be invaluable for Toronto to remain liveable. Toronto’s planning process has a large impact on the city’s densification feasibility and its capacity to reurbanise and redevelop within the existing urban environment.
Toronto employs a discretionary planning process for new developments. Zoning By-law 569-2013 is a city-wide regulation which governs land and building use. It establishes precise building standards, such as lot area and frontage; building setback, units, and height; and floor space index (FSI) and floor area ratios (FARs). To construct buildings which are outside of regulations, it is necessary to submit a Zoning By-law Amendment application. The City of Toronto circulates the application to all relevant divisions, agencies, boards, and commissions for a review. There is a community consultation meeting, revisions, and a public meeting at a Community Council. Following the public meeting, the Community Council then makes a recommendation to the City Council who decides whether to authorise the Zoning By-law Amendment to enable the building to be constructed (City of Toronto, 2024).
Theories of gentrification
The benefits of employing gentrification, densification, and redevelopment strategies have been clearly demonstrated. It is important to understand the two competing gentrification theories: the supply side and demand side theories. Both perspectives contribute to the model design in this paper and are outlined below.
The supply side theory argues that the real estate market and capital investment drive gentrification. Smith (1979) and Hamnett and Randolph (1984) developed the rent gap and value gap theories, respectively, which both explain how gentrification is production led. The rent gap theory is where there is a disparity between the property’s current rental income and the potential rental income if it were renovated. This creates an incentive for developers to buy, renovate, and re-let properties at higher rents, leading to gentrification (Smith, 1979). The value gap is a disparity between the market value of the property and its tenanted investment value. This gap arises mainly due to housing policies which suppress rent levels. Owners will sell their property which will trigger redevelopment and subsequent gentrification (Hamnett and Randolph, 1984). Supply-side actors include landowners, developers, and local or national authorities (Blasius et al., 2016).
The demand-side theory of gentrification focusses on the preferences of the individuals moving into gentrifying areas (Ley, 1986). The gentrifiers come from high socio-demographic profiles, defined by their income and professions. They are attracted to under-valued neighbourhoods due to city centre proximity, commuting convenience, and inexpensive housing. As more gentrifiers move to the area, it experiences transformation and ultimately gentrification due to the new demand for housing. This theory emphasises the role of individual choices in the gentrification process, contributing to changes in the social composition and character of an urban neighbourhood (Blasius et al., 2016).
Current state-of-the art
Many spatial models of urban densification and growth have been developed because they provide insights into future urban transformations. Typically, these models use bottom-up methods which focus on simulating urban dynamics and evolution from local rule-based interactions, neighbourhood effects, and emergent behaviours (Li et al., 2014). This is a useful approach to simulate micro-scale patterns, especially considering the theories of urbanisation and the Toronto development process. Two of the most popular computational bottom-up approaches to simulating urban expansion and densification are Cellular Automata (CA) and ABMs.
CA is widely used due to its versatility and intuitiveness in capturing complex spatial and temporal systems through a set of rules (Chakraborty et al., 2022). Tong and Feng (2020) developed a CA modelling framework with improved relationships among CA components and incorporated a variety of statistical and heuristic methods to construct transition rules. The model was applied to Shanghai, China, to simulate past urban patterns and predict future scenarios. By integrating patch-based and landscape-driven CA, Lin et al. (2023) developed a high-performance CA model that considered landscape similarity and cell-by-cell agreement for Guangzhou, China.
CA is also easily coupled with other techniques such as Markov chain, logistic regression, artificial neural networks (ANNs), and random forests. Fu et al. (2022) analysed land-use pattern changes in Mianzhu, China, between 2008 and 2026 using a CA–Markov model which indicated lower fragmentation, higher agglomeration, and great diversity of future land use. Mustafa et al. (2018) combined CA and logistic regression to simulate both raster-based urban expansion and densification in Belgium. The model showed probability for development based on driving factors, such as distance to roads and land use of neighbouring cells. Zhou et al. (2020) used CA–Markov and random forests to explore urban growth using driving factors such as GDP and proximity to subway stations in Shanghai from 2015 to 2030 under two scenarios: unconstrained development and development with planning intervention. Gharaibeh et al. (2020) enhanced land-use change simulation models by integrating CA–Markov with ANN for Irbid, Jordan. The model incorporated socio-economic, spatial, and environmental variables to improve its predictive capability. The research identified several key driving factors of land-use change, including slope, distance to roads, distance to urban centres, distance to commercial areas, and elevation. El Hajjar et al. (2023) developed another raster-based CA with long short-term memory to simulate urban densification using demography, roads, and distance to cities data. Wang et al. (2019) used an ANN to simulate urban densification in Wisconsin. The model effectively simulated urban densification patterns, enabling the prediction of future densification, and considered various urban density driving factors such as distance to open space, distance to existing urban, distance to road, elevation, and slope.
However, CA can be enhanced by coupling with ABMs to capture human decision-making and enhance modelling flexibility (Kumar et al., 2021). ABMs provide a conceptual and theoretical framework to simulate spatially dynamic processes through self-activities and interactions between various rule-based agents that can assume unlimited roles (Xu et al., 2020). Dahal and Chow (2014) developed a vector CA–ABM of urban land-use dynamics on irregular land parcels in Texas. It combined micro-level decision-making capabilities of the ABM with the spatial dynamic representation of CA. The study found that incorporating diverse agents (city planners, developers, households, retailers, and industrialists) and using social theories resulted in a better performing model than conventional urban growth models. Mustafa et al. (2017) also used a CA–ABM approach to incorporate human behaviour variability, a feature overlooked in traditional approaches, to model urban expansion in Belgium. The model defined three agents: developers, farmers, and planning permission authorities and used GA and logistic regression to efficiently calibrate the model to a high accuracy against historic data. Mozaffaree Pour and Oja (2021) developed a vector CA–ABM using cellular agents of urban expansion dynamics in Tallinn, Estonia. The model used irregular and regular cells to provide a realistic representation of urban expansion, enhance the model’s capability to capture geometric details of urban expansion more effectively, and acknowledge imbalanced development of an urban environment.
Knowledge gap
Whilst a hybrid CA–ABM model is an advantageous approach to take, these methodologies share limitations and have scope for further development. Most models adopt raster-based representations of urban areas as their spatial unit which causes uncertainty due to cell sizes and limits model robustness (Chakraborty et al., 2022). It would be beneficial to use vector land parcel data as these are building blocks of urban planning, and their irregular nature better represents the reality of urban development and ensures greater applicability in real urban settings (Chakraborty et al., 2022). The literature reviewed also had a strong focus on developing models solely in 2D, despite cities being inherently three-dimensional (Zhang et al., 2023). Few attempts have been made to study the growth of cities in 3D which consider the multidimensional aspects of urban development such as densification, infill, and vertical growth via ABMS and CA (Liu et al., 2019). 3D visualisation implementation is beneficial to improve understanding and interpretations into how vertical height limitations can impact densification feasibility (Agius et al., 2018). Land parcel data and 3D visualisation will also provide a more engaging and accessible format for non-geospatial experts, such as citizens and city divisions and agencies to understand future implications from the model, especially in the age of digital twins (Batty, 2018). In addition, the drivers and theories of densification and the role they play and where are not fully understood. Incorporating supply and demand side theories from gentrification and applying it to a densification model can enable a greater understanding of this phenomenon.
Paper aim
The ABM proposed here advances current urban densification models by implementing land parcel data, 3D visualisation, and stakeholder representation. The model also features a robust calibration and validation procedure using geographically weighted regression (GWR) and genetic algorithms (GAs) to ensure a highly accurate model. The goal of this paper is to develop an ABM which will integrate the real estate market, planning regulations, and stakeholder interactions into a simulation environment and explore how this influences densification in Toronto.
Methodology
Study area selection
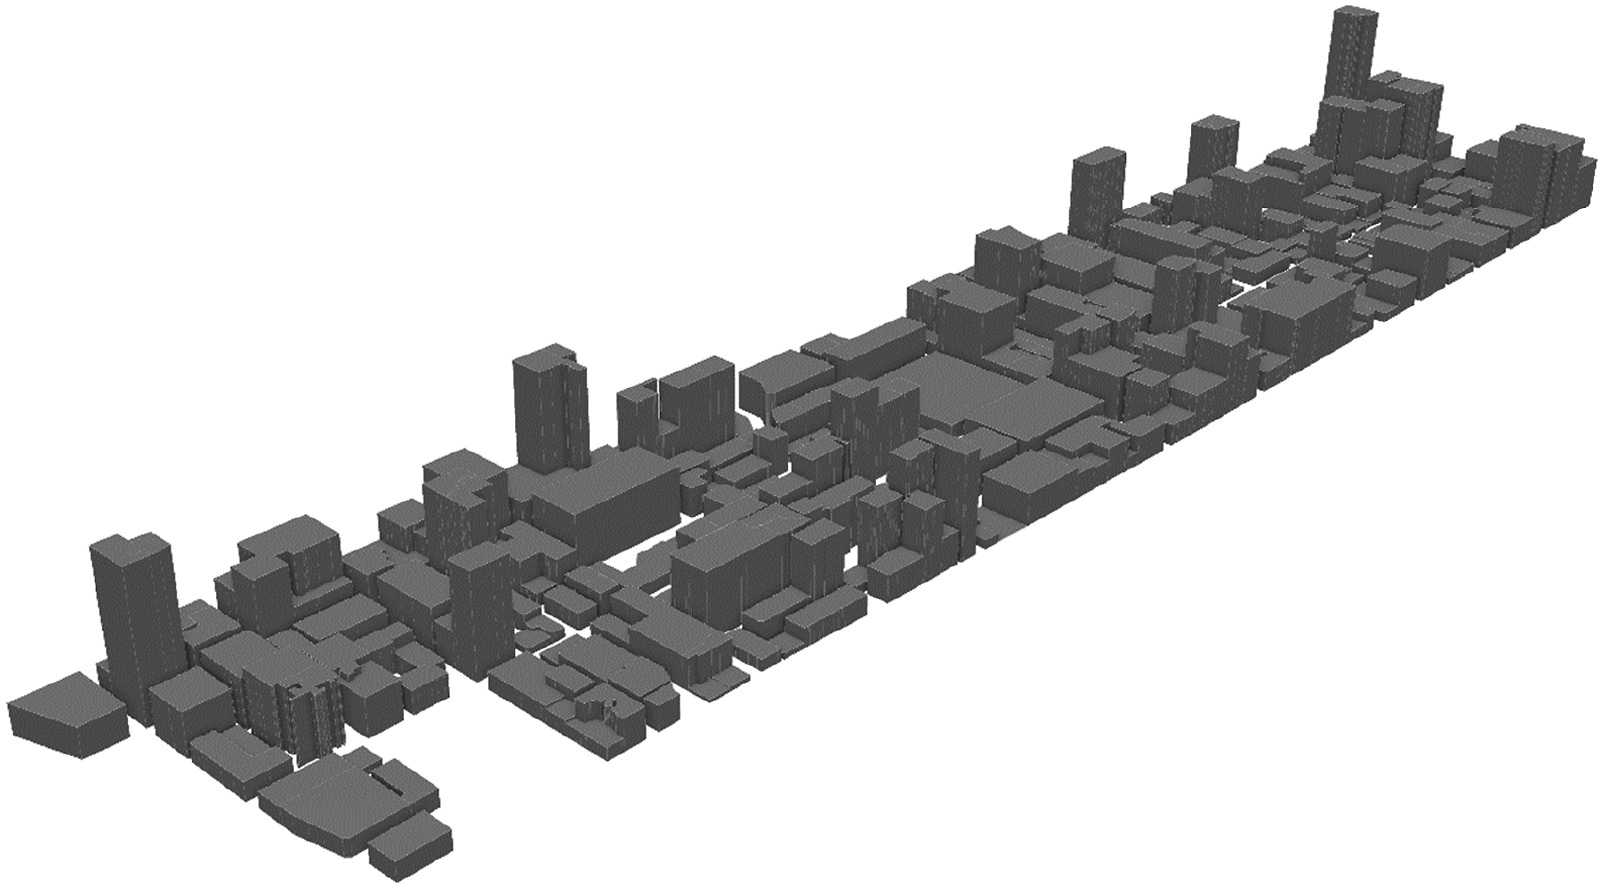
Toronto’s Church-Yonge neighbourhood (Figures 1 and 2) was selected as the study area because of its high population, development activity, and construction. Between 2006 and 2021, the population increased by 66% (24,000 to 40,000 people) and is now very densely populated with approximately 29,000 people per square kilometre (Statistics Canada, 2021). Between 2008 and 2023, Church-Yonge had the highest density of development applications (1165) of all neighbourhoods (Figure 1) (City Planning, 2023b). Between 2014 and 2022, Church-Yonge had 36 new developments and the total building height increased by 57% from 10,325 to 16,200 m (City Planning, 2023a). In addition, the neighbourhood is a good location for this ABM due to its zoning context. Zoning by-law 569-2013 specifies that permitted building types in Church-Yonge are only residential or commercial-residential and only specifies building height zoning regulations (City Planning, 2023c). Church-Yonge Corridor in Toronto with development applications (active and inactive zoning by-law amendment applications) between 2008 and 2023. 3D rendering of Church-Yonge Corridor showing building heights in 2022.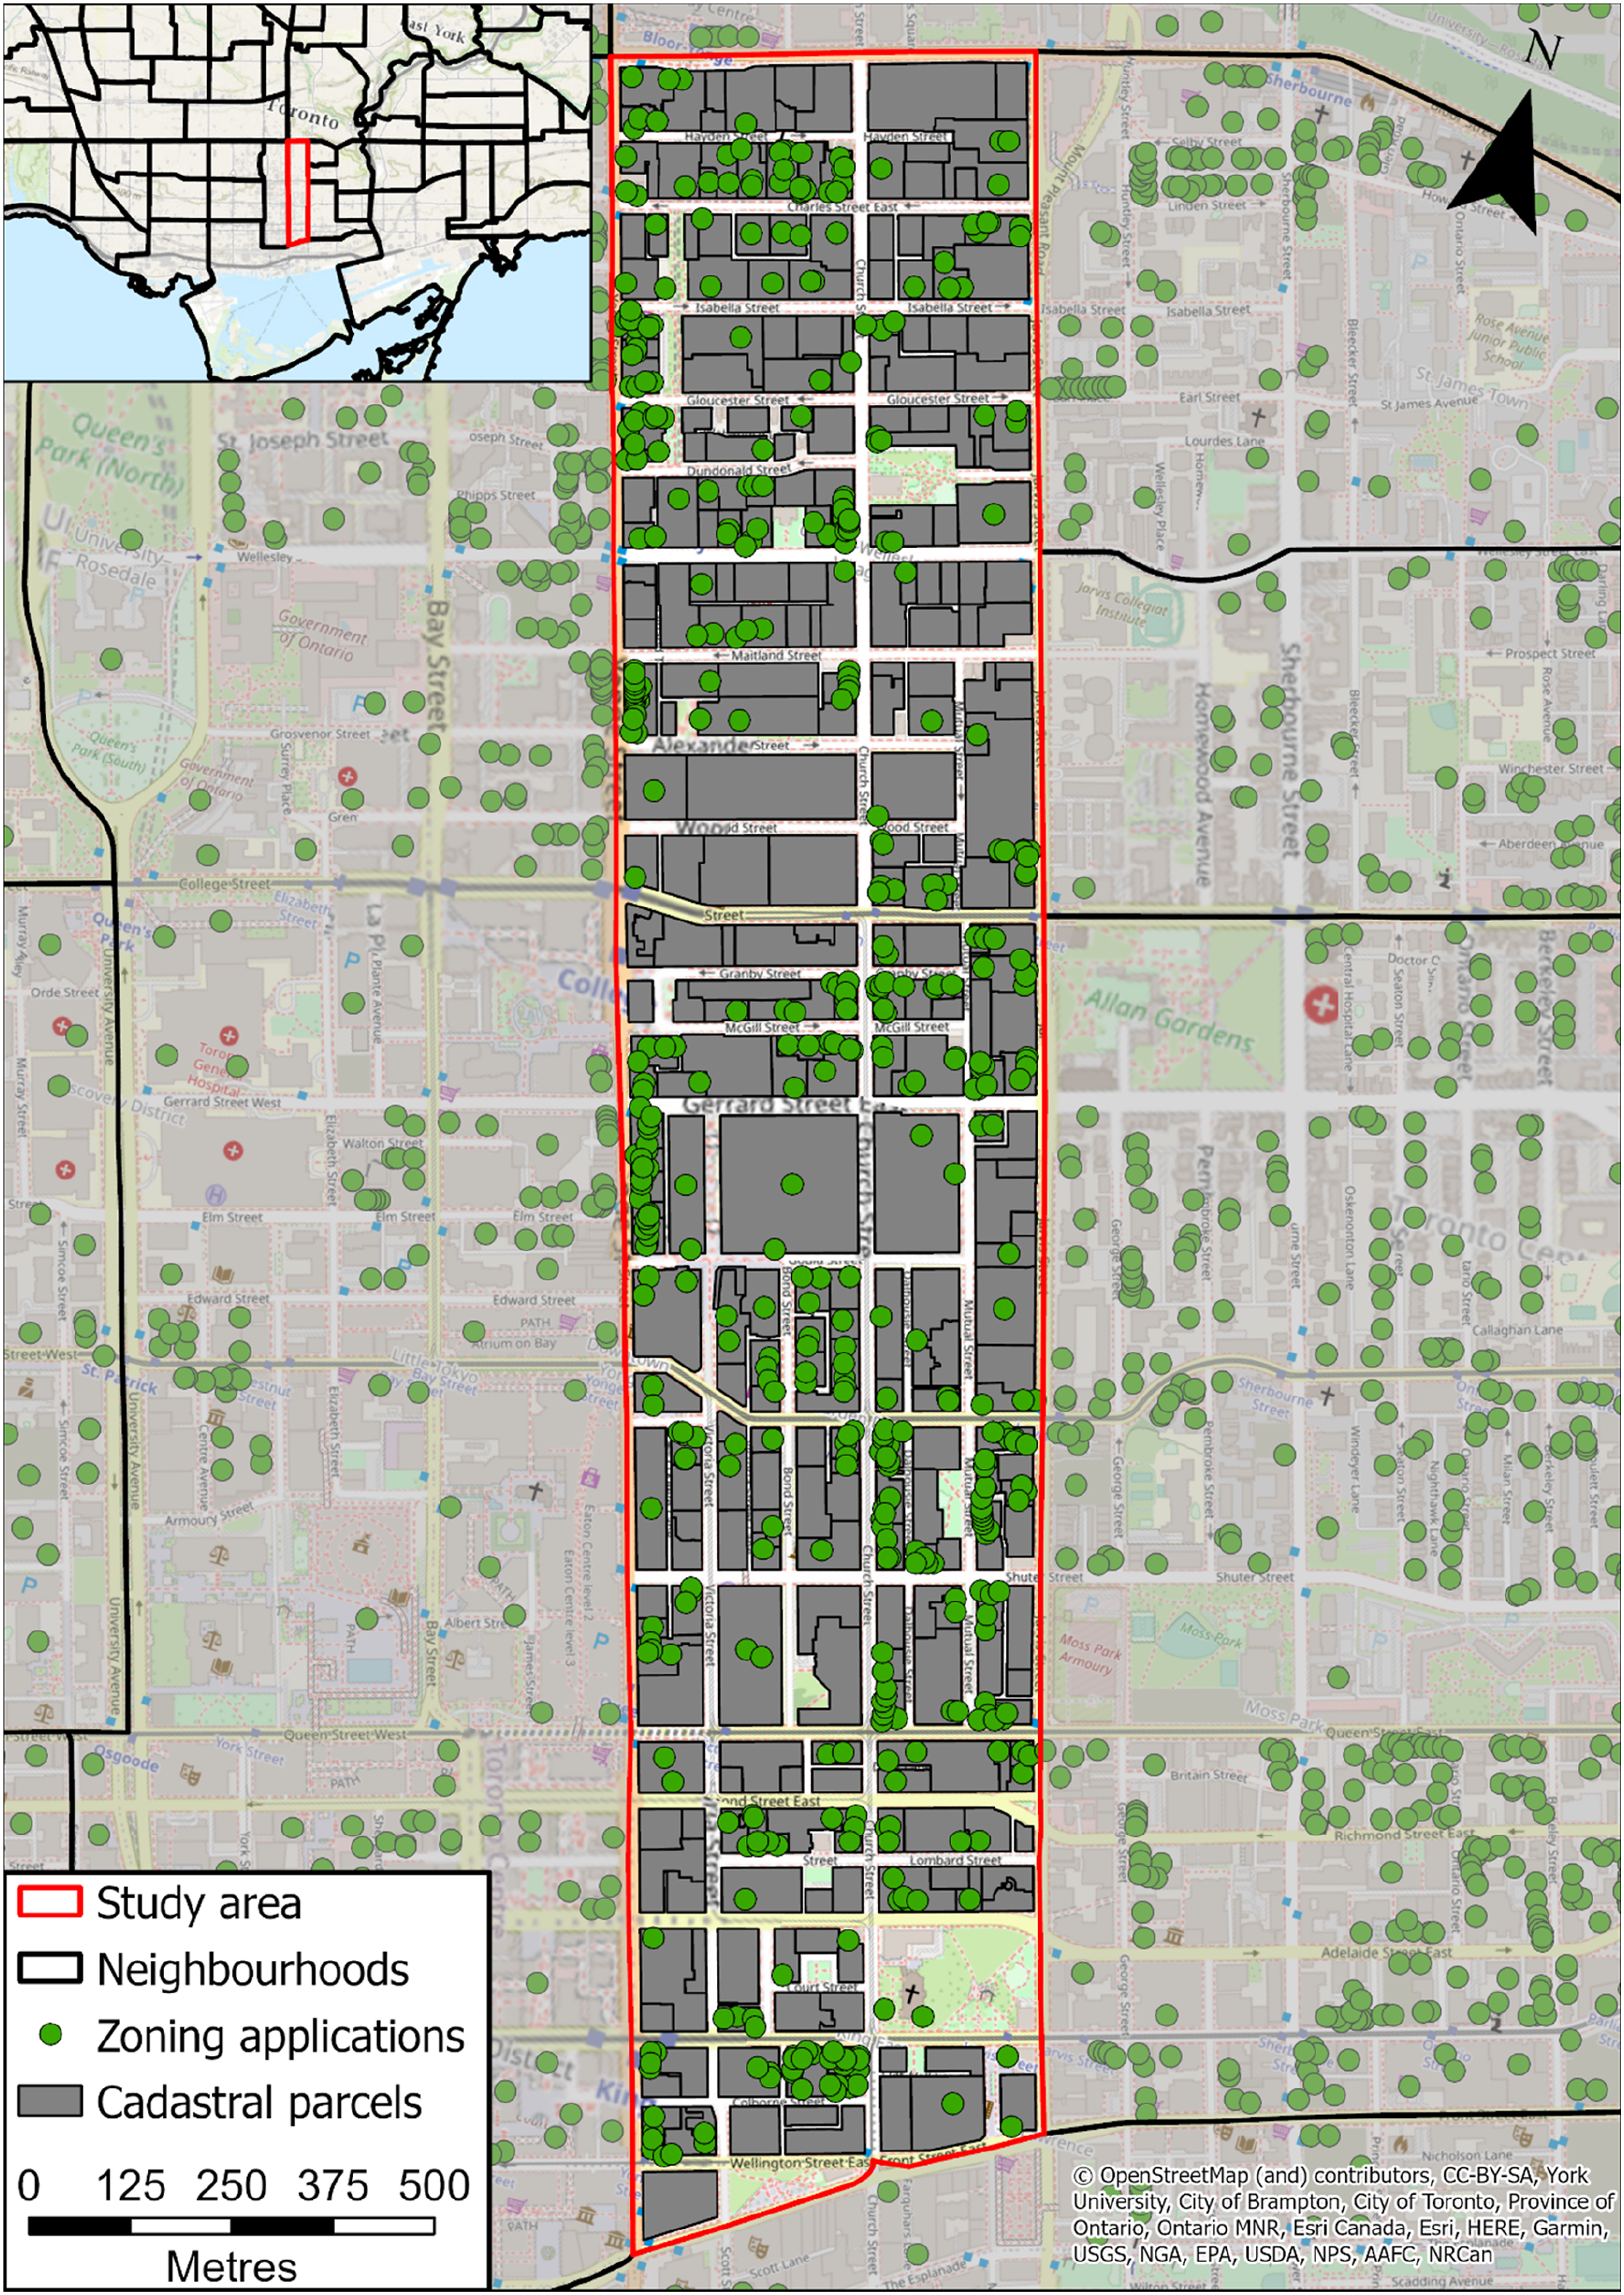
Model design
The ABM was developed using the GAMA platform as it uses a straightforward agent-orientated modelling language (GAML), has an intuitive graphical user interface designed for 3D visualisation, and is powerful software with strong geospatial data support (Talliander et al., 2019). Figure 3 displays the ABM structure, with its four submodels and their processes. The model structure, assumptions, and design are based on the reviewed literature, Toronto planning process and gentrification theories are described in the introduction. A full description and explanation of each submodel, model parameters, and agent driving factors is provided in Supplemental Material I. Overview of the ABM design showing the submodel structure.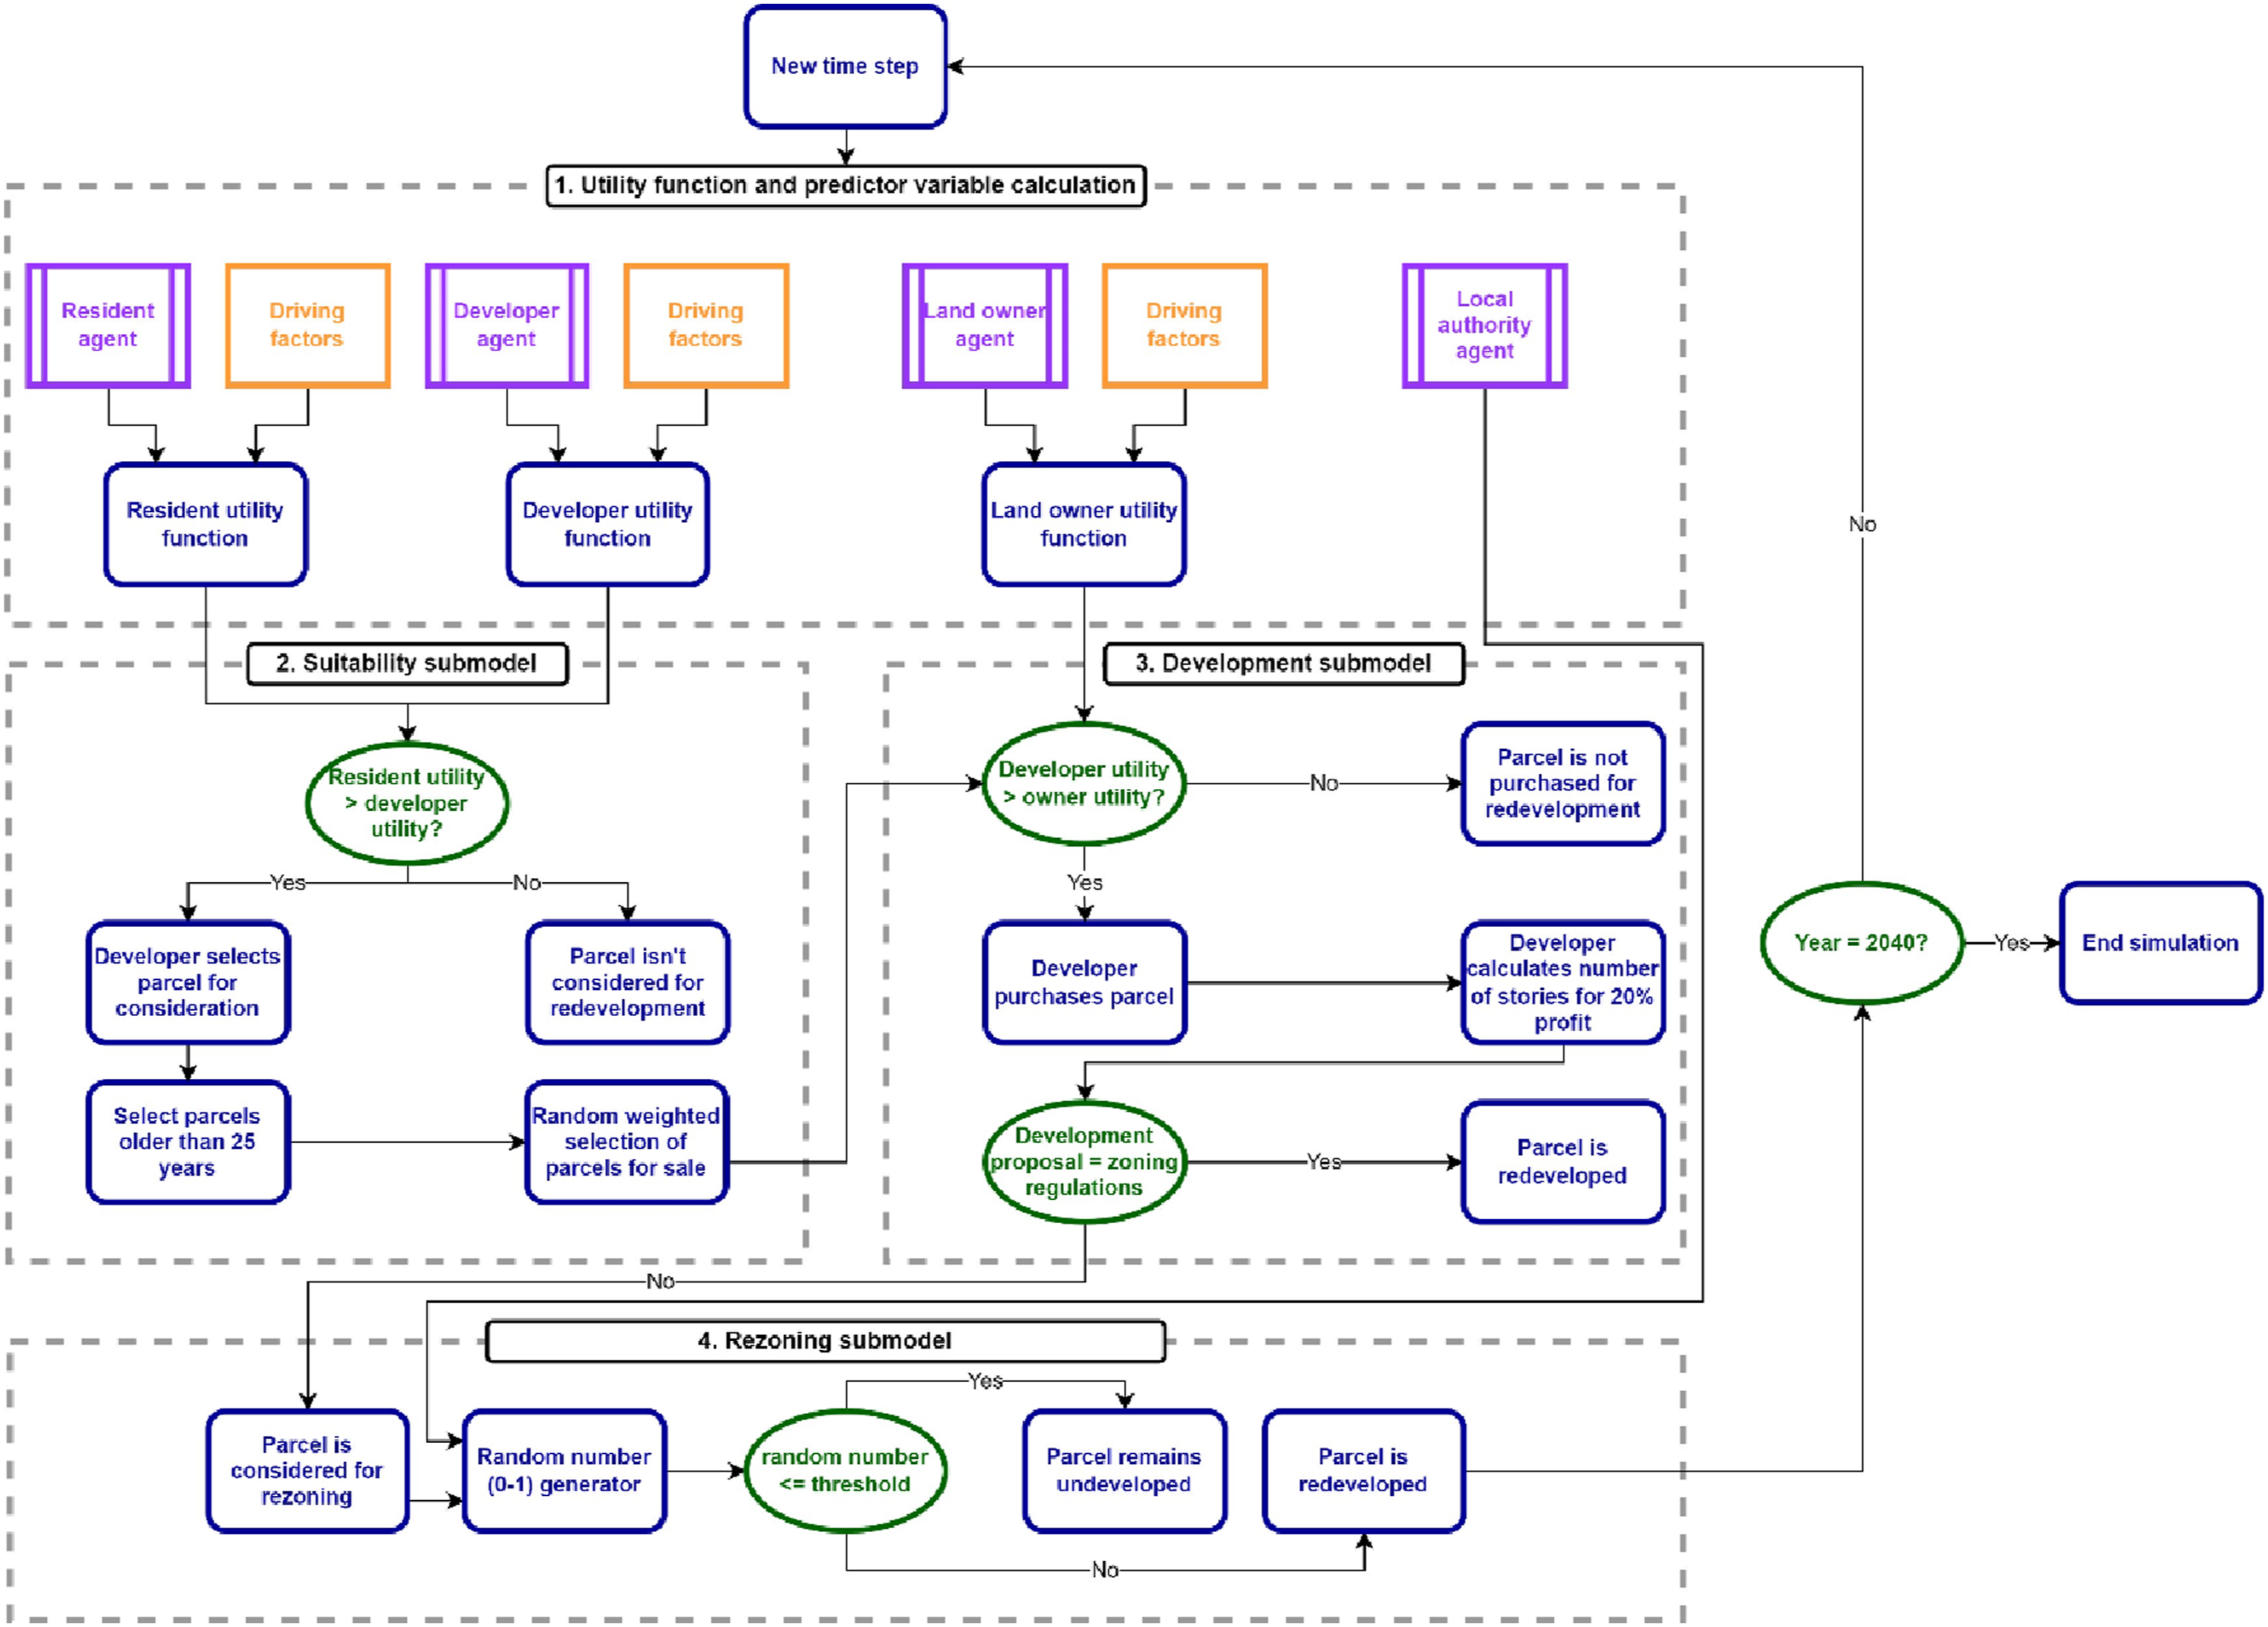
Model timestep dynamics
The ABM runs to 2040. Parcels which are accepted in the development submodel will take 1 year to demolish, whereas rezoning parcels will take 2 years to be demolished to reflect time taken to get the proposal through the planning process. Once demolished, each parcel is randomly assigned a construction rate of 25%, 50%, or 100% to reflect that redevelopment projects are constructed at different timescales. Once the final submodel finishes, the ABM starts a new simulation cycle at submodel 1.
Weighting, calibration, and validation
ABM accuracy is typically evaluated using the kappa coefficient that measures the agreement of simulated versus observed results (Liu et al., 2020). However, this accuracy method tends to result in low values if there is little urban change (Tang and Yang, 2020). Three accuracy indicators were designed to appropriately calibrate and validate this model: 1. Distance from simulated densification to nearest observed densification. 2. Quantity of simulated densification versus quantity of observed urban densification. 3. Overall height of simulated urban densification versus overall height of observed urban densification.
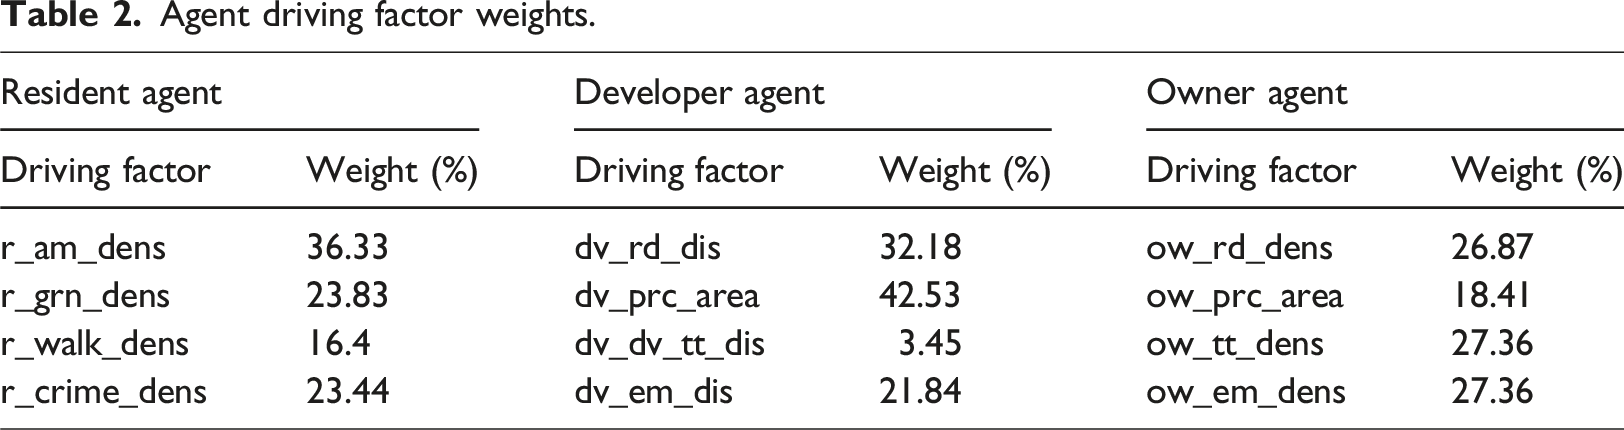
Figure 4 shows an overview of how these scores and driving factor weights were determined. GWR was used to determine the weights for the driving factors of the resident, developer, and landowner agents in Table S1 which impact the distance accuracy score. GWR extends traditional regression and captures spatial variation by allowing the model’s coefficients to vary across various locations. It fits a separate regression equation at each location and generates local coefficients which provide insights into how the predictor variables influence varies geographically (Brunsdon et al., 1996). Flowchart summarising driving factor weighting and calibration and validation procedure.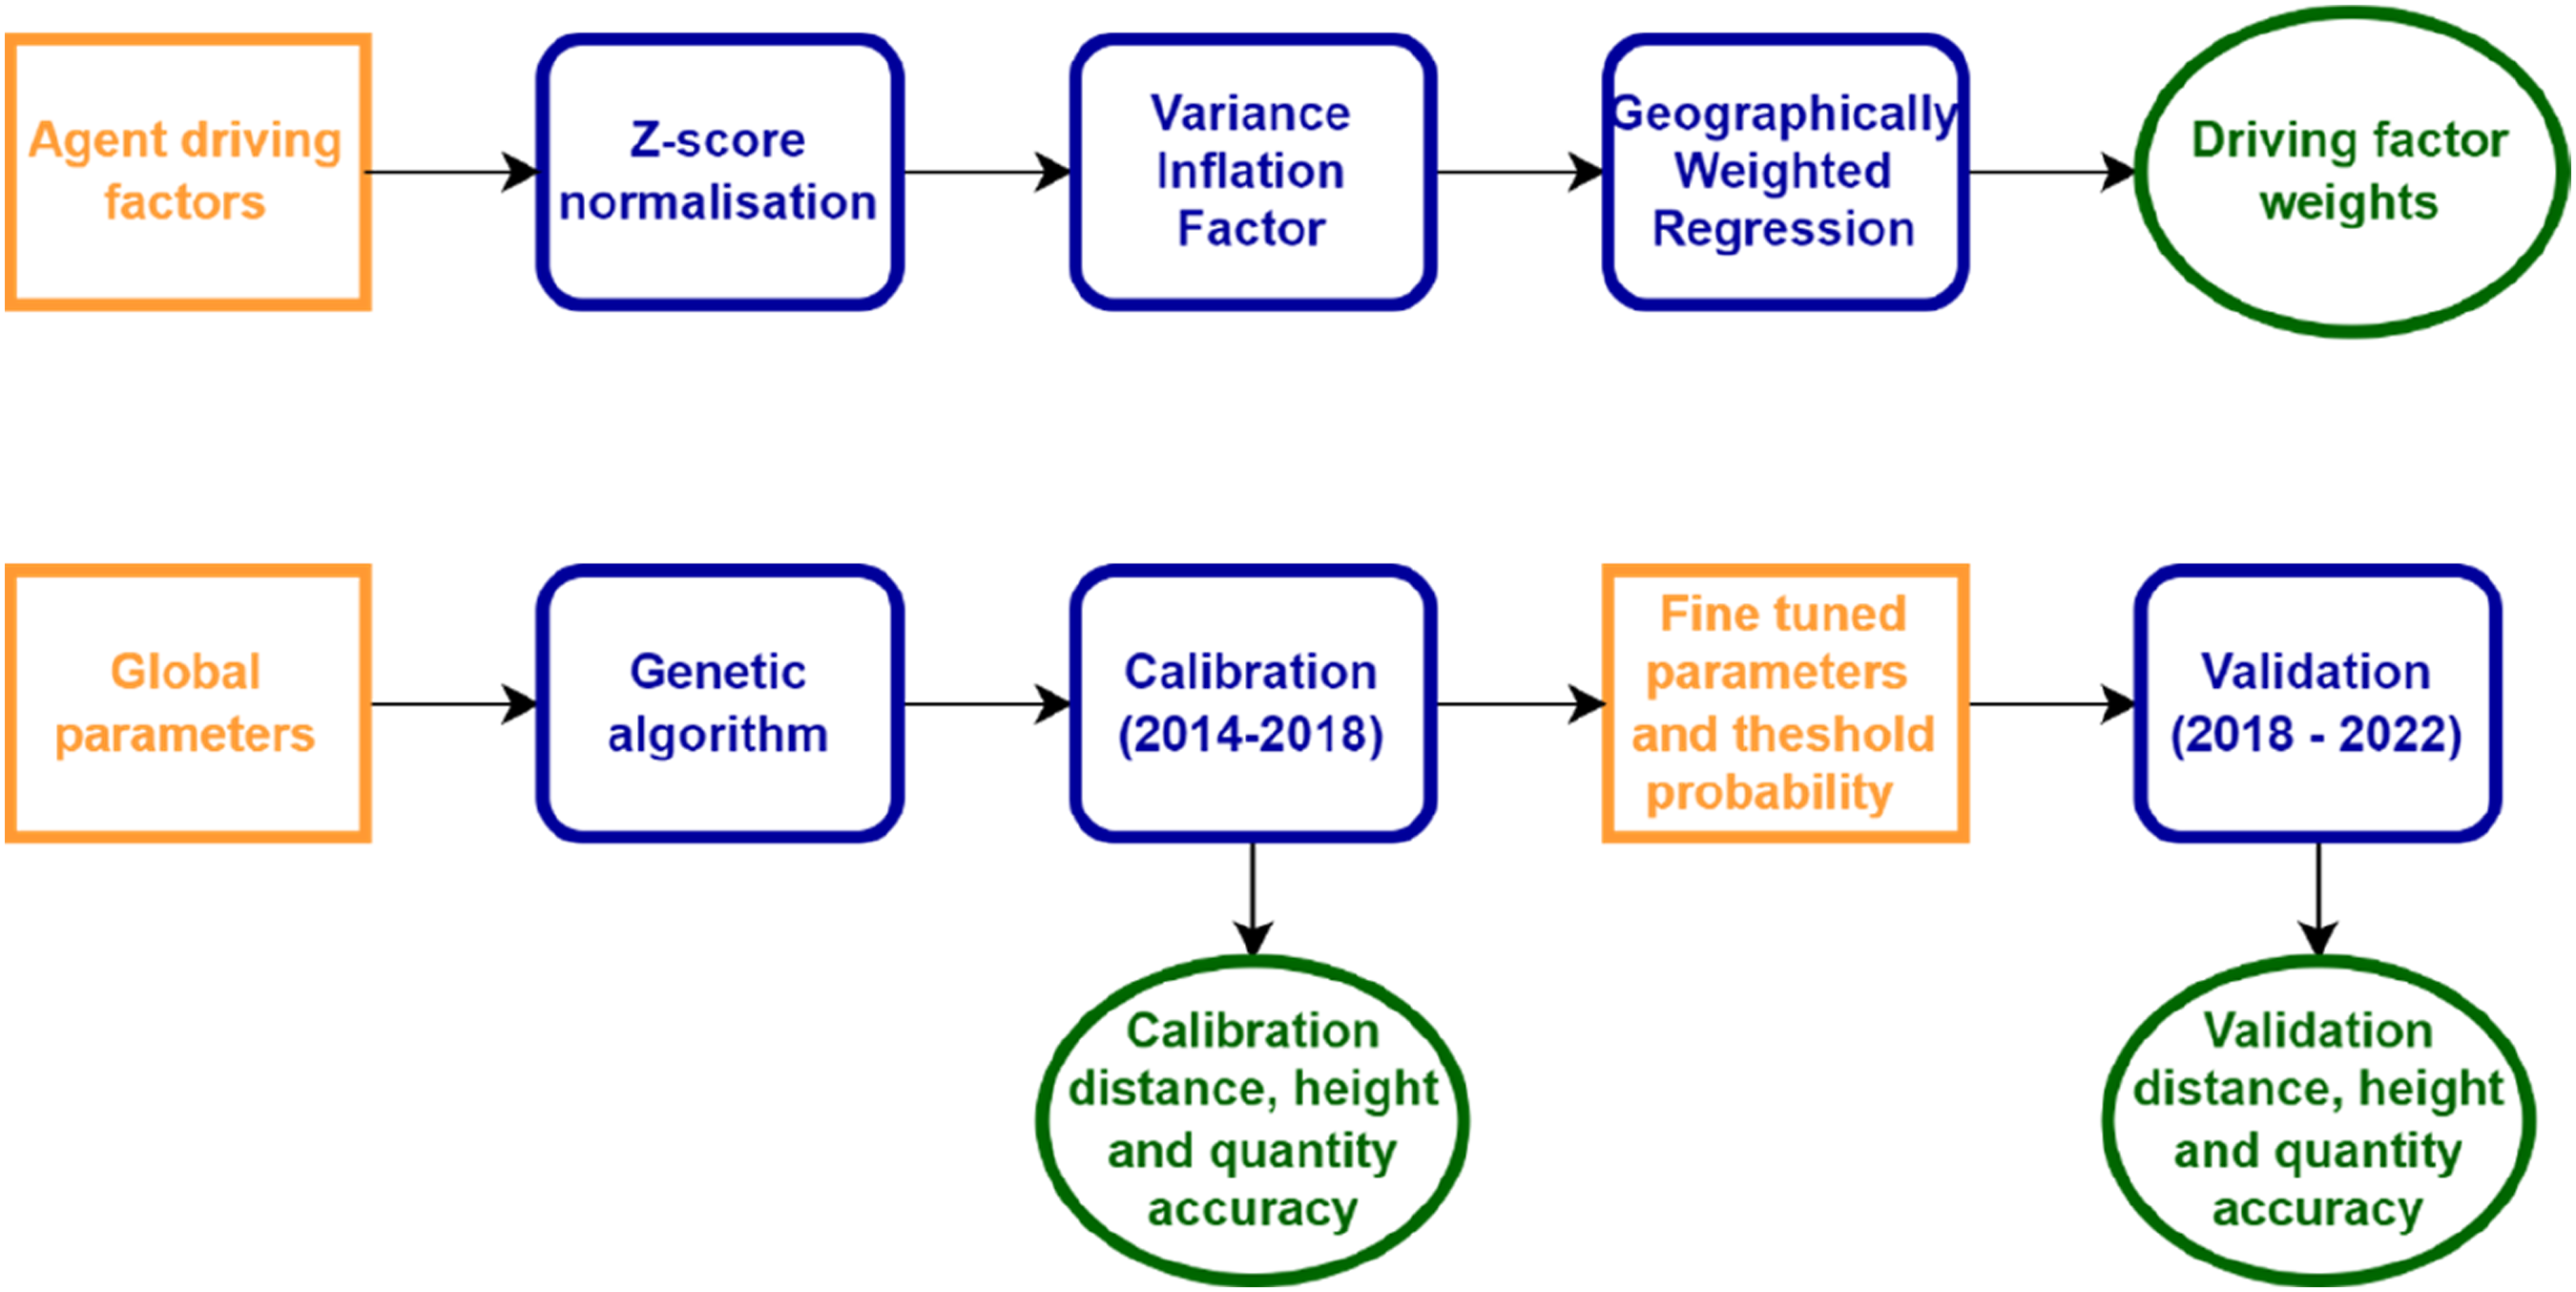
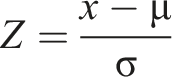
A total of 1000 random parcels which had densification and another 1000 random parcels which had no densification between 2014 and 2022 were selected across the City of Toronto. Driving factor values (Table S1) were extracted for these 2000 randomly selected parcels. These sampled driving factors were standardised using Z-score normalisation, where Z is the standardised value,
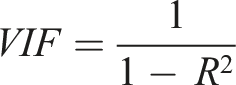
The variance inflation factor (VIF) was used to detect multicollinearity – a high degree of correlation between driving factors (Montgomery and Runger, 2010). The VIF produces a value for each driving factor that measures how much the variance of an estimated regression coefficient is increased because of multicollinearity by regressing each driving factor on all others (Montgomery and Runger, 2010). Where
Once any multicollinearity had been identified, the GWR model produced coefficients from the sampled data which indicated the strength of the relationship between the driving factors and urban densification. These coefficients were scaled, so they summed to 1 for each agent and acted as weights for the agent’s driving factors in the ABM. Mustafa et al. (2017) used a similar approach where independent variable coefficients from a logistic regression model were interpreted as driving factor weights. GWR was used because of the model’s bottom-up structure, and local statistical methods are better suited to modelling non-stationary processes. GWR is a more nuanced approach than logistic regression which can capture local spatial patterns and offer a better fit to spatial data (Brunsdon et al., 1996).
The ABM’s global parameters (Table S1) were calibrated and validated by running the model from 2014 to 2022 to optimise the quantity and height accuracy indicators (Figure 4). This historic period was divided into calibration (2014–2018) and validation (2018–2022) to ensure the ABM was not overfit across the whole period (Tang and Yang, 2020). Calibration is the training phase where the parameter values were optimised, and validation tested these optimised values on an unseen period. ABM calibration used the GA to fine tune the global parameter values to produce the highest quantity and height accuracy score possible. The GA is an evolutionary approach to find the optimal solution to a search problem based on natural selection. It iterates over an initial population of solutions and applies evolution operators (selection, crossover, and mutation) at each iteration until it determines the optimal solution using a fitness function (Garcia et al., 2013).
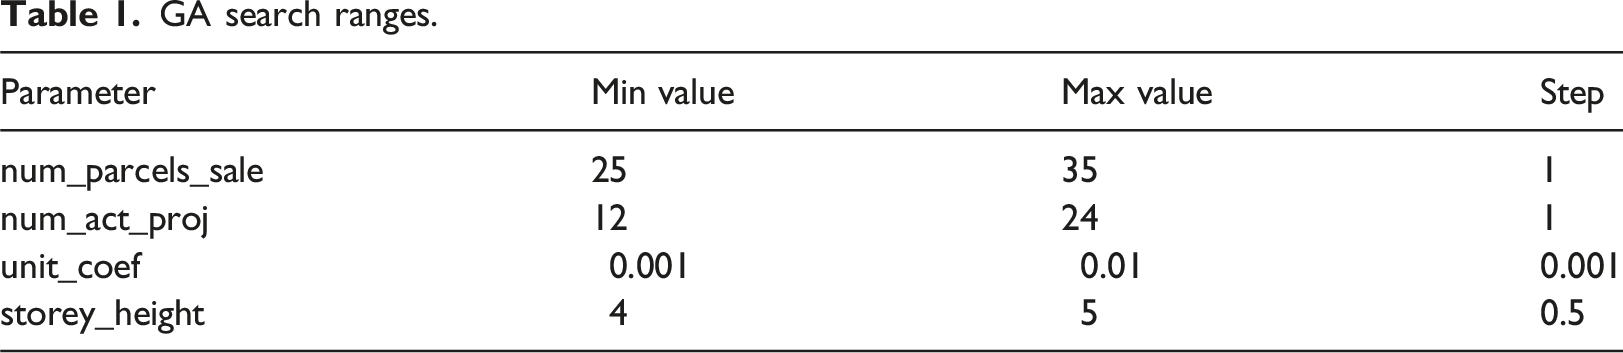
Due to the model’s stochastic nature, the model was run 500 times to determine how many runs were needed till the model stabilised. Three statistical indicators (student’s t test, standard error, and the coefficient of variation) were used to measure when the model stabilised by selecting the maximum number of iterations out of these three statistical tests. The following steps were conducted during calibration: 1. GA explored the parameter combinations in Table 1 and determined the top 5 parameter combinations which resulted in the highest combined quantity and height accuracy scores. 2. These top five parameter combinations were run for the required number of times until the scores stabilised and the best performing average was selected. 3. The optimal parameter values with the best performing average were then run until stabilised again to get the probability of a parcel being densified. 4. A threshold probability (e.g. parcels selected over 25% of the time) was set to produce a binary output of parcels which densified and maximise the accuracy scores. GA search ranges.
The validation was then performed using the defined parameter values and threshold value to examine the consistency and performance of the accuracy score held up on unseen data.
Scenario development
Three scenarios were developed to reflect varying future pathways for Toronto, informed by the Official Plan (City of Toronto, 2022): • Business as usual (BAU) scenario – a 2040 projection based on the most accurate model parameter values. • Recession scenario – more sceptical with overall less economic activity, poor investment, and fewer land transactions occurring. The number of parcels for sale and the number of active development projects cut in half from the BAU scenario (Table S1) and a reversed rejection rate of 95% if developments were outside of zoning regulations. • Gentrification scenario – developers purposely target areas that need revitalisation. The interaction between developers and residents in submodel 1 (Figure 3) was reversed so developers will only select a parcel if the resident’s utility is lower. All global model parameters kept the same as BAU.
Results
Accuracy results
Agent driving factor weights.
Following the stochastic analysis, the number of required model runs was 30. The global variable values which resulted in the best calibration score were as follows: • Parcels for sale – 28. • Active development projects – 19. • Unit coefficient – 0.002. • Storey height – 4 m.
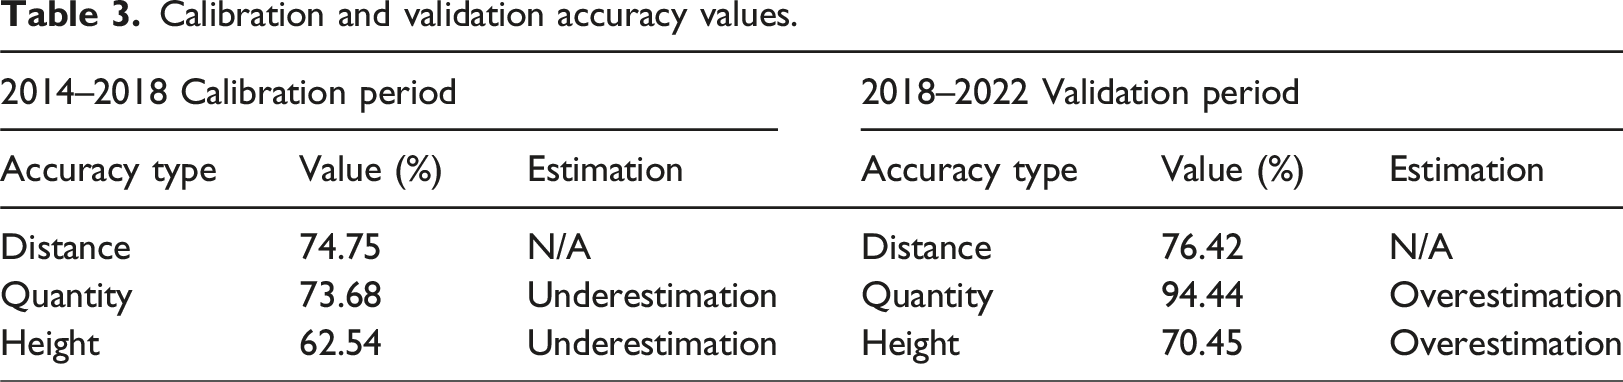
Calibration and validation accuracy values.
Scenario outputs
The BAU scenario results in 98 new developments and 25,070 new units being constructed by 2040. The average height increases by 56% between 2022 and 2040 (48 m to 75 m) with the tallest building being 528 m compared to 257 m in 2022. Figure 5 shows that densification is focussed on the southern end of the neighbourhood where the skyline increases the most. Whilst development does occur at the northern end of the Church-Yonge Corridor, the building heights do not change massively compared to the 2022 skyline (Figure 2). 2040 BAU scenario.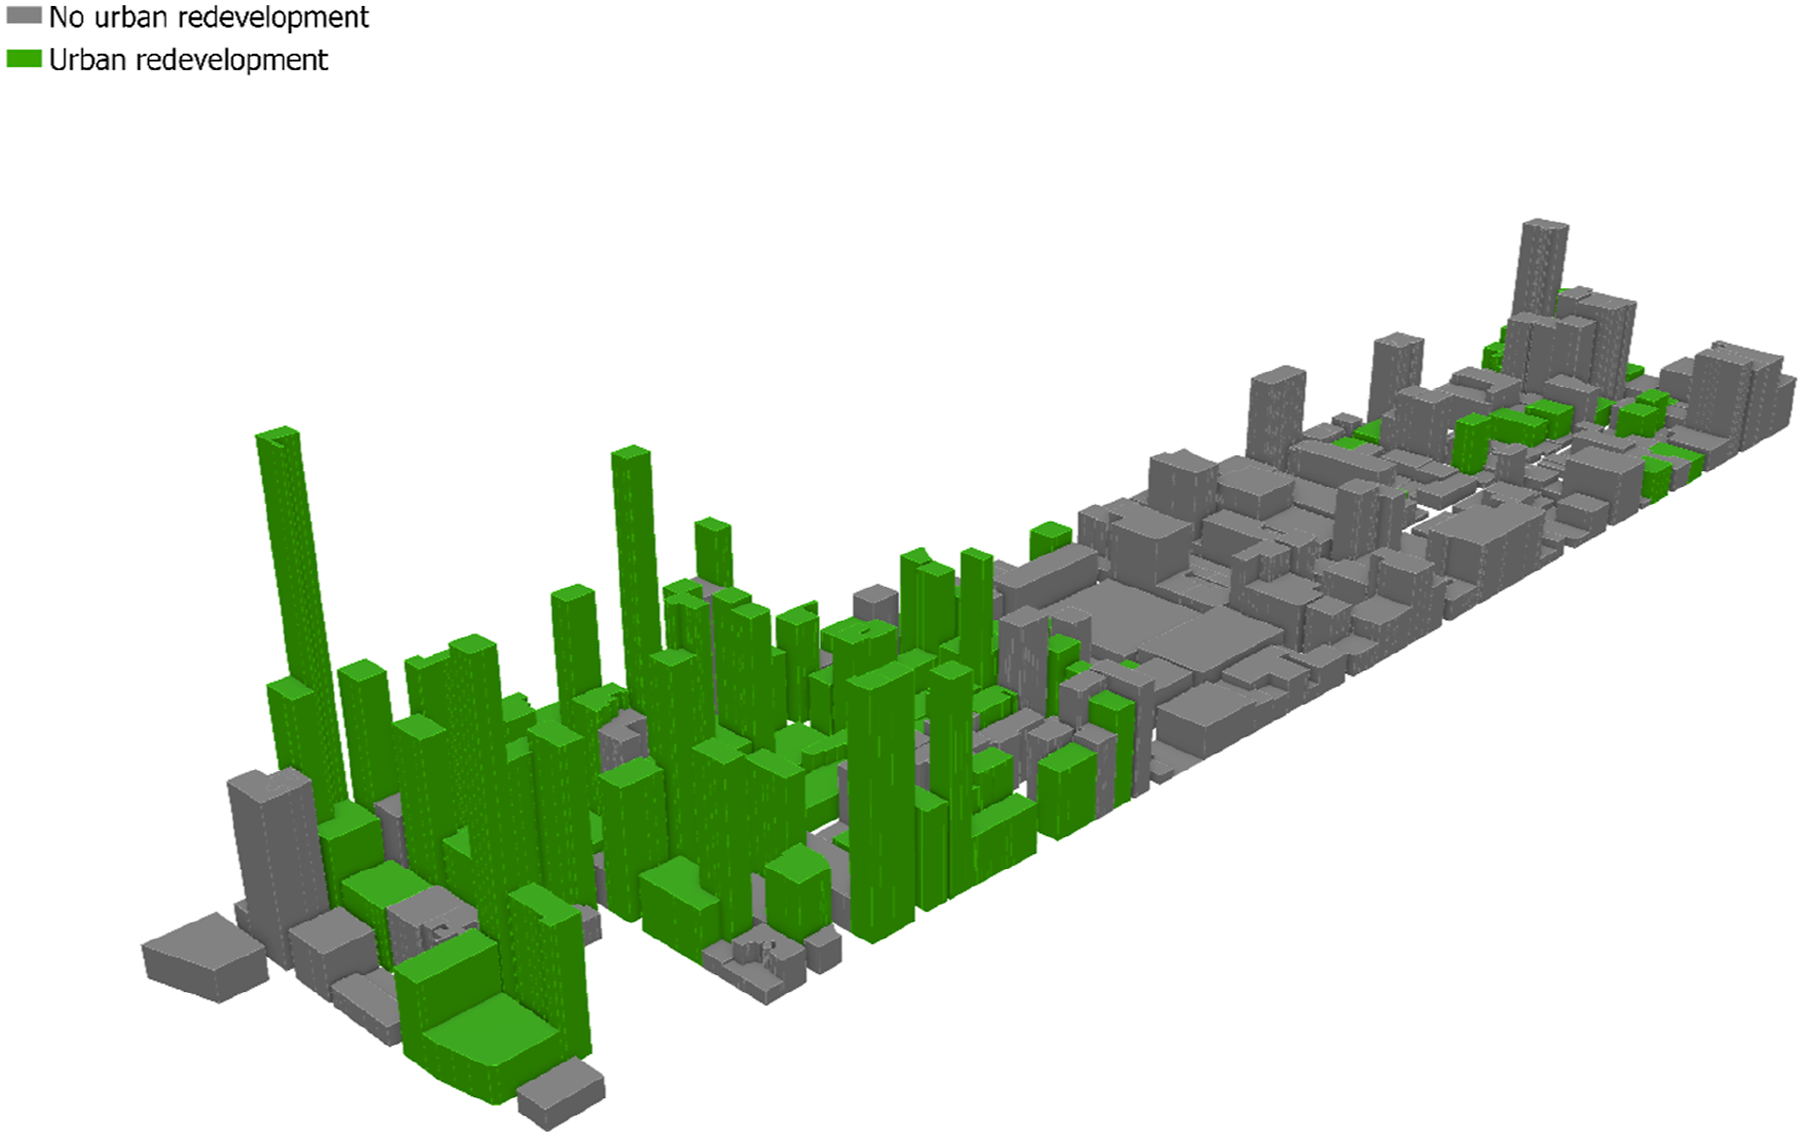
In contrast to the BAU scenario, the recession scenario (Figure 6) highlights massive reductions in development activity. Only 46 new developments and 10,238 new units are constructed by 2040 and a lower average height increase of 17% since 2022 (48 m–56 m). The tallest building is much lower than the BAU scenario standing at only 296 m. Development is much more concentrated in the southern half of the neighbourhood with little densification occurring at the very southern edge of the corridor. This indicates that strict zoning regulations can impact and reduce building heights with construction primarily occurring in areas not covered by zoning regulation polygons. 2040 Recession scenario.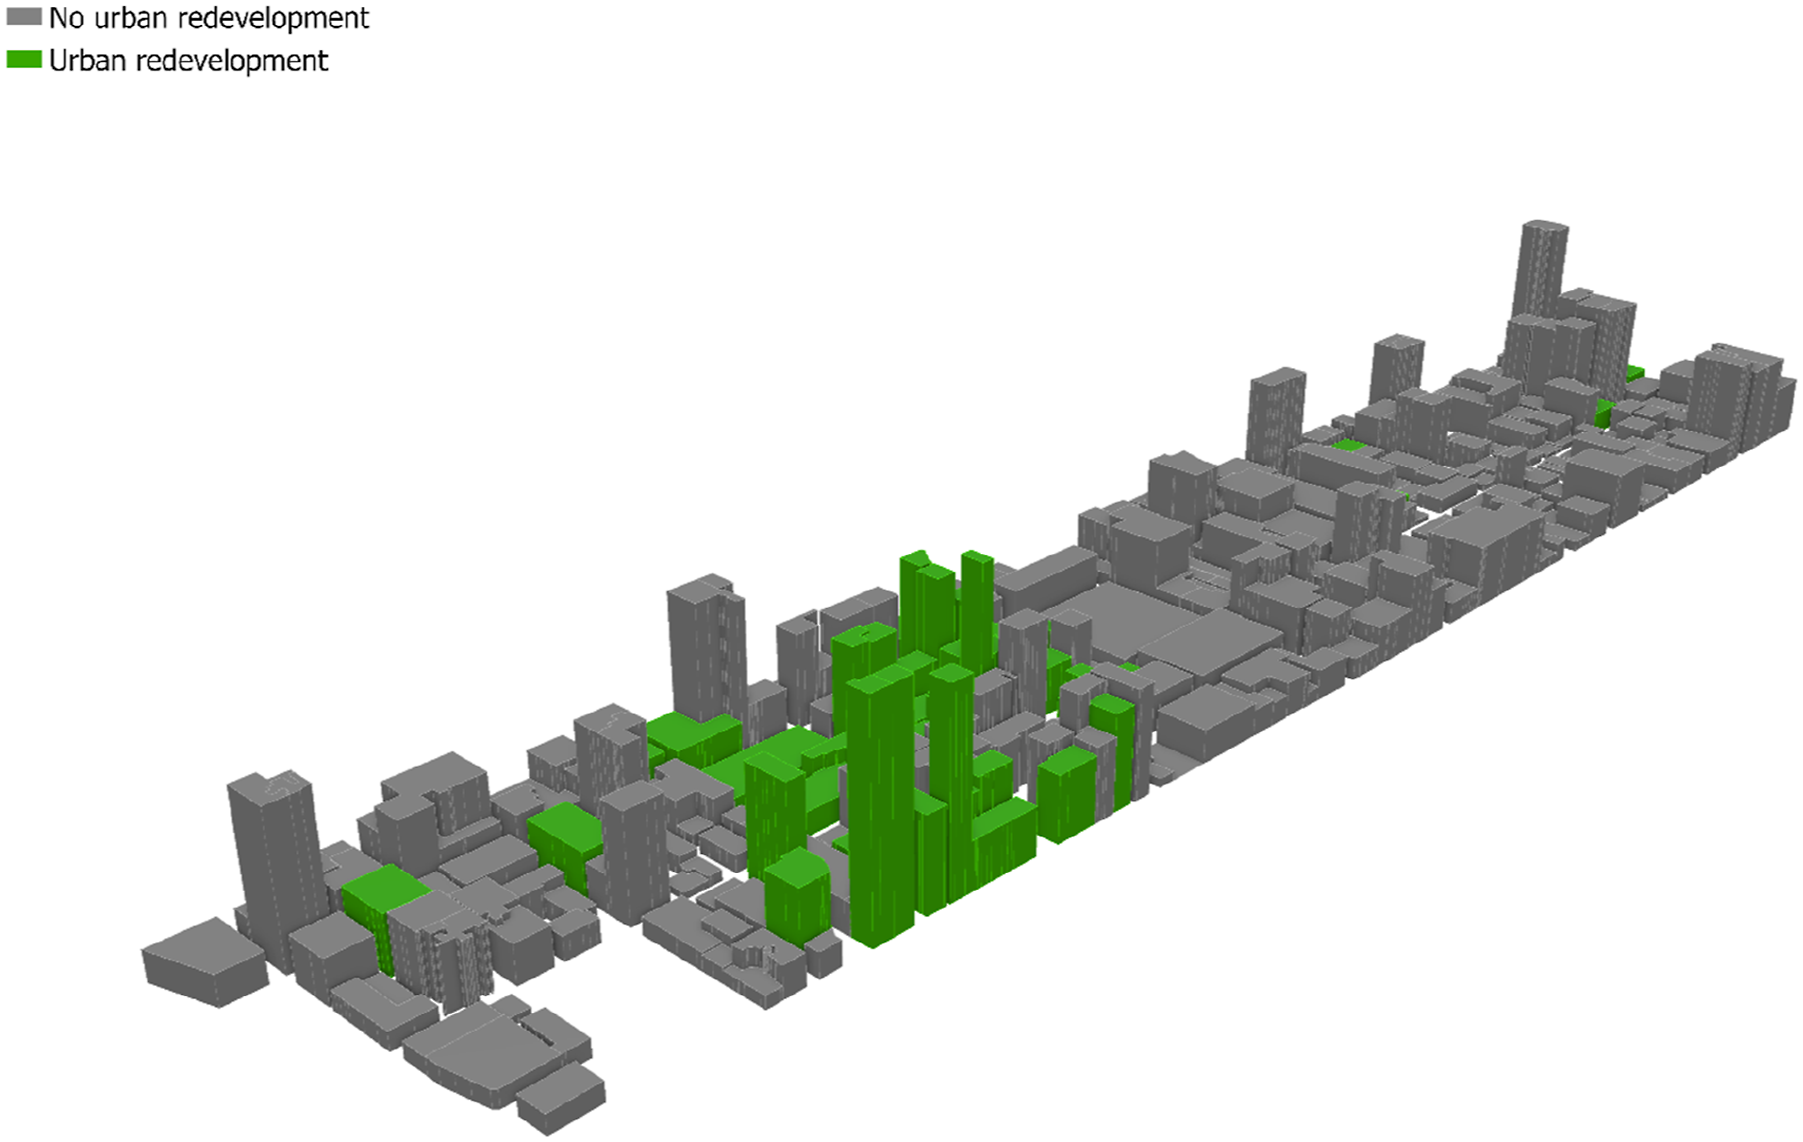
The gentrification scenario (Figure 7) results in similar key statistics to the BAU scenario with 72 new developments and 19,097 new units projected under this scenario. The average height increase across the neighbourhood is 25% between 2022 and 2040 (48 m–60 m), and the tallest building is like the BAU scenario with a height of 516 m. Interestingly, land parcel densification is much more spread out in this scenario with the middle area of the neighbourhood also receiving heavy densification, unlike the BAU and recession scenario. By inverting the interaction between resident and developer agents in submodel 1, the selection of parcels for densification is completely different to that of the BAU scenario. This suggests that the resident and developer interactions can have a strong impact on which parcels are selected for densification at the start of the model. Gentrification scenario.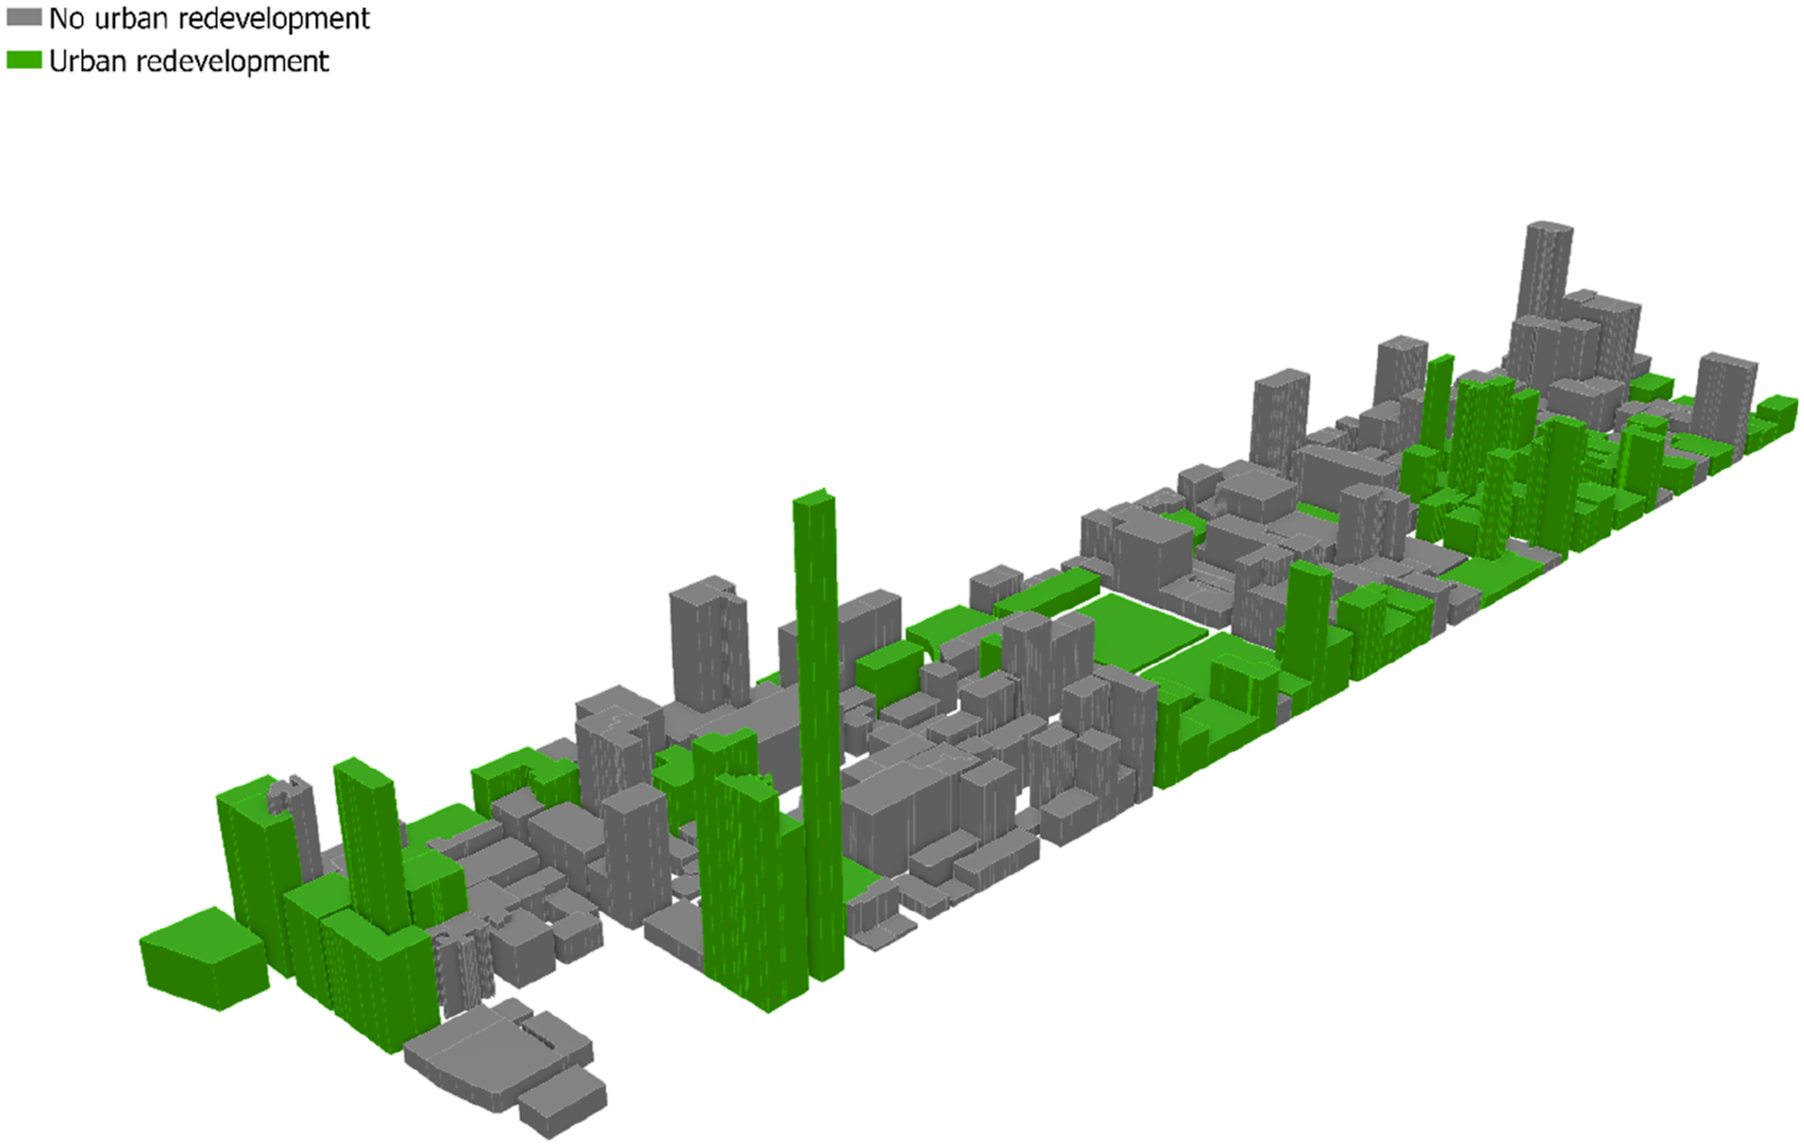
Discussion
Model performance
The model (Table 3) performs well when compared with other CA–ABM and densification models. Mustafa et al. (2017) achieved a cell-to-cell agreement accuracy of 91% for all cells and 37% for new urban cells. Liu et al. (2020) achieved a kappa value of 86% and 90% against observed data from 2005 to 2015, respectively, and Mozaffaree Pour and Oja (2021) got a kappa value of 86%. Wang et al.’s (2019) ANN model got an area under the curve of 69% for changed cells but 98% for all cells. The accuracy metrics of this ABM focus exclusively on redeveloped parcels, rather than all parcels. This approach is adopted because an accuracy metric that considers every cell, such as cell-to-cell agreement, can inflate the accuracy score. This inflation occurs when the amount of urban change is minimal compared to the overall existing urban area. The kappa coefficient does account for existing urban cells so is a more robust approach than cell-to-cell agreement. The accuracy range from 62% to 94% (Table 3) is respectable, given it outperforms other studies which only assessed transitioned cells and is in the same range as the kappa accuracy scores. The ABM does overestimate height and quantity of densification in the validation period which suggests the predictive accuracy of the model could weaken the longer the simulation period.
Model assumptions
As established in the justification for the study area, Zoning in Church-Yonge does not specify rules for building geometry (e.g. frontage, floor space index, setback, and floor area ratio). As a result, this model generates abstract buildings which are assumed to take up the entire parcel area. Integrating more sophisticated building geometry representation would enhance model realism and interpretability. In pre-processing, land parcels were merged based on common buildings to remove small parcels which could not feasibly accommodate a building and to represent typical building sizes. Figure 1 shows that the parcel sizes were varied which reflects development diversity and realistically captures their geometric size (Mozaffaree Pour and Oja, 2021). However, small parcels remained as the BAU scenario produced a spurious 528 m building.
The assumption of random percentages of construction (25%, 50%, and 100%) could be developed by performing a temporal analysis to understand how long those observed redevelopments between 2014 and 2022 took to be constructed and apply these real construction rates stochastically to simulated developments. As data was only collected for buildings in 2014, 2018, and 2022, the percentage rate of completion had to be assumed.
While the stochastic submodel 4 is justified due to the inherent complexity of this stage of the planning process, using a machine learning driven local authority agent in submodel 4 could be beneficial. This could help identify which aspects of development application are important in approval or rejection. This was not possible with the Toronto development applications data due to ambiguity with application status and large imbalances between accepted and rejected development applications. Additionally, there were not enough features in the dataset for a machine learning model to be trained on. In the proposal description, information provided was limited to number of stories, areal size, and number of dwelling units.
Model insights
Building height in the recession scenario was severely impacted due to the high rejection rate (Figure 6). The zoning submodel’s probability threshold had a large impact on building height, and the fewer developments could be explained by halving the number of parcels for sale and active development projects in the recession scenario. Even if a parcel is popular among residents and deemed profitable by the developer, the zoning model has final say over whether those proposals that are outside regulations get approved. The resident and developer interaction in submodel 2 is also important to simulation outputs. Between the BAU and gentrification scenarios, different parcels are selected which suggests the resident and developer interaction in submodel 1 has a large impact on which parcels turn to urban, especially considering when this interaction is reversed completely different buildings are selected.
The model design and scenarios also provide insights into the gentrification theories. The gentrification scenario simulated here is driven by the supply-side gentrification theory, and the developer agent is driving the gentrification as they are seeking new areas where there is a significant rent or value gap. The BAU and recession scenario of submodel 2 are linked to the demand-side with the supply-side playing a role in submodel 3. The purpose and design of the model was influenced by both gentrification theories to capture all important actors involved in the densification process. As Hawkins et al. (2022) and Jackson et al. (2008) argue, gentrification is complex and involves numerous factors. Therefore, this phenomenon cannot be underpinned by a single theory but a holistic understanding and integration of multiple theories.
Hawkins et al. (2022) study of gentrification in Toronto further supports the model design. The paper identifies that there is a significant spatial variation in residential properties and the effects of gentrification are not uniform across the city. This highlights the importance of considering the local context as this ABM does through its utility function layers for each agent. The ABM developed does not use household lifecycle, discrete choice, mobility, or hedonic models as the aim was to capture broad densification patterns. Jackson et al. (2008) argue that given this purpose, it is not essential or relevant to use such models to capture complex systems and simplifications of concepts are acceptable.
Model applications and contributions
This ABM has shed light on three possible urban densification pathways the City of Toronto may experience by 2040. These projections are invaluable to city stakeholders, for example, public services such as fire and police departments could use these results for planning and risk mitigation as an increase in populations could lead to a greater likelihood of calls for service. Likely hotspots of urban development are identifiable which will provide invaluable information in meeting housing demand into the future. Neighbourhoods which may be overlooked in the future by developers are identifiable which will aid city planners in improving rundown areas and applying gentrification strategies to make them more appealing to residents. This will ultimately streamline the urban planning and design process.
The average household size in Toronto is 2.4 people per household (Statistics Canada, 2021). Under the BAU scenario, the projected densifications will be able to accommodate 60,168 new people in the neighbourhood. This is a very comfortable number to meet the area’s growing population, given that the population stood at approximately 31,340 in 2016 and between 2011 and 2016 the population grew by 10.6% (City of Toronto, 2016). This suggests that the urban development activity is healthy and will be able to meet future population demand under this projection.
The use of 3D visualisation along with land parcel data is extremely beneficial because it adds realism and introduces spatial perception to the simulation output. It thus provides an enhanced understanding of urban densification projections in Toronto by presenting it in a visually engaging format and makes interpretation of these results accessible to a wide audience. The recession scenario (Figure 6) emphasises how zoning regulations impact the feasibility of skyscrapers in Toronto if the city takes a strict approach to development applications. This sort of interpretation may not have been as clear or obvious through a 2D output of the simulation results. The strong focus on geospatial land parcel data is highly pertinent as city planning officials across the world now work use geospatial data in the urban planning and design process (Leao et al., 2018).
Future work
Whilst this paper has made significant progressing in addressing the research gaps in urban densification and expansion modelling, there are areas for further work: • Accuracy metrics – the height accuracy procedure could be refined by developing a statistic which evaluates height accuracy parcel by parcel, as opposed to evaluating the total height accuracy across the entire study area. This would solve the spurious building issue identified. • Building geometry representation – more geometrical building properties could be incorporated which would add further realism to the model and make buildings less abstract. • Simulating construction rates – basing construction rates on historic construction timelines would refine the model and potentially increase performance. • Stochastic submodel 4 – it may be useful to bring in a machine learning driven local authority agent in submodel 4 to help add sophistication to the model. This could help identify which aspects of development are most important in approval or rejection.
Another key takeaway is ensuring that the cities keep and maintain coherent GIS records for urban morphology changes. Recording when all buildings have been constructed and keeping topographic vector changes consistent across multiple years would help ensure that calibration and validation can be performed with confidence. For example, the GIS data provided from the Open Data Toronto portal featured polygon boundary discrepancies between years and construction year for buildings was not complete across the study area.
Conclusion
The aim of this paper was to develop an ABM which explored how the real estate market, planning regulations, and stakeholder interactions influenced the feasibility of densification in Toronto. The main findings/conclusions of the paper show potential pathways of densification the city may experience over the coming decades. These outputs have diverse and multidisciplinary applications in risk management and urban planning. The implications and contributions of the model also provide invaluable information to the City of Toronto.
There are areas for future work which can be used to build upon the findings described in this paper. The strengths of this ABM are numerous and provide a framework which could be easily reapplied and adapted to other cities worldwide which experience similar issues to offer insights into overcoming their housing supply challenges. Overall, this paper has a strong research impact by setting the groundwork and prompting new avenues for future investigations in this overlooked field of urban densification modelling.
Supplemental Material
Supplemental Material - A 3D agent-based model for simulating urban densification in Toronto, Canada
Supplemental Material for A 3D agent-based model for simulating urban densification in Toronto, Canada by Richard Burke, Raja Sengupta, and Alistair Ford in Environment and Planning B: Urban Analytics and City Science.
Footnotes
Declaration of conflicting interests
The author(s) declared no potential conflicts of interest with respect to the research, authorship, and/or publication of this article.
Funding
The author(s) disclosed receipt of the following financial support for the research, authorship, and/or publication of this article: This research was funded by EPSRC Centre for Doctoral Training in Geospatial Systems, grant number EP/S023577/1, and by NERC UK – Canada Globalink doctoral exchange scheme: Globalink Research Placement NE/X006727/1.
Supplemental Material
Supplemental material for this article is available online.
References
Supplementary Material
Please find the following supplemental material available below.
For Open Access articles published under a Creative Commons License, all supplemental material carries the same license as the article it is associated with.
For non-Open Access articles published, all supplemental material carries a non-exclusive license, and permission requests for re-use of supplemental material or any part of supplemental material shall be sent directly to the copyright owner as specified in the copyright notice associated with the article.