
Abstract
Studies on urban deprivation date back to the 19th Century but remain important today due to rising levels of inequality and social segregation. However, while social causes of deprivation have been investigated, the role of the built environment remains neglected. Existing studies either provide broad coverage at the expense of detailed morphological descriptions or offer meticulous accounts of small-scale areas without capturing the broader context. This paper addresses such a gap by investigating the relationship between urban form, measured at the building level, and deprivation across the entire city of Isfahan, Iran. By doing so, we position this study in the tradition of urban morphology. Operationally, we, first, identify urban types (UTs), that is, distinctive patterns of urban form, by clustering 200+ morphological characters; second, we explore the relationship between proportion of buildings belonging to each UT, in each neighbourhood, and deprivation; third, we offer detailed descriptions of the UTs most strongly associated with deprivation, discuss possible drivers for the observed correlations, and link findings to relevant literature in the field. Twelve UTs are identified, with four showing the strongest impacts on predicting deprivation. This study brings novel insights on the morphology of deprivation of Isfahan, while contextualising them with respect to domain-specific studies, which have predominantly focused on Western cities. The proposed methodology can be replicated to explore morphologies of deprivation in different contexts, further our understanding of the topic, and potentially inform planning and policy making.
Introduction
Socioeconomic deprivation has been a relevant research topic since the early 19th Century, in response to the urbanisation wave accompanying the Industrial Revolution (1780–1849). Sociologists and philosophers like Mayhew (1864) and Engels (1892) pioneered surveys to examine the living conditions of deprived social groups in major English cities, highlighting dire sanitary and environmental conditions. In the early 20th Century, Booth’s survey (1902) of East London was the first rigorous study using cartography to understand the spatial pattern of deprivation at the building level. Since then, several studies followed. Byrne (1998) found that ethnicity ties to deprivation in Leicester and Bradford, where Pakistanis tend to live in more deprived areas in both cities, while Indians occupy both affluent and poorer areas in Leicester. Rosenbaum (1995) examined income-class shifts in New York between 1978 and 1987, and observed that low-income influx, higher-income outflow, and negative income changes lead to long-term decline of poor areas. Today, the idea of mapping socioeconomic deprivation is reflected in authoritative indices such as the English Index of Multiple Deprivation (McLennan et al., 2019).
Yet, though studies of the geography of poverty flourished after Booth in emerging scientific domains such as public health and human geography, these were very rarely – if at all – complemented by the systematic study of urban form at the building, plot, and street scale. This is due to the extremely laborious nature of fine-grained urban form representation, which only until recently was impractical beyond the neighbourhood level.
A first step forward in this direction came in the mid-1980s from the Space Syntax Laboratory. Here, digital technology applied to the numerical description of urban form allowed unprecedented scalability, although reduced to one single element, that is, the street network, measured in terms of ‘centrality’ (Hillier and Hanson, 1984). This was later affirmed as a primary evolutionary force in cities and a fundamental driver of urban economy (Hillier, 1996). An abundant stream of research followed, reinforcing the fact that street centrality correlates with density, prosperity, and diversity of land uses (Hillier, 2002; Porta et al., 2012). On this ground, recent research specifically investigated the link between street centrality and deprivation, understood in terms of spatial segregation. Key studies by Vaughan and colleagues (2005; 2007; 2009) explored this link in East and North London, using Booth’s maps. Findings suggest that streets with higher integration levels, such as main streets, correlate with better-off population, while more segregated streets are associated with more deprived communities. Similarly, Carpenter and Peponis (2010) investigated how street centrality related to poverty in Atlanta. Their findings suggest that, when aggregating connectivity metrics over large spatial units, such metrics increase with the number of households living in poverty. Conversely, when considering finer spatial units, the relationship is inverted.
Alternative streams of research appear more methodologically heterogeneous. Mokhtarzadeh et al. (2021) investigated the relationship between two descriptors of urban form (i.e. coherence and compactness) and deprivation in Isfahan, and found coherence to be positively associated, while compactness not statistically relevant. Similarly, Doiron et al. (2020) investigated the relationship between deprivation and presence of desirable urban features, such as walkability and greenery. Their findings suggest that both qualities were more common in least deprived areas and less so in highly deprived areas, highlighting patterns of environmental inequality. A study by Walker et al. (2005) related the presence of polluting industrial sites to deprivation in England and found that the former tend to disproportionately cluster in proximity to deprived communities. However, in this line of studies the description of the built environment remains limited to a handful of descriptors. Venerandi et al. (2015, 2018) proposed and applied quantitative methodologies to analyse the relationship between a set of metrics of urban form (describing street network’s configuration, morphology of the urban fabric and locations of shops and services) and socioeconomic levels in six UK cities. Whilst this represents an improvement, it still does not characterise the built environment in a truly comprehensive, systematic, and detailed manner.
A significant leap forward has recently been achieved by studies in the novel field of ‘urban morphometrics’ (Araldi and Fusco, 2019; Fleischmann et al., 2022), which were able to operationalise ‘regionalisation’, a long-established procedure for the analysis and classification of ‘morphological regions’ (Whitehand, 2009). Studies in this domain typically feature a comprehensive description of urban form along dozens and often hundreds of dimensions measured at the building level, clustering analysis to identify morphological regions (UTs), and profiling techniques for their characterisation and cross-comparison. However, virtually no studies in urban morphometrics have specifically investigated the relationship between UTs and deprivation so far.
In this paper, we do so in the city of Isfahan, through the Urban MorphoMetrics (UMM) approach (Porta et al., 2022). Our aim is not to understand the spatial distribution of deprivation across a city, but rather its relationship with urban form, where the latter is described at the building, plot, and street scale as in the tradition of urban morphology. Ultimately, our objective is to understand which UTs are statistically associated with deprivation in Isfahan, and to what degree such relations align with previous studies. To do so, we first obtain a comprehensive description of urban form, based on 200+ numerical descriptors, and classify such descriptors to obtain UTs; second, we explore the relationship between UTs and deprivation; third, we extract the morphological profiles of the UTs that show the strongest associations with deprivation, alongside a qualitative interpretation of the main factors at play in such relationships.
The city of Isfahan
Isfahan is the third city of Iran by size, with an area of around 200 km2 and a population of 1,961,260 (Golestannejad, 2019). It sits in the heart of the Iranian plateau and has an arid climate, which strongly influenced its architectural and urban character. Isfahan is more than 2000 years old, but the main city structure is more recent, dating back to the Safavid era (1501–1722). The Zayandehrood River and Chaharbagh Street are the main axes of Isfahan, subdividing the city in four quadrants. In the Pahlavi era (1925–1979), Isfahan mainly developed around the central core in a grid-like manner. Recent urban expansions to the north, east, and northwest of the historical core, also feature regular layouts. Conversely, western and southern neighbourhoods are more irregular, due to the presence of agricultural land and a mountain chain (Farjami and Taefnia, 2022). Isfahan is divided into 15 districts and 199 neighbourhoods, 194 of which are residential and mostly located north of the Zayandehrood River (Bagheri and Shaykh-Baygloo, 2021). Since some neighbourhoods are not covered by census data, only 155 were finally retained (Figure 1). The local census defines neighbourhood boundaries based on socioeconomic structures and local traditions; thus, they are relatively homogeneous in terms of social and physical structures. However, some areas are characterised by higher ethnic diversity and more socially and morphologically heterogeneous communities (Ghodsi et al., 2022; Mokhtarzadeh et al., 2021). IMD scores for the 155 neighbourhoods of Isfahan. Low deprivation is shown in blue. High deprivation is shown in red. Google Earth data: ©2023 Airbus/Maxar Technologies.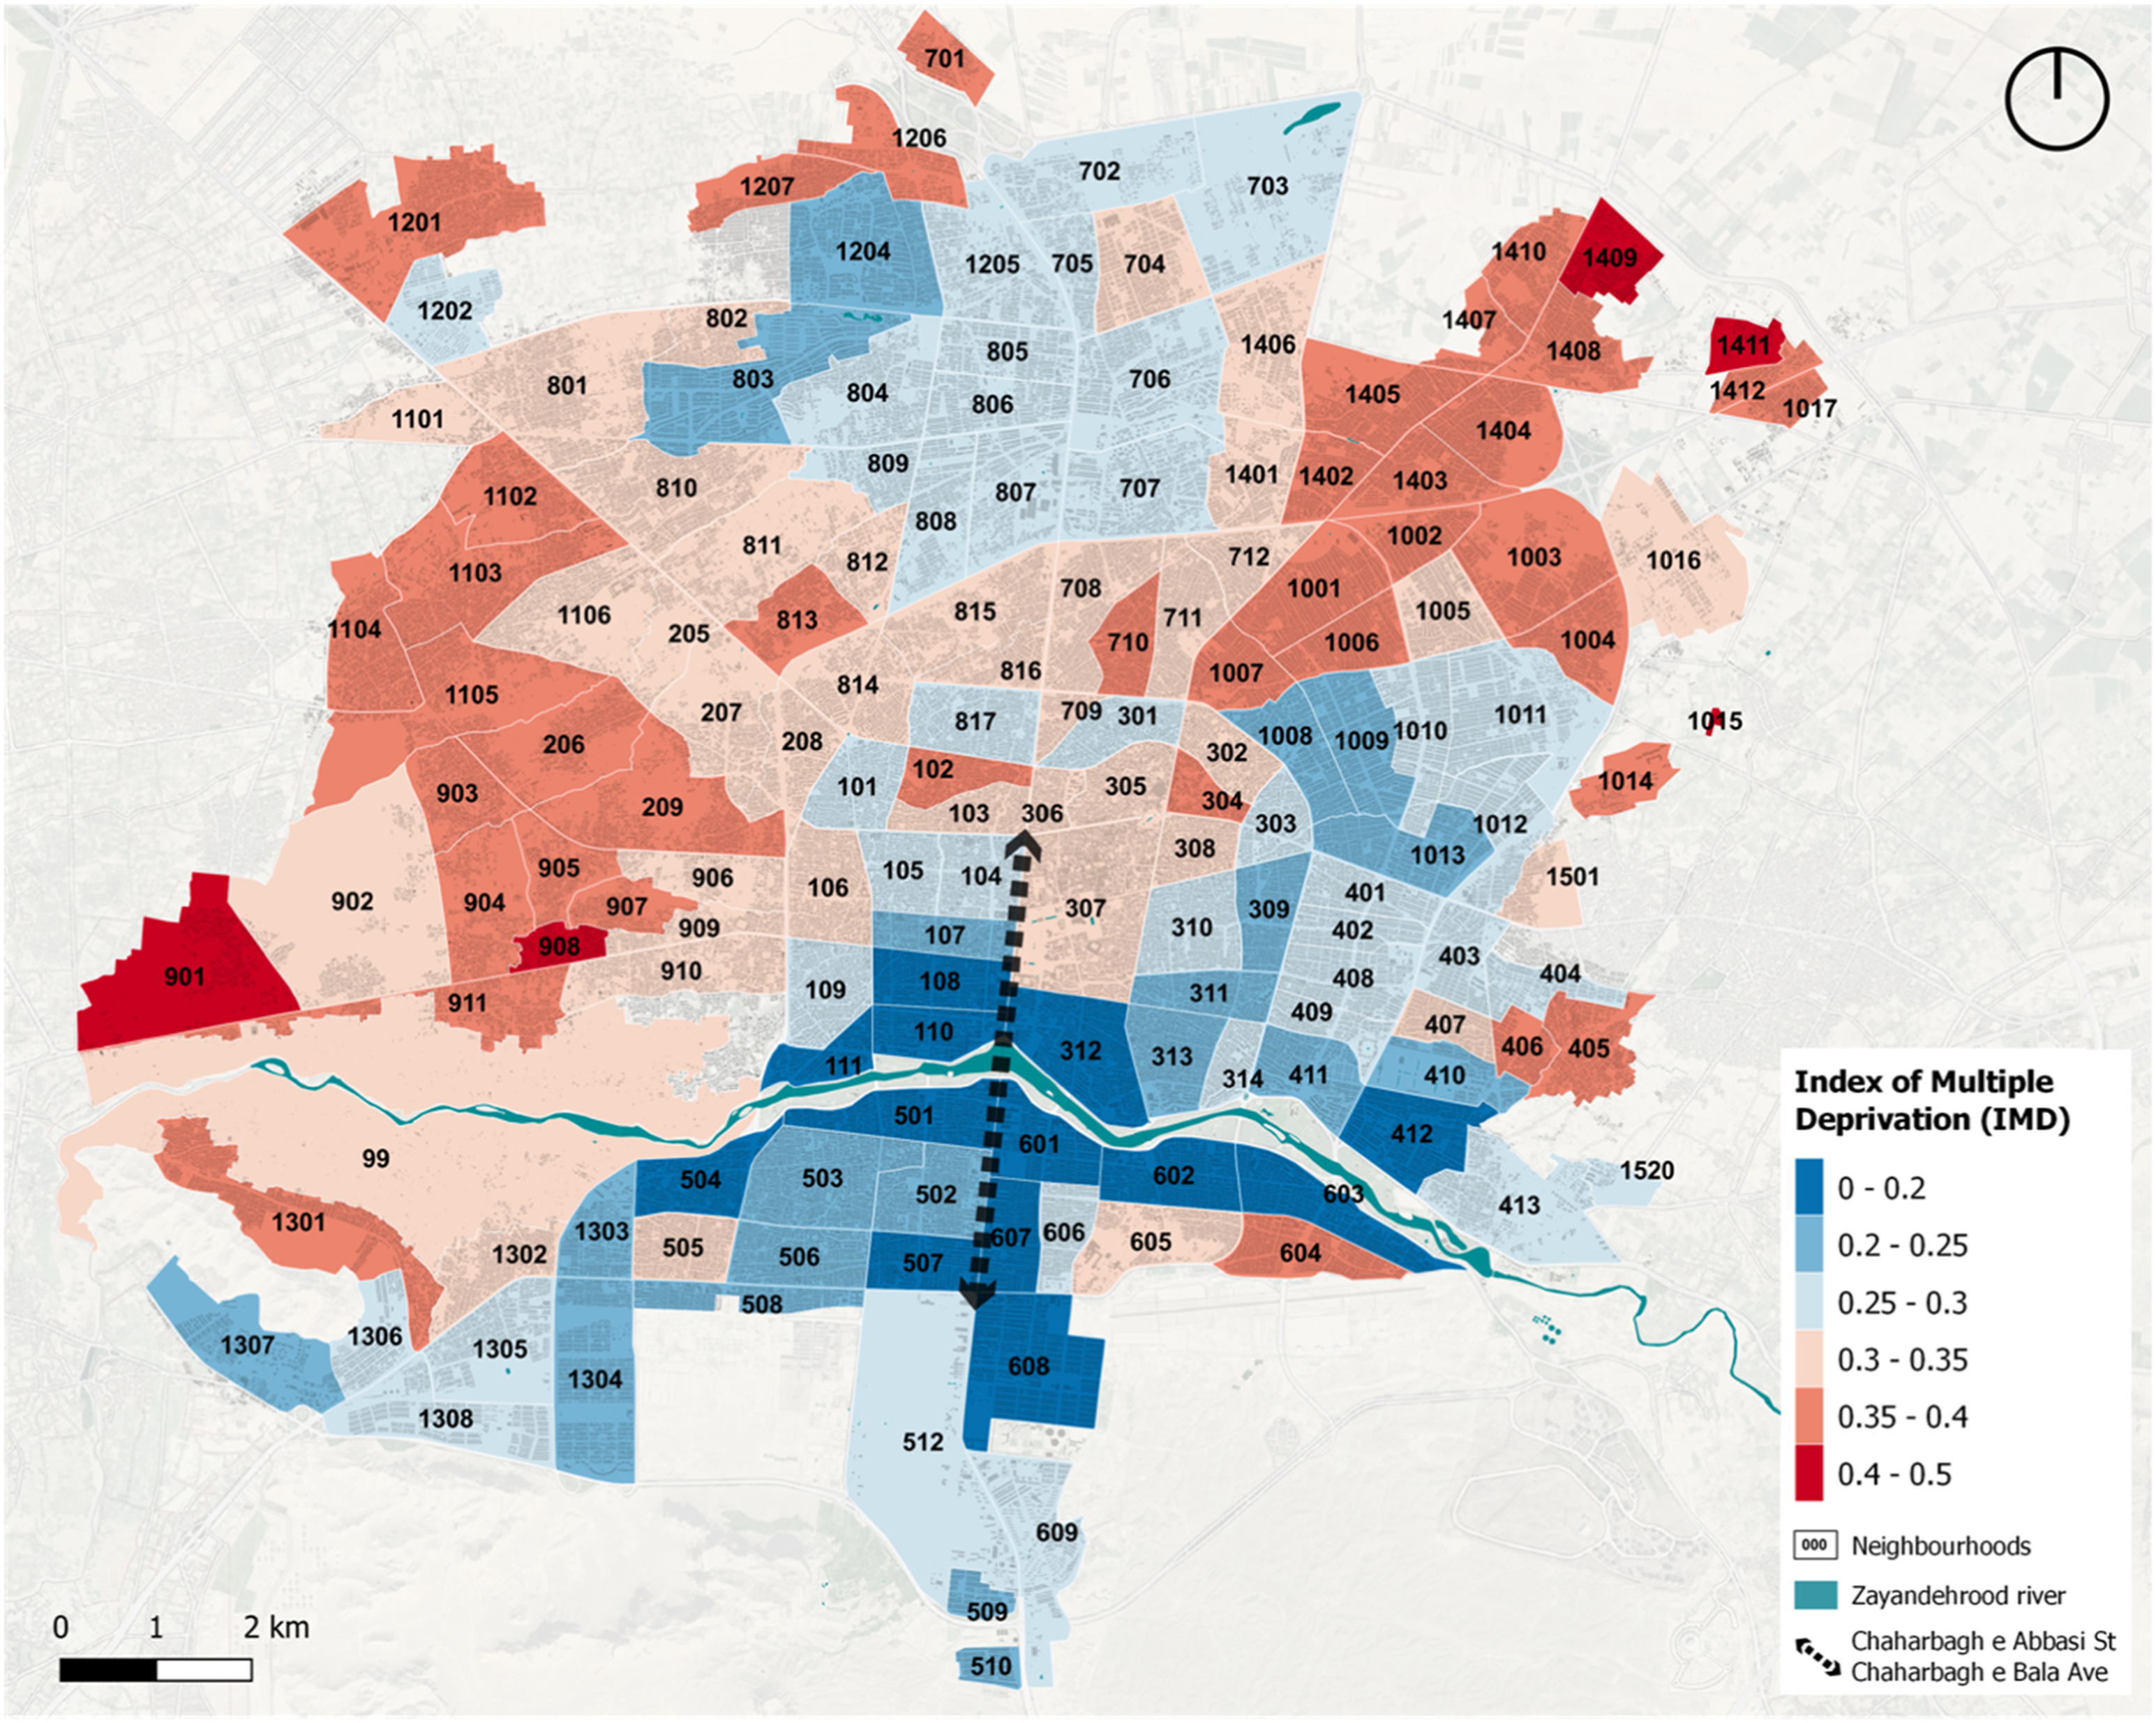
Datasets
Buildings and streets
Building footprints and street segments were sourced from the Municipality of Isfahan and date back to 2017. The original files were provided in .dwg format and then converted into .shp format to allow geospatial analysis. Both geodata layers were pre-processed to remove ancillary structures smaller than 20 m2 (which are not independent buildings and thus cannot be analysed in isolation), disconnected street network components, and false nodes (erroneous street intersections). The resulting datasets include 59,015 street segments and 401,109 building footprints.
Isfahan’s index of multiple deprivation
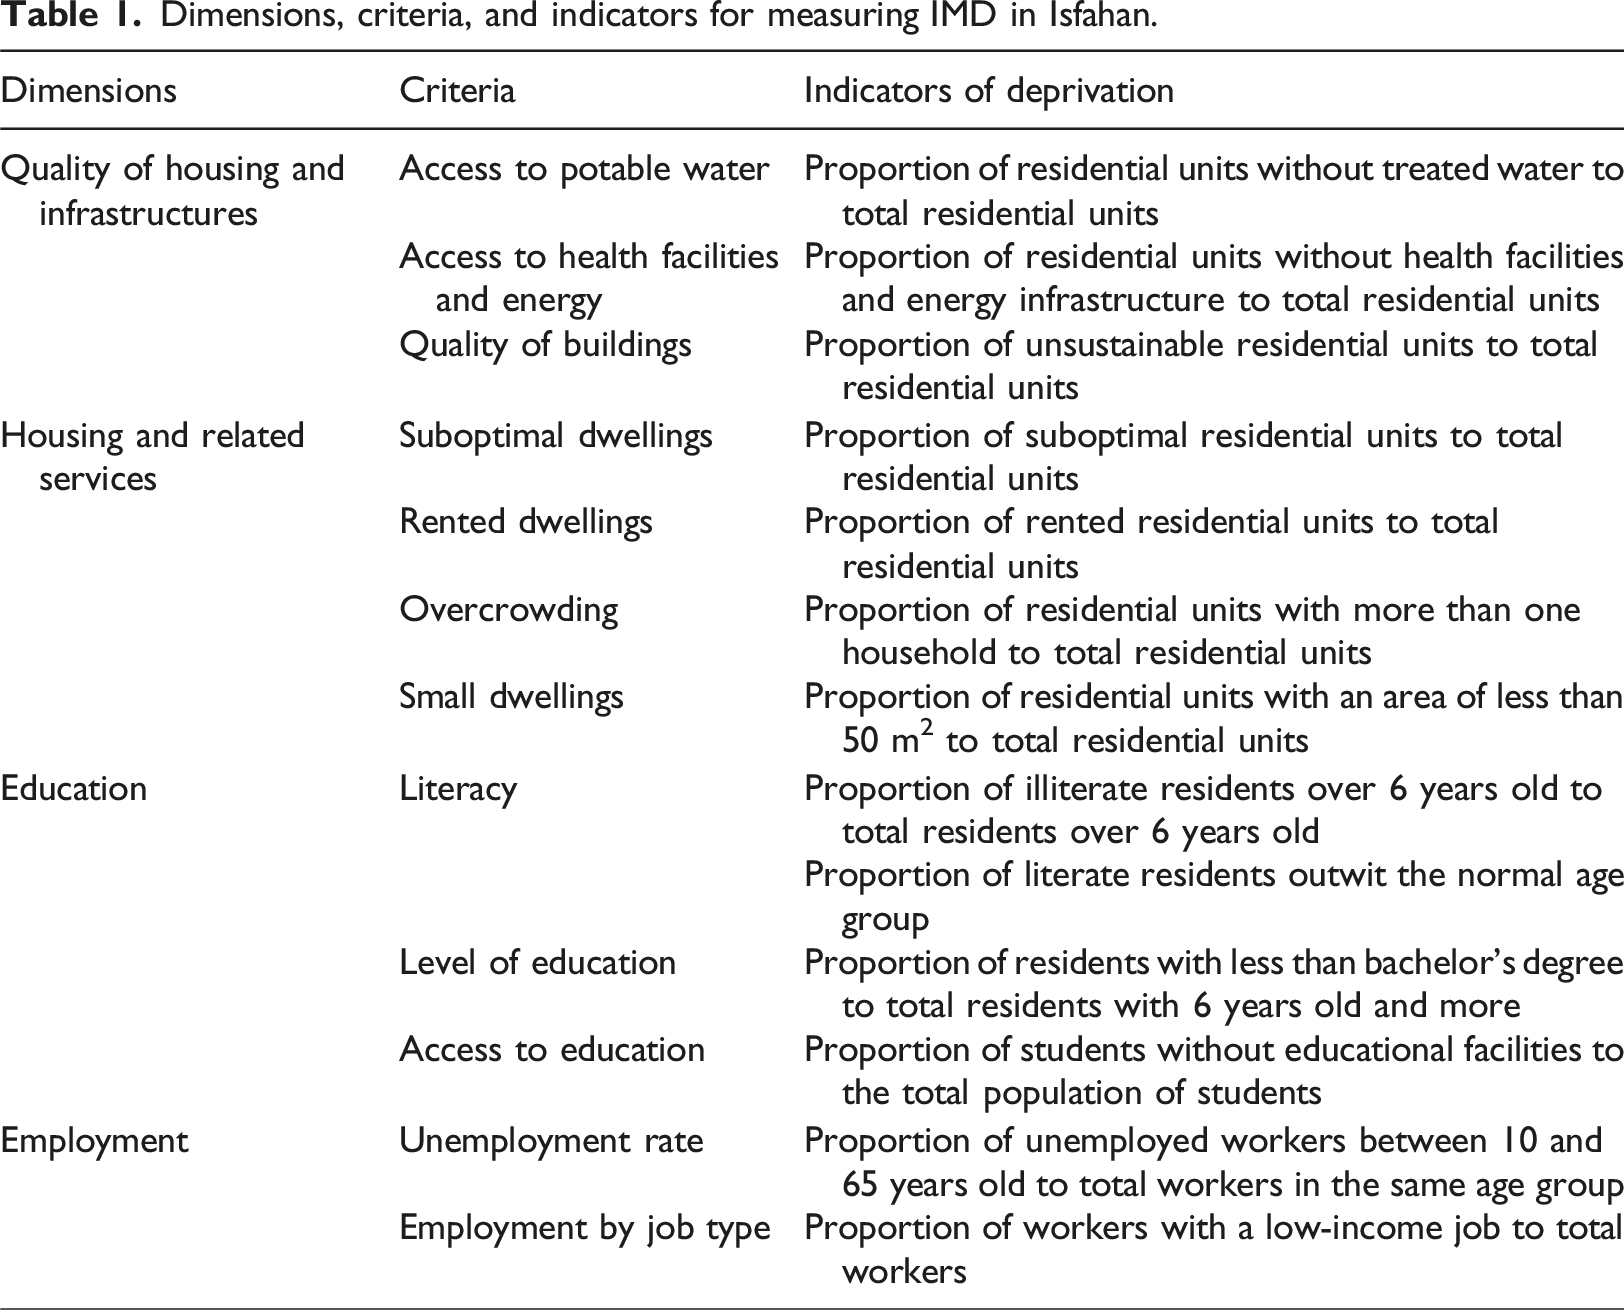
The Index of Multiple Deprivation (IMD) used in this study is inspired by the English indices of deprivation (McLennan et al., 2019) and was derived from previous work (Mokhtarzadeh et al., 2019). Here, we shortly illustrate its main features and refer the reader to the original paper for further details. Isfahan’s IMD covers four of the seven domains featured in the English indices: employment, education, housing, and living environment. Income, health, and crime were not considered due to the lack of data in the public census. More specifically: • Quality of housing and infrastructures comprises three criteria: access to potable water, presence of health facilities, energy infrastructures, and quality of buildings. • Housing and related services comprises four criteria: proportions of suboptimal, rented, overcrowded, and small dwellings. • Education comprises three criteria: literacy, education levels, and access to educational facilities. • Employment comprises two criteria: employment rates and employment by job type.
Dimensions, criteria, and indicators for measuring IMD in Isfahan.
To rank neighbourhoods according to their respective deprivation levels, the Technique for Order of Preference by Similarity to Ideal Solution (TOPSIS) (Tzeng and Huang, 2011) was applied to the base indicators. TOPSIS is a decision-making technique in multi-criteria analysis, widely utilised to rank city neighbourhoods in relation to various spatial and socioeconomic characteristics (Ortega-Momtequín et al., 2021). Details on the TOPSIS are presented in the Supplementary Material. Figure 1 shows the 155 neighbourhoods of Isfahan colour coded according to deprivation levels obtained by applying the TOPSIS to the indicators presented in Table 1. More deprivation tends to cluster north-east and west of the city centre, in neighbourhoods predominantly characterised by a stronger population mix and protected agricultural land. Conversely, less deprivation tends to concentrate in neighbourhoods with better climatic conditions located south of the historical core, near the Zayandehrood River.
The morphometric taxonomy of Isfahan
The urban form of Isfahan is described in a comprehensive and detailed manner through UMM (Porta et al., 2022), an approach that measures urban form at the level of individual buildings. Since plots are defined differently in different places (Kropf, 2018), plot-proxies called ‘cells’, are automatically generated via a Voronoi-based partitioning of space applied to each building in the dataset. The UMM workflow consists of two main steps: i. computation of a comprehensive set of morphometric characters for each cell; ii. clustering such characters to identify UTs. We refer the reader to the paper mentioned above for more information on UMM; in the following sections, we provide a general description with particular emphasis on elements that are specific to this study.
Computation of characters of urban form
To operate, UMM uses parsimonious information, that is, building footprints (with heights) and streets. The description of urban form is based on 74 primary characters, accounting for six main morphological properties (dimension, shape, spatial distribution, intensity, connectivity, and diversity) of the main morphological elements (buildings, streets, and plots), at three scales (small, medium, and large) (Fleischmann, Romice, et al., 2021b). Subsequently, four measures are computed for each primary character, generating a total of 296 contextual characters: • interquartile mean, the average of the values between the first and third quartile of the distribution. • interquartile range, the range in values of the central 50% of the distribution. • inter-decile Theil index, a measure of local diversity. • Simpson diversity index, a measure of heterogeneity of values.
The contextual characters are calculated up to the third order-of-contiguity from each cell and capture the local tendency of the primary characters. Contextual characters are input in a clustering algorithm that identifies UTs. In Isfahan, due to the unavailability of building heights, UMM was performed on only 65 of the 74 primary characters (see Table S1 in the Supplementary Material), corresponding to a total of 260 contextual characters. For illustrative purposes, four of them are presented in Figure S1 (Supplementary Material).
Clustering the contextual characters
Like in Venerandi et al. (2021), Agglomerative Hierarchical Clustering (AHC) with spatial constraint is preferred to the Gaussian Mixture Model technique used by Fleischmann et al. (2021a) as the former tends to output UTs with fewer misclassified buildings. The optimal number of UTs is identified in two steps: i. a first round of AHC is performed and several UTs are selected after inspection of the silhouette graph (Rousseeuw, 1987) and through mapping potential solutions. Subsequently, to maintain consistency in UT size and account for fine-grained morphological patterns, consecutive rounds of sub-clustering and silhouette evaluations are performed for specific UTs. The final solution is based on the evaluation of both silhouette scores and expert knowledge of the historical/morphological patterns of the city. At the end of this process, 12 UTs were selected as the best solution (Figure 2). Silhouette graphs used in the selection procedure are in Figure S2 of the Supplementary Material. Morphometric taxonomy of Isfahan. Buildings and cells are colour coded according to their respective UTs. Similarity of colours reflects similarity of morphological patterns. The y-axis in the dendrogram represents the distance or dissimilarity between UTs. Google Earth data: ©2023 Airbus/Maxar Technologies.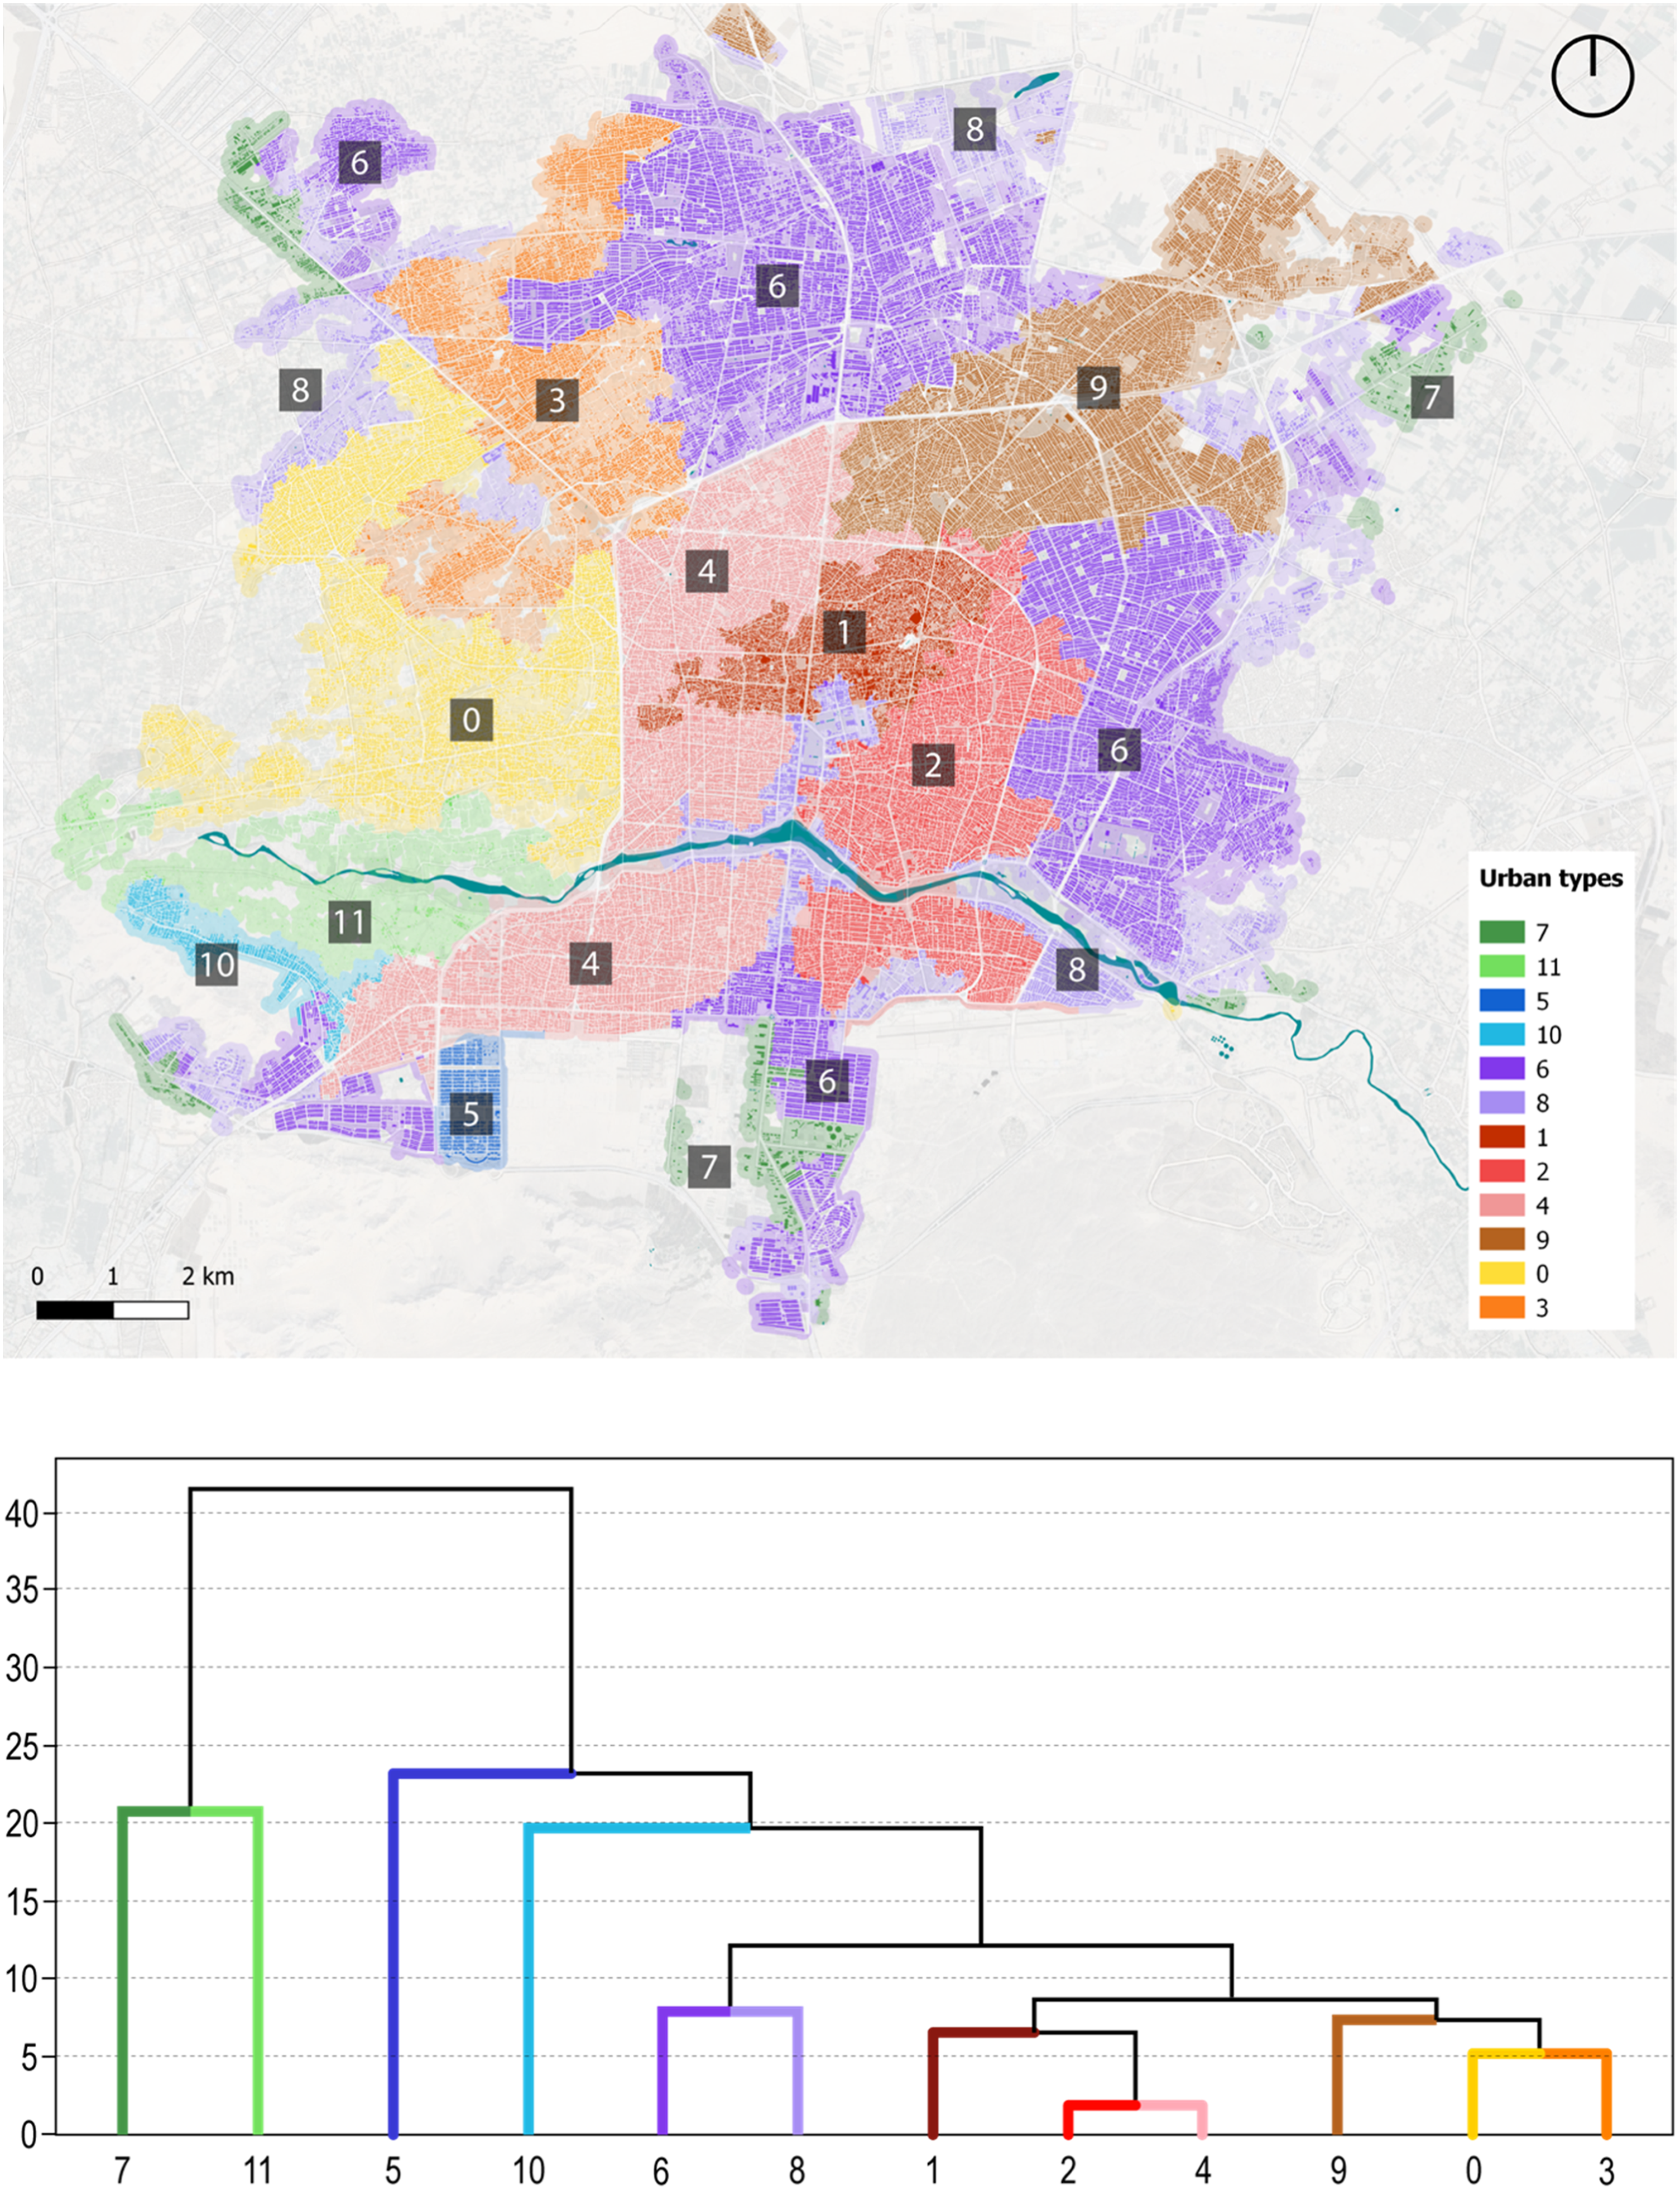
In terms of accuracy, the 12 UTs seem to overlap relatively well to some of its most significant development phases. UT1 significantly overlays with the 8th to 15th Centuries Timurid, early Abbasid to Safavid periods which saw the amalgamation of villages into a walled settlement, a westwards expansion, and the infill of the walled area (Karimi and Motamed, 2003). UT1, which boundary precisely overlaps with the ancient city gates, also includes the Jameh Mosque, Kohneh Square (Old Square), and the Grand Bazaar, that is, the main religious and economic centres of the city. UT8 identifies the 1597 expansion phase that took place south of the Zayandehrood River, around Chaharbagh Street, a wide boulevard with four rows of imponent trees and a stream in the middle. Sitting at the core of UT8, this boulevard is one of the most celebrated urban design achievements of Iran (Baghdiantz-MacCabe, 2005). Shah Abbas the Great promoted this expansion, which also includes a six-storey palace (Ali-Qapu), the Sehikh Lotfollah Mosque, and the Royal Bazaar (Minowa and Witkowski, 2009). Around this time, a second rectilinear connection between the old city and the river, east of Chaharbagh Street, was established. This encouraged a further expansion to the south, largely corresponding to UT2. UT4 well captures two further expansions (end of 1500 and start of 1600): the first took place west of Chaharbagh Street and features a grid layout; the second (New Julfa quarter) was developed south of the river and dedicated to house minority groups, such as Jewish, Armenian, and Zoroastrian. Thanks to their wealth these areas were built with remarkable spatial standards, with large mansions close to the river (Ghougassian, 1995). In 1600, the New Julfa quarter expanded eastwards, in continuity with the urban layout on the north side of the river (UT2) (De Bruin, 1759). In the 1960s, a masterplan to modernise the city proposed the demolition of significant portions of the historical fabric (Karimi and Motamed, 2003). Whilst this plan was never fully implemented, several radial roads were introduced to facilitate movement in and out of the city centre. These new arteries often mark the transition between UTs. Both the choice of the optimal number of UTs and validation were made with insights from some of the authors of this paper, local researchers with extensive knowledge of Isfahan.
Analysing the relationship between UTs and deprivation
Since IMD is computed for spatial units (official neighbourhoods) larger than those of UTs (cells), we aggregated the latter at the level of the former by computing the percentage of buildings belonging to each UT in each neighbourhood (Figure S3). The relationship between such percentages and IMD is investigated through a machine learning pipeline designed to avoid both issues of spatial autocorrelation (e.g. inflated results, unreliable regression coefficients) and skewed distributions (most UTs tend to concentrate in specific city areas and thus percentages are unbalanced). Such methodology is based on random forest regression performed through spatial cross validation (Lovelace et al., 2019). More specifically, the study area is subdivided in five different combinations of train (80%) and test (20%) sets (Figure S4), through a constrained k-means algorithm applied to neighbourhoods’ coordinates (Bradley et al., 2000), which are then used to compute a cross validated performance score, that is, negative root mean squared error (NRMSE). Finally, SHAP (SHapley Additive exPlanations), a technique that assigns each variable a negative or positive importance value for a particular prediction (Lundberg and Lee, 2017), is used to interpret the output of the random forest regression. Having applied such steps, the absolute value of the mean NRMSE across the five iterations is 0.058, corresponding to a bit less than a standard deviation of IMD (0.064), a result which can be considered satisfactory given the exploratory nature of this study. SHAP outputs (Figure 3) show that four UTs (4, 2, 9, 0) have the strongest impacts on IMD, with the first two showing an inverse relationship, while the latter two a positive one. To better grasp the morphologies of deprivation of Isfahan, we provide a narrative of the most distinctive morphological features of such UTs in the next sections. We first compute the average value of each contextual character across all UTs; second, we calculate the average of same in each UT; finally, we identify those characters whose means diverge the most from their average values across UTs, through standard deviations (SDs). Summary plot of the relative impacts of UTs on IMD.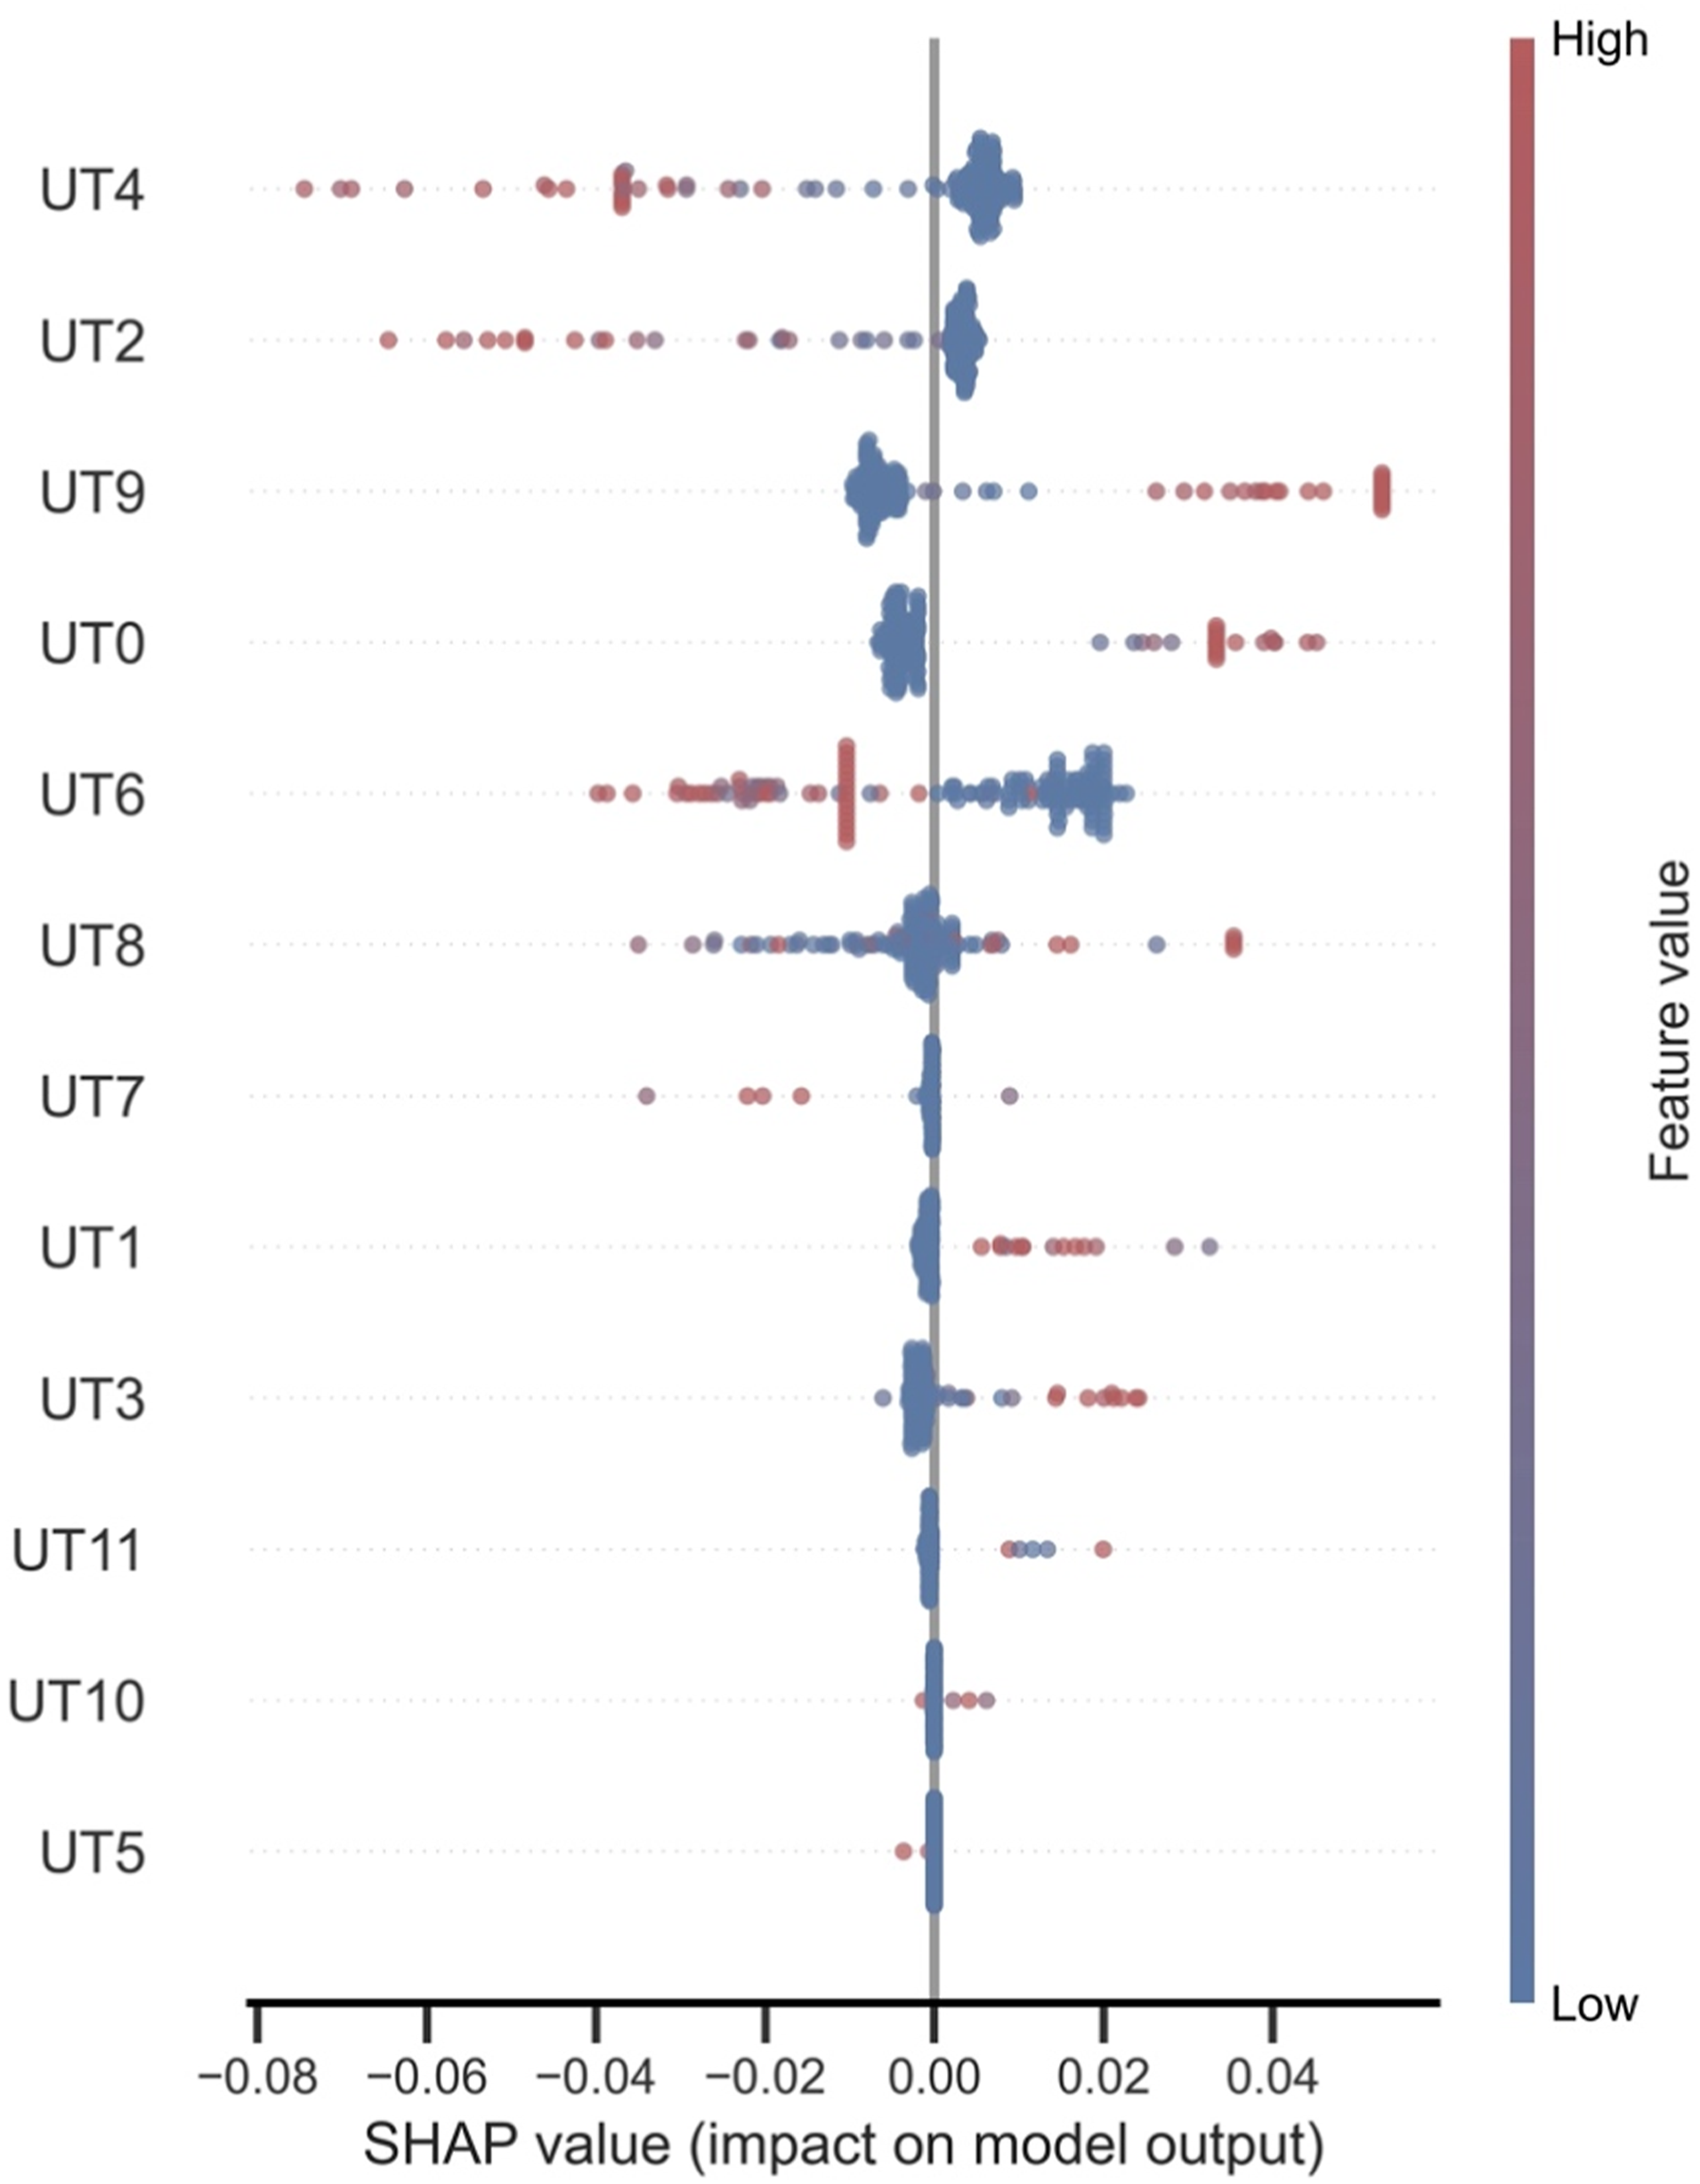
The form of the UTs with the strongest negative impacts on IMD: UT4 and UT2
In UT4, the top three positive divergent contextual characters are (Figure 4, top): local diversity of cell areas (0.5 SDs), range of cell cardinal orientation (0.4 SDs) and local diversity of mean building centroid-corner lengths (0.4 SDs). Conversely, the most negatively divergent characters are homogeneity of building areas, homogeneity of cell-street alignments and homogeneity of courtyard areas (all −0.5 SDs). This combination of characters points to a heterogeneous urban fabric characterised by buildings with diverse footprints and courtyard areas, plots with different areas, cardinal orientations, and alignments to the streets (Figure 4, bottom). Strongest descriptors of UT4 (measured in SDs), top. Satellite picture of a portion of UT4, bottom. Google Earth data: ©2022 Maxar Technologies.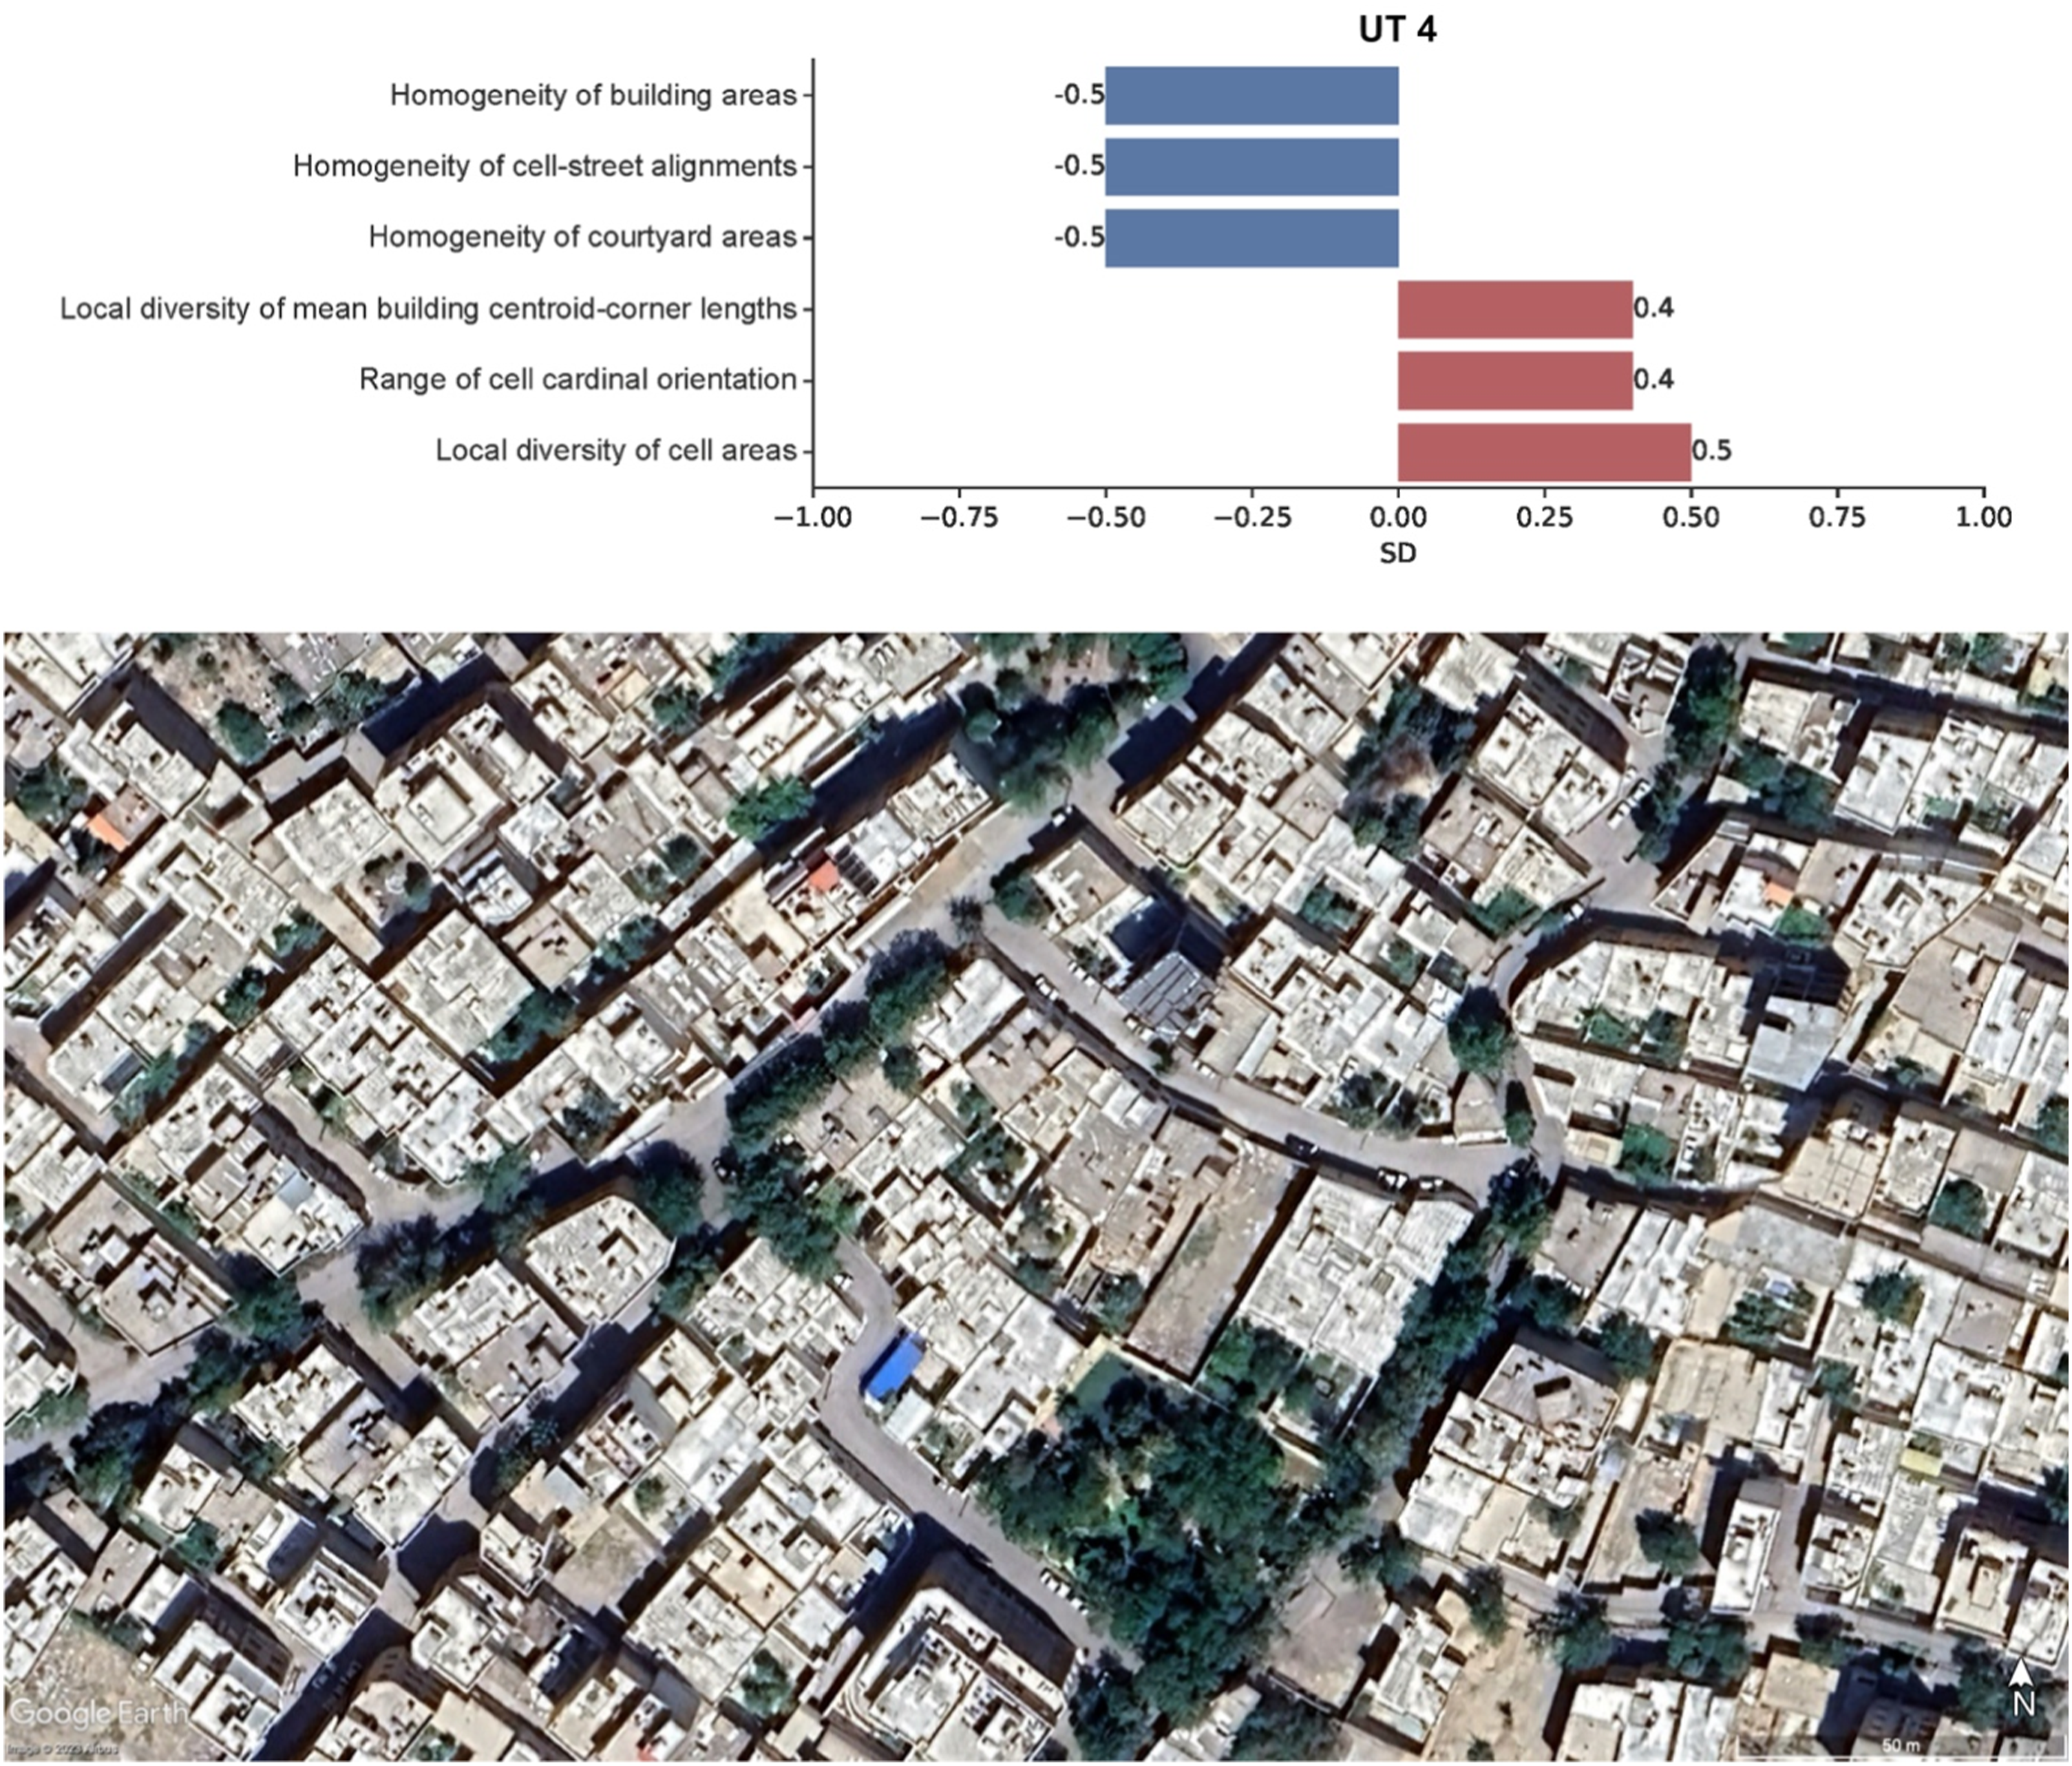
In UT2, the top three positive divergent contextual characters are (Figure 5, top): local diversity of cell areas (0.6 SDs), local diversity of building squareness (0.6 SDs) and local diversity of mean building centroid-corner lengths (0.5 SDs). The most negatively divergent characters are: homogeneity of courtyard areas (−0.7 SDs), homogeneity of building areas (−0.6 SDs), and homogeneity of mean building centroid-corner lengths (−0.6 SDs). The ensemble of these characters suggests an organic urban fabric characterised by plots of different sizes and building footprints with various sizes, shapes, and courtyard areas (Figure 5, bottom). Strongest descriptors of UT2 (measured in SDs), top. Satellite picture of a portion of UT2, bottom. Google Earth data: ©2022 Maxar Technologies.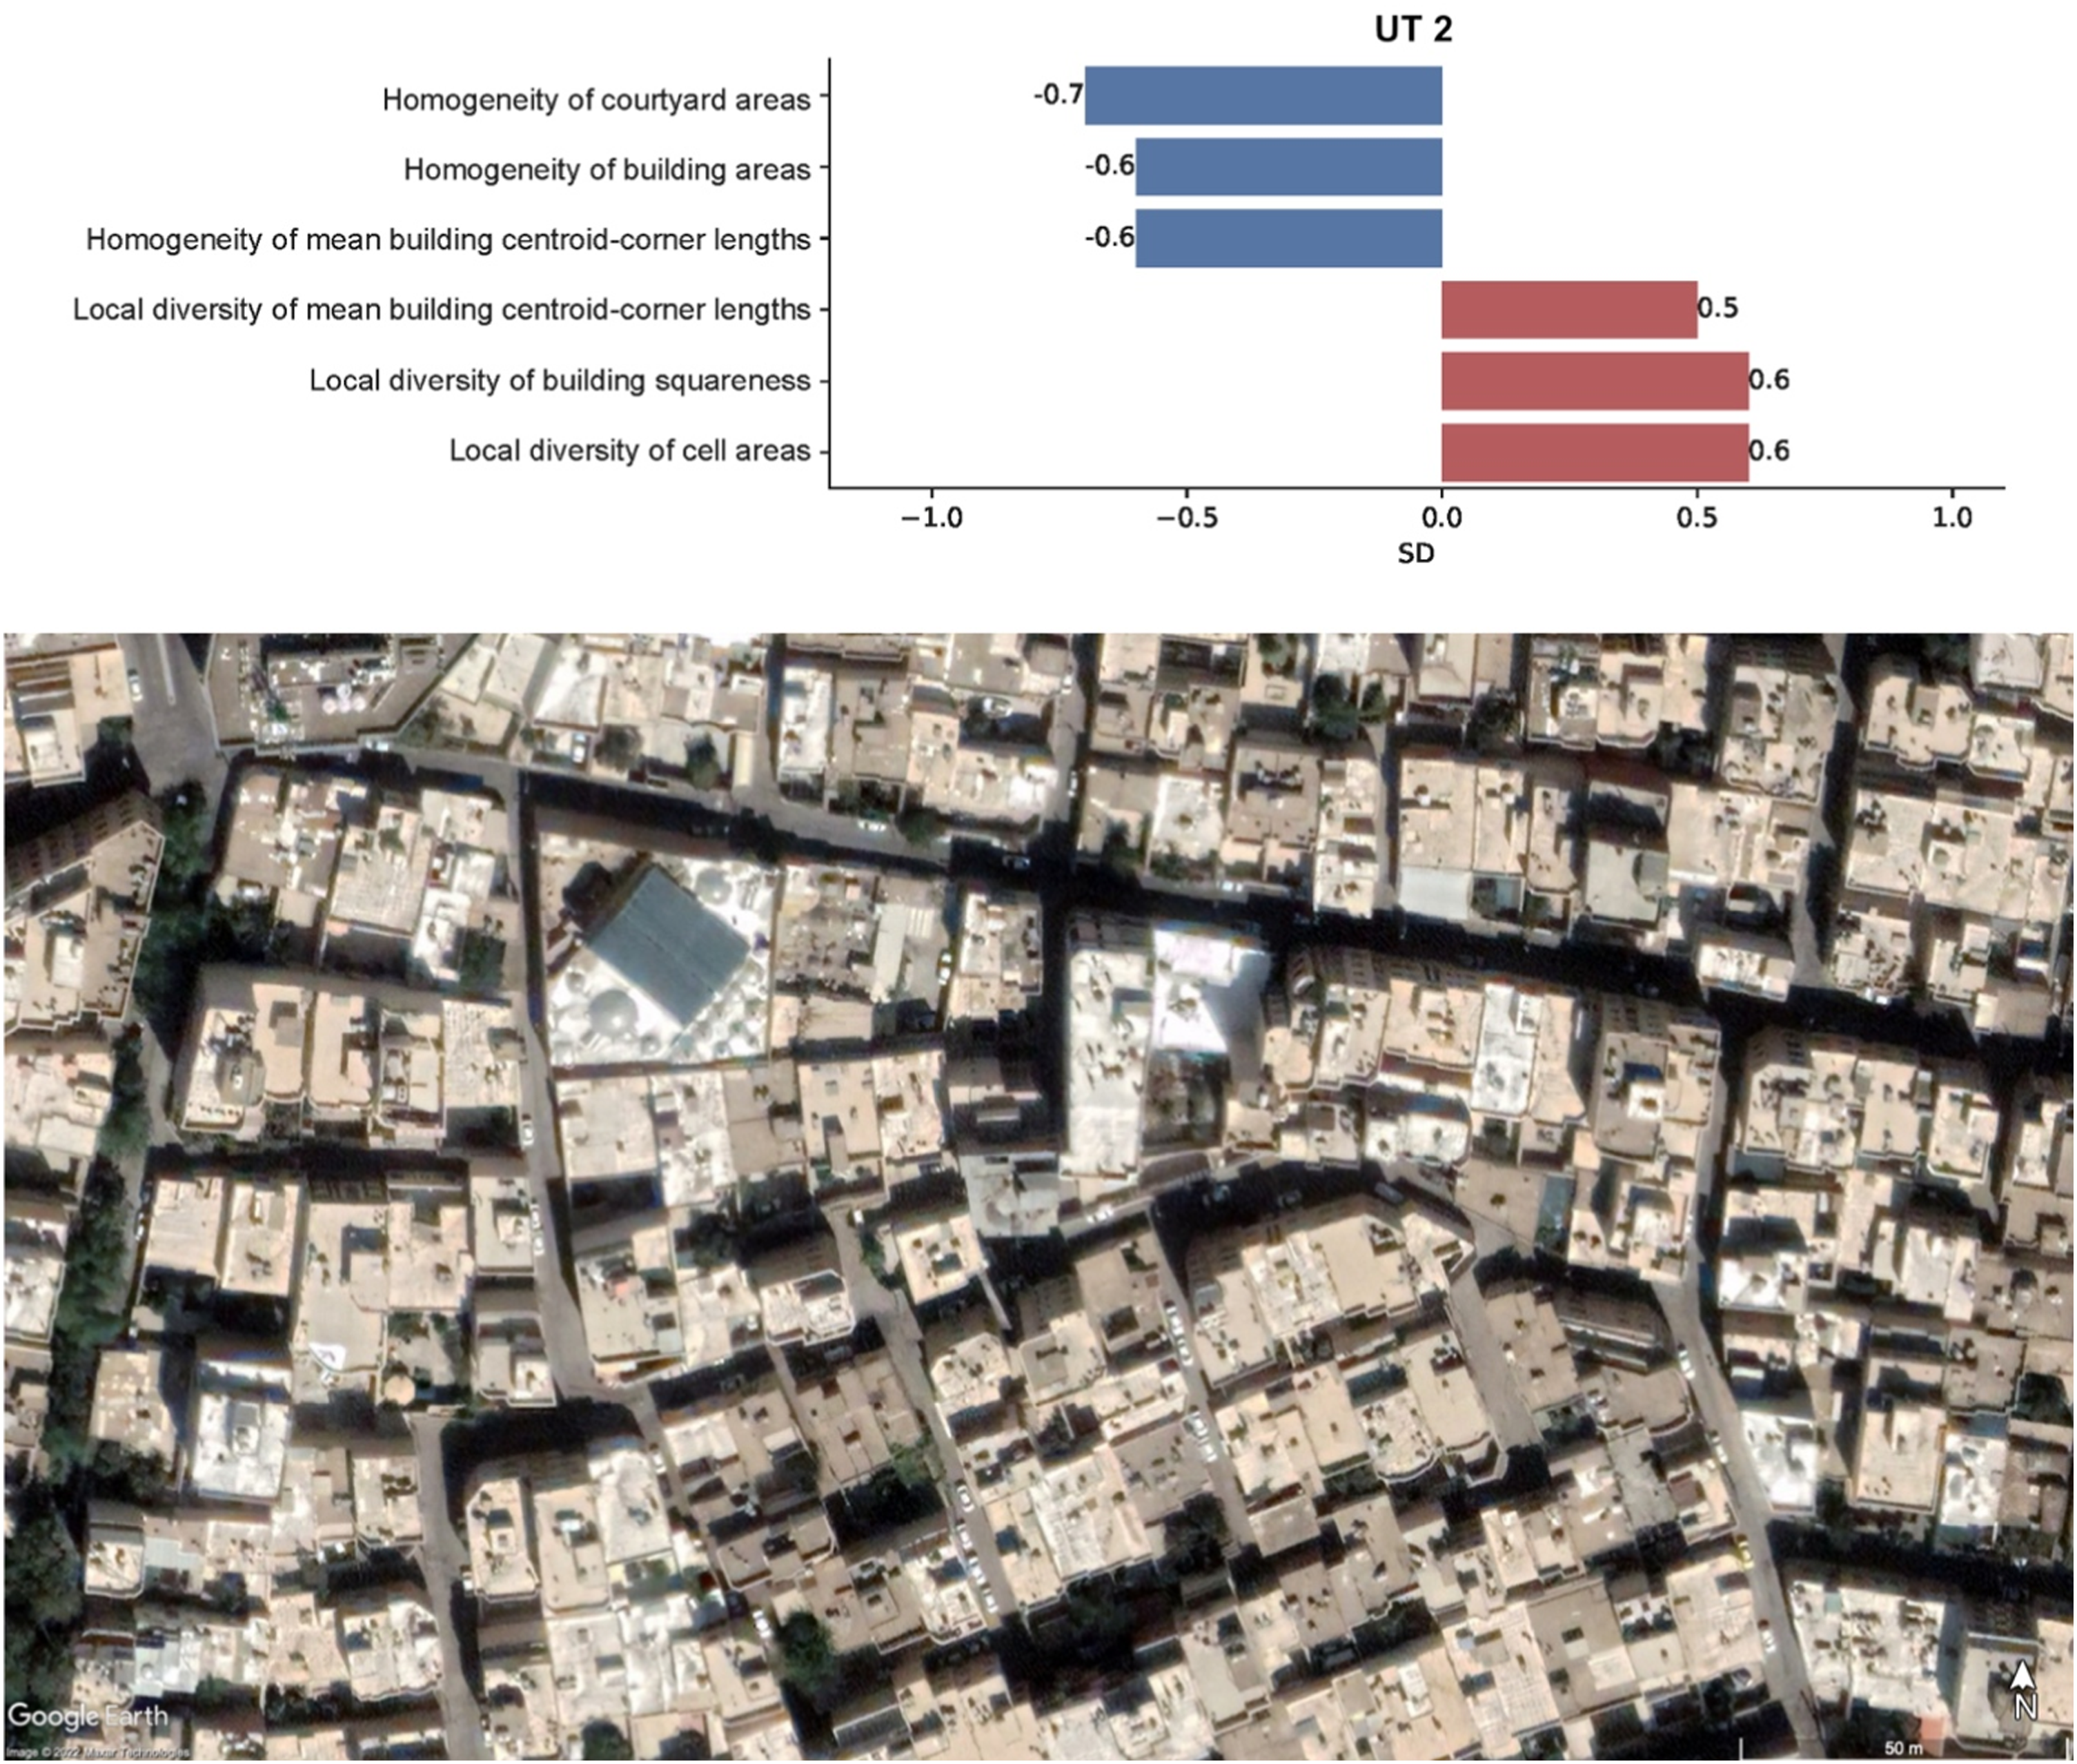
The form of the UTs with the strongest positive impacts on IMD: UT9 and UT0
In UT9, the three most positively divergent characters are: homogeneity of cell-street alignments (0.9 SDs), homogeneity of building oblique corners (0.8 SDs), and homogeneity of building areas (0.8 SDs). The three most negatively divergent contextual characters are (Figure 6, top): local diversity of building areas (−0.8 SDs), local diversity of cell-street alignments (−0.7 SDs), and local diversity of building elongation (just above −0.7 SDs). The combination of these values points to a very homogenous urban fabric characterised by buildings with very similar areas, alignments to streets and footprint shapes (Figure 6, bottom). Strongest descriptors of UT9 (measured in SDs), top. Satellite picture of a portion of UT9, bottom. Google Earth data: ©2022 Maxar Technologies.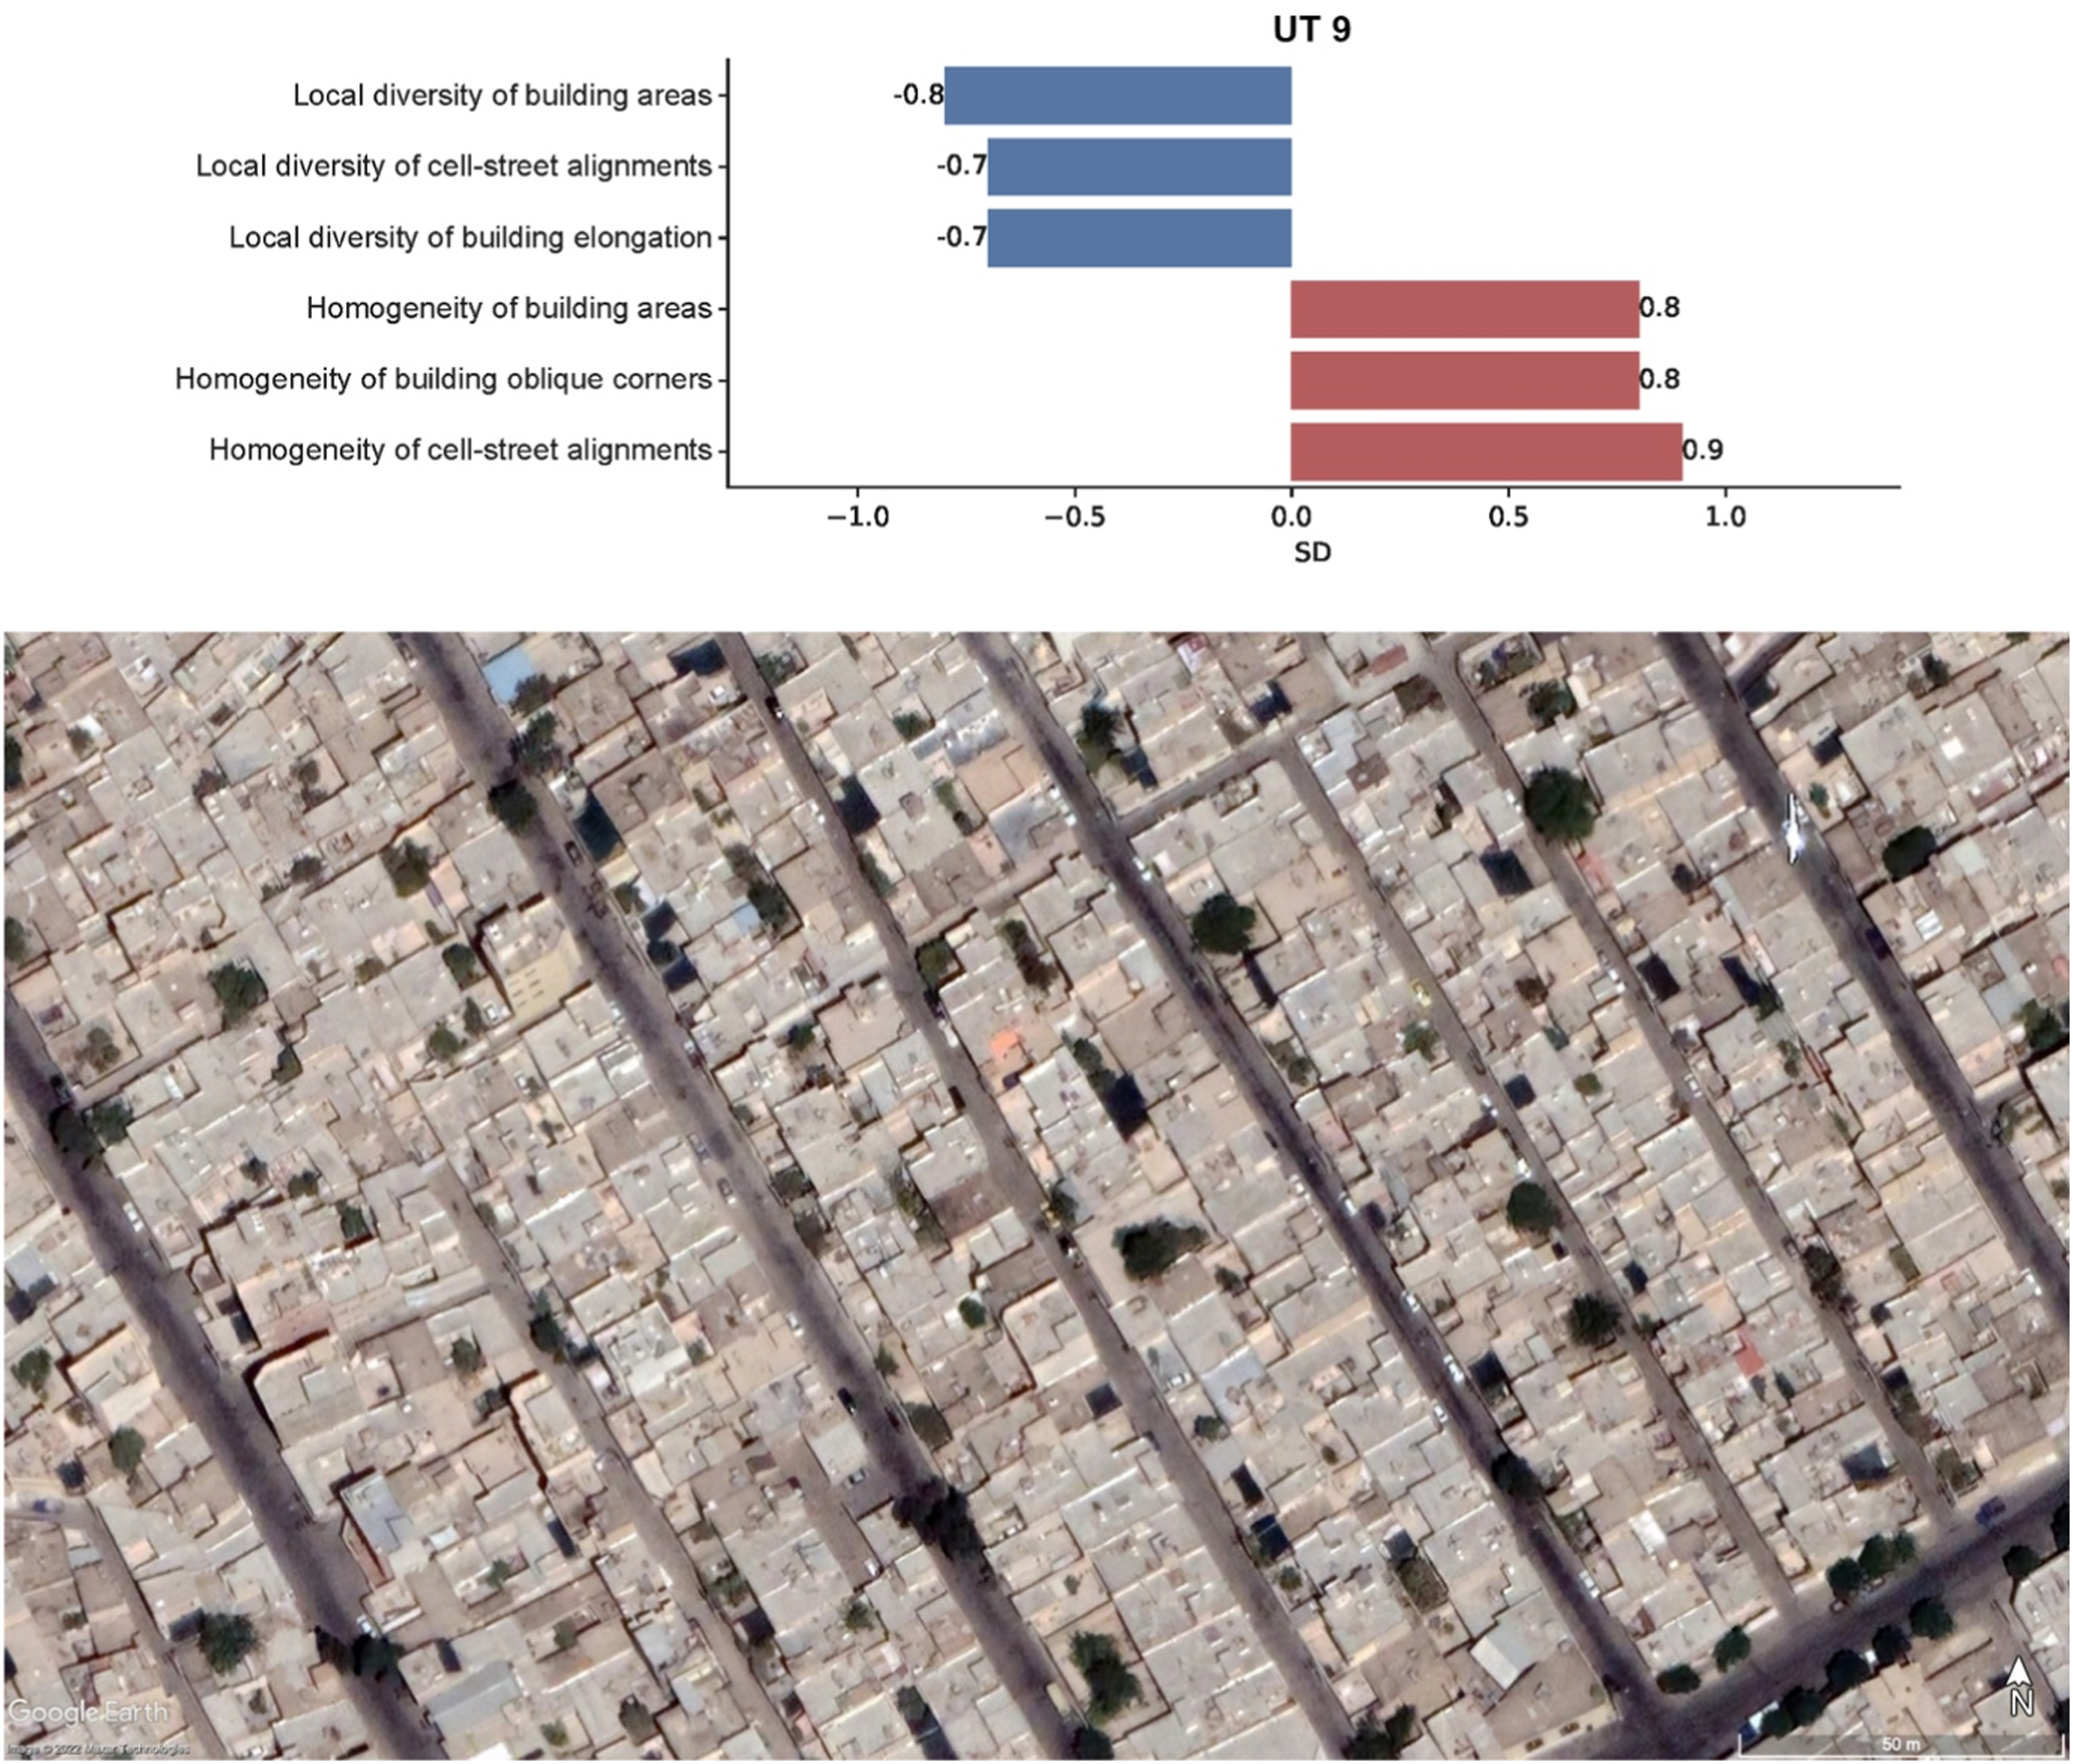
In UT0, the top three positive divergent contextual characters are (Figure 7, top): range of footprint complexity (1.7 SDs), mean of footprint complexity (1.6 SDs), and mean of shared walls ratios (SDs). Conversely, the most negatively divergent characters are: local diversity of building squareness (−1.3 SDs), homogeneity of reached areas from neighbouring street intersections (−1.3 SDs), and homogeneity of deviations of building centroid-corner length (−0.7 SDs). This combination of characters hints to an intricate, dense, and, at the same time, repetitive urban fabric characterised by similarly sized plots and buildings with complex footprint shapes, tightly knit with one another and relatively similar dimensions (Figure 7, bottom). Strongest descriptors of UT0 (measured in SDs), top. Satellite picture of a portion of UT0, bottom. Google Earth data: ©2022 Maxar Technologies.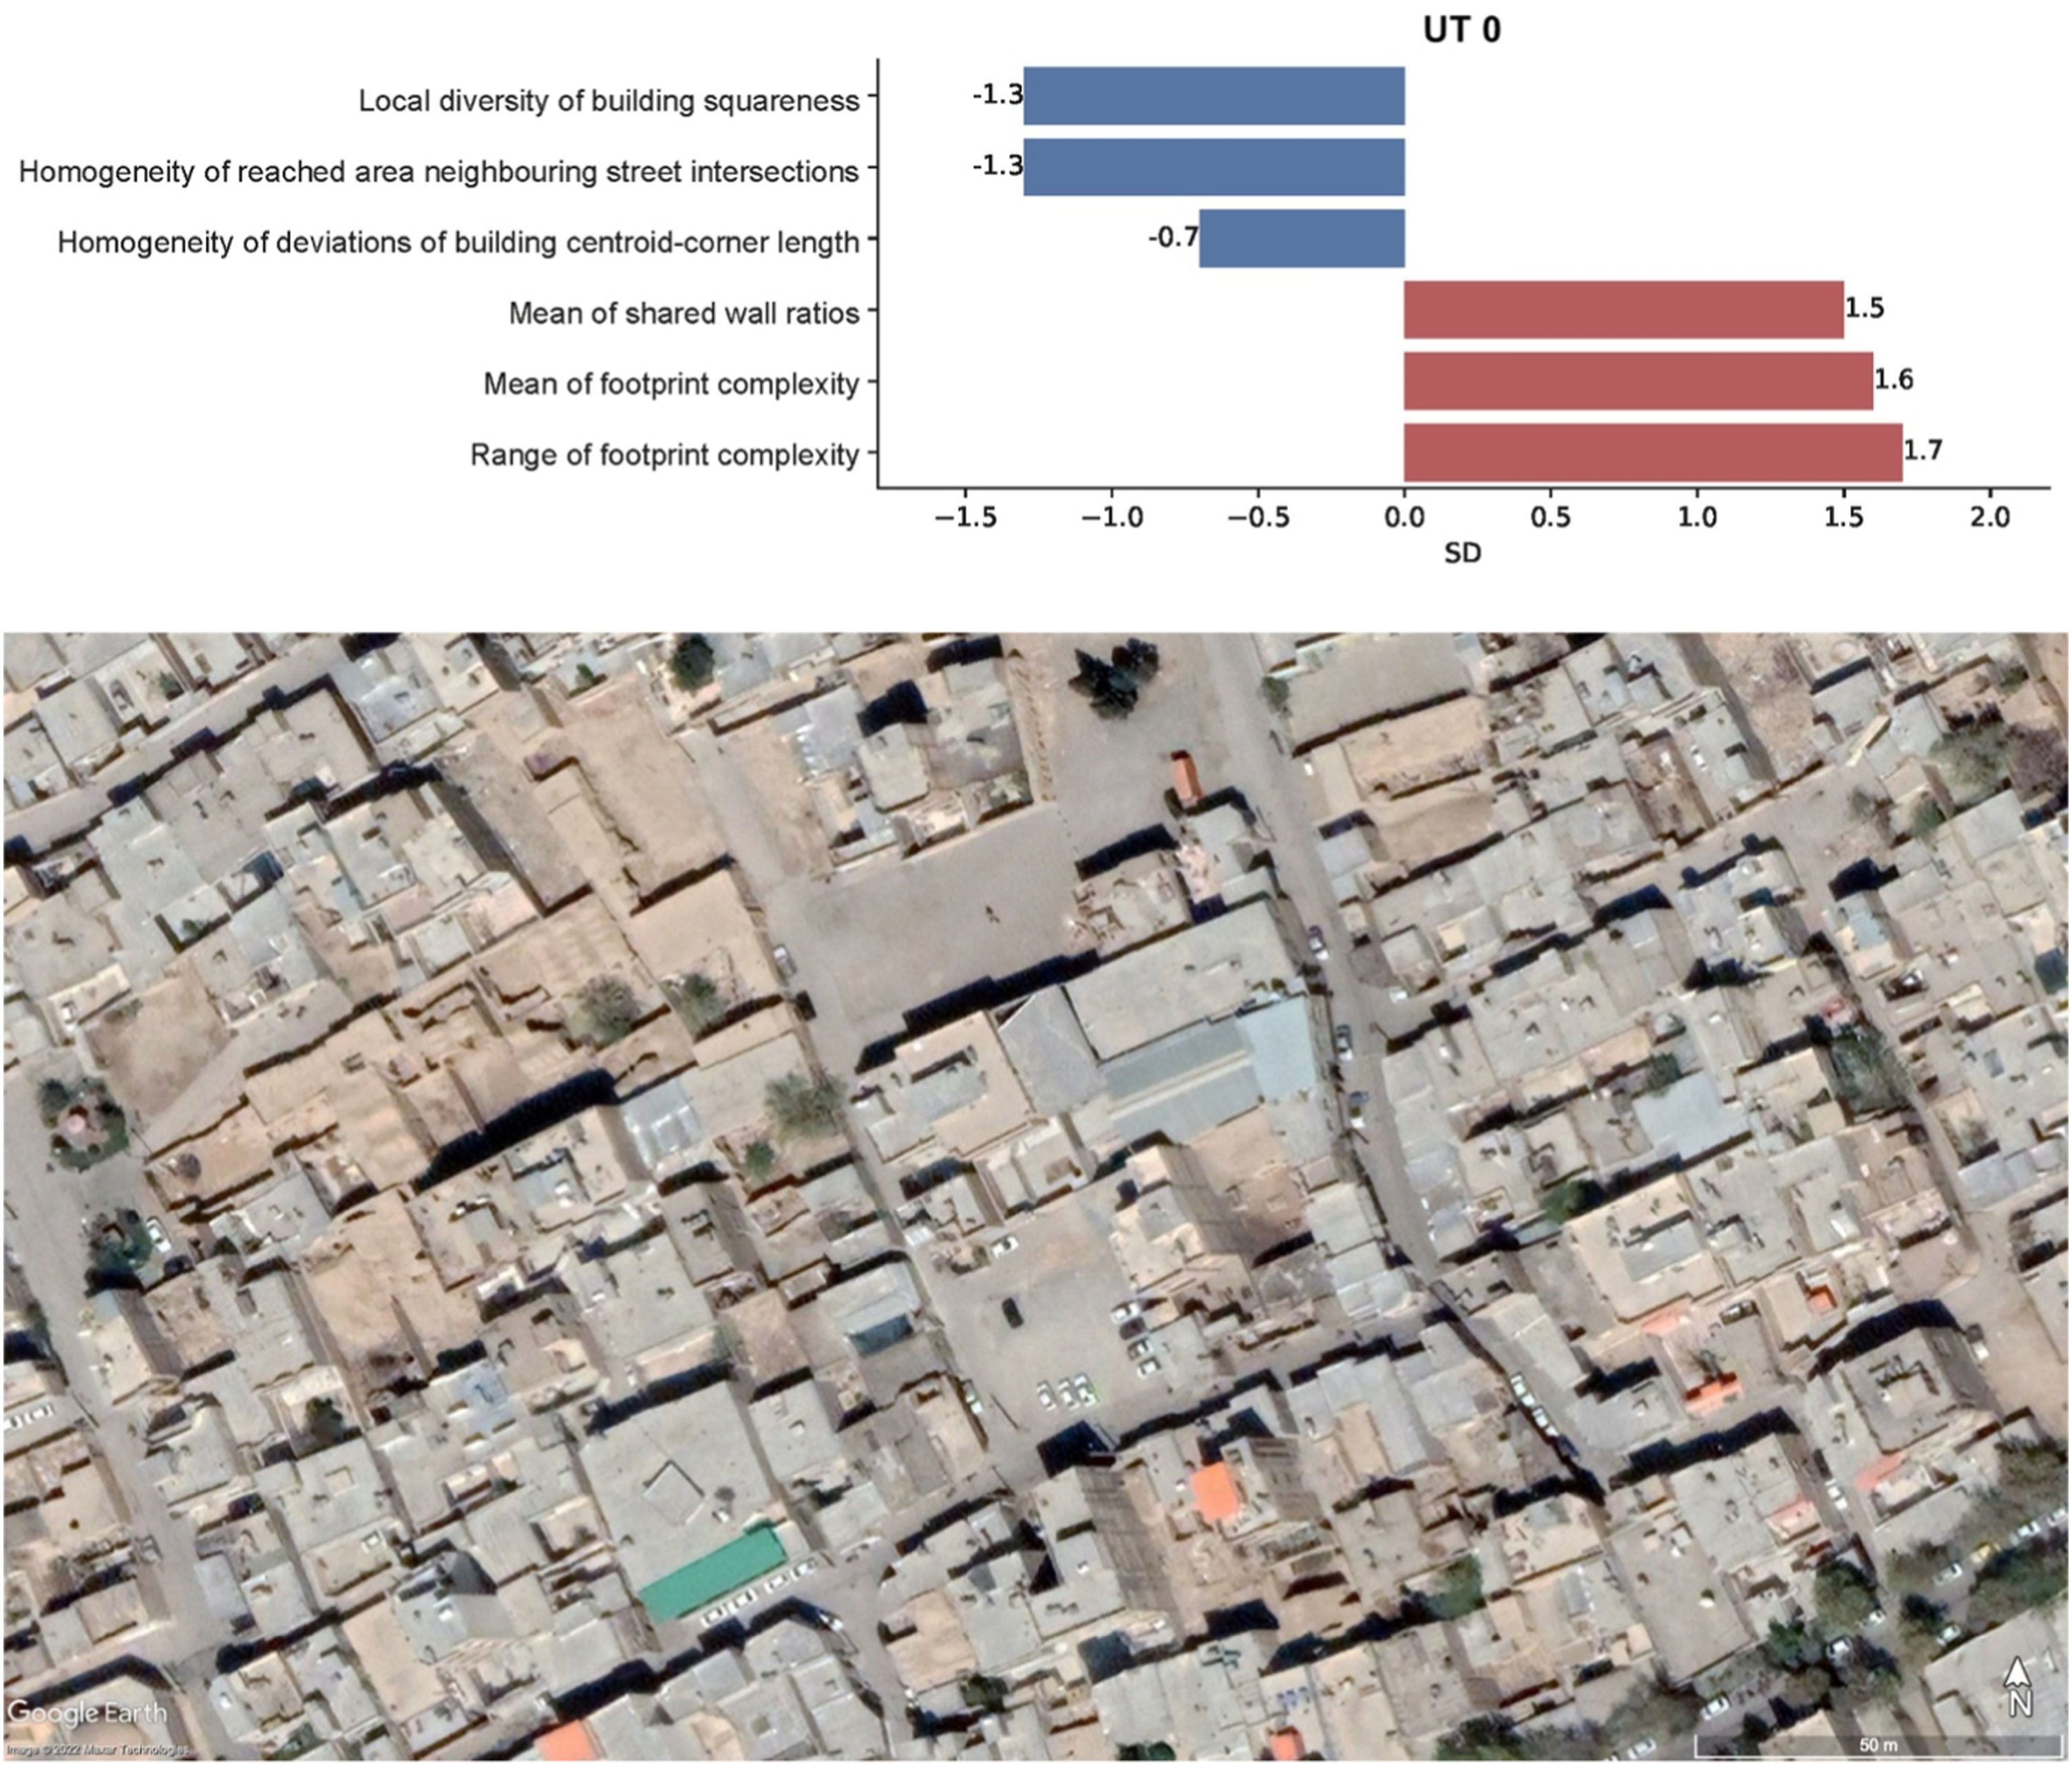
Discussion
Outcomes suggest that the UTs least and most associated with deprivation, except UT9, are similar and show organic urban fabrics, with large variations in terms of building and plot areas. However, while the former show the presence of courtyards of different sizes (a feature possibly associated with higher socioeconomic standings) and more regularly shaped building footprints and plots, the latter features above-average levels of footprint complexity, likely indicating an overly chaotic urban fabric in the process of consolidation. Indeed, UT0 is located in the western periphery of Isfahan and still features patches of agricultural land intertwined within its urban fabric. UT9 is a separate case as it features a particularly rigid and repetitive urban fabric, likely indicating top-down planning.
Urban form is not the only element related to the spatial distribution of deprivation. Further factors such as proximity to desirable landscape features (e.g. rivers, parks), distance to the city centre, and land value, also play important roles. Bagheri and Shaykh-Baygloo (2021) suggest that distance from the centre and proximity to the Zayandehrood River are the main drivers of house prices in Isfahan, which, in turn, affect both housing typologies (larger mansions close to the river vs smaller and more tightly knit ones far from it) and the distribution of social classes. Indeed, the two UTs (4, 2) with the strongest negative association with deprivation, are close to both city centre and the Zayandehrood River and feature larger average building footprints (135 and 139 m2, respectively). Conversely the two UTs (9, 0) showing the strongest positive association with deprivation are located further away from the city centre to the far West and North-East fringes of Isfahan and feature more modest properties with average building footprints of 90 and 109 m2, respectively. A plausible reason for this spatial distribution lies in the hydrological profile of the city: the abundance of irrigation canals (madi) makes this area particularly fit for agriculture and likely to attract less advantaged residents. On the other hand, a high proportion of non-Iranian (Afghani) population of modest background, largely employed in the construction industry, occupies neighbourhoods roughly corresponding to UT9 (Golestannejad, 2019).
Our study, however, does not exclusively focus on the geography of deprivation in Isfahan, nor on that of the spatial distribution of certain characters of urban form, but rather on the relation between deprivation and patterns of urban form (UTs). It is thus legitimate to ask to what extents outcomes are aligned to those of the studies mentioned in the Introduction.
From a street centrality perspective, average values of local closeness, a measure of street network interconnectedness, are similar across the UTs most and least associated with deprivation (varying between 0.07 and 0.08) and comparable to the average value across the entire city (0.07), thus indicating that both less advantaged and better-off areas have similar levels of local connectivity. This finding seems not to align with previous research suggesting that places disproportionally featuring less connected streets (e.g. alleys, cul-de-sac) are associated with more deprived residents (Carpenter and Peponis, 2010; Vaughan, 2007; Vaughan et al., 2005; Vaughan and Geddes, 2009;), poorer movement economy (Hillier, 1996), and fewer commercial and economic activities (Porta et al., 2012). From a configurational perspective, the UTs most and least associated with deprivation tend to have similar, compact, and dense urban fabrics (covered area ratio varies between 0.46 and 0.54). This does not seem aligned with Venerandi et al. (2018) who found that the most deprived neighbourhoods of urban UK show the co-presence of high population density, large portion of unbuilt land, and presence of cul-de-sac, that is, features largely associated with modernist developments. A plausible reason for these misalignments lies in the different ways Isfahan and western cities developed over time. While the former grew mostly informally, in a piecemeal fashion, through plot-based densification processes happening over time, western cities mainly expanded through top-down approaches, which generated less compact and connected peripheries, often accommodating the least advantaged sections of the population. Thus, while western cities tend to show the pattern dense/well-connected urban fabrics and better-off population in the historical centres and directly adjacent areas, in Isfahan, this pattern is inexistent due to the morphological continuity of its largely informal urban development.
We acknowledge four main limitations for this study. First, the choice of the optimal number of UTs is based on a heuristic technique thus 12 might not be the ideal solution for Isfahan. However, several options were mapped, and such a solution seemed the optimal after comparison with historical/morphological patterns of the city. Second, the outputs of this work do not imply causation. However, they can still be used to inform local decision making together with further assessments (e.g. in situ surveys). Third, while the investigation on possible co-factors related to deprivation supports the findings, such co-factors were not statistically tested due to lack of data. Finally, due to the word limit, only the four UTs most associated with deprivation were described through their most divergent characters. However, such information for the remaining UTs is presented in Figure S5 in the Supplementary Material. For the very same reason, descriptions of the UTs most associated with deprivation are limited to the six most divergent contextual characters.
Conclusions
Quantifying the socioeconomic deprivation of populations is a long-standing endeavour dating back to the 19th Century with the seminal work by Booth. As much as mapping deprivation is important, understanding its root causes also is. While social aspects of deprivation have been explored, the contribution of urban form has hardly been studied at the small scale and, when this was achieved, only a handful of metrics were considered. In this paper, we applied UMM, a technique for the identification of UTs based on the clustering of 200+ characters of urban form at the building level, to analyse the relationship between UTs and deprivation in Isfahan. Four UTs out of 12 show the strongest relative association with deprivation. UTs characterised by building footprints below the city average, organised in repetitive urban fabrics, with similar shape and orientation (UT9), or in organic and overly chaotic ones, with complex shapes (UT0), are positively associated. Conversely, UTs characterised by building footprints above the city average and highly heterogeneous buildings, courtyards, and plots (UT4 and 2) are inversely associated. A comparison with domain-specific literature suggests that, in Isfahan, which growth mainly occurred informally, local connectivity and density are common features across the whole city and are thus not relevant for deprivation, as in western case studies, where, conversely, this pattern is more marked and characterised by a stronger centre-to-periphery effect. Finally, the replicability of the methodology allows the analysis of further case studies to extend our knowledge of the relationship between urban form and deprivation, eventually informing planning and policy making.
Supplemental Material
Supplemental Material - Urban form and socioeconomic deprivation in Isfahan: An Urban MorphoMetric approach
Supplemental Material for Urban form and socioeconomic deprivation in Isfahan: An Urban MorphoMetric approach by Alessandro Venerandi, Alessandra Feliciotti, Safoora Mokhtarzadeh, Maryam Taefnia, Ombretta Romice and Sergio Porta in Environment and Planning B: Urban Analytics and City Science
Footnotes
Declaration of conflicting interests
The author(s) declared no potential conflicts of interest with respect to the research, authorship, and/or publication of this article.
Funding
The author(s) received no financial support for the research, authorship, and/or publication of this article.
Data availability statement
Data on socioeconomic deprivation and urban form for the 155 neighbourhoods of Isfahan is provided in geopackage format.
Supplemental Material
Supplemental material for this article is available online.
References
Supplementary Material
Please find the following supplemental material available below.
For Open Access articles published under a Creative Commons License, all supplemental material carries the same license as the article it is associated with.
For non-Open Access articles published, all supplemental material carries a non-exclusive license, and permission requests for re-use of supplemental material or any part of supplemental material shall be sent directly to the copyright owner as specified in the copyright notice associated with the article.