
Abstract
While most of us take wayfinding and orientation for granted, instinctively utilizing our visual channels to do so, millions of blind people around the world face challenges and obstacles when attempting to perform the most basic tasks, such as walking to the corner store or using public transportation. As blind pedestrians lack critical information about the space they traverse outside the familiarity of their home, they are restricted, dependent on others, and have decreased quality of life. While assistive technologies for providing specific navigation solutions do exist, research is still limited regarding customized wayfinding solutions for blind pedestrians. This research aims at developing a wayfinding algorithm that relies on the OpenStreetMap mapping catalogue for planning accessible and safe routes specifically suited to blind pedestrians. In-depth investigations, observations, and interviews were conducted with blind people and with orientation and mobility instructors, in order to define and categorize spatial criteria relating to mobility, accessibility, and safety. Using controlled iterative experiments, weighted network graph criteria were defined, leading to the development of a route planning software that generates optimized routes for blind pedestrians. The developed software was then tested on a variety of routes, with the help of blind volunteers and orientation and mobility instructors. The results show that the optimal routes generated by the software were identical or very similar to those suggested by the experienced orientation and mobility instructors. Moreover, the blind volunteers also stated that the software planned routes were indeed more accessible and safer for them to walk along compared to routes suggested by existing commercial software developed for seeing pedestrians. The findings of this research indicate that our solution, based on OpenStreetMap and developed for the benefit of blind pedestrians, is effective and practical, and could improve the mobility, independence, and quality of life of this population, as well as increasing their integration into society.
Introduction
For most pedestrians, it is a matter of course to choose the shortest, most convenient route, utilizing their innate wayfinding skills and perceptual and cognitive structures of space into spatial information. Yet, for people who are blind, this so-called simple task is often complex and even dangerous. In 2018, the World Health Organization 1 estimated that 36 million people around the globe are blind. These blind pedestrians are unable to take advantage of landmarks and road networks for orientation purposes, nor are they able to instinctively avoid obstacles, such as road cracks, sidewalk benches, and areas shared by pedestrians and vehicles or bikes, without the help of assistive technologies, guide dogs, or seeing people. As a result, their mobility and independence are often restricted, rendering them housebound and with decreased well-being (SSMR, 2009).
Although navigation tools for blind pedestrians have greatly developed in recent years, comprehensive customized wayfinding solutions are still lacking. Smartphone mobility applications, which mainly rely on the Global Navigation Satellite System (GNSS) sensor, assist blind pedestrians in their conducting of daily activities, such as catching a bus (e.g. Step-Hear 2 ), reading road sign text, and identifying their exact location (e.g. Sendero Group 3 , GeorgiePhone 4 ). Other technologies offer real-time obstacle detection and classification, based on video streams and photos (e.g. OrCam 5 ). While these technologies are important and contributory, no comprehensive solution currently exists for providing blind pedestrians with safe, accessible, and convenient routes tailored to their needs and preferences.
With the aim of developing a wayfinding tool specifically suited to blind pedestrians, this study examined the use of OpenStreetMap (OSM) for geospatial data mapping and optimized walking route planning. OSM is an open-data mapping project based on Volunteered Geographic Information and participatory mapping, whereby any person in any location can add or update features on the map. Data can also be integrated from various sources, resulting in powerful, flexible, and updated mapping services. While optimal routes for seeing pedestrians are generally the shortest or fastest routes (generated by most commercial route planning software accordingly, such as Google Maps), this is not the case for blind pedestrians, as their optimal path must be the safest and most accessible route. To date, no solution enables the combining of OSM map data with optimal weighted network graphs that rely on spatial criteria specifically relevant to blind pedestrians.
In this study, we created a weighted network graph based on OSM data and developed a unique route-planning algorithm tailored to the wayfinding requirements of blind pedestrians. To understand which environmental features and abstract phenomena impact the wayfinding and navigating capabilities of blind pedestrians, we conducted interviews with orientation and mobility instructors (OMIs) and with blind pedestrians and observed the physical wayfinding challenges of the latter. Based on the gathered insights and understandings, we built a criteria system of obstacles, preferences, and strategies that could then be translated and materialized through the OSM map data into practical, computerized solutions. Finally, a weighted network graph was created for quantitating the accessibility and safety level of each network road segment, resulting in the recommending of the most optimal route for blind pedestrians from the point of origin to the point of destination.
Implementing the study’s promising results and scientific insights in assistive navigation systems could enhance the independence of blind pedestrians and optimize their wayfinding and navigation in urban environments. Moreover, the knowledge gathered in this study could provide policymakers and urban planners with an applicable tool for designing smart walkable cities that are accessible to blind and seeing pedestrians alike.
Literature review
Mobility and navigation of blind people
Cognitive mapping enables individuals to process and manage spatial information about their physical location. This is key to creating a conceptual model of the surrounding space and nearby objects necessary for successfully completing activities of navigation and orientation in urban environments (Fernandes et al., 2017). Blind pedestrians, however, face both physical difficulties and increased cognitive and sensory loads while navigating and cognitively mapping new environments, resulting in higher rates of falls and injuries and undesirable social isolation compared to seeing populations (De Boer et al., 2004). Although adept at compensating for missed visual information through their increased awareness of environmental cues and navigational aids, navigating in urban environments is often challenging and even dangerous for blind pedestrians, because of obstacles on roads and sidewalks (Yang et al., 2011). While existing audible traffic signals and landmarks enhance their navigation capabilities and safety (Timothy and Weyrer, 2013), navigation solutions suited specifically to blind pedestrians are still lacking, as is research on their perspectives regarding needs, preferences, and experiences during navigation (e.g. Shangguan et al., 2014). In terms of wayfinding, blind pedestrians would rather take a longer but safer route to their destination, compared to seeing pedestrians who prefer the shortest or quickest route (Miesenberger et al., 2008), and also require the inclusion or exclusion of geographic features to make the route more accessible to them (Völkel and Weber, 2008).
Open source geographic data
Geographic crowdsourcing and participatory mapping paradigms (GeoWeb 2.0) are commonly used for contributing and uploading geographic data by groups of people who have the potential to replace surveying experts and professional cartographers in their mapping tasks (e.g. Koukoletsos et al., 2012; Sester and Dalyot, 2015; Shangguan et al., 2014). In terms of data completeness and accuracy, research advocates the maturity of crowdsourced geographic sources (e.g. Neis and Zielstra, 2014; Völkel and Weber, 2008) following the event-based update processes for providing immediate environmental data and information. Unlike formal mapping sources, crowdsourced data sources are adaptable and adjustable in terms of the mapped environmental features, providing navigation applications tailored to specific populations. By providing rich environmental features that are augmented with continuously updated and comprehensive geospatial data (such as accessibility features), crowdsourced maps offer important data that can be used for augmenting navigation processes (Goodchild, 2007).
Researchers have examined the generation of specific maps and information communications from OSM (Miesenberger et al., 2008) and the use of user-generated content for navigation and wayfinding among blind people (Chen et al., 2015). The generation of worldwide tactile maps based on OSM is an example (Miesenberger et al., 2008). Another approach presents non-visual forms of OSM data representation using haptic and auditory feedback, to enable blind people to interpret graphical information (e.g. Kaklanis et al., 2013; Rehrl et al., 2012).
Assistive technologies for blind pedestrians
The most widespread assistive tools currently used by blind pedestrians include guide dogs and white canes. However, this leads to performance that is limited in speed, coverage, and capacity (Bledsoe, 1997). Therefore, the research attempts to develop new assistive technologies and applications. Studies on the navigational experiences of people with little to no functional vision (e.g. Banovic et al., 2013; Williams et al., 2014) found that blind pedestrians need to be aware of their physical location, their relation to the surrounding environment, and the route they must follow in order to be able to navigate to a desired destination (Song and Yang, 2010). Researchers have also addressed the use of technology as a means for enabling blind pedestrians to identify their location and orientation and successfully navigate in their surroundings (Fernandes et al., 2017). Some technologies require the user to carry extra equipment to perceive nearby objects, such as NavGuide, an electronic device that assists visually impaired people in avoiding obstacles along their way (Patil et al., 2018). Other technologies promote electronic white canes that can sense pre-placed tags on the floor (Fernandes et al., 2014), or portable robotics and tiny passive radio frequency identification sensors embedded in indoor surroundings (Kulyukin et al., 2006). Nowadays, most solutions are hybrid smartphone applications that use numerous embedded sensors. For example, GNSS, WiFi, accelerometers, magnetometers, compasses, or gyroscopes, used to track the user’s location, direction, velocity, and acceleration. These are usually combined with camera, sonification and text-to-speech mechanisms for providing relevant information (e.g. audible navigation information of street names and landmarks) that will assist blind pedestrians in crossing the road safely (Guy and Truong, 2012) or detecting road obstacles (e.g. Brock and Kristensson, 2013; Liu et al., 2015). Alternatively, real-time GNSS data may be converted by a dedicated software into directions and then encoded as vibrations that are conveyed into the user’s shoe (Velázquez et al., 2018). However, while these existing assistive technologies enhance the mobility of blind pedestrians, they do not provide sufficient information about the space these people are traversing or about the path they plan to travel. As a result, blind pedestrians still require a tailored route planning design that can generate safe and accessible routes and include important features, such as sidewalks, landmarks, acoustical traffic signals, tactile paving, and road inclines, while excluding more dangerous and less accessible routes that include road barriers and potential hazards. This study, therefore, attempted to develop a wayfinding tool especially suited to blind pedestrians, based on the continuously updated geospatial OSM.
Methodology
Interviews and observations
In order to develop an algorithm for planning optimized walking routes for blind pedestrians, we first needed to understand what renders a route safe and accessible for this specific population – especially in urban environments. To do so, methodical, user-centered interviews were conducted with both blind pedestrians and OMIs, which is summarized in Table 1. The instructors were mainly from Migdal-Or, a non-profit organization that provides rehabilitation services for people with visual impairment or blindness throughout Israel. These highly trained instructors have knowledge and extensive experience in serving numerous blind people every year. We also observed the participants navigating in an urban environment and participated in training sessions with blind pedestrians, where users practiced their routes with the guidance of the OMI. Our main focus were understanding the concerns of blind pedestrians when walking in urban environments, what renders navigating along a certain route either challenging or accessible, and which methods most help blind pedestrians improve their wayfinding and navigation capabilities.
Summary of interviews and design techniques, including several participants. a
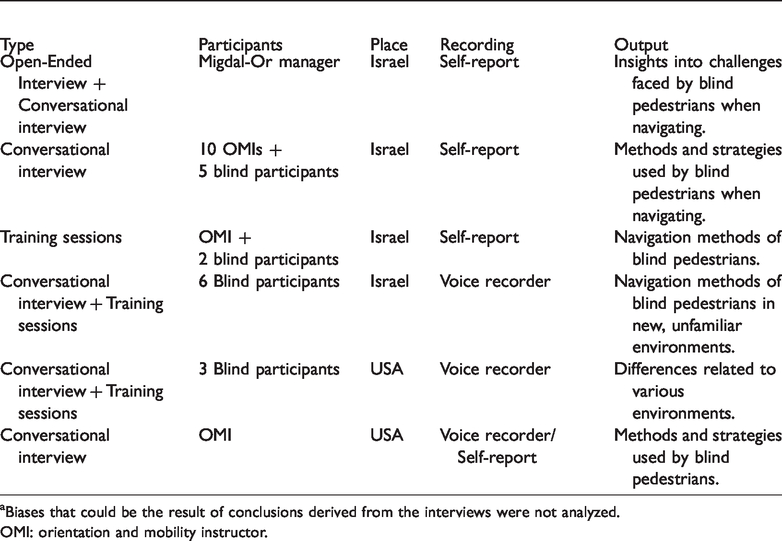
aBiases that could be the result of conclusions derived from the interviews were not analyzed.
OMI: orientation and mobility instructor.
Following these observations and interviews, the main insights were translated into seven central spatial and environmental elements relating to the wayfinding of blind pedestrians, including, complexity, landmarks, accessible aids, roads, obstacles, intersections, and personal preferences.
Complexity: Straight, linear paths are preferred routes for blind pedestrians, especially those near a road or with distinct, identifiable borders (e.g. grass or curb), compared to geometrically complex routes with bends and turns. Landmarks: Permanent, stationary landmarks, such as restaurants, traffic lights, trees, and bus stops, are meaningful elements that could assist blind pedestrians in their wayfinding activities. Accessible aids: These devices convey information about WALK/DON’T WALK intervals at signalized intersections, using non-visual formats to help blind pedestrians. However, while accessible pedestrian signals (APS) and tactile paving near street crossings are mostly helpful devices for wayfinding, the interviews showed that blind pedestrians can manage without them. Roads: These features assist blind pedestrians with orientation through their delivery of sound, thereby conveying the oncoming cars (traffic) and their direction. Obstacles: Elements that hinder the wayfinding of blind pedestrians should be avoided in route planning solutions, and include roundabouts, city squares, parks, parking lots, and lanes shared by pedestrians and vehicles. Parks, for example, often lack straight paths and additional valuable spatial clues, and squares are often crowded and tumultuous. Intersections: The degree of safety and accessibility for blind pedestrians varies from intersection to intersection. Less recommended intersections include those with obstacles that could prevent vehicle drivers from seeing a blind pedestrian, and those with a greater number of intersecting roads, as they create a more complex geometric and spatial intersection. Traffic control elements, such as crosswalks, pedestrian-directed traffic signals, and roundabouts, can either decrease or increase the safe crossing of blind pedestrians. In many cases, blind pedestrians prefer to avoid uncontrolled crossings, even if they would have to walk further to cross at a safer, more accessible intersection. T-junctions are the preferred shape for blind pedestrians, as they enable paying greater attention to all directions of oncoming traffic. Personal preferences: While blind pedestrians place an emphasis on safety, many do prefer shorter routes when possible. Moreover, blind pedestrians with guide dogs have less difficulty walking along streets with bends and turns, compared to those who walk with a cane. In other words, it is important to take into account differences in personal preferences between blind pedestrians, as with any type of population.
Defining weighted network graph criteria using OSM data
OSM utilizes topological data structures that include the following four core elements: Nodes – points with a geographic position (e.g. landmarks); Ways – ordered lists of nodes that represent either a polyline (i.e. linear features, such as streets and rivers) or a polygon (closed shapes, such as forests, parks, parking areas, and lakes); Relations – relationships between existing nodes and ways (e.g. turn restrictions on roads); and Tags – “key=value” pairs (such as “amenity=shop”) for storing metadata about map objects (e.g. type name, and physical properties). In order to plan optimal routes for blind pedestrians, a weighted network graph is built. The weights are sets of costs formulated as criteria that depend on the geometric and topologic attributes of each way segment and are derived from the seven central spatial and environmental elements established in “Interviews and observations” section (complexity, landmarks, etc.). To aggregate these seven costs for our algorithm, the following four criteria were defined:
Length: Whenever possible, pedestrians (both seeing and blind) prefer to walk shorter routes to their destination. Thus, the Length cost for each way segment is calculated based on its length value, i.e. the longer the route, the greater the cost. Complexity: Blind pedestrians often find routes with bends to be more complex for navigation. The greater the number of bends, the greater is the challenge. Therefore, the number of substantial bends (with an angle of at least 45°, a value selected after consulting with OMI) along a given route impacts the cost, whereby the greater the number of bends, the larger the cost. Landmarks: Local landmarks (such as bus stops and bakeries) are important and necessary for successful navigation. In this study, landmarks that are easily accessible and identifiable for blind pedestrians and are within 1.5 m of a certain way segment decrease the cost; landmarks near decision points (such as intersections) have a lower cost. At this stage, all landmarks are given a similar cost, regardless of their type. Way type: We defined a scale of six ratings that are derived from the OSM “highway” tag keys to suit the population of blind pedestrians in terms of safety and accessibility: (1) preferred; (2) nice to have; (3) neutral; (4) less preferred; (5) better to avoid; and (6) must avoid. For example, the preferred rating (1) includes the “footway” key, a route that is solely dedicated to pedestrians. These are ideal for blind pedestrians as they enhance accessibility, provide surface quality, and eliminate other types of road users (such as cyclists or car drivers). The “steps” key, on the other hand, is significantly more challenging for blind pedestrians, and is therefore rated as less preferred (4), or as neutral (3) if it has a handrail. The “residential street” key or the “pedestrians” key (such as a city square) is rated as better-to-avoid (5). Even though, theoretically, pedestrians have priority over cars and bikes in pedestrian zones, these routes are not beneficial for blind pedestrians as they are usually too wide, too crowded, and are shared by additional users, such as cyclists and drivers. Finally, “service roads” and “unclassified roads” keys are ranked as must avoid (6), because they often include roads inside industrial areas, campsites, business parks, or car parks, and are used mainly by cars.
In addition to these six ratings, the way type includes two additional costs:
“Surface=grade” key: If the surface of the route is not well maintained, with potholes, fallen branches, etc., then the way cost will be decreased to a neutral (3) category. “Footway=crossing” key: If the footway also serves as a crossing, then the degree of control at the crossing will affect the cost as well.
Generating route planning weighted network graph
The workflow to create a weighted network graph was generated by utilizing ESRI’s ArcGIS ModelBuilder and Python scripts (for tasks such as retrieve data from OSM, processing, modeling, and formulating). Similar to the existing route optimization research for disabled people (Fernandes et al., 2017), the Dijkstra algorithm (Dijkstra, 1959) was used. The main reasons relate to the fact that the graph does not include negative values and the planned routes are not long (mostly less than 2 km), thus computationally it is not a time-consuming task. Accordingly, an ArcGIS Network Dataset tool implements the Dijkstra algorithm to calculate the route with the least weight.
Data sorting and filtering
OSM map data are converted into ArcGIS Feature Class (FC) objects. Each FC has an attribute table, with various elements (ID) stored in its rows, and various attributes stored in its columns. Only features with “key=value” tags, as detailed in “Defining weighted network graph criteria using OSM data” section, are stored; irrelevant features are deleted. Features intended for pedestrians walking having the value key “highway” form the GraphWays FC (for example, features with “highway=footway” or “highway=steps” tag are stored). Road features that must be avoided by blind pedestrians are stored in a different FC, used to calculate added costs and restriction intersections, and are presented as restriction network lines on the network graph. In addition, some node features are stored and used when Way Type and Landmark criteria are executed.
Open area conversion
Route calculations are implemented only on road networks composed of linear elements. However, some streets on the OSM map, which are navigational, are displayed (and stored) as polygons. To amend the polygon elements to linear ones that are later added to the network, we developed a skeleton algorithm using a Thiessen polygon structure, and geometric and topologic rules. The lines generated from the open space are connected to GraphWays FC.
Criteria implementation
Following the structuring of the network ways (GraphWays FC), the criteria costs are implemented by analyzing the geometry and attributes of each way. The calculated costs are then stored as new attributes, added to the GraphWays FC as follows:
Length: Costs are calculated and stored as geometric attributes. Landmarks: For each GraphWays FC way segment, a ModelBuilder counts the number of node landmarks within the threshold distance of 1.5 m and stores the result as a new cost attribute value defined as –1 for each landmark. Landmarks located near decision points (mainly intersections) are recounted and added to that new attribute. Complexity: This attribute counts the number of substantial turns (bends) on the road, with an angular threshold larger than 45°. This value is calculated via the change in the azimuth value of two consecutive way segments, increasing the way cost by +1. Way Type: This cost is calculated according to the considerations detailed in “Defining weighted network graph criteria using OSM data” section. Relevant accessible traffic signals (i.e. sound and vibration) are also taken into consideration, by examining the attributes of the relevant data nodes (e.g. “traffic_signals=Yes”). Accordingly, cost is given with values from one to six, respectively, to the defined categories (for example, segment belonging to Preferred category will gain the cost +1).
Final weight calculation
The last step in generating the weighted network graph is calculating the final weight for each way feature, based on the aggregative costs derived from the criteria. To avoid bias of certain criteria (for example, if the Length cost is more than 100 and the Way Type is 6), a normalization process is conducted. To do so, a min–max scaling is applied to the obtained criterion values, bringing all values into the [0, 1] range.
6
Equation (1) depicts the final weight calculation for each way i (wi), with a1, a2, a3, a4 being the coefficients that determine the internal relations between the four criteria weights (w1i, … , w4i). By default, we can assume that all four criteria (Length, Complexity, Landmarks, and Way Type) have the same weight, meaning that aj (where j = 1–4) has the same value; otherwise, aj can be modified to the user’s preferences. A higher aj value expresses more significant criteria in the overall process.

A zero value of Wi represents a saturation value, meaning that blind pedestrians will be indifferent to differences between ways with a weight value lower than the saturation value. Therefore, if the final way weight is less than zero, its value will be modified to zero.
Using the ArcGIS Network Dataset tool (which enables us to model restrictions and added cost points, thereby significantly increasing the total route weight), the final network weight graph is implemented. Network datasets are compiled from elements generated from source features with geometric attributes (i.e. properties that control traversability), in our case, the GraphWays FC. These assist in indicating which ways along the network are suitable and viable. As turning restrictions or elevations are more relevant to cars than to pedestrians, they are not included in the network dataset. Only the attribute of the final weight affects the network.
Experiment results
Testing area
To evaluate our methodology, we surveyed and mapped into the OSM database an area that includes all required data and information (as detailed in “Defining weighted network graph criteria using OSM data”), adding missing features and updating existing ones (e.g. attributes regarding whether the crossing has tactile paving). The testing area chosen was the Technion Campus in Haifa, Israel. The campus and its surroundings serve as a good case study as they present many spatial and environmental features that are valuable to our evaluation and analysis. We validate that the road network in the area is topologically and geometrically well configured in OSM, thus we can analyze and evaluate the routes generated by the system in terms of accessibility and safety for blind pedestrians (in all experiments aj = 1).
Quantitative evaluation
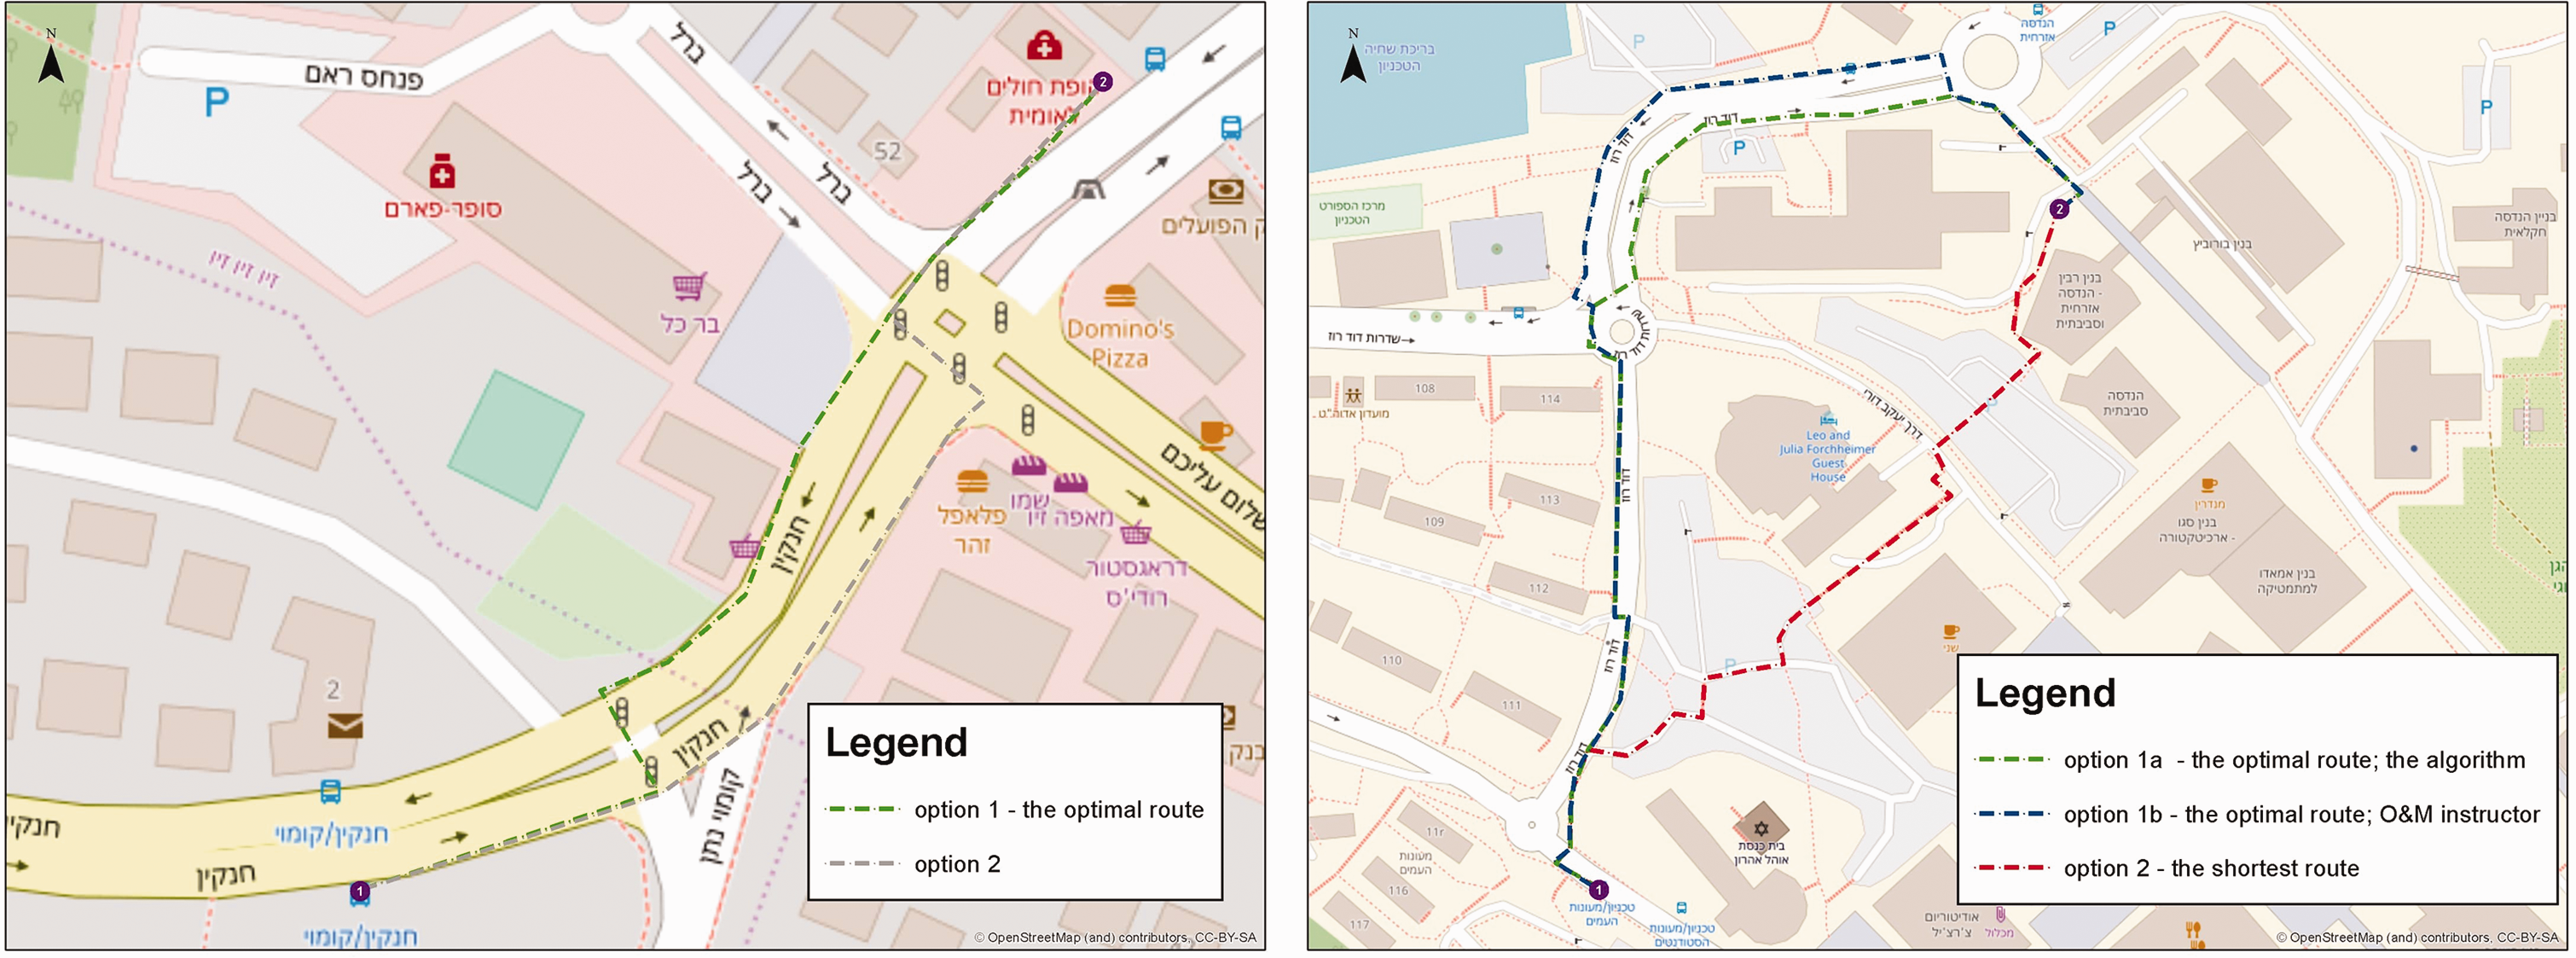
Figure 1 depicts three optional routes calculated by our system (left) with OSM data and accumulative lengths and cost values for each route (right). All three paths leave from the same point of origin (no. 1 on the left of the map), at the main Technion campus entrance, and lead to the same point of destination (no. 2 on the right of the map), at the dormitories. While the orange route is the shortest path, the blue route is the most optimal for blind pedestrians. Although seeing pedestrians would prefer the shorter orange route, this is a more dangerous route for blind pedestrians as it travels along a service road which is also used by vehicles and is therefore the least preferred or optimal of the three. The calculated blue route was chosen by our system as the preferred route due to the oncoming traffic that provides distinct direction sounds, the presence of landmarks along the way, and the fact that it is composed of fewer road segments (compared to the green route). Analyzing completeness issues often associated with OSM, we removed all landmarks from the database and run the calculation again. This time, the green route was chosen as the most optimal one, ascertaining that blind pedestrians will not walk on the more dangerous orange route. This simulation reproduces a case where the user is assisted by a guiding dog, such that landmarks are less relevant to his/her navigation process.
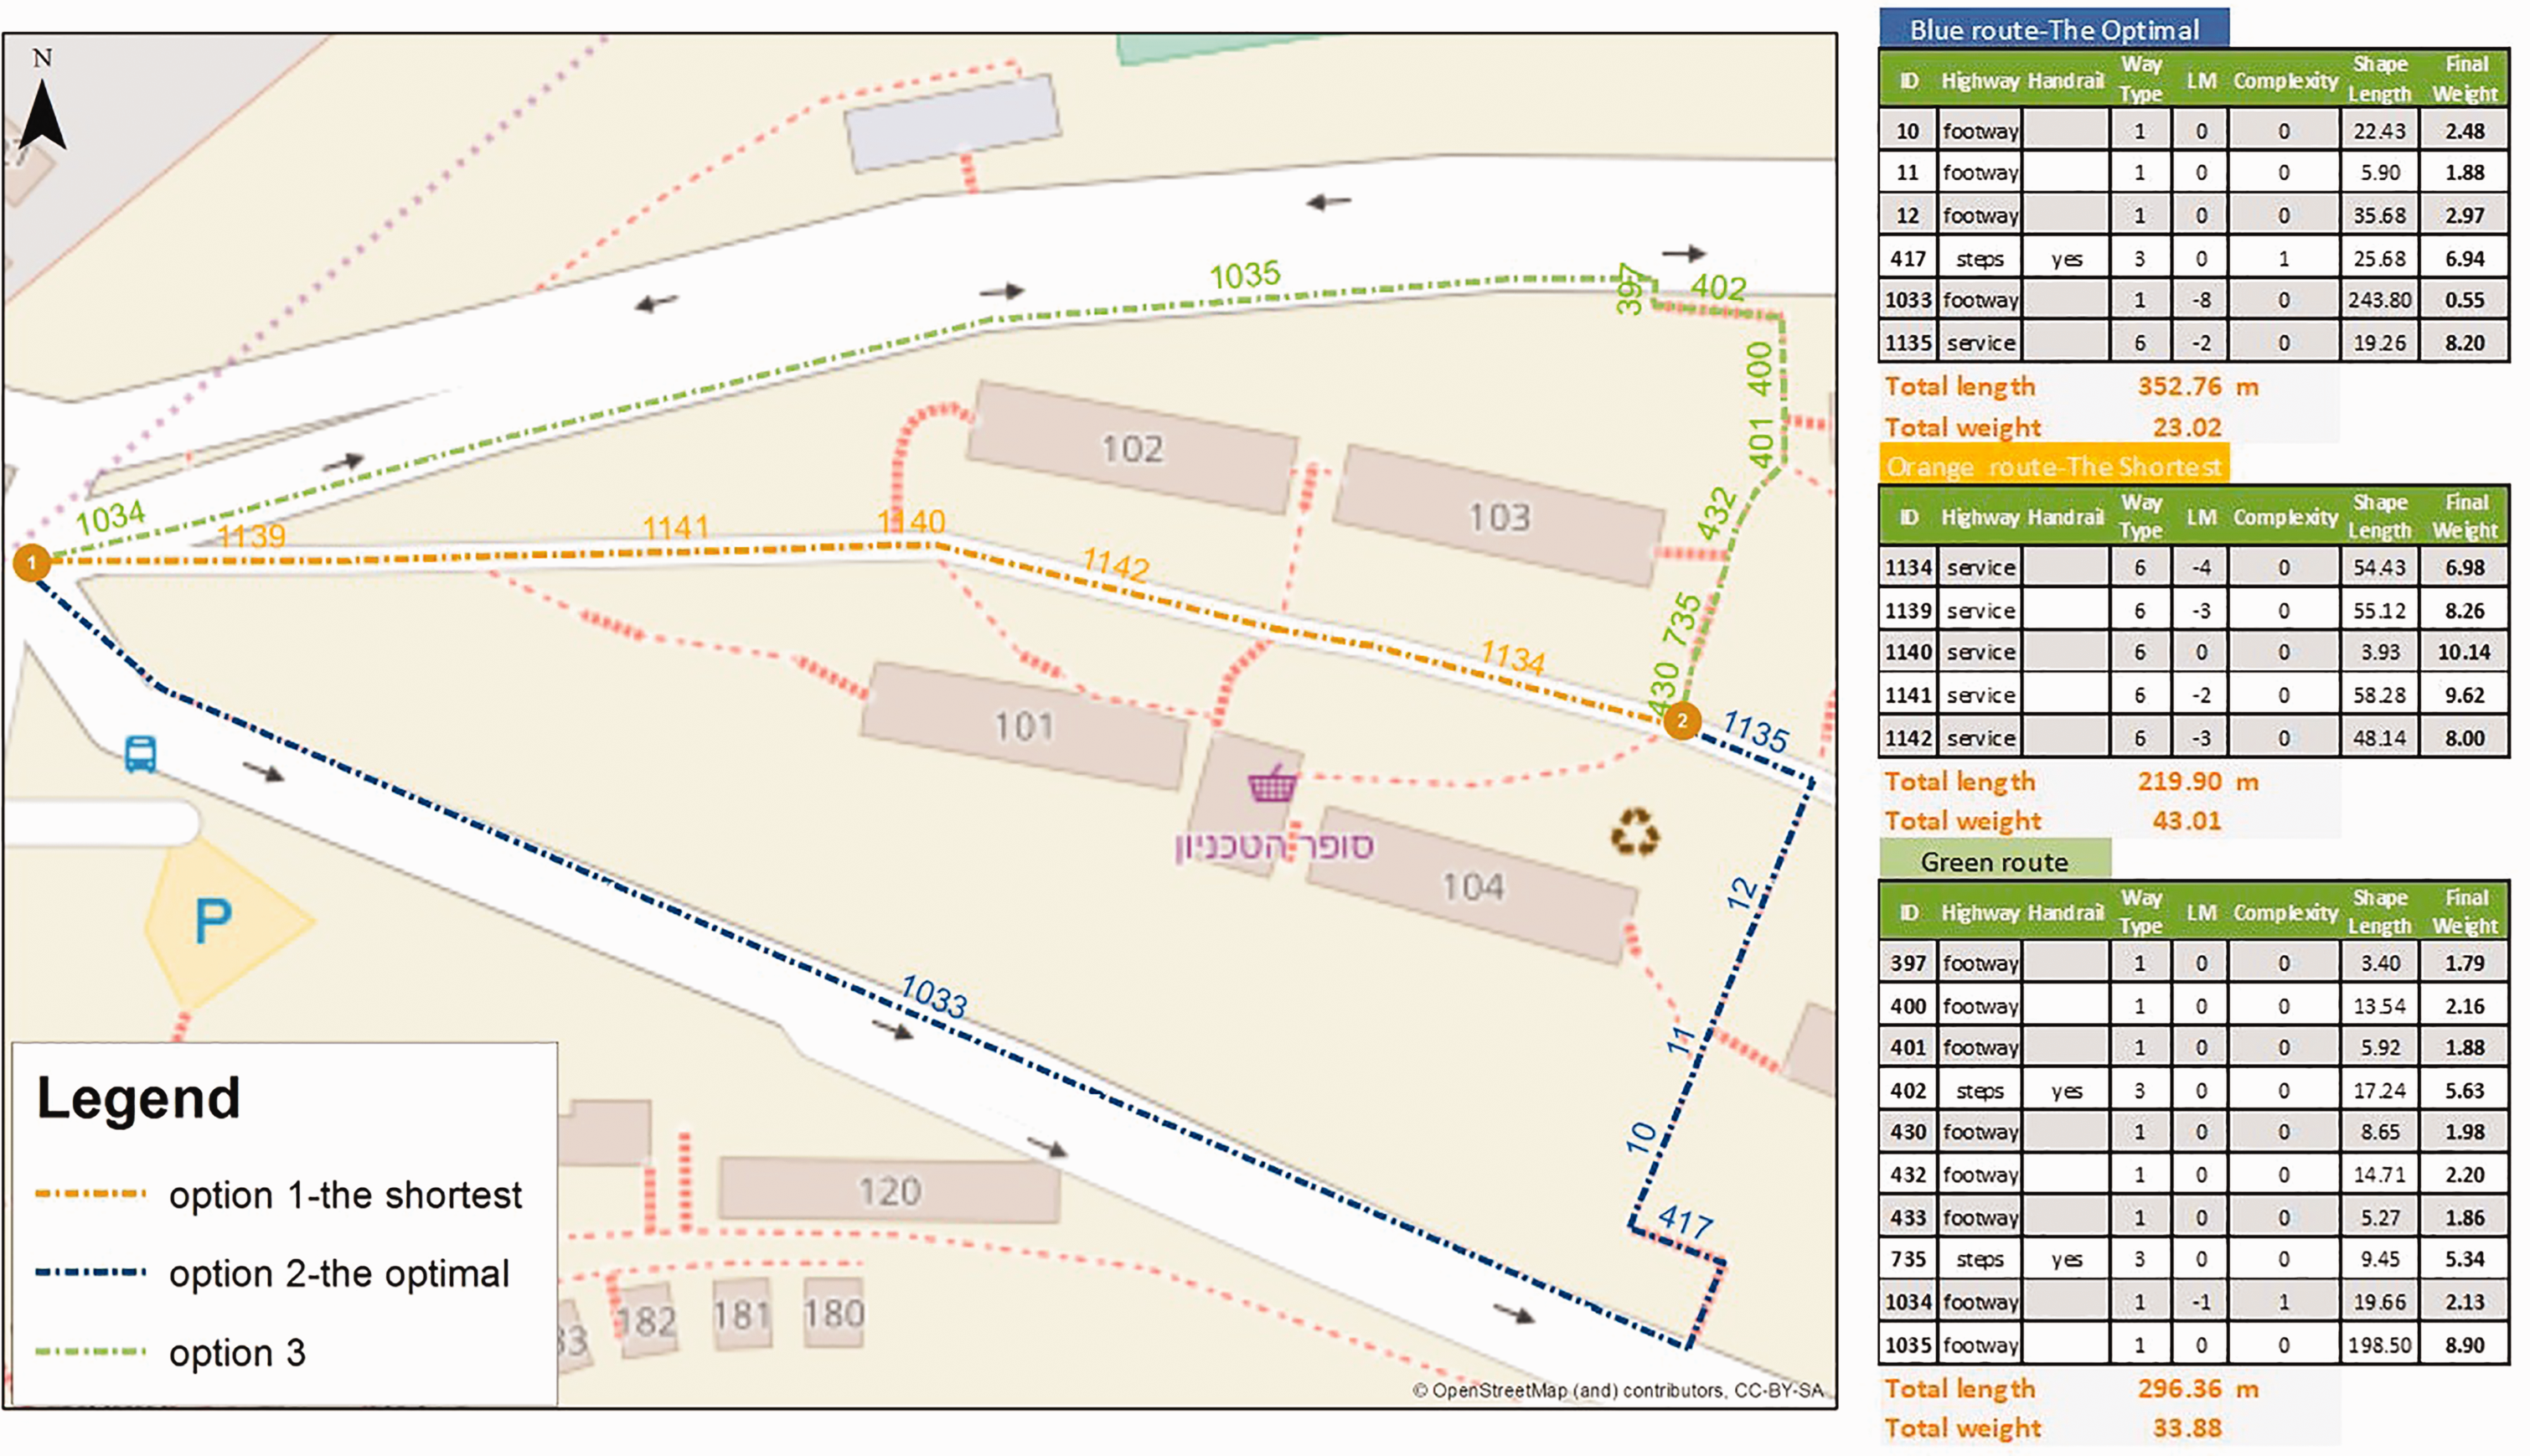
Three generated routes in the Technion campus.
We also examined a route that requires the crossing of a main road, as shown in Figure 2. While the orange route is shorter, it is less suitable for blind pedestrians due to the complexity of the intersections and the fact that they are less accessible. The system generated the blue route as the optimal one, despite its length, because of its lower total weight compared to the shorter orange route – mainly due to its helpful APS traffic lights.
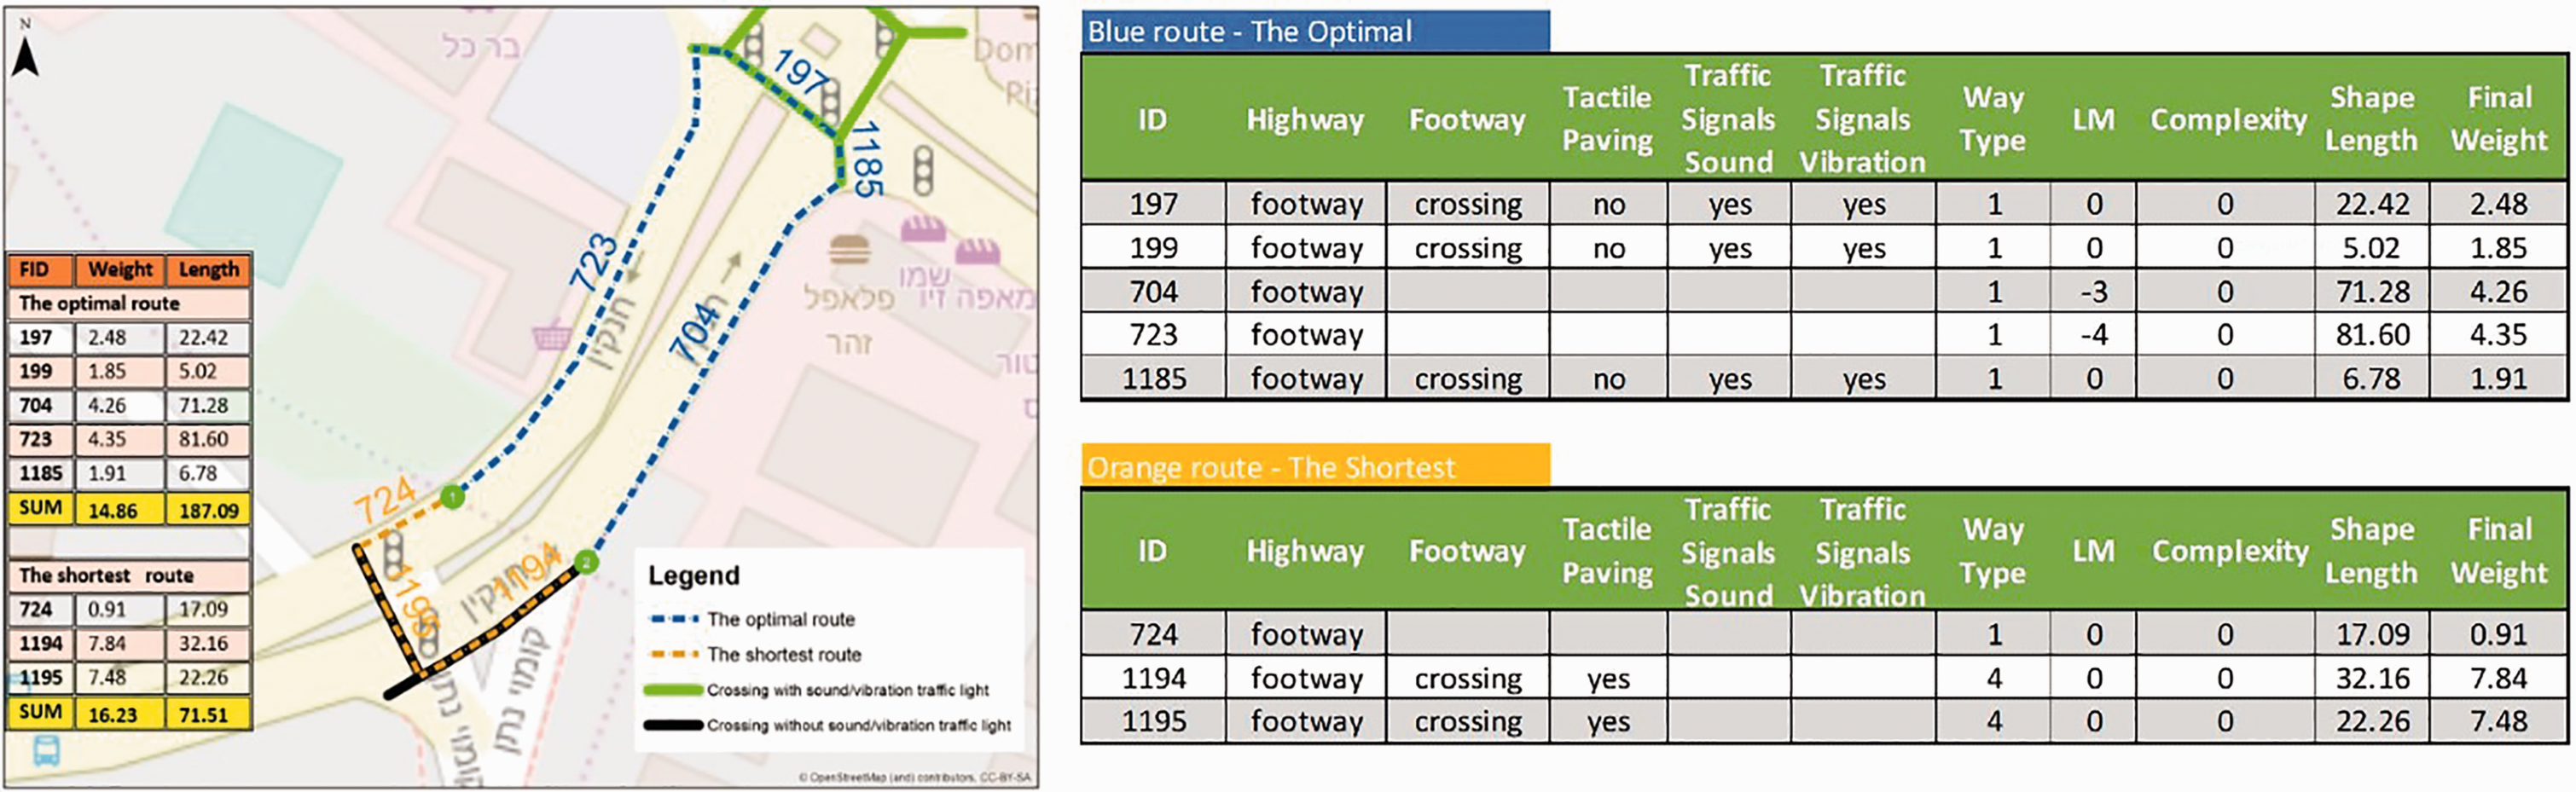
Two generated routes that include crossing a road.
Qualitative evaluation
In order to enhance our knowledge and understanding of optimal routes for blind pedestrians, and examine the algorithm that we designed and developed, we conducted two experiment types. First, blind volunteers in both Haifa (six participants) and New York City (three participants) were asked to walk from point A to point B via two different routes. They then shared their insights about both routes: one optimal for blind pedestrians but longer in distance, which was generated by our system, and one shorter in distance but less optimal for blind pedestrians, which was generated by the Google Maps app. In the second experiment, an OMI at the Technion Campus was asked to find the optimal route between three sets of origin–destination points. During her explorations, she shared her reflections and thoughts about each inspected route, such as elements that exist within the close surroundings of the route that may assist or disturb the navigation and orientation of blind pedestrians. The routes selected by the OMI were then compared to the optimal routes generated by our system.
Experiment 1
The Technion campus
The participants stated that the route generated by our system was optimal (depicted in blue in Figure 3, left), was indeed simpler and easier to navigate. They also mentioned that walking along the roadside instead of walking through a park (which is considered more complex) assisted their navigation, since they could listen to the sound and direction of oncoming traffic and could use known landmarks. One participant even said that the optimal route felt shorter compared to the physically shorter route. On the other hand, another participant said that although parks are considered difficult surroundings for navigating, they provide a more relaxing and calmer environment.
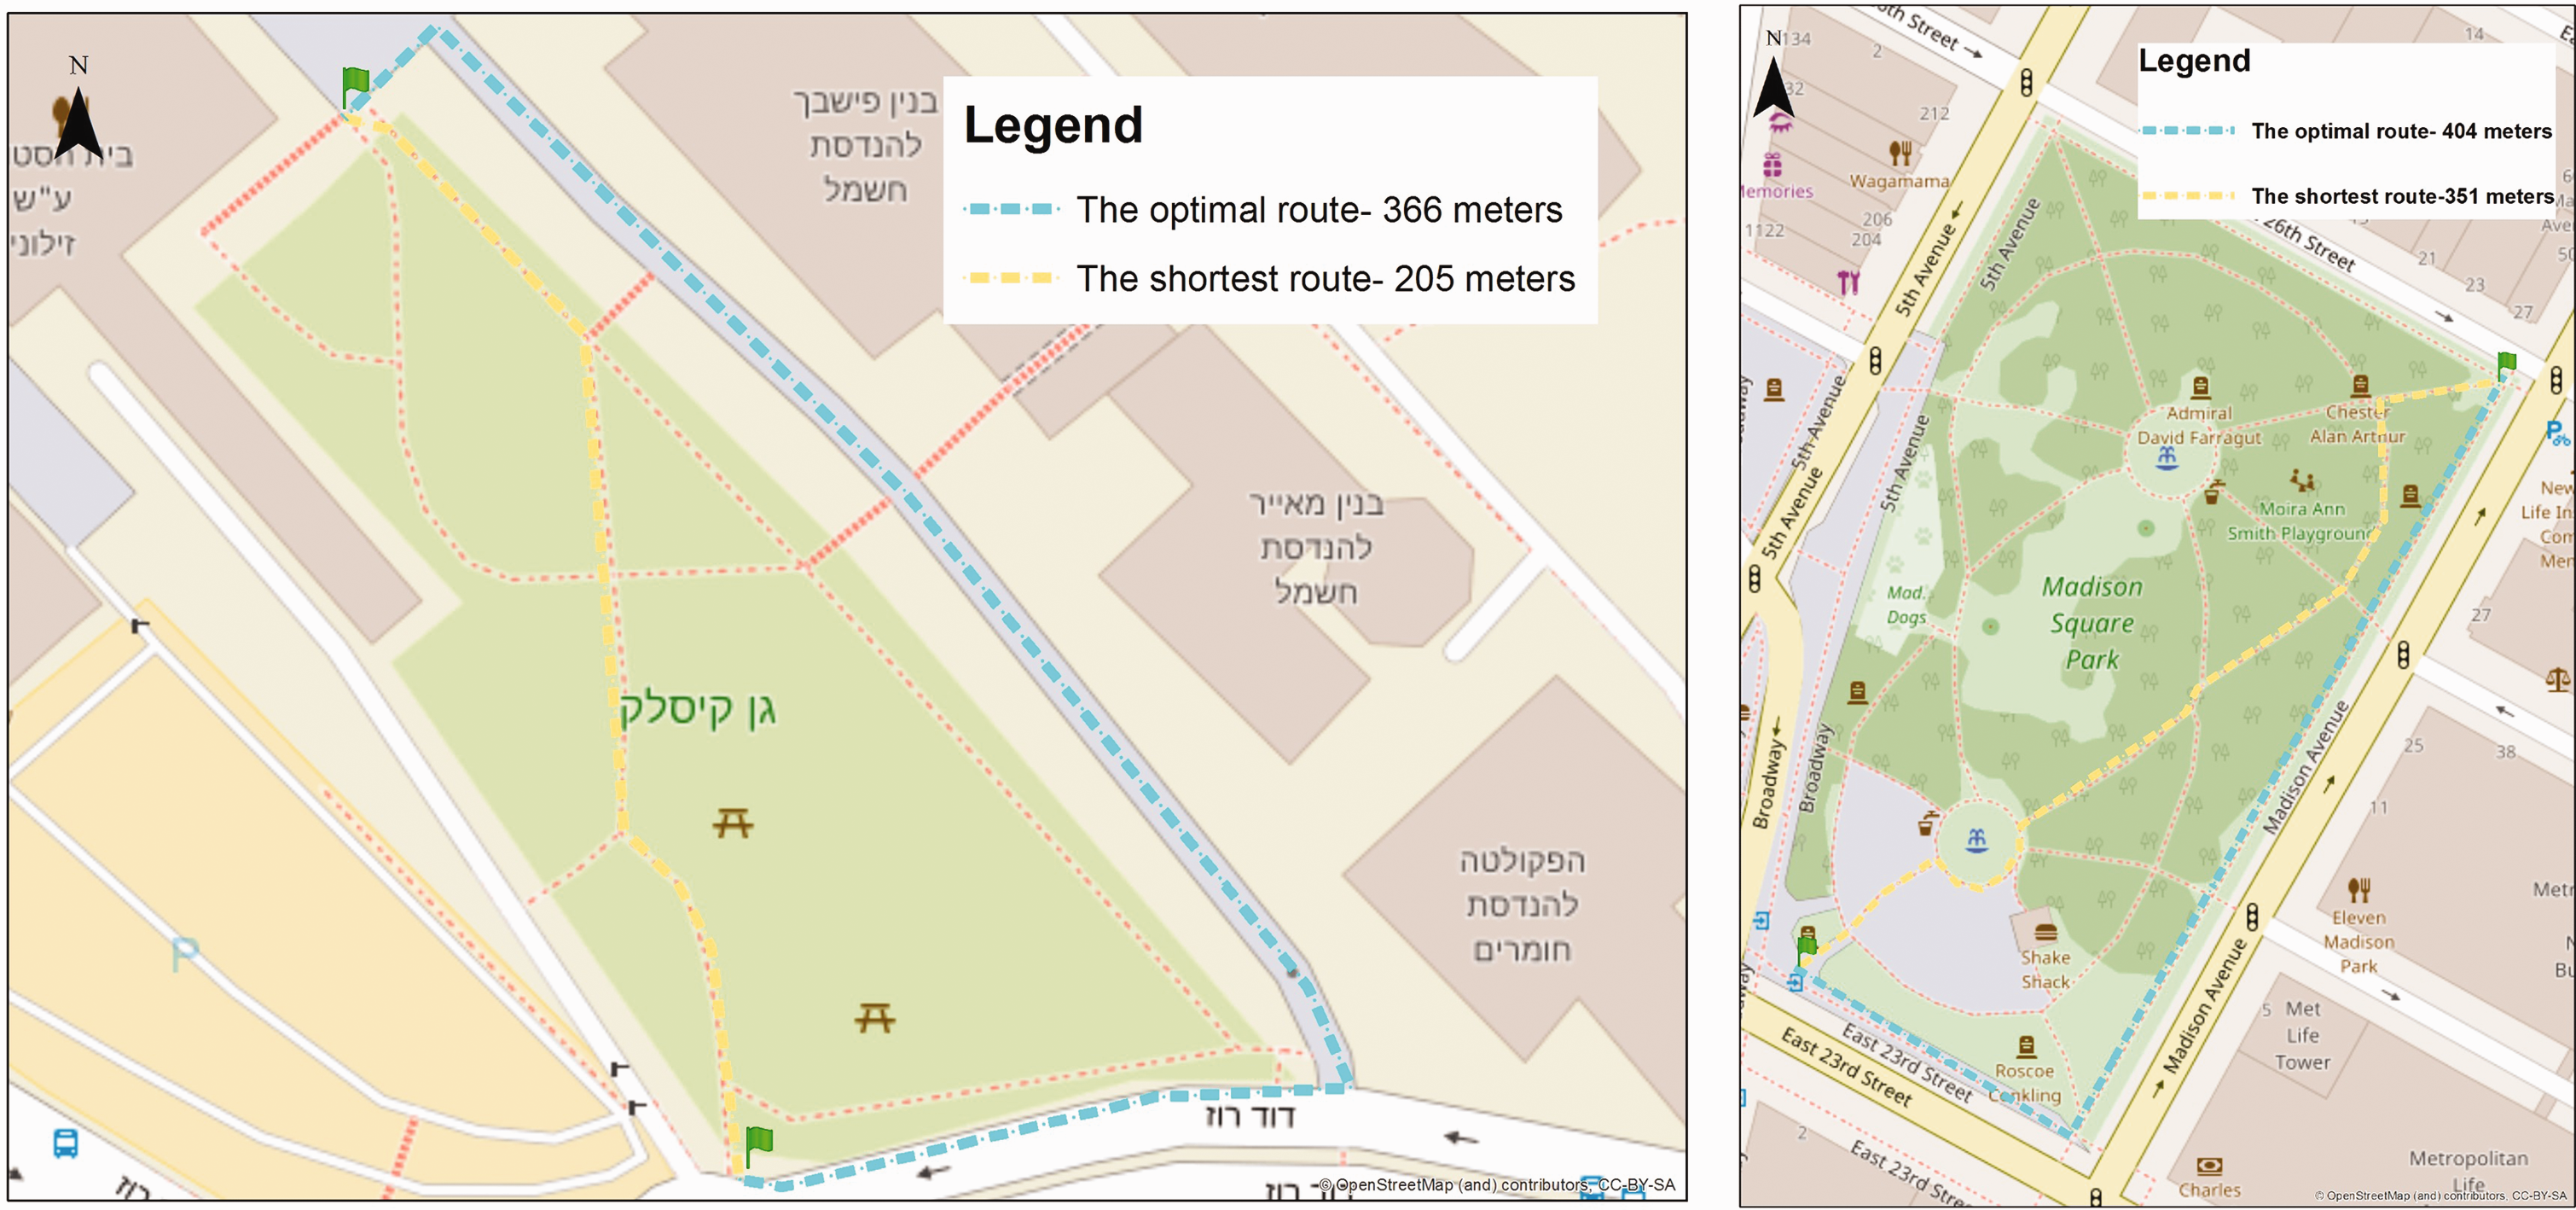
The Technion campus (left) and NYC (right) – two optional routes.
New York city
Input from the participants in New York city was similar. These participants also preferred the route that our system generated as optimal (depicted in blue in Figure 3, right). Again, some participants mentioned the advantages of navigating through the park – even though the park (Madison Square Park) is even more challenging than the Technion park (as it is more crowded and has fountains, playing musicians, and food carts that can have a cognitive overload among blind pedestrians). Although one participant mentioned that these obstacles could be used as navigation landmarks, thanks to their distinct sounds and smells, they cannot always be modeled as some are temporary. Another participant noted that the barrier between the footpath and the grass in the optimal route was beneficial for his orientation.
Experiment 2
Test A
This test offered three different routes for reaching the same destination after leaving the same point of origin (Figure 1). Our system chose the blue route as being optimal for blind pedestrians. When asked to examine the three possible routes, the OMI – who had not been informed of our system’s result – chose the exact same route as the most optimal route for blind pedestrians. The expert chose this route as being optimal for blind pedestrians mainly because of its large number of helpful landmarks located on the route (10 in the blue route in comparison to 1 in the green route), and its navigation simplicity, e.g. steps with a handrail. The expert also noted that the shortest route option is not safe for blind pedestrians, as it is shared with cars and is partially obstructed by a gate. She added that some landmarks along the orange and blue routes could even be regarded as obstacles, such as trees blocking the way.
Test B
This area incorporates several intersections, depicted in Figure 4 (left). Of the two possible routes from the point of origin (bus station on the lower left) to the point of destination (medical center on the upper right), both the expert and our system selected the same route (green) as optimal for blind pedestrians; this also happens to be the shortest route. The chosen optimal route includes more indicative landmarks, does not require crossing parking lot entrances, and presents a single crossing with distinct direction at each intersection rather than two crossings.
Test B (left) and test C (right).
Test C
The OMI was asked to examine an additional area within the Technion campus. Depicted in Figure 4 (right), the system found the green route to be optimal, while the expert chose a slightly different route, the blue route, to be the optimal route for blind persons. In neither case was the physically shortest route, i.e. the red one, chosen as optimal for blind pedestrians, as it is extremely complex, inaccessible and unsafe. Accordingly, our system gave the red route a high weight value mainly because it passes through several restrictions and added cost points. Both routes chosen by the system and the OMI have similar attributes, mainly walking along roads having car traffic and its direction is mostly distinct while avoiding dangerous parking lot entrances. To travel between the middle and top roundabouts, the OMI preferred the West sidewalk, explaining that it includes more indicative landmarks (e.g. a bus stop), also explaining that it is safer for blind pedestrians to cross two separate intersections (the blue route) rather than one more complex intersection (the green route) that includes two crossings. Following this insight, this factor was added to the algorithm. Both the OMI and our system did not include the East sidewalk between the bottom and middle roundabouts, interpreting it as unsafe crossings of parking lot entrances that had no pedestrian crossing, and even more dangerous, in some locations the walk next to curbs graded down to an adjoining surface that may cause the blind pedestrians to mistakably divert to the road.
Conclusions and future work
Blind pedestrians must acquire unique travel and navigation skills while utilizing nonvisual environmental information. This is cognitively demanding and challenging, often requiring conscious moment-to-moment problem-solving capabilities. Moreover, unsafe or inaccessible routes increase the level of stress and anxiety among blind pedestrians, and could result in accidents, injuries, and the preference to stay indoors. Therefore, a comprehensive wayfinding solution for blind pedestrians must convey rich information about the environment yet in a simple and straightforward manner, successfully communicating all necessary and critical information for safe and efficient navigation.
This study presented a methodology that uses OSM data, as well as designing a tailored set of criteria, for generating optimal walking routes for blind pedestrians. Focus is placed on generating routes that are safe and easy to navigate. Qualitative evaluations showed how our developed system and algorithm tend to select a safer and easier route to navigate, preferring more accessible paths while avoiding dangerous locations. By evaluating the optimal routes with blind participants, the results showed that in general the routes were more effective and usable for blind pedestrians, and the criteria used for planning the routes were mostly in line with their preferences. Moreover, our system enables blind pedestrians to modify the criteria weights so as to achieve a tailored optimal path that suits their personal preferences (such as walking through a park even if less optimal). Experiments with orientation and mobility experts showed that the routes generated by our algorithm were identical or closely similar to the ones chosen by the experts.
We conclude that the OSM database, which can store large volumes and detailed sets of objects that are often missing in other mapping infrastructures, has the potential to serve as the mapping infrastructure for the computation of a tailored weighted network graph. Moreover, the fact that OSM offers communities the possibility to contribute to a meaningful cause, by completing missing data quickly and simply, elevates this methodology to a crowdsourced bottom-up model, in which anyone and everyone can take part.
Nevertheless, OSM has some shortcomings, mainly in terms of data quality (e.g. accuracy and topological errors) and completeness; still, current research shows that OSM road network geometric and topologic attributes are mostly accurate and up-to-date in the majority of cities (Barrington-Leigh and Millard-Ball, 2017). This issue should be addressed to make the developed solution scalable, where one suggestion is to use external sources, such as online sources of street-level photographs, as well as machine and deep learning prediction models, to generate new and missing data. We also plan to investigate the inclusion of temporal effects, such as traffic flow and smell, on the solution. Another idea is to adjust the criteria weights via existing routes travelled by blind pedestrians or generated by orientation and mobility professionals. Moreover, we plan to carry out further experiments with additional participants, in order to extract a more encompassing and accurate qualitative assessment of our solution.
We believe that these findings have the potential to improve the quality of life of blind pedestrians – by enhancing their independence through their increased ability to safely wayfinding in urban environments. In turn, this could make a significant social contribution to the blind community, empowering this population as they maintain a healthy and active lifestyle, become a part of society, and join the workforce. This will also contribute to the general public, who will have increased interaction with blind people. The tools that were developed throughout this study can also help OMIs and rehabilitation professionals to use the system to generate routes for their users, instead of physically spending hours and days in unknown environments. The developments, implications, and insights gained from this research could be used to develop assistive technologies, namely navigation systems for blind pedestrians, and for other populations with disabilities. Additionally, the understanding achieved from this study could be integrated into urban planning, for ensuring accessible designs and walkable cities for blind pedestrians and other populations with disabilities.
Supplemental Material
sj-pdf-1-epb-10.1177_2399808320933907 - Supplemental material for Route planning for blind pedestrians using OpenStreetMap
Supplemental material, sj-pdf-1-epb-10.1177_2399808320933907 for Route planning for blind pedestrians using OpenStreetMap by Achituv Cohen and Sagi Dalyot in Environment and Planning B: Urban Analytics and City Science
Footnotes
Acknowledgements
We would like to thank Migdal Or organization for their kind and constructive assistance; in particular, Ronit Landsman and Rita Lapid for a very fruitful collaboration.
Declaration of conflicting interests
The author(s) declared no potential conflicts of interest with respect to the research, authorship, and/or publication of this article.
Funding
The author(s) disclosed receipt of the following financial support for the research, authorship, and/or publication of this article: This work was supported by the Ruch Exchange Grant.
Notes
Supplemental material
Supplemental material for this article is available online.
References
Supplementary Material
Please find the following supplemental material available below.
For Open Access articles published under a Creative Commons License, all supplemental material carries the same license as the article it is associated with.
For non-Open Access articles published, all supplemental material carries a non-exclusive license, and permission requests for re-use of supplemental material or any part of supplemental material shall be sent directly to the copyright owner as specified in the copyright notice associated with the article.