
Abstract
Urban areas are dynamic systems, in which different infrastructural, social and economic subsystems continuously co-evolve. As such, disruptions in one system can propagate to another. However, open challenges remain in (i) assessing the long-term implications of change for resilience and (ii) understanding how resilience propagates throughout urban systems over time. Despite the increasing reliance on data in smart cities, few studies empirically investigate long-term urban co-evolution using data-driven methods, leading to a gap in urban resilience assessments. This paper presents an approach that combines Getis-ord Gi* statistical and correlation analyses to investigate how cities recover from crises and adapt by analysing how the spatial patterns of urban characteristics and their relationships changed over time. We illustrate our approach through a study on Helsinki’s road infrastructure, socioeconomic system and built-up area from 1991 to 2016, a period marked by a major socioeconomic crisis. By analysing this case study, we provide insights into the co-evolution over more than two decades, thereby addressing the lack of longitudinal studies on urban resilience.
Introduction
Cities are complex adaptive systems that dynamically evolve over time, adapting to unprecedented challenges stemming from climate change, increasing inequality and subsequent social crises such as fragmentation, polarisation and unrest. Urban resilience describes a city’s ability to withstand and recover from shocks and stresses while maintaining essential functions and adapting to change. Resilience emphasises the capacity to bounce back from disruptions, enhance sustainability and foster social cohesion (Meerow and Newell, 2016).
Examining co-evolution of the infrastructure, socioeconomic, built or environmental subsystem in the urban environment through the lens of resilience can provide insights into how changes in urban subsystems influence a city’s ability to respond to challenges over time. For example, how will investment in new urban infrastructure impact socioeconomic conditions? Vice versa: how will socio-demographics influence the demand and development of urban infrastructure? And how do shocks or disruptions in one system ripple through urban subsystems?
To answer these questions, research on resilience has focused on higher level conceptualizations that characterise the links between (sub-)systems, like social-ecological resilience (Ostrom 2009) and, more recently, social-ecological-technological resilience (Kim et al., 2022; Sharifi 2023). Central notions of resilience across systems are adaptive resilience and transformative resilience (Sharifi 2023). Under adverse events, adaptive urban resilience describes a city that is able to adapt and change behaviour to minimise functionality loss. As such, adaptation is linked to established paths or behaviours (Kim et al., 2022). Examples include the adaptive capacity of people to change their behaviour in response to crises; the ability of ecological systems in a city to adapt to different stresses; or the strengthening of infrastructures. In contrast, transformative resilience borrows from the ecological resilience literature referring to a fundamental and radical shift (or regime change) in plans, policies and technologies (Leixnering and Höllerer 2022; Olsson et al., 2014; Sharifi 2023).
While resilience principles and frameworks help explain the nature of relations between systems, they do not explain how disruptions affect the performance of different systems, and how these disruptions cascade through inter-related networks over time and in space. In contrast, co-evolutionary frameworks, rooted in network theory, can be used to understand this interplay (Chapman et al., 2016), and to explain the interactions between economic and institution agents at the micro-level (Mondal, 2023). A common approach is to simulate urban infrastructures (i.e., road, rail networks) and relate their evolution to socio-demographic or socioeconomic variables (Barthélemy and Flammini 2009; Ding et al., 2021; Levinson 2008; Li et al., 2016; Raimbault 2020; Schweitzer and Nanumyan 2016). These simulation-based co-evolution studies rely on assumptions, simplifying the co-evolution problem. For example, new infrastructure investments are predicted by traffic flows or population density. However, this approach neglects the complex interaction by which cities self-organise often across multiple networks and interwoven scales, which typically results in the emergence of new system properties (Caldarelli et al., 2023; Lengyel et al., 2023). Moreover, co-evolutionary processes involve the spatial configuration of an urban area and its institutional arrangements, which are not always rational (Portugali, 2016), making adaptive planning vary by context (Rauws and De Roo, 2016).
Data-driven approaches rely on empirical time-series data to infer co-evolution properties without prior assumptions, aiming to uncover complex patterns in high-dimensional data (Tolle et al., 2011; Yin et al., 2021) and to avoid a priori modelling of causal links (Casali et al., 2022). Despite their potential, only a limited number of studies employ data-driven methods for co-evolution. Levinson (2008) highlights the interplay of rail networks and population density, finding historical evidence for “induced demand.” The author suggests that travel demand does not simply emerge due to the existing residents but also contributes to the creation of new residences. Kasraian et al. (2020) empirically investigate the impact of transport networks on urbanisation, demonstrating that urbanisation is driven more by proximity to other developed areas and population centres than by improved transport accessibility.
Studies analysing the spatial co-evolution of urban subsystems, specifically the interplay between infrastructural, built-up and socioeconomic systems are still missing. Moreover, the implications for adaptive resilience and urban planning in an increasingly hostile environment remain unknown. Much of the data-driven (urban) resilience literature focuses on the rapid response to shocks (Krishnan et al., 2024), neglecting the longer-term implication of crises in slow-moving urban systems that only become visible over time. The lack of a co-evolution perspective in the urban planning literature combined with the gap on data-driven longitudinal resilience studies limits our understanding of how urban systems change, adapt and respond to disturbances. Given the many path-dependencies in cities, this gap amplifies the lack of established resilience metrics grounded in complex systems or evolutionary perspective (Jones et al., 2021). As a consequence, urban planners lack planning practices, frameworks or approaches that integrate these longer-term impacts, often leading to myopic or siloed planning (Krishnan et al., 2024). One possible reason for the limited number of studies may be the lack of extensive time-series data.
To address this gap, we present an approach that infers temporal dynamics by analysing a series of “snapshots” of spatial data. This approach allows us to study the co-evolution of subsystems in an urban area over time by using spatial data analysis. To demonstrate our approach, we focus on three prominent subsystems: road infrastructure, socioeconomic system and buildings. We first study how spatial clusters of a compound of urban variables changed and, second, we determine if those variables were correlated over time. We analysed the city of Helsinki from 1991 to 2016. Since Helsinki went through a major socioeconomic crisis during that period, it presents an ideal case study to investigate adaptive urban resilience, thereby providing insights into urban co-evolution theory.
Materials and methods
Study area: Helsinki and the east-west divide
Our study area is the city of Helsinki, Finland. Helsinki was chosen because of the available high-quality temporal data and its status as a developed European capital that faced an economic crisis, followed by rapid change. Helsinki is also exposed to various environmental risks and exposed to climate-related hazards such as stormwater, sea and river floods (Pilli-Sihvola et al., 2019). In the context of climate change, the anticipated increase in rainfall, floods, heatwaves, storm damage and changes in winter conditions pose threats to the safety and well-being of the population and the environment (City of Helsinki Environmental Report, 2022; Pilli-Sihvola et al., 2019). The climate-induced disruption of infrastructures further may hamper access to essential services or resources, leading to negative feedback loops in coupled social-environmental-technical systems. In addition, Adger et al. (2011) have shown that infrastructure policy to adapt to climate change may erode resilience in social-environmental systems in the long run.
Helsinki’s socioeconomic development has evolved through different stages. Initially divided into bourgeois and working-class areas in the 1920s, policies were introduced to foster social integration. Between the 1960s and 1980s, the socioeconomic differences within the city decreased thanks to a welfare regime, income redistribution and new municipal planning policies. In the late 1980s, the economy transitioned from an industrial to an information and service society, which created new economic possibilities mainly for highly trained and young people (Hedman, 1989). The number of ICT companies in Helsinki increased and most companies located in the western areas, forming a cultural hub with the university. In the late 1980s, the western, northeastern and eastern suburbs differed (Hedman 1989), with the western areas more developed than the eastern ones. In the early 1990s, Helsinki reached a socioeconomic equilibrium by balancing spatial disparities even though highly educated citizens predominantly resided in the West (Vaattovaara and Kortteinen, 2003). Road accessibility was difficult because of heavy traffic, especially in the city centre, and a lack of public transport (Hedman, 1989).
In the 1990s, Finland experienced a major recession. This economic crisis brought the country into a deep economic depression that raised unemployment, specifically in socioeconomically disadvantaged areas (Vaattovaara and Kortteinen, 2003) such as the East of Helsinki. After 1993, the impact of the most profound depression dissipated, yet, unemployment rates were still higher in the eastern areas (Vaattovaara and Kortteinen, 2003), creating protracted differences in wealth. The ICT sector continued to play a role in increasing the socioeconomic differences. In the early 2000s, new urban plans aimed to develop a polycentric and compact city. The master plan 2002 increased inner-city densification by transforming the vast port areas into housing (Tiitu et al., 2021). In 2016, Helsinki municipality pursued a polycentric city plan, aiming for improved rail transport and land use along existing highways (Granqvist et al., 2019).
Based on the literature, we expect to see differences in the spatial distributions of labour rates from 1991 to 1999 between the West and East of Helsinki. To derive insights into urban resilience, we test if this divide persisted over time, and if and in how far changes in buildings and transportation infrastructure preceded or followed the socioeconomic development. We expect increased building densification in already developed areas before 2000, aligned with the 2002 master plan. We expect road infrastructure densification along existing highways to enhance connectivity in built areas. By testing these assumptions, we aim to create important insights for urban planners on where, how and when to intervene in co-evolving infrastructure systems.
Data and variables
To analyse co-evolution and resilience and test our assumptions, we constructed spatial data time series for three subsystems: the road network for transport infrastructure, the built-up area, and the socioeconomic status in the years 1991, 1999, 2007 and 2016. We selected these years because they overlapped across all data sources and we could maintain a steady temporal interval of 8–9 years. Data referred to 142 districts. We reported the data pre-processing steps and sources in section 2 of the Supplementary Materials.
For the transportation infrastructure, we focus on the road network due to heavy car reliance (Hedman, 1989) and limited data on tram, railway and bus route in the 1990s. Node betweenness centrality (BC) measures the shortest paths between nodes, serving as a proxy for flows (Barthélemy 2011; Casali and Heinimann 2019). In this study, we counted the average betweenness centrality in each district. For the built-up area, the number of buildings measures the development of constructions in the city. For the socioeconomic system, population and housing units describe the residential level of a district, while the labour rate and income represent the economic activities and levels of residents.
Approach for co-evolution analysis
Co-evolution approaches commonly simulate the evolution of infrastructures using assumptions and relate them to socio-demographic and socioeconomic variables (Barthélemy and Flammini 2009; Ding et al., 2021; Levinson 2008; Li et al., 2016; Raimbault 2020; Schweitzer and Nanumyan 2016). In this paper, we presented a new approach to study the co-evolution of urban systems. Our approach employs spatial and temporal data, inferring dynamics through statistics. The first step detects spatial clusters and analyses their distribution by examining each variable independently over time. Identifying spatial clusters helps to describe how urban systems are organised in space. Getis-ord Gi* is used as a statistical method to extract clusters with the highest and lowest variable values. In this way, we were able to clearly identify opposite socioeconomic characteristics in space. The second step uses correlation analyses to understand statistical relationships between variables in time.
Identifying spatial clusters
Spatial association statistics describe spatial autocorrelation (Geary 1954), displaying relations between single variables based on their spatial distributions. Two prominent methods measuring global and local spatial autocorrelations are Local Moran’s I (Anselin 1995) and Getis-Ord Gi* (Getis and Ord 1992). Getis-Ord Gi* identifies hotspots and coldspots with the highest and lowest value concentrations. For statistical significance, hotspots (coldspots) should have high (low) values and be surrounded by other high (low) value districts. In contrast, Local Moran’s I detects two high and low-value clusters and two outlier classes. Both methods have been used to study spatiotemporal change related to demographic development (Kurek et al., 2021), police demand (Dewinter et al., 2022) or the COVID-19 outbreak (Ghosh and Cartone 2020).
As a preliminary step, we tested Local Moran’s I and Getis-Ord Gi* for Helsinki. Local Moran’s I revealed scattered outliers that changed depending on spatial weight. As the first step of co-evolution analyses is to detect dominant clusters, we used the Getis-Ord Gi* to detect the main clusters (highest and lowest values) while neglecting single outlier districts.
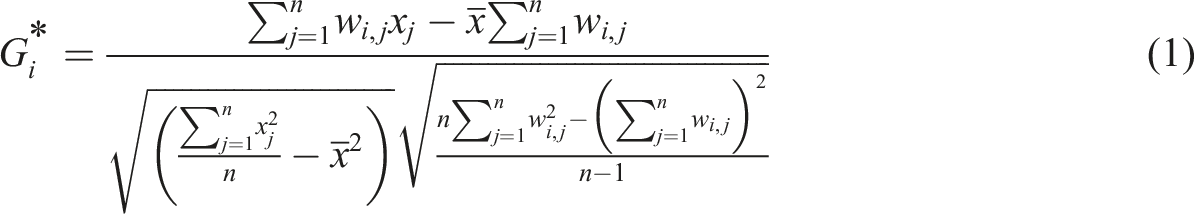
We calculated Getis-Ord Gi* (equation (1) by using the Hot Spot Analysis tool in ArcGIS. We used fixed distance bands for varying district sizes and tested z-scores for statistical significance at a 90% confidence level.
Temporal relationships
Getis-ord Gi* clusters do not explain the relationships between variables over time which is vital for co-evolution. To explore variable relationships and their temporal changes, we conducted correlation analyses for all districts in each year. At the district level, spatiotemporal correlations weren’t conducted due to limited time steps (4). Instead, we focused on temporal relationships, calculating percentage changes to measure the speed of change. The percentage of changes between correlated variables was calculated by subtracting the variable value in a district from Year t to Year t-1 and dividing it by the value in Year t-1.
Results
This section presents the analytical results. In the discussion section, we then discuss the implications for urban co-evolution (see Co-evolution insights), urban resilience (Resilience insights) and planning (Urban planning insights) as well as the advancements of analytical methods (Methodological insights).
Spatial clusters
Figure 1 shows hotspots and coldspots using Getis-Ord Gi* for all urban subsystems and years. The socioeconomic variables yielded persistent coldspots in the northeastern districts (Figure 1(a)–(d)). The corresponding area is sparsely populated. This is in line with the aforementioned West-East divide. Interestingly, there is no corresponding coldspot in the built-up area or the road betweenness centrality, indicating that while the area is connected and developed, it is limited only from a socioeconomic perspective. Coldspots were also found in the far southwestern and (partially) in the central and eastern districts from 1991 to 2007. We found coldspots in the extreme southwestern areas for population, housing units and labour rates. These results mean that those districts were poorly developed demographically, as compared to the rest of Helsinki, but caught up in 2016. They have implications particularly for adaptive resilience, as understanding this dynamic landscape, where some districts show a capacity to catch up while others do not, is crucial to designing future resilience strategies and responding to the specific needs of vulnerable, socioeconomically disadvantaged communities. The results also indicate that especially larger pockets of socioeconomic coldspots at the periphery were persistent, despite investments in developments. This implies that for adaptive resilience it is not sufficient to connect communities, rather, tailored programs to focus on their needs. Spatial distributions of Getis-Ord Gi* clusters in Helsinki for 1991, 1999, 2007 and 2016 were analysed for (a) population, (b) housing units, (c) income, (d) labour rate, (e) built-up area (number of buildings) and (f) road average betweenness centrality (BC). Coldspots indicate statistically significant low-value clusters, while hotspots indicate statistically significant high-value clusters. We used a 90% confidence level for testing scores.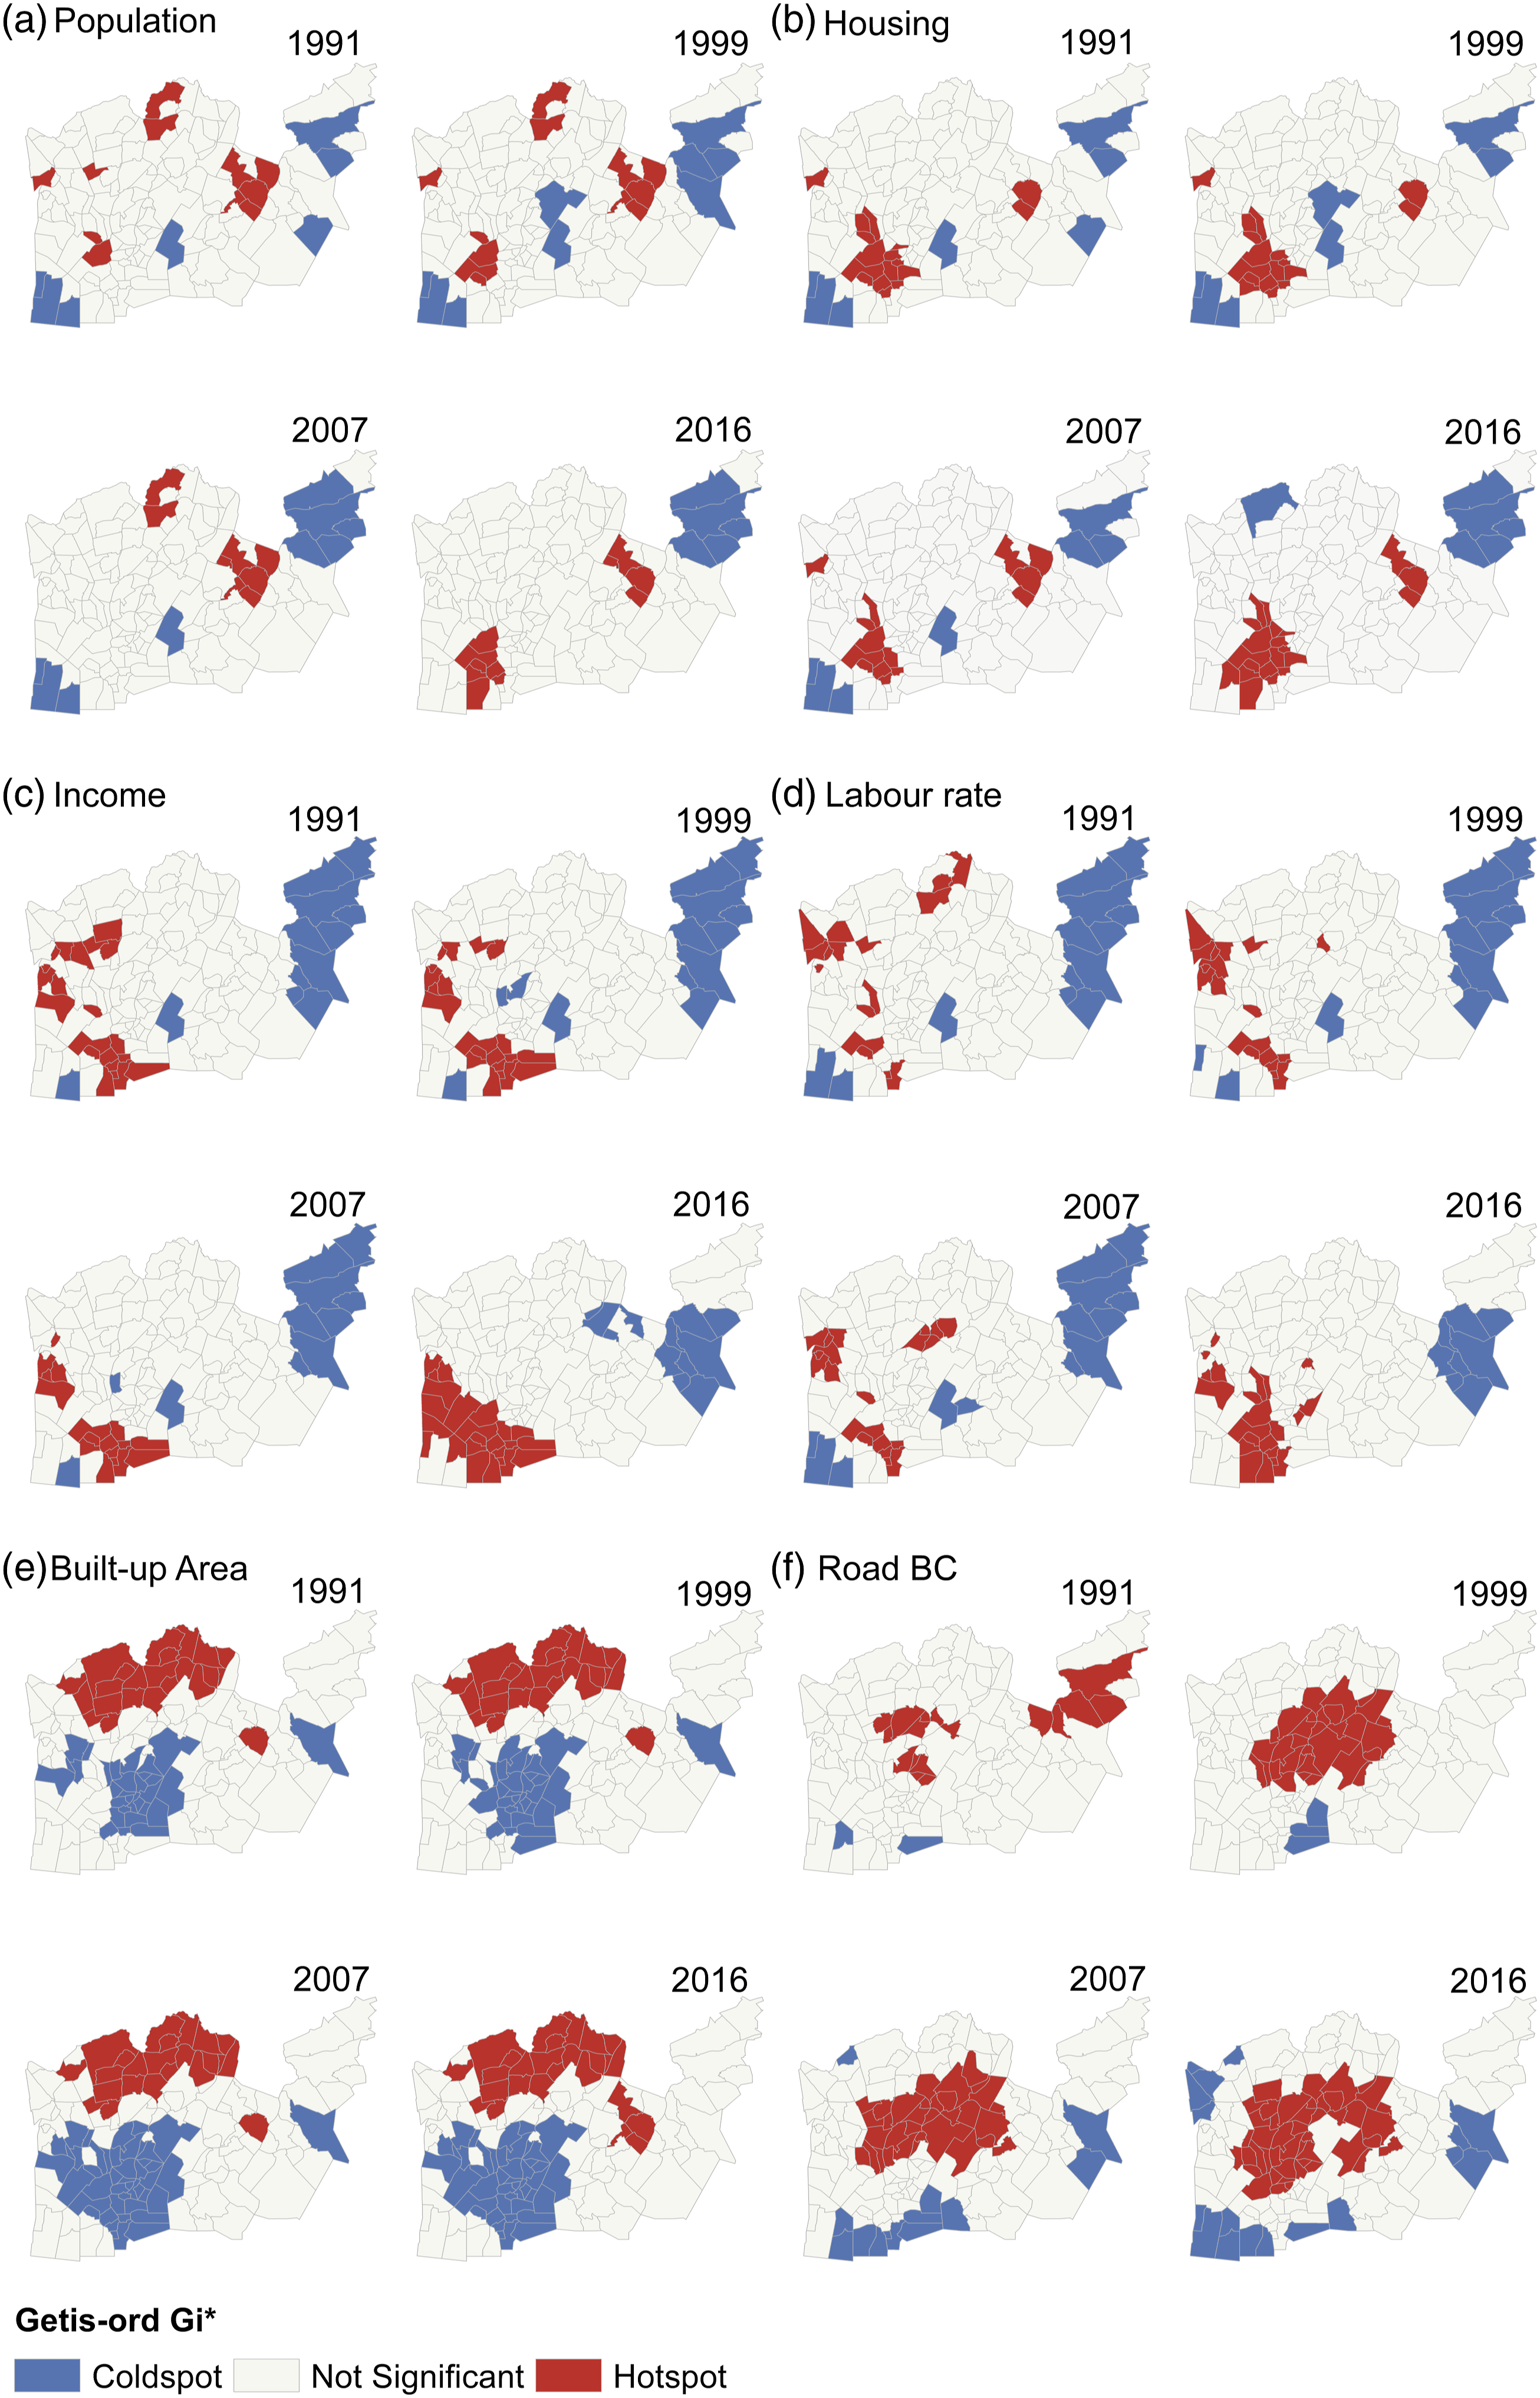
The southwestern peninsula had high values for housing units, labour rates and income, with a significant population hotspot only in 2016 (Figure 1(a)), suggesting that over the years, this area has become attractive for residents. In western districts, we found prominent hotspots for income and labour rates. The income hotspot areas expanded towards the Southwest over time (Figure 1(c)). This reconfirms the West-East divide and underscores its persistence of inequality despite the introduction of urban master plans. A cluster of eastern districts exhibited high values for population and housing units. Despite the high population density, there was no corresponding hotspot of income, suggesting low-income levels. In 2016, income displayed a coldspot near that cluster (Figure 1(c)), indicating a developed residential area with no significant increase in general wealth. These results emphasise the growing socioeconomic discrepancies between the West and East of Helsinki, and highlight the persistence and path-dependency of development trajectories. The urban planning approaches focusing on densification and polycentric development were clearly insufficient to overcome the divide.
In the built environment, we observed a significant coldspot covering the central and western districts, as well as the southwestern peninsula, along with a hotspot in the northern and northeastern districts (Figure 1(e)). In the central area, green areas limited construction development, while the northern districts bordered the city of Vantaa, resulting in uninterrupted constructions with another municipality. As there were no housing hotspots in the northern districts (Figure 1(b)), the constructions tied to industrial development. These patterns remained stable, and - once more - were not affected by new constructions or urban plans.
Average road BC exhibited coldspots in peripheral areas and a large hotspot in the centre, eastern and northeastern areas, which strongly emerged after 1999 (Figure 1(f)). In 1991, few districts showed high values in these areas and extreme eastern districts showed high values due to the highway. The centre, east and northeast became increasingly crucial for district connections and sustained their role as a linking hub for Helsinki. In contrast, peripheral road BC increasingly exhibit coldspots in both high- and low-income areas (Figure 1(c)).
We counted the number of districts in each cluster to compare the results for each year (see Table S2 in Supplementary Materials). Most districts were neither hotspots nor coldspots, and hotspots were more common except for the built-up area. Hotspots of housing units and income increased from 1991 to 2016, except for one decrease in 2007. Coldspots for housing units remained almost constant, and for income, they had the same value in 1991 and 2016. Labour rate decreased in coldspots and increased in hotspots over time. Population showed less consistent trends, with the fewest hotspots in 2007. These findings suggest that in 2007, the number of districts clustered as hotspots for population, housing units and income decreased, indicating a lower probability of forming hotspots. Unlike socioeconomic variables, both road BC and buildings had increasing hotspots and coldspots.
Referring back to Figure 1(a), the population did not cluster in the western peninsula in 2007 as in other years, indicating fewer people lived there. In Figure 1(c), the income showed that districts in the northern area stopped being clustered as hotspots in 2007, instead of clustering solely in the western and southwestern peninsula. Our results suggest more spatial economic disparities in 2007 than in previous years, possibly reflecting the repercussions of the 1990s crisis. This means that, despite well-meaning masterplans, the socioeconomic system disparities deepened over time, instead of diminishing. However, the labour rate did not decrease hotspots, showing changes in residential and income distributions did not impact the employment rate in 2007. Overall, the socioeconomic variables showed more variability than the built environment, suggesting higher sensitivity to shocks and distinct change dynamics.
Correlation analyses
Correlation analyses between variables in time
The correlation analysis showed strong self-correlation over time for population, income, housing units, and the number of buildings with a minimum value of 0.7 (Figure 2), indicating strong path-dependencies. Population and housing variables strongly correlated over the years, while correlations between population and income and labour variables were weaker (see also Tables S3-6 in Supplementary Materials). Correlation results for population, income, labour rate, housing units, buildings and average betweenness centrality (BC). Correlation values are also reported in the Supplementary Material.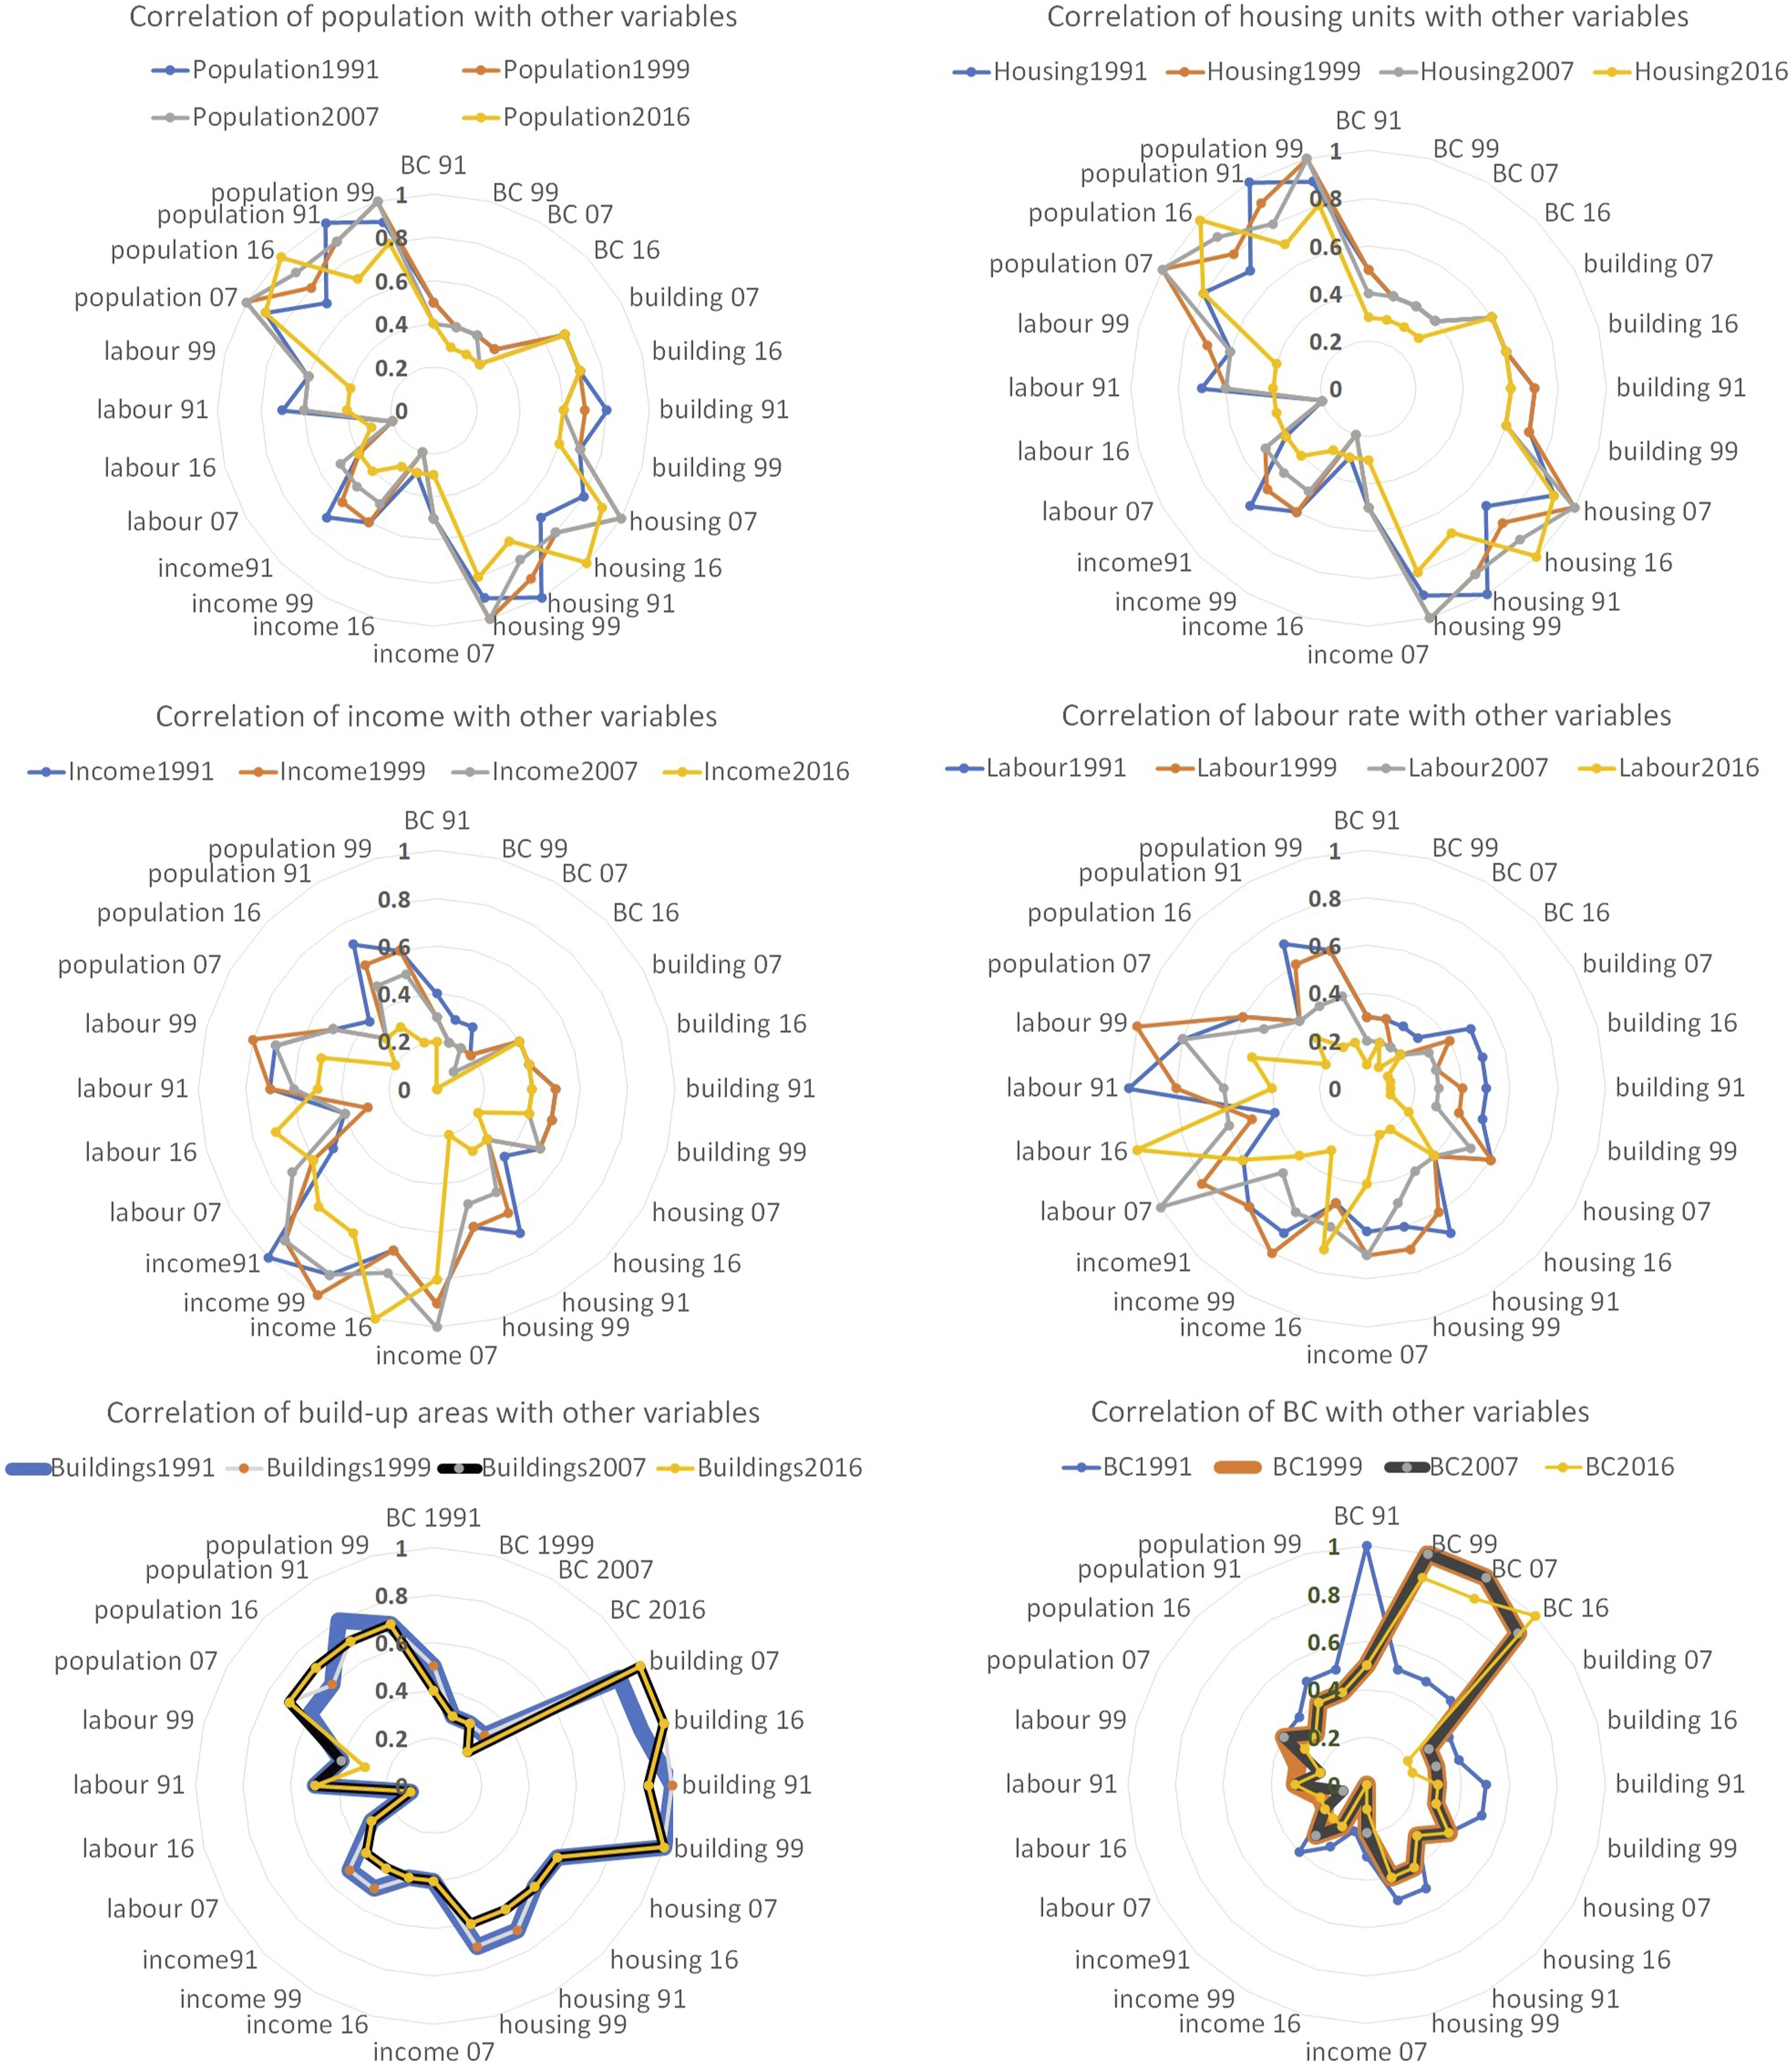
Correlation analysis revealed persistent relationships between population, labour and income variables. In particular, correlations between population (including not working-age population), labour, and income gradually decreased over time, from 0.7 in 1991 to 0.3 in 2016, indicating income and labour inequalities, especially in 1999, 2007 and 2016 (after the economic crisis). If there was equality, we would expect similar relationships between all socioeconomic variables. The labour rate and income were correlated by 0.7–0.8 in the same years. Examining the correlation of labour rate at time t with income at time t-1, we found that the correlation values decreased in time (from 0.7 to 0.4). However, the correlation between income at time t and labour rate at time t-1 remained nearly constant (around 0.7–0.6). These results indicate that labour opportunities in a district are more likely to relate to its future income than vice versa. This relationship became increasingly prominent over time.
Interestingly, correlation values of road BC with income ranged from 0 to 0.4, and with the labour rate from 0.1 to 0.3, indicating weak relationships between these variables. For urban planners, this implies that merely connecting an area alone is not sufficient to substantially improve income. In addition, we found that the number of buildings always correlated with the population variables by 0.7, with housing units from 0.7 to 0.6 over time and income from 0.5 to 0.4. This result indicates that most of the buildings were used for residential purposes.
Correlation analyses of percentage changes
We tested for temporal correlations between the percentage changes of variables to identify similar change patterns. Figure 3 displays spatial distributions of increases and decreases in districts. Population in most districts increased from 2007 to 2016. The number of buildings and income increased uniformly and constantly. Increases in labour shifted in space over time, with increasing economic dominance of the western districts. The average road BC mainly increased until 1999, then it decreased values in central districts. Overall, variables exhibited diverse spatial patterns of increase and decrease over time, leading us to anticipate low correlations between most percentage changes. Spatial distribution of changes in population, housing units, labour rate, income, built-up areas, and average road betweenness centrality (BC) during three periods: 1991–1999, 1999–2007 and 2007–2016.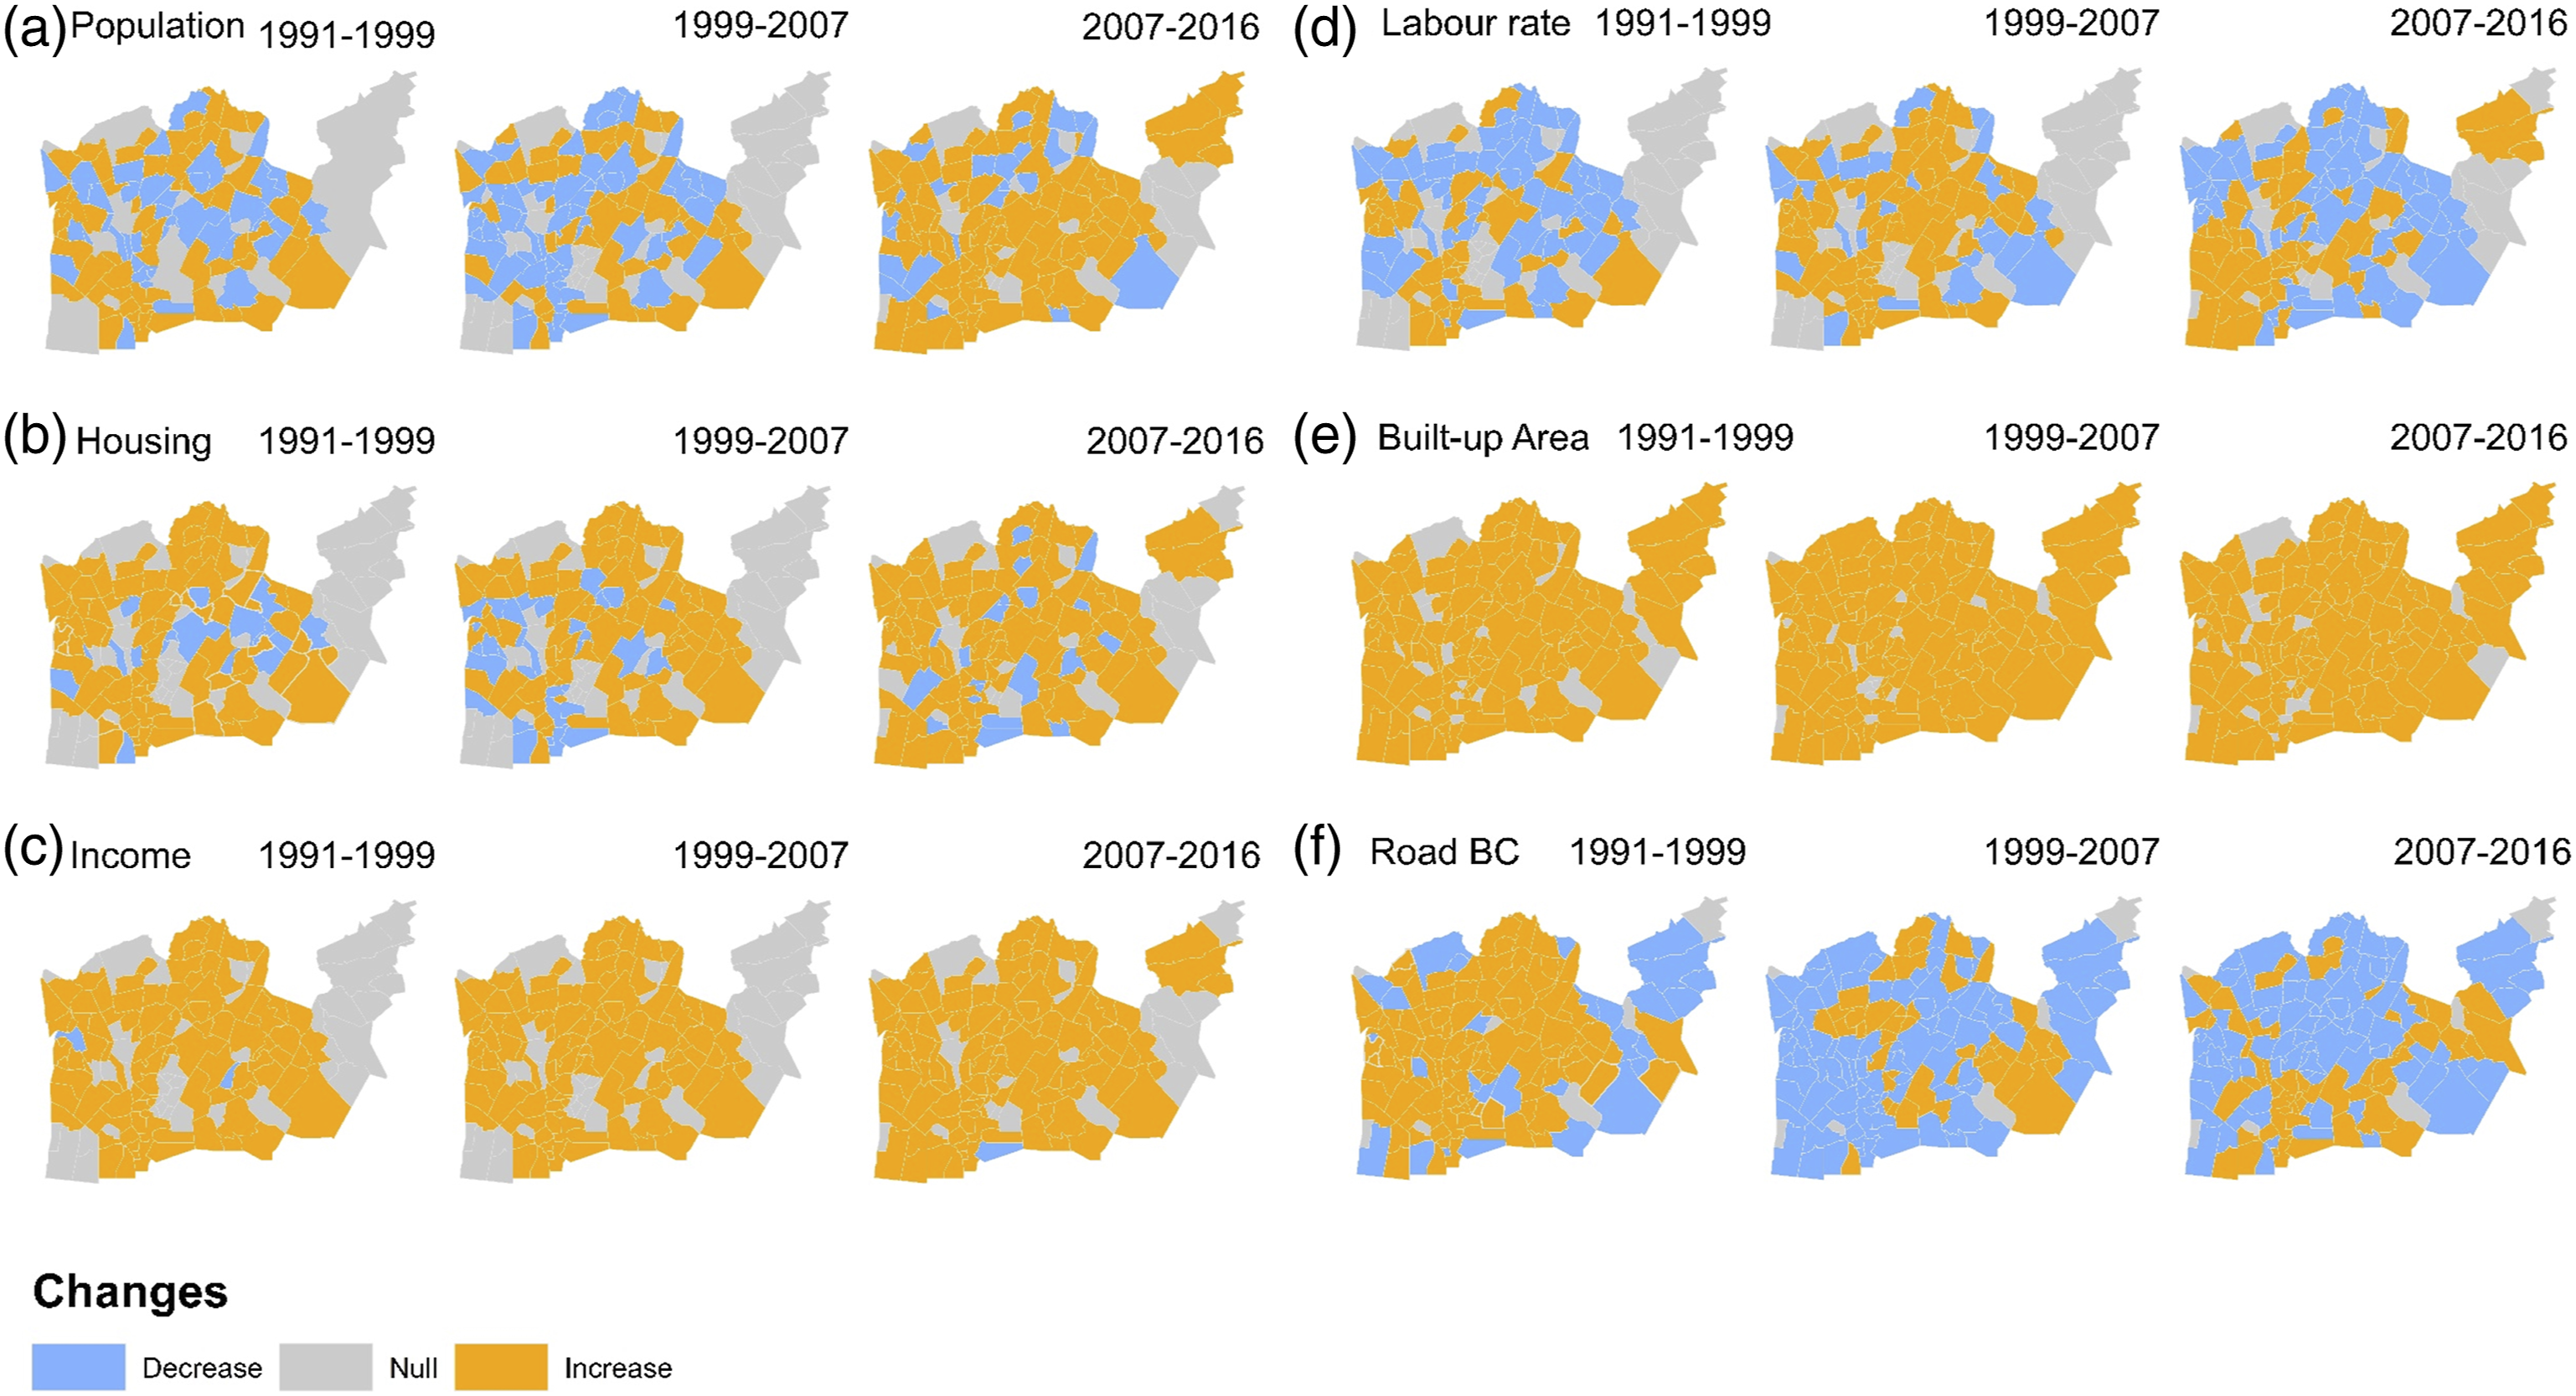
We analysed how the percentage changes of different variables correlated in the same period (Tables S9-11 in Supplementary Materials). Some correlations were significant: percentage changes in population and housing units showed the highest correlations, around 0.7–0.8. Percentage changes of income and housing units correlated by 0.3–0.6; between income and labour rate by 0.2–0.5; and income and population by 0.4–0.5 in 1991–1999 and 2007–2016. Changes in socioeconomic variables were mostly related during 1991–1999; with an exception for the changes in the income and labour rate that showed the highest correlation (by 0.5) in 1999–2007.
Correlations between changes in population-housing units and income-labour rate were higher in 1991–1999 as compared to 2007–2016. The changes in the built-up areas correlated with the changes in population and housing units by 0.3–0.6, with the highest correlation values in 1999–2007. The percentage changes in the average BC correlated with income and labour rate by −0.2 only between 1999 and 2007. These results indicate that there was a shift in the trends of how variables co-evolved from 1999 to 2007, possibly indicating a decoupling of urban subsystems and a new regime. During this period, income and labour rate changes were highly correlated, and the changes in buildings were strongly related to residential development, represented by population and housing units. Importantly, urban planners and designers can therefore use our analysis to detect such decoupling points, and adjust urban plans to the new regime.
Discussion
Co-evolution insights
We identify four main insights on the co-evolution of socioeconomic, infrastructure systems and built environment characteristics in Helsinki. Based on the literature, we tested for persistent differences in socioeconomic development between the West and East in the 1990s and beyond, as well as increased building densification and road connectivity over time.
First, we found persistent differences in the socioeconomic hotspots and coldspots occurred between East and West of Helsinki. Built-up areas formed a coldspot in central, western districts and the southwestern peninsula, with a hotspot in the north and northeast. Average road BC showed coldspots in the periphery and a large hotspot in the central, eastern and northeastern districts. Results align with Vaattovaara and Kortteinen’s (2003) findings, indicating socioeconomic disparities already existed in the 1990s. Our study extended their socioeconomic analyses after the 1990s, revealing persistent disparities over 20 years after the recession, suggesting strong path-dependencies.
Comparing spatial clusters over time showed that the socioeconomic system exhibited stronger variations than the built environment. Buildings and road infrastructures change relatively slowly, while socioeconomic characteristics exhibit greater volatility. This is in line with research on timescales of urban change (Krishnan et al., 2023), but bears implications for urban planning and resilience: while the built environment may be able to absorb shocks, the underlying socioeconomic fabric can undergo rapid, uncertain and drastic change revealing a mismatch between the changing population needs and existing built environment. This is particularly true for Helsinki, where city planning aims to densify built-up areas and roads while preserving existing green space (Hannikainen 2019).
Second, the socioeconomic disparities worsened in the 2000s, underlining once more the prominence of path-dependencies and negative loops that make it challenging to reverse urban trends. Spatial clusters showed high-value income and labour rate hotspots in the southwestern peninsula, expanding towards the West over time for income. In contrast, the eastern districts showed hotspots only for population and housing units with a coldspot for income in 2016 (Figure 1(c) and 1(d)). From 1999 to 2007, Helsinki’s city centre depopulated (Figure 3(a)), with no hotspots in 2007 (Figure 1(a)). Meanwhile, the income clustered in the western and southwestern peninsula (Figure 1(c)), and the number of hotspots decreased for population, housing units, and income in 2007 (Table S2). In contrast, the labour rate was unaffected by this dynamic. Correlation analyses revealed a higher relationship between labour at time t-1 and income at time t (Figure 2 and Table S4 in Supplementary Materials), suggesting that higher labour rates in western districts before 2007 may have sustained income levels there. Vaattovaara and Kortteinen (2003) also reported a structural employment shift caused by IT-based companies and the university in Western areas during the 90s.
Correlation values between population, labour and income decreased over time (Figure 2 and Table S4 in Supplementary Materials) suggesting increasing inequality. Percentage changes between income and labour rates were most related from 1999–2007, and correlations between population-housing units and income-labour rates were higher in the 1991–1999 period compared to 2007 Table S2 2016. These results demonstrate a shift in socioeconomic variables between 1999 and 2007.
Third, buildings strongly relate to residential development and inner-city densification. Correlation analysis showed buildings mostly linked to population and housing units (see Table S7 in the Supplementary Materials), aligning with the city’s commitment to primarily use existing urban buildings for residential purposes (Tiitu et al., 2021). Buildings consistently and uniformly increased across districts (Figure 3(e), mainly due to residential development, particularly from 1999 to 2007 (Tables S9-11 in Supplementary Materials).
Fourth, the average road betweenness centrality (BC) differs in evolution from socioeconomic variables and buildings. Average BC weakly correlated with socioeconomic variables (Figure 3 and Table S8 in the Supplementary Materials). Percentage changes showed slight negative correlations between average BC and income/labour rate only from 1999 to 2016 (Table S10 in Supplementary Materials). These results showed that it is hard to find relationships between a topological metric, such as average road BC, and other urban variables at a district level (e.g., areal analyses). Our empirical findings are not in line with earlier studies that used simulation modelling, assuming completely direct relationships between traffic network investments and population and employment distributions (Li et al., 2016). They also expand the discussion on the use of betweenness centrality in urban evolution analysis, investigated in papers like Casali and Heinimann (2019) and Lan et al. (2022). Our findings show that changes in centrality measures might not have the same growth pattern as other urban layers. Using aggregated statistics of BC might limit relationship detection with socioeconomic and building data.
In summary, our results reveal diverse co-evolution patterns. By 2016, district socioeconomic characterization showed increased inequality compared to 1991. Socioeconomic changes and their pace did not align with changes in buildings and average road betweenness centrality. Economic recession and spatial distribution of opportunities likely contribute to prolonged and amplifying socioeconomic disparities. In contrast, new development of buildings and road infrastructure connectivity follows plans driven by factors like the availability of space, previous constructions or planning interests.
Resilience insights
We analyse the resilience implications of our findings by distinguishing adsorption, recovery, adaptation and resilience planning. For absorptive resilience, we find that socioeconomic disparities between eastern and western Helsinki persisted since the 1990s and intensified in the 2000s. This might be due to unequal growth and prosperity, creating social and economic vulnerabilities. This finding highlights how persistent socioeconomic path-dependencies are, such as the economic crisis that hit Helsinki in the 1990s. The recession qualifies as a “critical juncture,” in which resilient urban planning is of paramount importance (Choi et al., 2019).
For the recovery, empirical resilience studies traditionally focus on short-term resilience - cities rapidly recovering from sudden shocks, typically spanning weeks or months. This concerns recovery from hurricanes (Balakrishnan et al., 2020; Kunz et al., 2013; Zobel et al., 2021); earthquakes (Aydin et al., 2018; Bruneau et al., 2003) or flood resilience (Pregnolato et al., 2016). Even for protracted crises such as COVID-19 (Champlin et al., 2023; Yao et al., 2023), or social resilience (Aldrich and Meyer, 2015), short-term timeframes are conventionally employed. Our results clearly show that recovery takes time, and that there is a clear risk for disadvantaged areas or marginalised populations that a crisis amplifies their position. Even after two decades, the traces of the crises in urban space persist resulting in prolonged differences that are still measurable. Along with the calls for systematically measuring resilience (Jones et al., 2021), we argue for more longitudinal studies that aim to measure how resilience propagates and evolves in slow-moving urban systems.
For economic resilience, we observed a shift in the employment rates and income levels in the western areas. This highlights how the ICT and university sectors connect to new economic opportunities in specific areas, accessible mainly to highly skilled workers. Correlation analyses suggest that higher labour rates in the western districts before 2007 may have sustained income levels there. These findings are in line with Martin (2012), who described how prior economic growth, innovation systems, skills and entrepreneurial culture help to adapt to recessionary shocks. To create resilient economies, during the recovery phase, changes to industrial, technological, and workforce composition, business models, and working practices are important to adapt and achieve a sustained higher growth (Martin, 2012). Moreover, the ICT and university sectors contributed to diversification and coping capacities of the Western areas compared to the Eastern areas.
Both findings relate to adaptive resilience, or the need for cities to adapt and structurally change in response to crises. Following Sharifi (2023), the key principles of adaptive resilience are learning, self-organization, adaptability and transformability. Our discussion of economic resilience highlights the importance of social-economic systems. In addition, we find that underlying structural aspects of technological systems play a critical role. While in the literature, principles such as polycentricity, diversity and redundancy are attributed to absorptive resilience (Sharifi, 2023), we find that the eastern areas of Helsinki did not adapt as well as the western areas, suggesting that a lack unequal distribution of opportunities hinders not only short-term absorption but also longer-term adaptation.
Urban planning insights
For urban resilience planning, a drawback of the increasing socioeconomic disparities is gentrification, as affluent buyers and investors acquire real estate, contributing to the unequal distributions of goods and opportunities (Anguelovski et al., 2017). These disparities influence resilience patterns during natural disasters (Hong et al., 2021), and higher inequality were related to increased COVID-19 mortality (Elgar et al., 2020). Increasing inequality also weakens social cohesion and social capital, thereby eroding urban resilience (Champlin et al., 2023). Urban resilience planning requires considering distributional, recognitional and procedural equity (Meerow and Newell, 2016). A planning strategy to improve urban equality linked to the built environment is, for example, to provide support for housing and transport for vulnerable groups (Mouratidis, 2021). Therefore, urban resilience plans should acknowledge socioeconomic differences and promote policies to reduce inequality. At the same time, our findings show that relations between urban systems change over time, and that regime shifts occur. Therefore, urban resilience policy and planning practice need to undergo systematic empirical evaluations to ensure effectiveness and long-term success of policies.
This study once more confirms that cities undergo continuous change, necessitating systematic and dynamic urban planning through regular and iterative processes such as monitoring, assessment and scenario making (Sharifi and Yamagata, 2018). However, traditional urban planning approaches still largely rely on fixed timelines and focus on individual infrastructures or systems (Krishnan et al., 2024). For instance, McMillen et al. (2017) emphasise that planners should formulate coping strategies based on the evolving capabilities of communities over time. They do, however, not state how the community capabilities relate to the built environment and how infrastructures need to be designed to support these capabilities.
The increasing frequency of disruptions with prolonged cascading effects across different infrastructure systems thus present a double challenge to urban planning: first, planners need to develop approaches to rapidly respond to crises and disruptions as they occur. Second, these plans need to integrate the long-term impacts of the disaster (and the urban responses to it), as the impacts ripple through different infrastructural, environmental and social systems. Importantly, this paper has shown that these systems have different rigidities and will adhere to different timelines. As such, urban planners need a flexible approach that integrates short-, medium- and long-term effects.
There has been evidence that studies on urban evolution offer significant and valuable lessons for discerning dynamic patterns, facilitating the urban adaptation to future changes (McMillen et al., 2017; Sharifi and Yamagata, 2018). In our study we found that socioeconomic clusters were more volatile than the built environment, which required longer periods to transform. Urban planners may often be under pressure to achieve short-term targets, leading to a focus on fast moving systems. However, in planning for resilience, we show that volatile socioeconomic traits need to be integrated into slower moving patterns such as changing infrastructures. Planning for how institutions will respond to social change, for example, via scenarios or by creating buffer-capacity and flexible spaces (Krishnan et al., 2023), will help in preparing better resilient plans.
Moreover, preparing adaptation plans exclusively based on indicators (e.g., “output myopia”) without considering the multidimensional relationships of urban components remains inadequate, especially in analysing socioeconomic dynamics and consequences (Goonesekera and Olazabal, 2022). Our results clearly support this aspect because urban components showed different patterns over time, adding complexity into the prediction of how cities change. Our proposed approach can be integrated into the urban planning process to test scenarios of multidimensional evolution. In this way, the urban planning processes will embrace a more complex system-thinking approach by studying various systems collectively and preparing more meaningful analyses.
Methodological insights
The advantage of our approach is inferring spatiotemporal urban systems changes from real records rather than assumption-based simulations. This approach revealed the decoupling of the road network centrality from built environment development, in contrast to simulation-based assumptions on rational settlement behaviour (Li et al., 2016).
Correlation analyses require large-scale and accurate data. This is important for co-evolution analyses because historical records are often not digitised. Due to the gradual pace of change in the built environment, it is crucial to carefully select the temporal data with meaningful granularity to capture the correlation and co-evolution dynamics in urban subsystems. In our case, the lack of continuous large-scale time-series data prevented temporal correlation analyses at district level. Nevertheless, the use of data-driven techniques helped reveal relatively smaller clusters that may remain hidden in qualitative analyses (e.g., by Vaattovaara and Kortteinen 2003). For instance, we were able to reveal the socioeconomic patterns of the central-eastern and eastern districts.
For the spatial analyses, the Getis-ord Gi* method requires selecting a spatial weight for representing spatial relationships and making the results dependent on one parameter. The Getis-Ord Gi* results confirmed and extended Porat et al.'s (2012) conclusion on identifying residential developments by spatial association statistics. Our findings also confirmed Kurek et al.’s (2021) use of spatial association statistics in describing demographic changes in functional urban areas. Our study demonstrated how Getis-Ord Gi* with urban subsystem variables contributes to co-evolution research. However, to derive meaningful socio-spatial patterns and capture the relationships between the variables more comprehensively, correlation analysis are still needed to complement the Getis-Ord Gi* results.
Traditionally, spatial dynamics were qualitatively described by scholars. This approach can complement and contribute to the interpretation of data-driven co-evolution analyses. To capture these rich theoretical and empirical insights, we linked the results of our data analysis to previous qualitative analyses of Helsinki, including Vaattovaara and Kortteinen (2003) or Hedman (1989). This approach allowed us to reflect on urban trends and policies.
Conclusion
This study aimed to develop a data-driven approach to analyse the co-evolution of the socioeconomic system, built environment and road infrastructure. From there, we aim to understand the co-evolution of urban resilience across subsystems. Our approach combines Getis-Ord Gi* statistical and correlation analyses with historical data. We apply our approach to Helsinki, Finland, and analyse the city’s resilience to the 1990s economic crisis over time. Our findings highlight clear path-dependencies, and deepening disparities that persist more than 20 years after the initial crisis. Our approach can be transferred to other geographical contexts. Researchers and urban analysts can use it to analyse the co-evolution in urban areas even if temporal data is limited. We recommend this approach for longitudinal urban resilience studies capturing the dynamics of systems, especially those with high inertia to change such as infrastructure systems.
For urban planners and policy-makers, there are three important implications: first, we showed the need for a systems approach that integrates social, economic and infrastructural systems. We find that infrastructural systems show higher inertia than socioeconomic systems, requiring an alignment of planning and interventions across the different time-horizons of change. Second, we showed that the resilience implications of a socioeconomic crisis have far-reaching consequences that go beyond conventional crisis plans or urban development cycles. Urban planners and policy-makers need to integrate these feedbacks and develop longer-term visions to improve resilience, in which shorter-term or sectoral plans can be embedded. Third, we stressed the notion of critical junctions. For Helsinki, the recession was a turning point that has shaped the evolution of the city for decades. As such, these junctions are critical moments for planners to intervene and ensure that the city’s resilience is safeguarded for the future.
There are limitations to our study. Investigating causality, which was outside the scope of this study, is key to understanding how different urban layers co-evolve. Moreover, future research can explore assessing connectivity and mobility using transport data, going beyond road betweenness centrality as a proxy for flow. Investigating the co-evolution in other cities that were subject to economic recession can help further understand the diverging and converging patterns that drive co-evolution and resilience across urban subsystems.
Supplemental Material
Supplemental Material - A data-driven approach to analyse the co-evolution of urban systems through a resilience lens: A Helsinki case study
Supplemental Material for A data-driven approach to analyse the co-evolution of urban systems through a resilience lens: A Helsinki case study by Ylenia Casali, Nazli Yonca Aydin and Tina Comes in Environment and Planning B: Urban Analytics and City Science.
Footnotes
Acknowledgments
The authors would like to extend their gratitude to the University of the Basque Country (UPV/EHU) for providing the open-access publishing option for this paper. They also express their appreciation to Francien Baijanova for her assistance in constructing the spatio-temporal dataset used in this research. Authors would like to thank the TPM Resilience Lab at TU Delft for the support provided in the development of this research.
Declaration of conflicting interests
The author(s) declared no potential conflicts of interest with respect to the research, authorship, and/or publication of this article.
Funding
The author(s) disclosed receipt of the following financial support for the research, authorship, and/or publication of this article: This work was supported by the Delft University of Technology (TU Delft) and the University of the Basque Country (UPV/EHU).
Data Availability Statement
The data that support the findings of this study are available from the corresponding author upon reasonable request.
Supplemental Material
Supplemental material for this article is available online.
References
Supplementary Material
Please find the following supplemental material available below.
For Open Access articles published under a Creative Commons License, all supplemental material carries the same license as the article it is associated with.
For non-Open Access articles published, all supplemental material carries a non-exclusive license, and permission requests for re-use of supplemental material or any part of supplemental material shall be sent directly to the copyright owner as specified in the copyright notice associated with the article.