
Abstract
Prior research on the scaling of city size and inequality has a primary focus on economic factors such as income. Limited research has addressed socio-spatial disparities in mobility, involving physical activities and social interactions among individuals and population groups. Utilising mobile phone app data, this study measured inequalities using multiple mobility-related indicators (i.e. the number of activity points, the radius of gyration, self-containment, and social interaction indices) and related to population size by scaling models. In England’s context, these indicators unfolding mobility patterns and social issues display different scaling regimes, varying from sublinear to super-linear. It was observed that larger cities are associated with greater social interactions, particularly among socioeconomically advantaged groups; however, they also exhibit exacerbated self-segregation. Due to the radiation effect of big cities, the performances (e.g. travel radius) of small surrounding towns deviate from the predicted values of scaling models. Within cities, the evenness of indicators is independent of population size and produces distinct spatial patterns. The findings expand upon previous research and provide a more nuanced understanding of the complex relationship between city size, urban inequality, and human mobility.
Introduction
Comprehending how urbanisation-induced urban dynamics affect the interplay between people and society has emerged as a significant challenge. Although bigger cities generate more economic outputs, they might produce higher living costs and urban inequality, leading to the unsustainability of cities (Baum-Snow and Pavan, 2013; Sarkar, 2019). The escalation of urban inequality raises concerns about the health and livelihoods of urban residents, sparking a substantial academic debate. Previous studies focused on economic inequality, neglecting other forms of socio-spatial inequality due to limited fine-grain data. Socio-spatial inequality highlights how social and economic disparities are intertwined with spatial patterns, such as residential segregation and access to urban opportunities and services (Han, 2022; Modai-Snir and Van Ham, 2018). Human movement and daily activity spaces reveal urban resource access and segregation levels, providing a valuable opportunity for detailed empirical exploration of urban inequalities (Cagney et al., 2020; Comber et al., 2022; Gao et al., 2021).
Studying people’s movement in cities of different sizes has been challenging due to lengthy data collection processes, geographic limitations, and potential sampling biases linked to traditional data collection methods. Consequently, previous studies are mainly (residential) place-centred and static, ignoring the segregation experience across various activity spaces due to the dynamism of movements (Li et al., 2022). Recently, big data capturing multiple facets of urban spaces and human behaviours provides us with better observations of daily mobility and social interactions. However, some relevant work using mobility big data is dominantly about American cities, and only a few addressed European Union cities, resulting in a big puzzle surrounding the mobility-based inequality and its potential relationship with urbanisation (Nilforoshan et al., 2023; Wang et al., 2018).
Urban scaling law has been utilised as a powerful predictive tool and quantitative theory of urban organisation, economic development, and human behaviours toward urbanisation (Bettencourt et al., 2013). Several crucial urban variables have been identified to be scale functions of city size across different countries (Li et al., 2017). The observations about scaling behaviours are particularly valuable in determining the optimal size for a city (Batty, 2008). In this sense, the existence of scaling laws of urban inequality might provide fundamental quantitative insights and predictability into underlying social processes toward urban sustainability.
This study aims to find out to what degree the growing city size could exacerbate or alleviate mobility-related inequality based on the emerging mobility phone app dataset, and whether or not follows any scaling behaviours that could be valuable in determining the optimal size for a city. Answers to this question provide substantial evidence for the development of urban inequalities in mobility and segregation in urban areas. The shifting of our attention beyond American cities not only contributes to the diversity of global urban studies but also provides a broader and more comprehensive perspective. By examining cities in England, we can compare urban development differences among various countries or regions, thereby enhancing our understanding of both common trends and unique circumstances in global urbanisation. Such an expanded view facilitates deeper academic discussions and offers insightful viewpoints and solutions for urban planning and development.
Literature review
Urban inequality
Sustainable urban development relies on diverse populations and strong social cohesion. However, cities are witnessing mounting segregation and inequality (Tammaru et al., 2020). These trends pose a threat to the economic, social and health outcomes of urban residents and the next generation (Xu et al., 2023). Research and debate focus on the link between city size and inequality, with larger cities found to have higher levels of inequality (Florida, 2017). Although larger cities are generally more productive and prosperous, their distribution is uneven and follows a heavy-tailed pattern, particularly in comparison to smaller cities (Arvidsson et al., 2023). The highest earners saw the most substantial growth in growing cities, suggesting that urbanisation may intensify inequality (Shutters et al., 2022). According to Sarkar (2019), poverty rates among the disadvantaged population may be higher in large cities than in smaller ones. Nonetheless, a French study discovered that city size is an unreliable predictor of inequality as regression models examining the scaling law show poor statistical fitness (Cottineau et al., 2019). The conflicting findings might be attributed to the different definitions of cities and measurements of inequality.
The correlation between urban inequality and city size has been debated, but the evidence remains inconclusive. Existing studies primarily adopted economic indicators (e.g. income and wage) to measure inequality, other crucial dimensions of the phenomenon have been overlooked (Sarkar et al., 2016; Shutters et al., 2022). Equal access to urban resources is crucial in allocating resources fairly among different groups (Gao et al., 2022). Social segregation, another manifestation of urban inequality, is a threat to a city’s sustainability and cannot be overlooked (Musterd et al., 2017).
Human mobility and activity space
Tracking human mobility offers a potent way to grasp urban inequality and its influence on how different socioeconomic groups interact within urban spaces (Li et al., 2022). People’s movements within a space are influenced by their personal preferences, socioeconomic status (SES), demographic characteristics, safety concerns, and cultural backgrounds (Gauvin et al., 2020; Park and Kwan, 2018). Urban resources and opportunities are not equally distributed across the city or metropolitan areas. Certain neighbourhoods enjoy superior access to vital services, such as healthcare, education, and employment opportunities, while others may face a scarcity of such resources. The unequal access can significantly affect people’s travel patterns, as individuals residing in areas with inadequate resources may have to travel considerable distances to access necessary services. These movements also determine one’s exposure to the social environment and potential interactions with others, ultimately impacting urban inclusivity and social equality (Farber et al., 2015).
Activity space reflects the geographic areas they perform daily activities and the people they interact with in their daily lives (Zhang et al., 2019). Several studies used activity space variations to highlight how diverse socioeconomic groups are limited by their space size and the available variety of urban opportunities (Järv et al., 2015; Silm et al., 2018). The number of unique activity places is a main characteristic of the people’s actual activity space. Having more activities at distinct places indicates more diverse daily life. It reflects how people take advantage of urban facilities under the complex interactions of individual preferences and spatial-temporal-social constraints. If one group travels to fewer places compared to its counterparts, it might have fewer chances to encounter others and to be more isolated as a result (Wang et al., 2018).
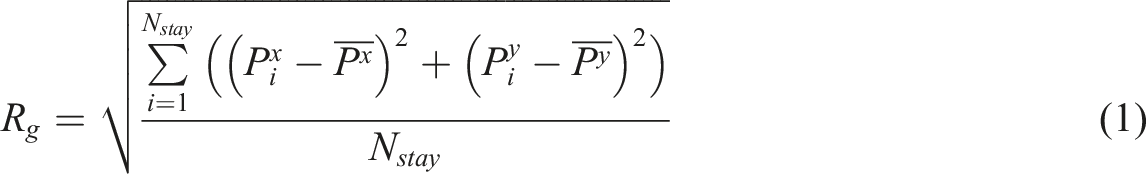
The radius of gyration quantifies the dispersion of one’s activity space. A larger radius of gyration sometimes means a more dispersed activity space, suggesting that people have the ability (e.g. better transport accessibility, higher economic ability) to access more opportunities in a larger coverage. In this case, a large radius means an advantage. However, the trend is dependent on the context and may not have universal applicability to all urban areas (Xu et al., 2019). For example, low-income individuals may need to travel farther than their affluent counterparts (Shelton et al., 2015). Besides, compact urban structures can result in a shorter radius of gyration. When focusing on commuting activities, longer travel radii probably imply a heavy commuting burden and geographical disadvantage. Therefore, multiple indicators are combined to depict spatial inequality patterns across subpopulation groups (Gao et al., 2022). Despite the complex potential relationship with inequality, these indicators have been widely used in segregation and isolation research to enhance our understanding of whether people from varying socioeconomic backgrounds can equally benefit from the opportunities provided by cities and participate fully in society (Li et al., 2022; Müürisepp et al., 2022). With the growing usage of communication technology and location-based services over the past decade, human mobility data (e.g. Twitter and mobile positioning data) capturing real-time locations of millions of users has been an innovative data source for studying urban inequality (Gao et al., 2022; Luo et al., 2016). Despite the increasing concerns about urban inequalities in mobility, the relationship with city size remains an open question.
Urban scaling
Measuring the size of an urban system through demographic and socioeconomic processes is a fundamental theme in urban science (Sarkar, 2019). Urban scaling describes how socioeconomic and functional attributes scale with the city size, taking the power-law form of
Urban scaling law holds significant implications for policymakers and urban planners as a theory explaining how urban socioeconomic activities (e.g. potent and income), urban infrastructures (e.g. road network density and building volume), and social progress (e.g. inter-city migration) related to the city size (Batty, 2013; Bettencourt et al., 2013; Prieto Curiel et al., 2018). One of the commonly acknowledged discoveries is that bigger cities are more productive and innovative than smaller ones due to the concentration of high-skilled workers (Arbesman et al., 2009; Glaeser and Resseger, 2010). Besides, contacts and communication activities grow super-linearly with the population size (Schläpfer et al., 2014). However, as the economic advantages of larger cities increase, so do other negative aspects such as travel expenses, crime rate, pollution, and inequality (Sarkar, 2019). In this sense, big cities can be either attractive or unattractive depending on the perspective. This study will explore how inequality increases with urban growth across diverse quantitative aspects. This will enhance our comprehension of the intricate links among city growth, inequality, and sustainability, facilitating appropriate interventions.
Study area and data
Study area
The study area is England, United Kingdom (UK), as shown in Figure 1(a). A total of 109 Major Towns and Cities (refer to TCITY afterward) are used as the main spatial units, whose geography is based on the built-up area dataset. TCITY focuses on the ‘core’ town or city rather than its surrounding area and breaks the link to administrative areas. (a) The study area: England; (b) the correlation between the number of mobile phone users identified and census population data on a log scale; and (c) population distribution histogram.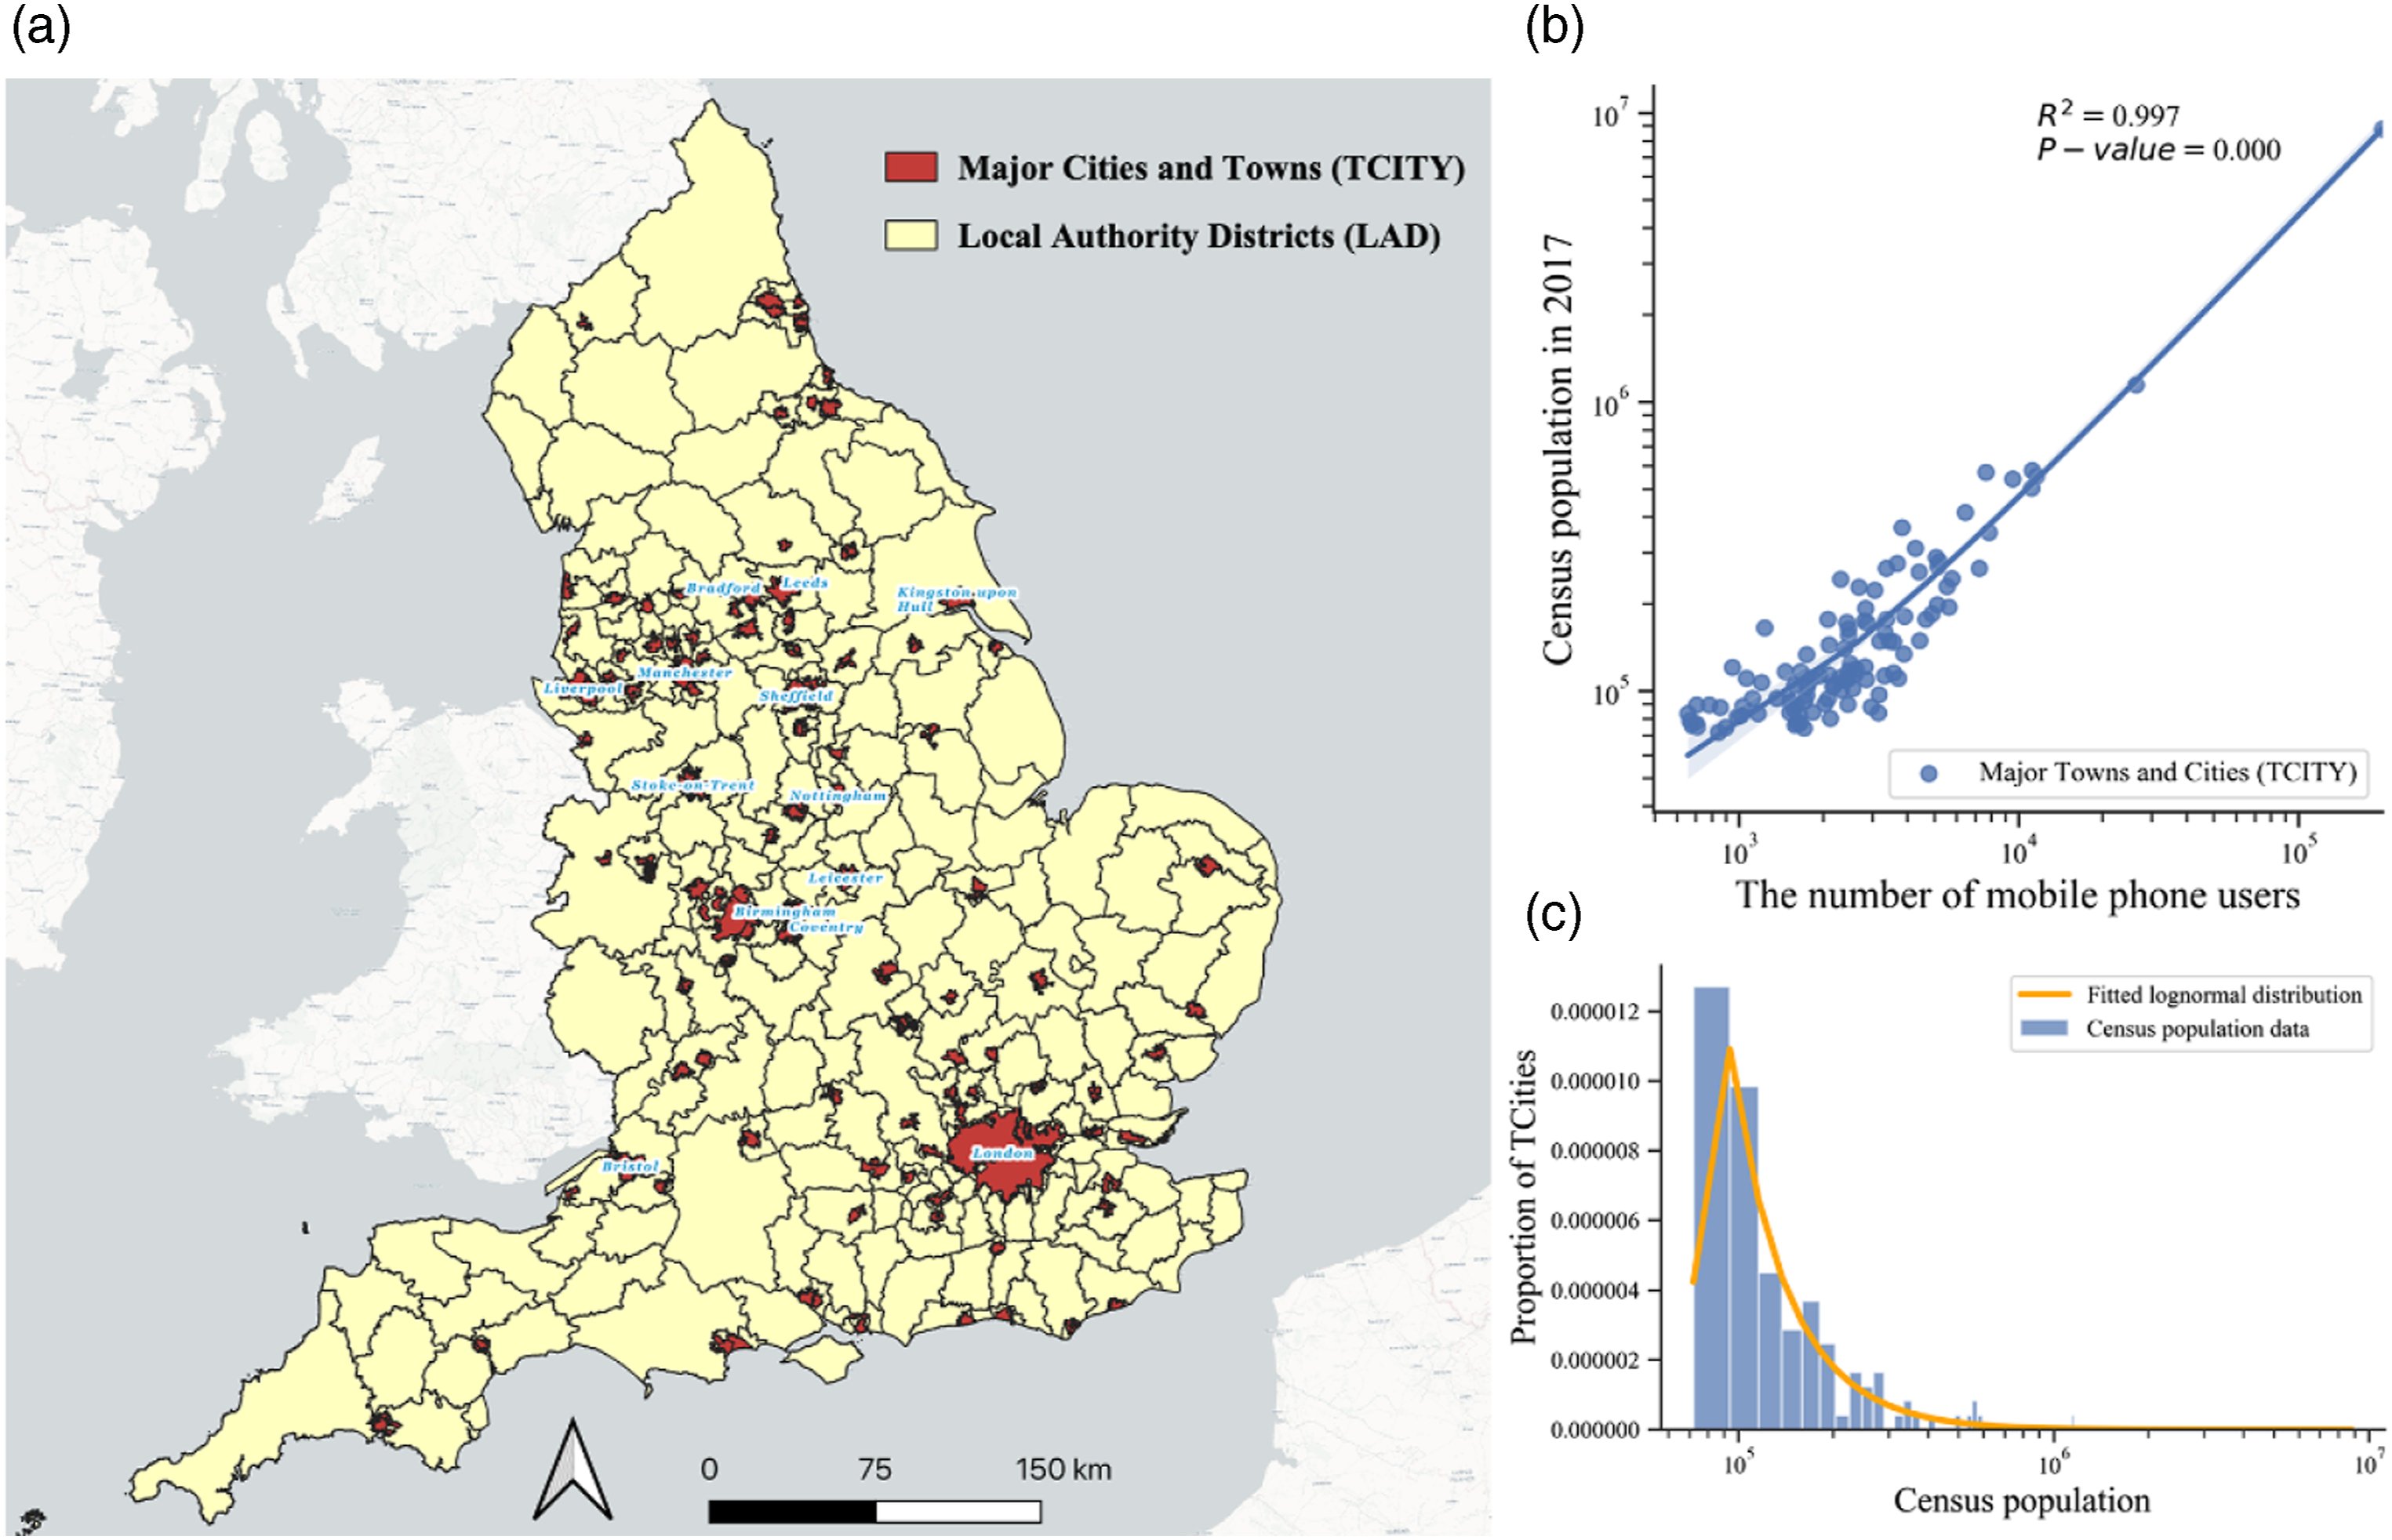
Extracting daily mobility from mobile phone app data
We adopted mobile phone location data gathered through in-applications and collected in March 2021. A user’s location is recorded by the device’s GNSS positioning or fused positioning. The data includes the unique anonymous ID of a user, timestamp, latitude, longitude, and localisation accuracy. The raw data covers roughly 10% of the total population. We excluded users with less than 10 records in a month because their activity places could not be accurately determined. As a result, about 25% of the original users in the dataset left. Afterward, a multi-stage clustering is performed to extract the most regularly visited locations associated with daily activities (Supplemental material). The most regularly visited location is the residence, with the rest of the points treated as non-residence activity locations.
To build the relationships between population size and mobility indicators, all the mobile phone users were aggregated to the corresponding spatial units based on home locations, thus, the spatial unbiasedness serves as a prerequisite for subsequent analysis. We validated home locations by comparing them against census data. The latest TCITY-level population data was estimated in the middle of 2017. Figure 1(b) shows a very high degree of correlation with R2 of 0.997 between the number of identified mobile phone users and the census population, demonstrating the rationality of analysing the mobility behaviours of these mobile phone users against city size in terms of representation of the whole population.
We further examined if the population size follows a power law or a log-normal distribution, as noted in previous literature (Eeckhout, 2004; Rosen and Resnick, 1980). The Maximum Likelihood Estimation (MLE) was used to fit the data more robustly, and the Kolmogorov–Smirnov test was conducted to determine which distribution of the data fits best. The results indicate that the TCITY-level population follows a log-normal distribution (Figure 1(c)).
Profiling socioeconomic status by linking Index of Multiple Deprivation data
Given that the individual SES in mobile phone data is not available to preserve individuals’ privacy, research usually adopts area-based SES indicators as the approximation of individual SES, such as housing prices and median household income of their home areas (Moro et al., 2021; Xu et al., 2019). Moreover, individuals residing in the same location often share similar SES, it is feasible to infer individual SES from the information reported at the group or fine-scale aggregated level.
LSOA (Lower-layer Super Output areas)-level Index of Multiple Deprivation (IMD) decile data in 2019 is utilised to create a socioeconomic profile of mobile phone users. The IMD decile ranks LSOAs according to their level of deprivation, with 1 being the most and 10 the least deprived. We further merged 10 IMD deciles into 5 levels and labelled them to users based on home locations. We assume homogeneity among users within an LSOA unit due to its small size with an average of approximately 1,500 residents or 650 households.
The IMD data is employed in two ways. Firstly, the IMD data is utilised to compute interaction-related indices that quantify the interaction potential and segregation among different groups. Secondly, we examine how scaling effects vary from SES to gain a better understanding of the disparities that exist between different groups.
Methodology
Characterising individual-level mobility indicator
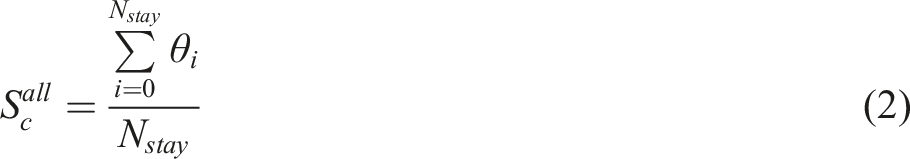
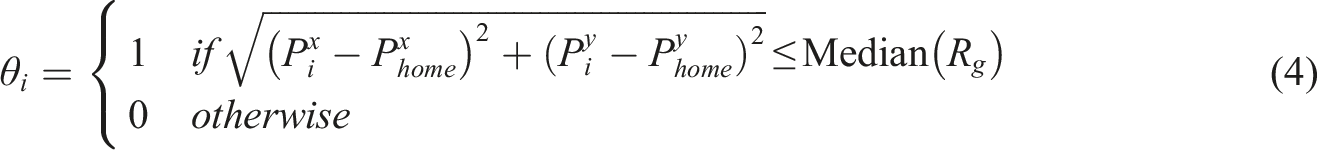
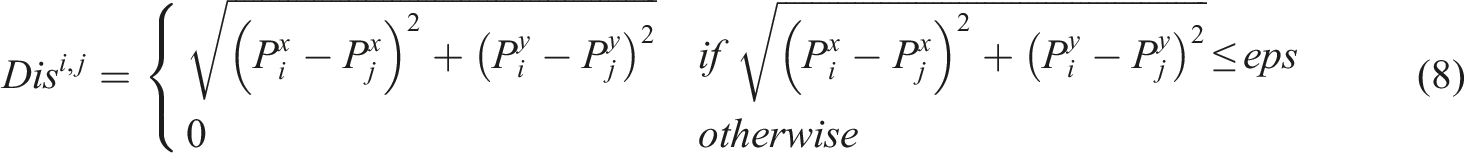
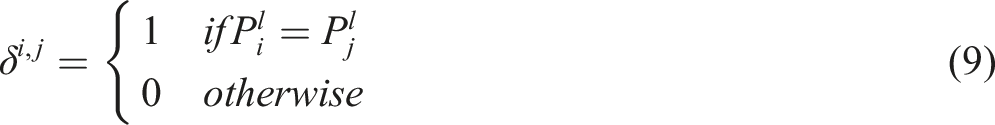
After the preliminary data process, each individual mobile user is profiled with a series of stay points and a proxied SES. Each stay point is described by (1) The number of unique activity points ( (2) Radius of gyration ( (3) Self-containment ( (4) Social interaction potential (

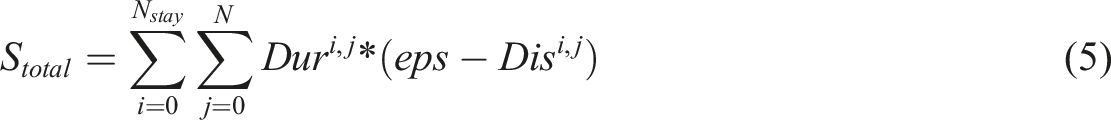
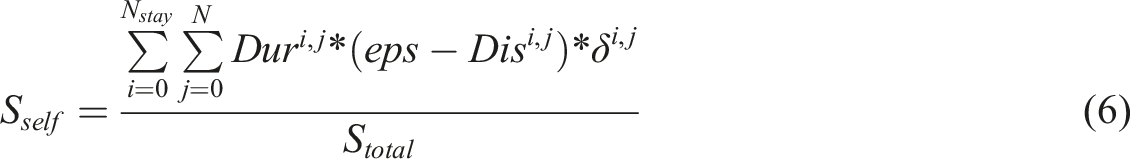

Aggregating at spatial units and measuring inequality
The initial investigation focuses on the total aggregation (sums) of indicators at spatial units, which measures the overall performance of cities and determines if it is the simple sum-up of individuals. The sums capture the between-city variances at the overall level when scaling to city size. However, highly skewed distributions occur within cities, thus, the sums and means are not inadequate to reveal the inequality (Arvidsson et al., 2023). Given that, we further analyse the within-city differences of the relevant indicators and their association with population size, suggesting within-city inequalities. Three inequality methods are applied to evaluate the robustness of the results. In the discrete case, if an attribute of individual
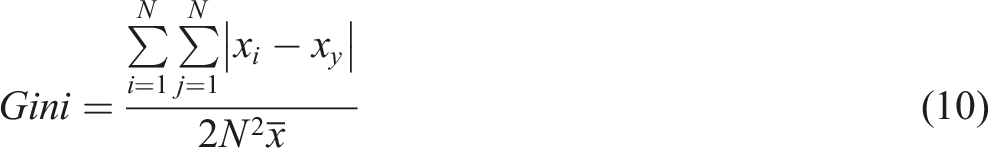
The Theil index is another commonly used inequality approach, which is defined as
The Highest-Lowest Ratio (HLR) is one of the alternative measures to examine variance, which calculates the ratio between the highest- and lowest-level groups at the mean of a certain variable

Exploring urban scaling law
Urban scaling law entails the power-law relationship
Some studies performed log transformation on the variables and used Linear Ordinary Least-Squares regression to estimate the scaling exponent. This method has been demonstrated to suffer from some limitations (Clauset, 2009; Leitaõ, 2016). Following the study (Leitaõ, 2016), we applied MLE and bootstrap methods to generate a more robust estimation.
Results and analysis
Scaling analysis: Between-city urban inequalities
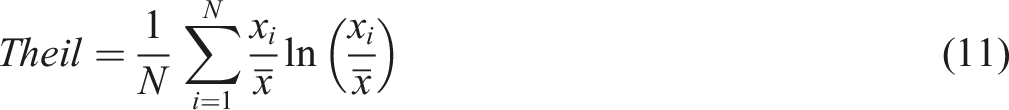
The statistics of individual mobility indicators are presented in Table A1 in the Supplemental material. The total sum of mobility indicators was first scaled against the population size. We present the estimated
As Figure 2 shows, Urban scaling for the sum of indicators: (a) the number of activity points, (b) the radius of gyration, (c) self-containment, (d) non-residence self-containment, (e) total interaction, and (f) self-interaction. We employed MLE and bootstrap methods to estimate the scaling exponent (β) along with a 95% CI for each indicator. The R-squared values observed suggest whether population size is a good indicator for cumulative mobility indicators. Identifying a linear scaling regime is based on whether the 95% CI included 1. Our analysis involved two scenarios: initially, all major cities and towns were included in the models. The left and middle columns of the Figure depict the log-log fitting results and the fitting result on the log scale, respectively. Subsequently, we excluded London to observe the trend among other cities, as shown in the right column of the Figure. The fitted lines are illustrated in red, while the reference models, represented by β = 1, are shown as blue dashed lines.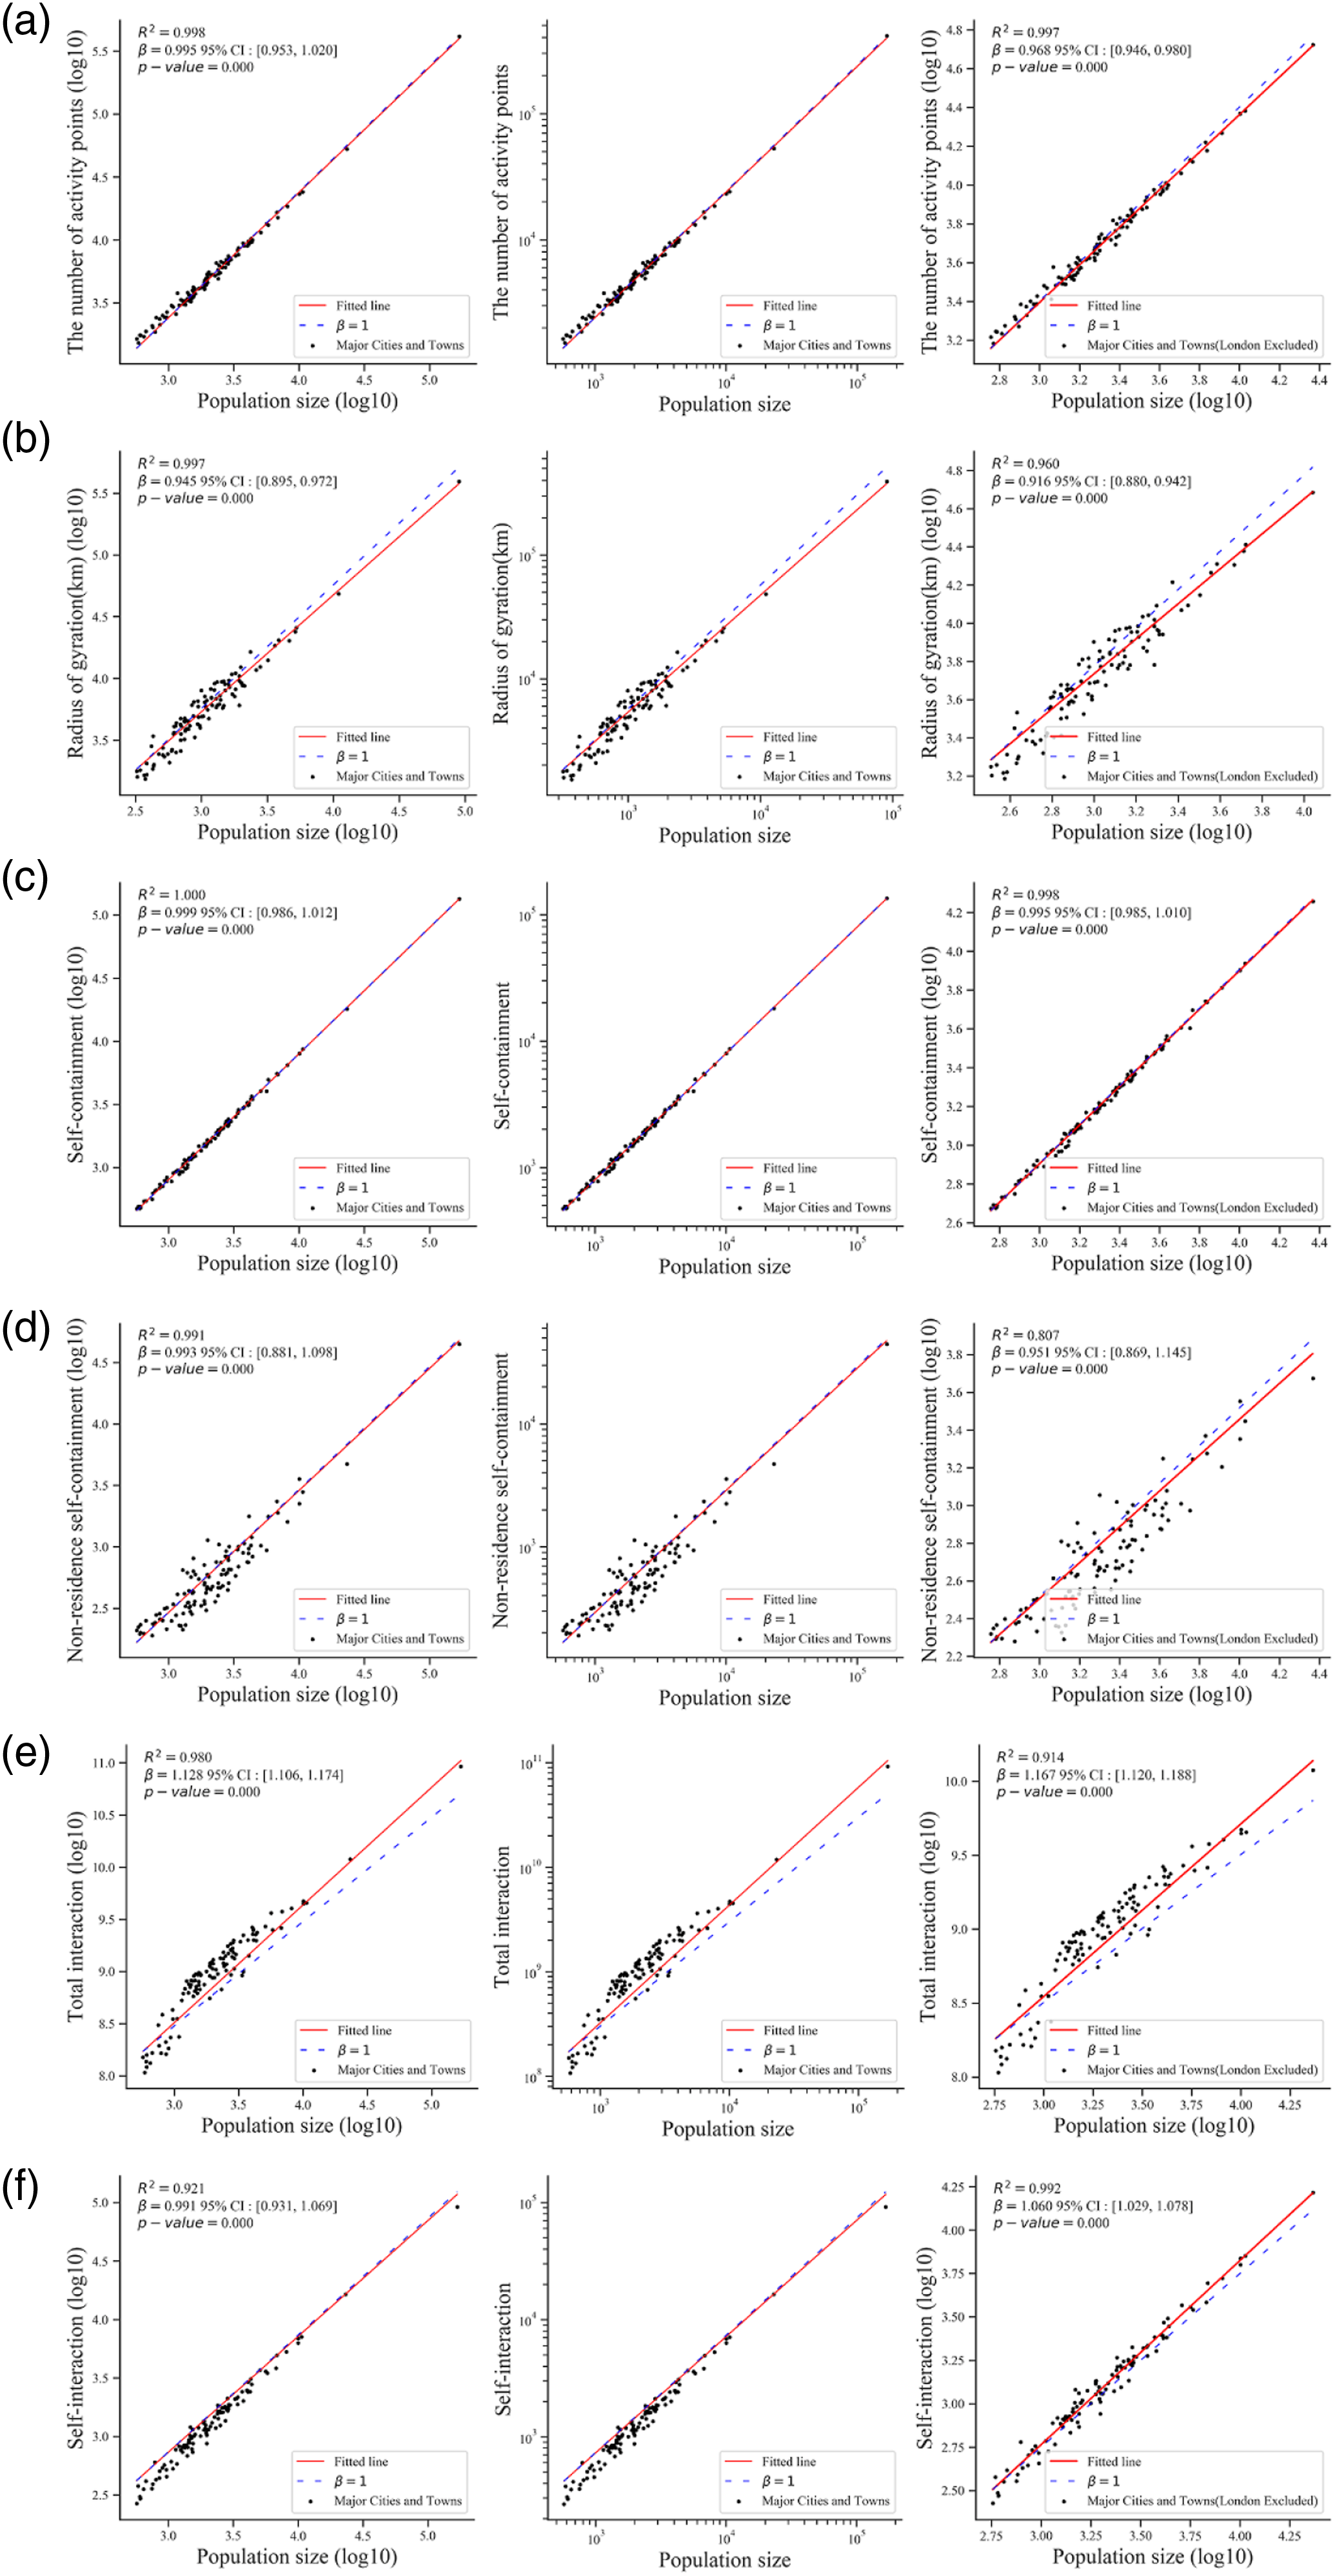
Interestingly, people in both large and small cities had a similar tendency to spend time near home, leading to a remarkable linear relationship between
A study using mobile phone mobility data shows that exposure segregation is much higher in large MSAs than in small MSAs in the US (Nilforoshan et al., 2023). Although different data sources and methods, this study discovered similar findings that big cities are characterised by high-level self-segregation. One possible explanation is that large cities offer a greater choice of differentiated spaces targeted to specific socioeconomic groups. On the contrary, different socioeconomic groups in small cities tend to encounter each other more often due to limited places. The findings challenge the cosmopolitan mixing hypothesis which argues that the diverse population, constrained space and accessible public transport in large cities will increase the mixing of different socioeconomic groups, and reduce segregation.
It is also important to acknowledge that the urban scaling law is a statistical trend, and the performance of individual cities is not only determined by city size but also by other unique urban characteristics (Sarkar, 2019). As presented in Figure 2, the indicators of Residual distribution for indicators: 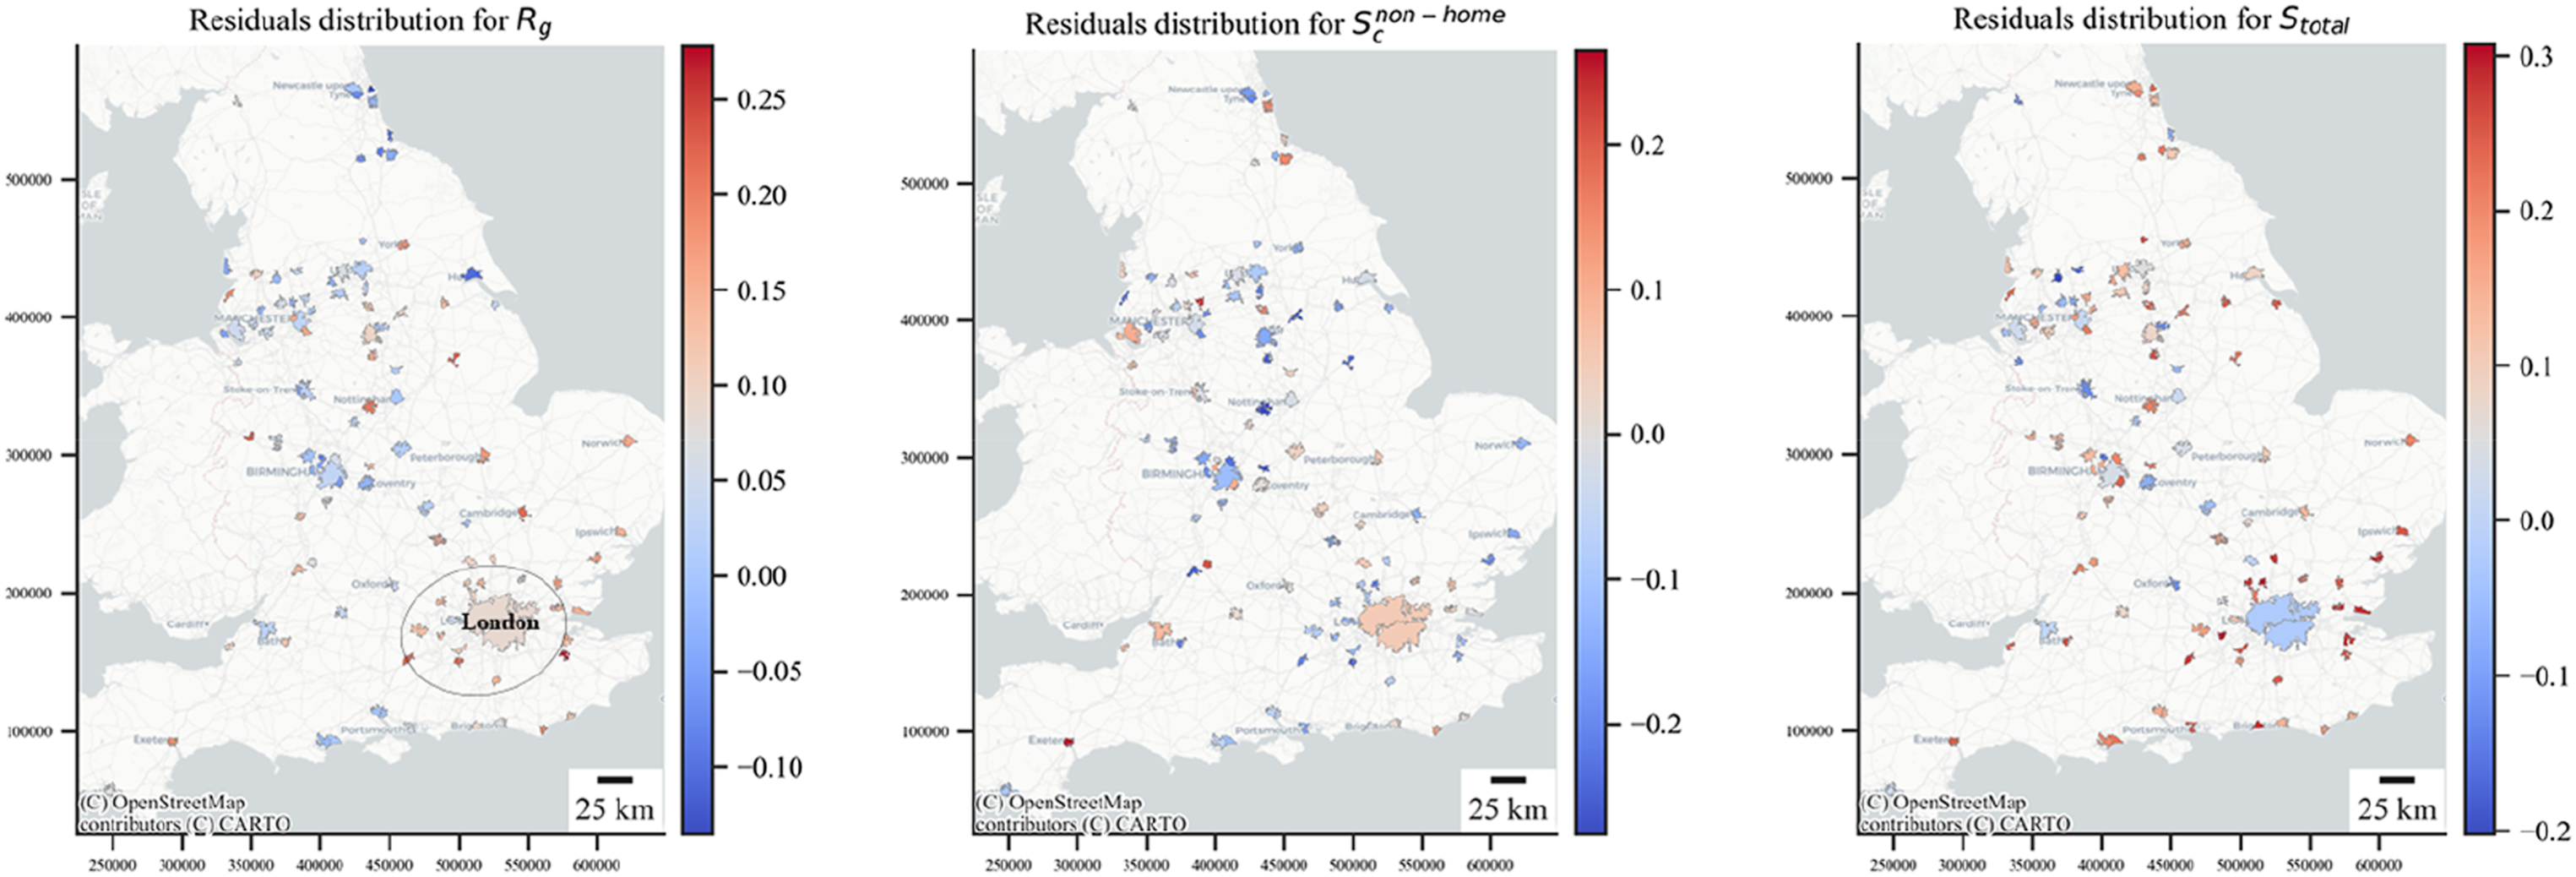
Scaling analysis: Disparities among IMD groups
Potential variations among different socioeconomic groups are crucial because the different parts of a distribution may fall into different scaling regimes (Sarkar, 2019). The group differential is extremely important to highlight social equality. To investigate this hypothesis, we take a further step and scale the mobility indicators for each group. Because of the impacts of London identified in Figure 2, we conduct the analysis for other cities.
Figure 4 shows the scaling exponents for Urban scaling for aggregation of indicators by group.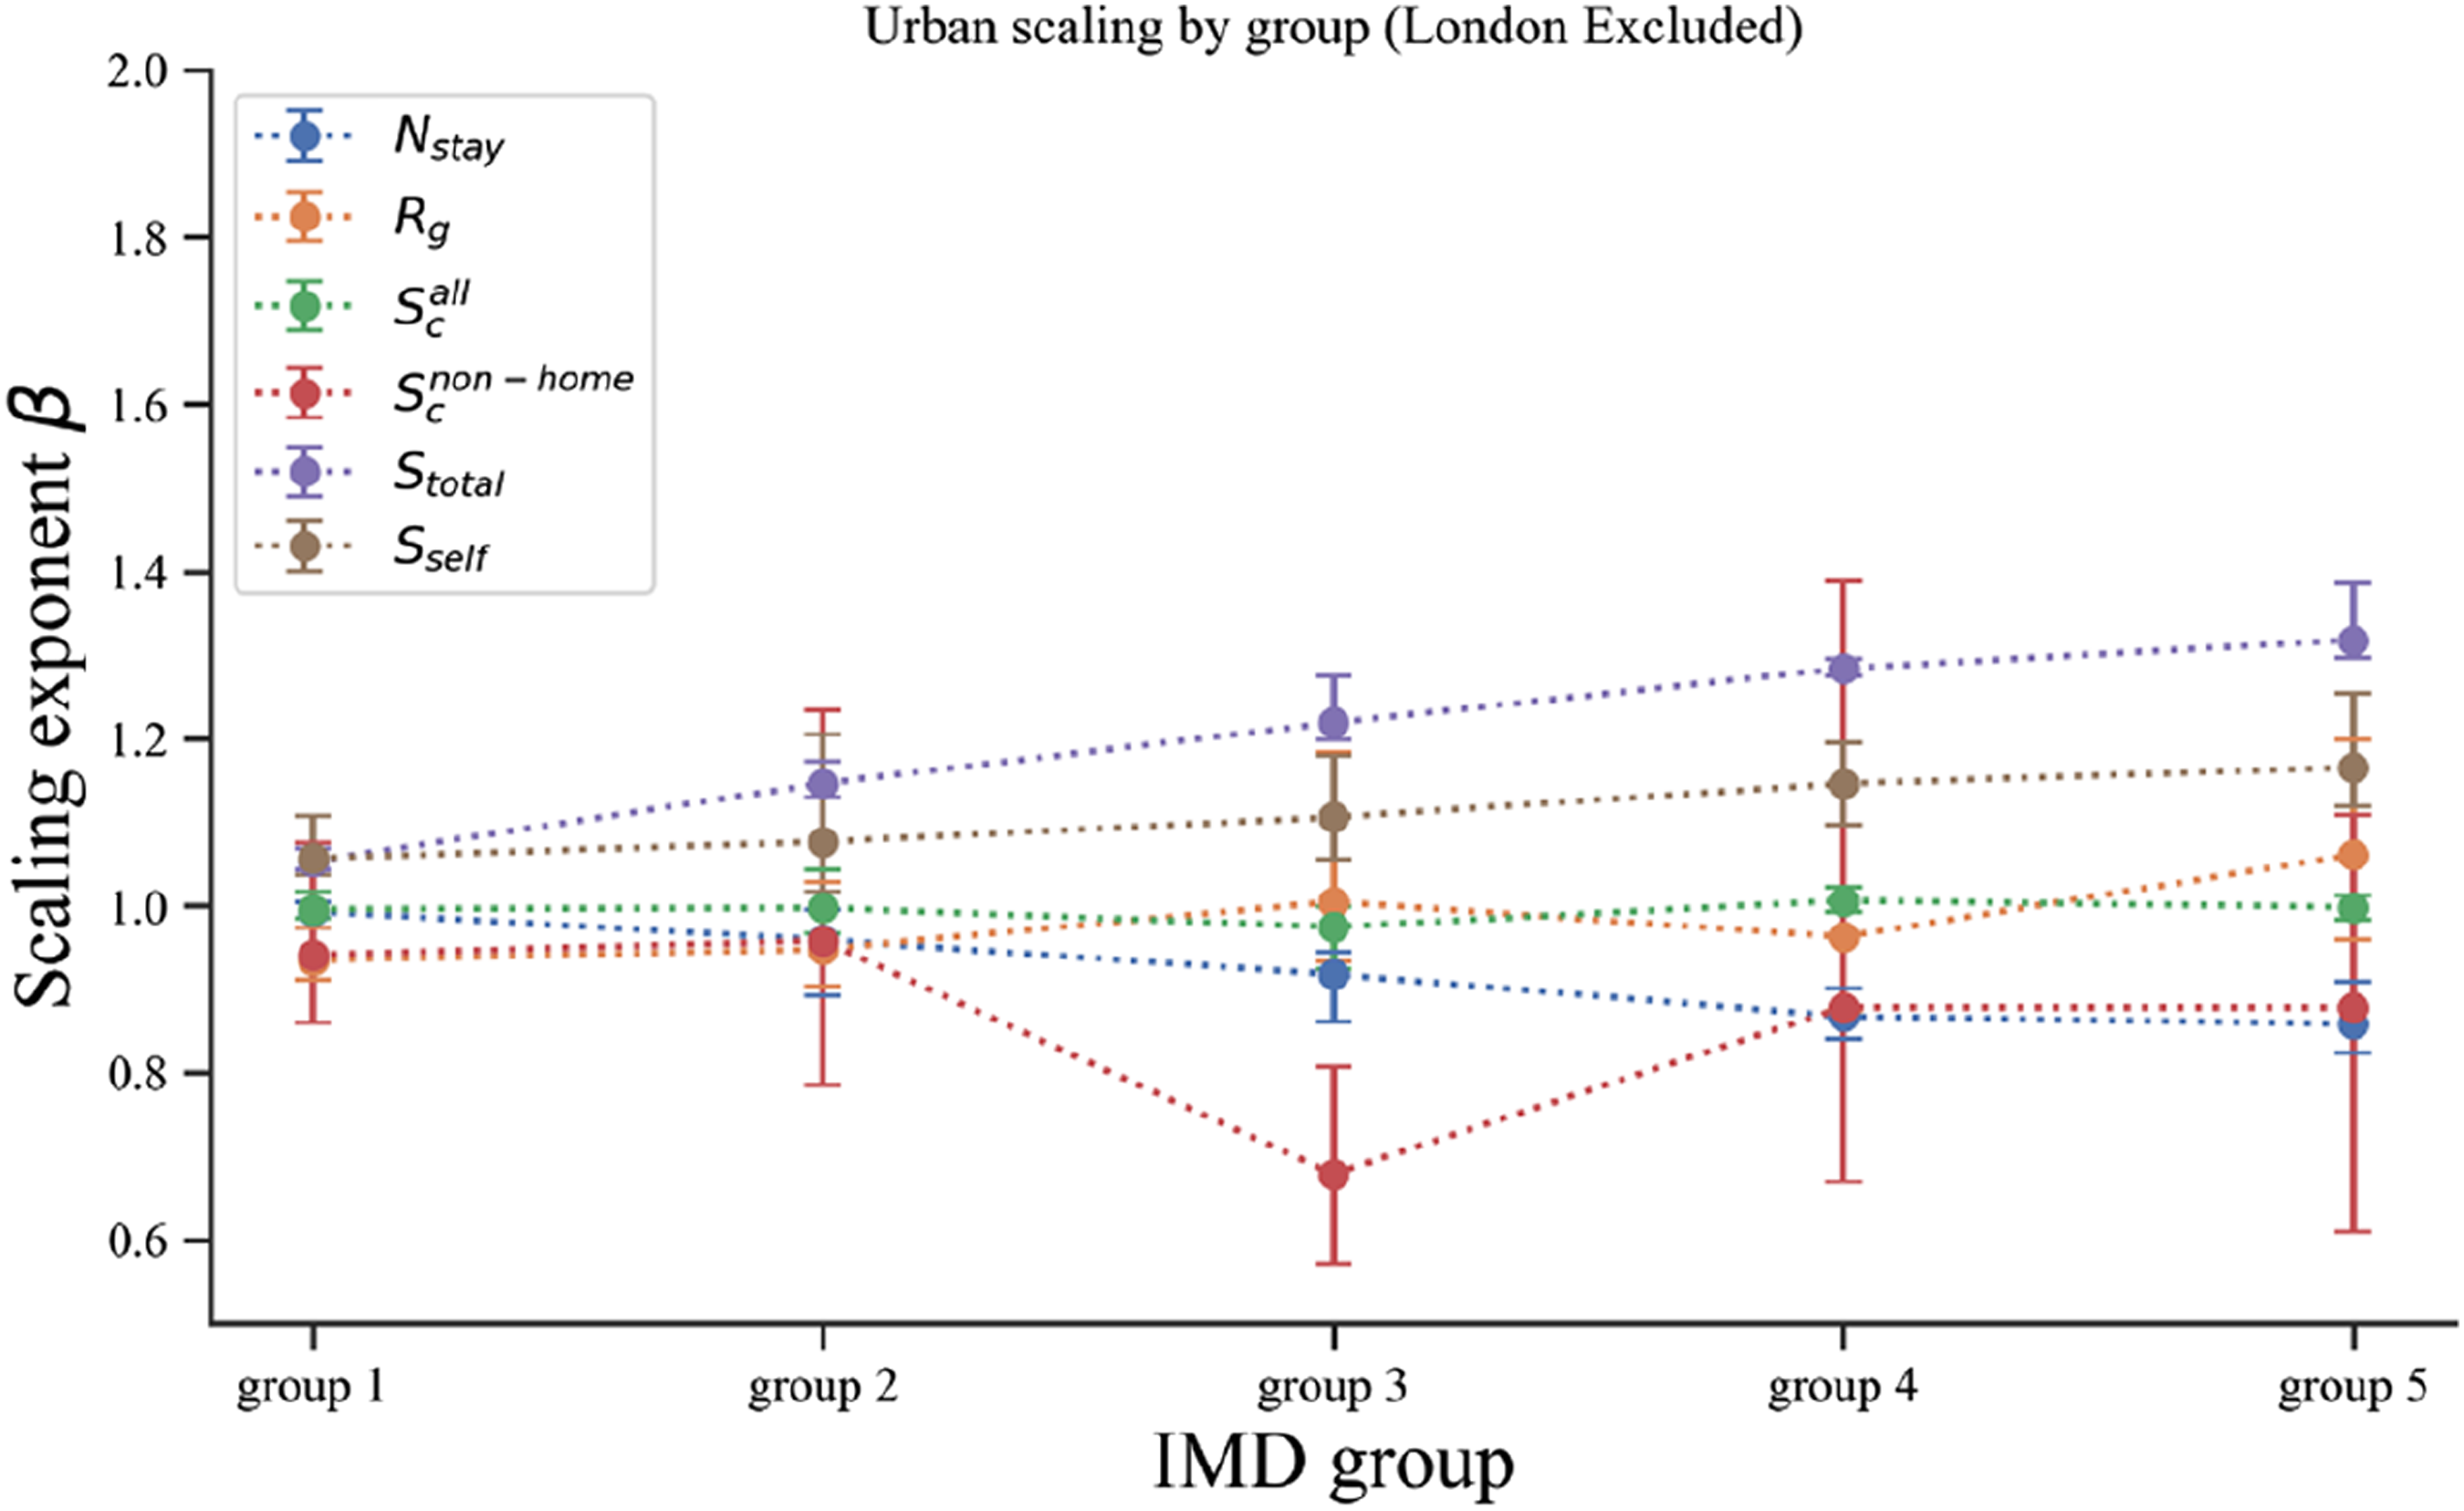
Scaling analysis: Within-city urban inequalities
The hypothesis assumes that larger cities display higher levels of within-city inequality, and thus, a power-law correlation between population size and the within-city difference is expected. However, the study finds that regression models yield either insignificant p-values and very small R2 values across all models regarding the Gini coefficient (Figure 5). The results are consistent when using different inequality measurements (Supplemental material). That suggests that larger cities do not necessarily experience more significant within-city inequality. Another study examining the scaling law of Gini of wages and segregation index found no significant association between city size and economic inequality (Cottineau et al., 2019). Urban scaling for Gini coefficient of indicators.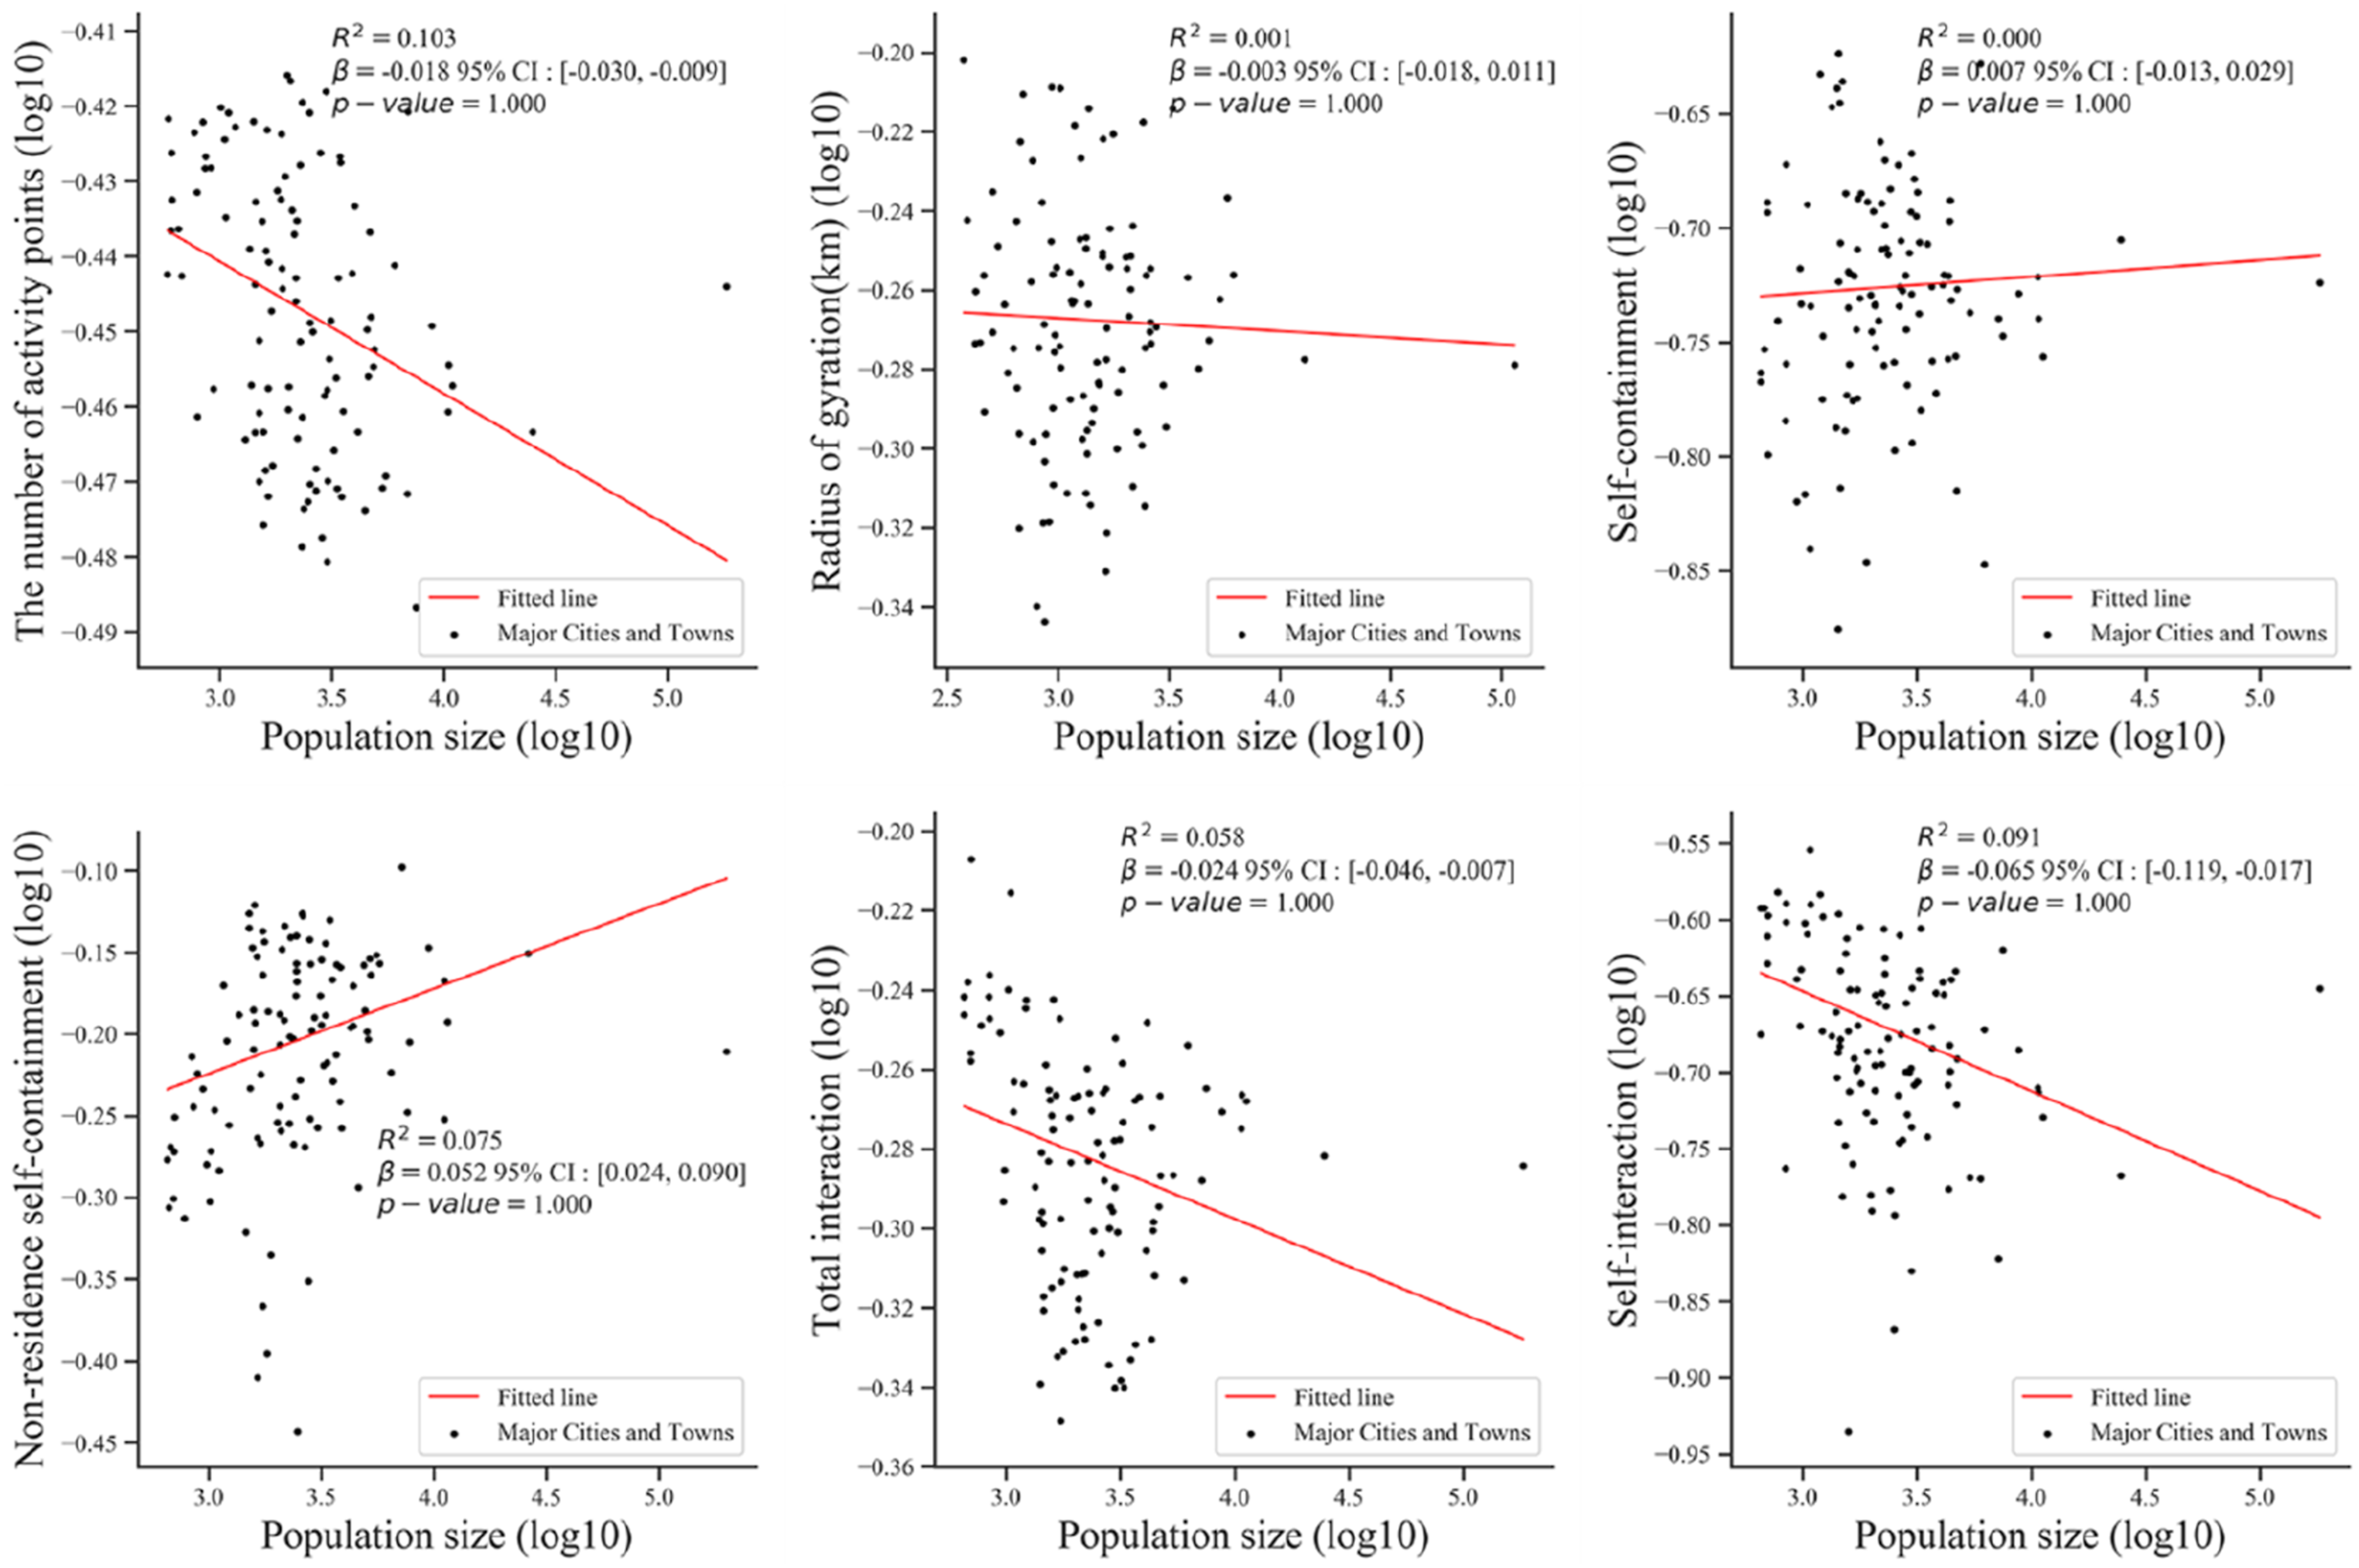
Although within-city inequalities have no significant association with population size at the England national level, there might exist some spatial clustering patterns regionally. To gain further insights into this issue, the study employed Getis and Ord’s local (G*) statistic method on the Gini coefficients (Supplemental material). Figure 6 reveals varying spatial clustering patterns for different indicators across England. Overall north-south divisions were revealed for indicators, Spatial clusters of the Gini coefficient for indicators.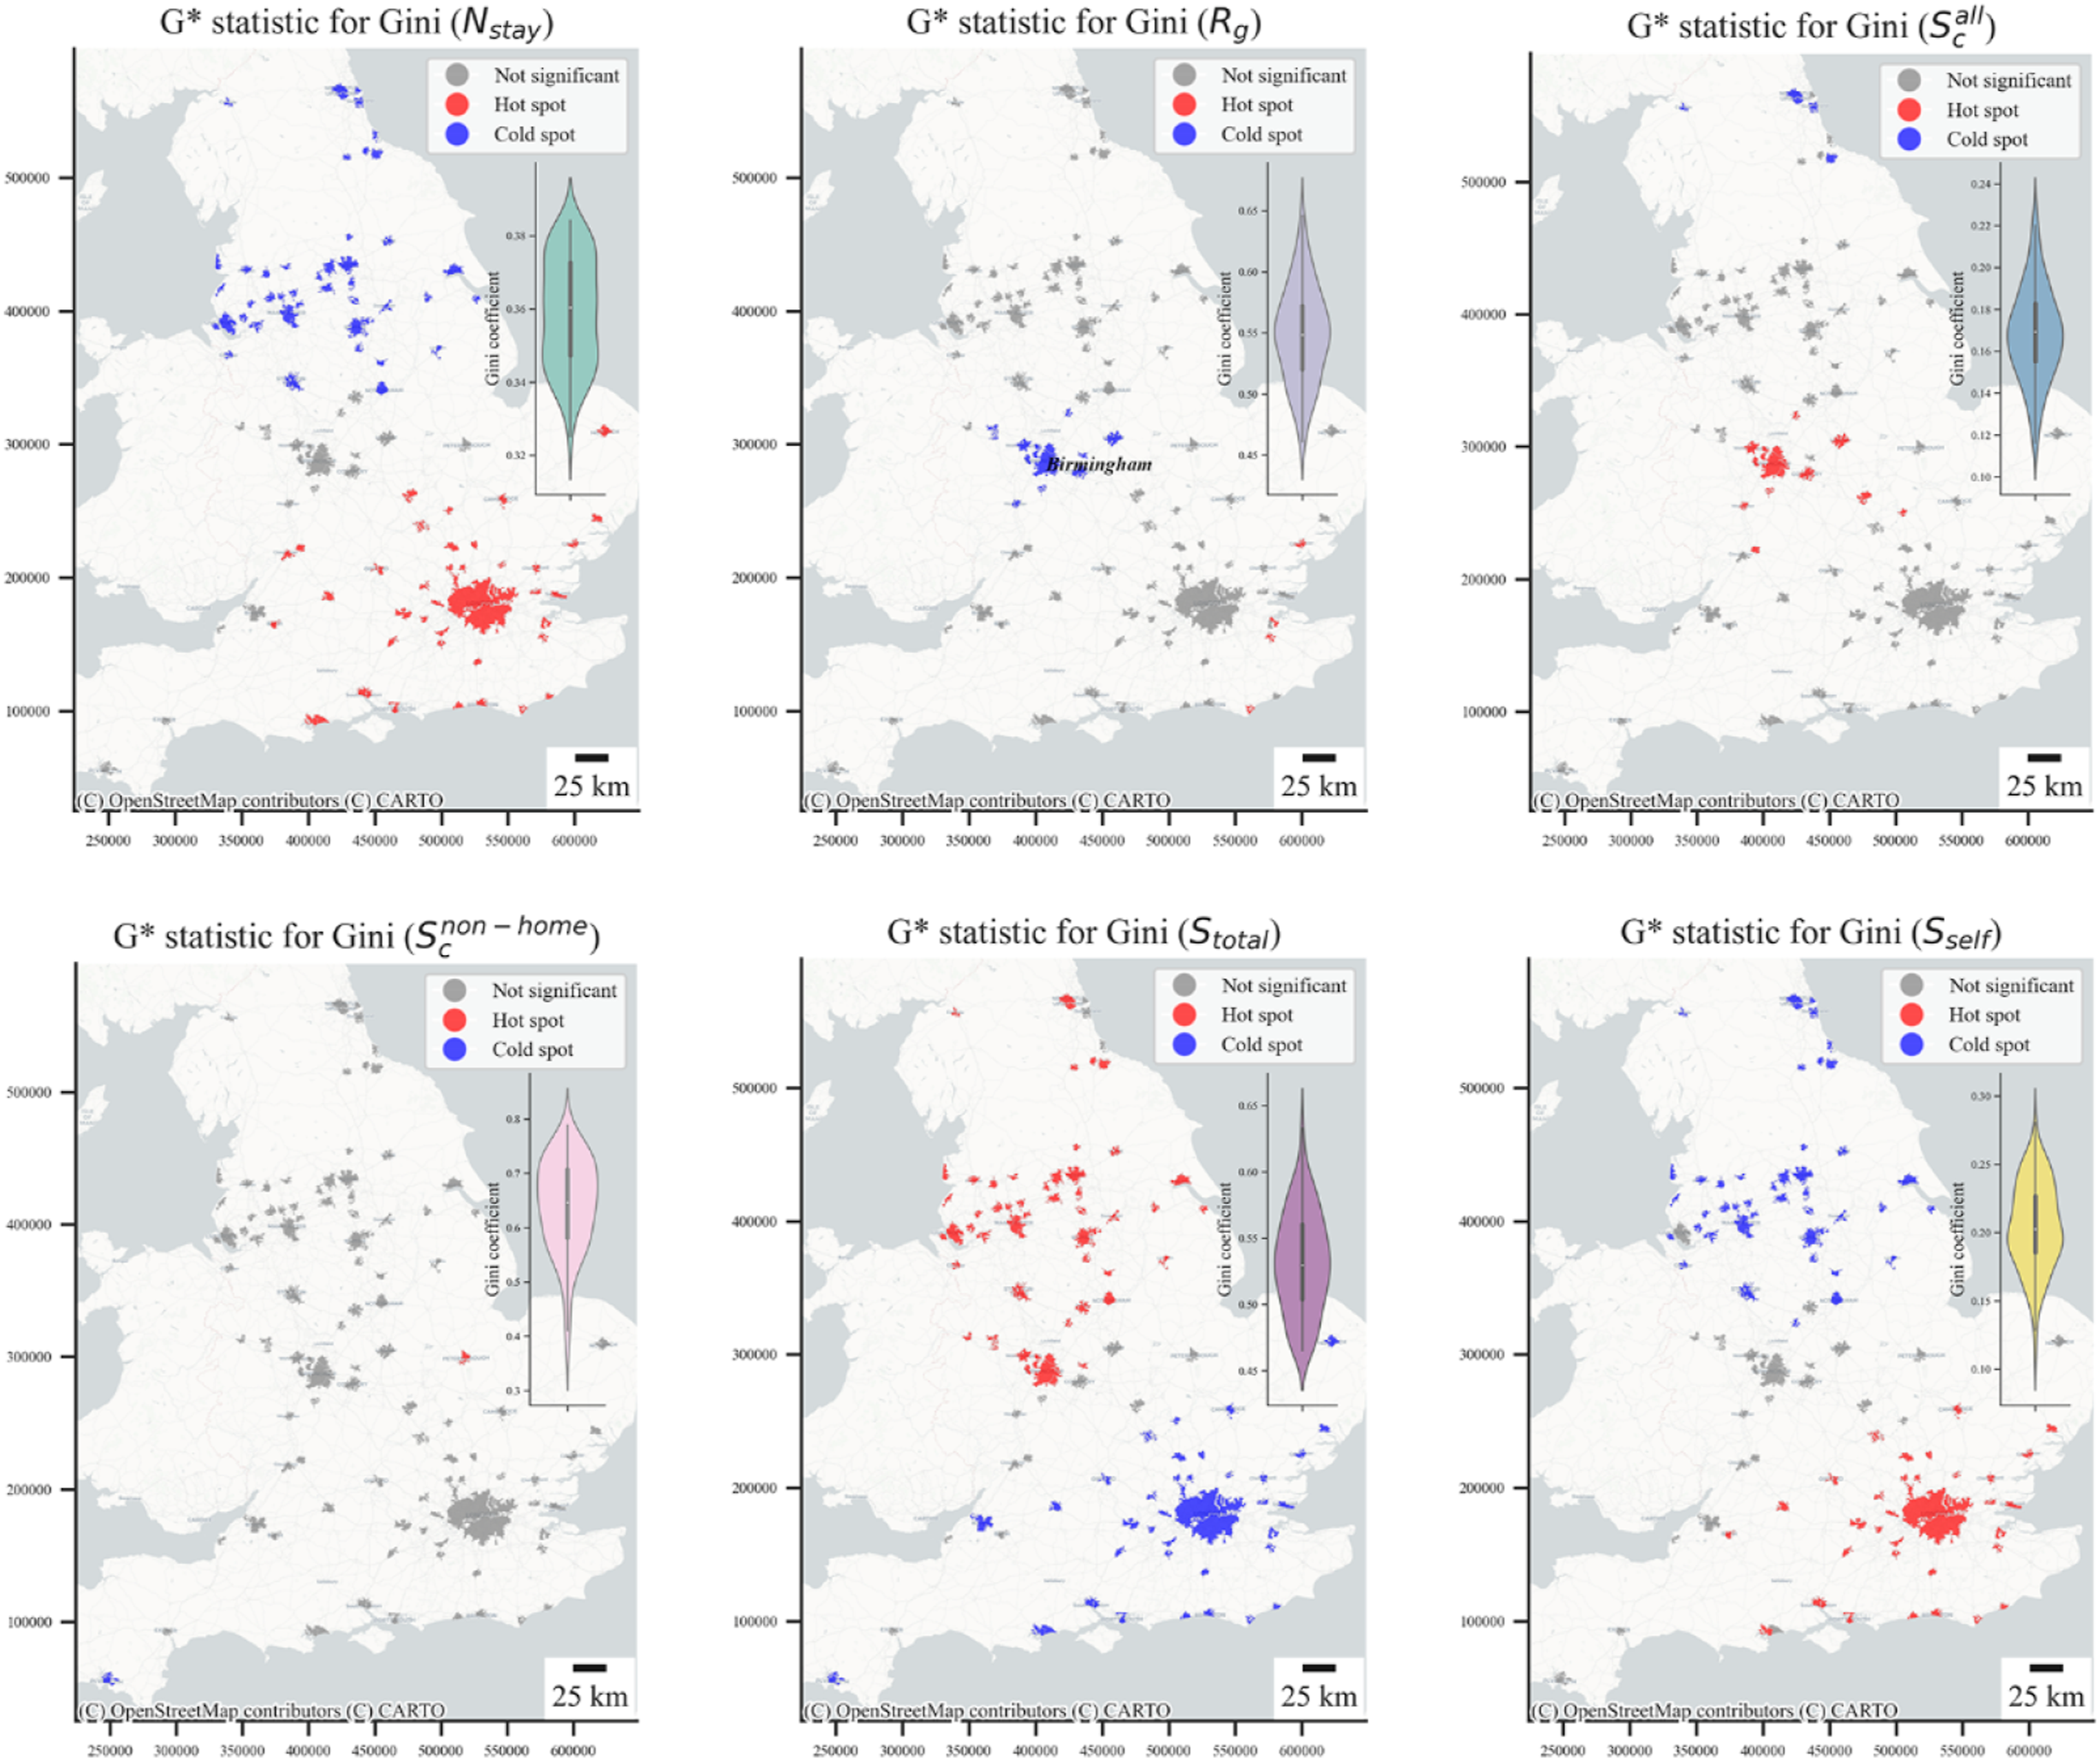
Discussion and conclusion
As cities grow bigger, striking a balance between higher productivity and greater inequality becomes a challenge. While larger cities can provide more avenues for wealth and prosperity, they can also worsen current social inequalities and create new ones (Rybski et al., 2019). Though there have been many observations indicating that larger cities are more economically unequal than their regional or national averages, the evidence is inadequate in terms of the multifaceted nature of inequality (Sarkar et al., 2016). Extensive analysis is necessary to expand our understanding of urban systems and the social process, which can help advance the understanding of urban growth and the quantitative theory of the average city. By studying the relationship between urban size and inequality, researchers can identify strategies for promoting more equitable access to urban opportunities and resources.
The study explored urban scaling laws of urban inequality from a human mobility perspective beyond conventional economic characteristics. The indicators, especially social interaction, are innovative as they are applied to dynamic activity space rather than static residential space. Our findings indicated that different measures of mobility behaviour produced diverse scaling patterns. On the one hand, the concentration of individuals in large urban areas typically increases social interaction among the residents. On the other hand, the level of self-segregation also increases with population size. In addition, our in-depth analysis of the disparity among different groups found that certain groups may be subject to advantages or disadvantages within urban environments, which can ultimately contribute to patterns of urban inequality in the long run. Urban planning has the potential to alleviate segregation. The locating of commonly used urban amenities like transportation hubs, plazas, shopping centres, and parks near diverse neighbourhoods would create opportunities for residents of various socioeconomic backgrounds to interact as they frequently share these spaces. Meanwhile, evidence shows that segregation in residential places is more significant than in other activity places, thus some particular intervention strategies like mixing housing policies could be considered to increase the chances of interactions and building social networks with one another (Gao et al., 2024; Nilforoshan et al., 2023). This study also serves as a reminder to urban planners that amidst urbanisation, special attention must be paid to preventing major cities from further evolving into machines that breed segregation.
The relationship between within-city inequalities and city size is not significant, suggesting that urban growth is more likely to increase between-city inequalities other than within-city inequalities, emphasising the significance of measuring and comprehending the multiple facets and underlying nature of social progress. By investigating the spatial distribution of the within-city inequalities, this study also found distinct spatial clustering patterns across different mobility characteristics. Particularly, a clear north-south regional variance has been observed. The identified spatial clustering patterns suggest that specific urban areas may require tailored solutions to address the underlying causes of inequality. For instance, while promoting activity opportunities and affordable housing may be effective in reducing inequalities related to activity intensity and self-interaction in some southern urban areas, it may not be sufficient to address the underlying factors driving inequality in northern urban areas characterised by high levels of total interaction. Thus, a more nuanced understanding of spatial clustering and the mobility indicators driving them is critical for designing more effective policies aimed at promoting inclusive urban development.
Research on urban scaling relations can offer valuable insights into the complex social organisation and dynamics that underlie the urban growth and development (Bettencourt et al., 2013). In addition to measuring population size, future studies may use alternative metrics to capture the complexity of urban environments and social dynamics. For example, researchers may consider using the number of jobs, housing units, or urban amenities as proxies for urban size. By developing more nuanced and accurate measures of urban growth and development, researchers can better understand the challenges and opportunities associated with urbanisation and work towards creating more sustainable and equitable cities.
Supplemental Material
Supplemental Material - Unpacking urban scaling and socio-spatial inequalities in mobility: Evidence from England
Supplemental Material for Unpacking urban scaling and socio-spatial inequalities in mobility: Evidence from England by Qi-Li Gao, Chen Zhong and Yikang Wang in Environment and Planning B: Urban Analytics and City Science.
Footnotes
Declaration of conflicting interests
The author(s) declared no potential conflicts of interest with respect to the research, authorship, and/or publication of this article.
Funding
The author(s) disclosed receipt of the following financial support for the research, authorship, and/or publication of this article: This research was supported by the National Natural Science Foundation of China (Grant No. 42001390) and the European Research Council (ERC) under the European Union’s Horizon 2020 research and innovation program (Grant Agreement No. 949670) and from ESRC under JPI Urban Europe/NSFC (Grant No. ES/T000287/1) and Shenzhen Key Research Base for Humanities and Social Sciences.
Data availability statement
The authors don’t have the authority to share the data with the public.
Supplemental Material
Supplemental material for this article is available online.
References
Supplementary Material
Please find the following supplemental material available below.
For Open Access articles published under a Creative Commons License, all supplemental material carries the same license as the article it is associated with.
For non-Open Access articles published, all supplemental material carries a non-exclusive license, and permission requests for re-use of supplemental material or any part of supplemental material shall be sent directly to the copyright owner as specified in the copyright notice associated with the article.