
Abstract
Road space distribution has traditionally been based on the hierarchical classification of streets. In arterials, the majority of space is dedicated to traffic lanes, whereas local streets typically have fewer traffic lanes and more space for parking or sidewalks. Within urban areas, road space is contested between two main types of spaces: corridors of movement, and places for access and standing/stillness/staying. Given the limited availability of urban space, particularly in central areas, deciding how to allocate space for these functions poses a dilemma and requires tradeoffs. Nonetheless, certain areas experience underutilization and inefficiencies in space utilization over time. In this context, we propose a site selection methodology to identify complex zones within a city where different types of users and demands compete for space. These zones present the potential for dynamically allocating road space based on fluctuating demands and policy objectives. This methodology serves as an initial guide for planners to identify zones that require a thorough evaluation of activities and diverse temporal-spatial demands when reallocating road space. We use network centrality, land use indicators, traffic, and public transport dynamics indicators to detect complex zones and apply them to a Lisbon case study.
Introduction
Traditionally, the allocation of road space to its different functions is based on the road network hierarchal classification. While in arterials, most space is attributed to traffic lanes, in local streets, there are usually fewer traffic lanes and more space for parking or sidewalks (Seco et al., 2008). Essentially, road space is distributed into two main types of spaces: i) corridors of movement and ii) places for access and standing/stillness/staying (Nello-Deakin, 2019; Von Schönfeld and Bertolini, 2017). On the one hand, corridors of movement fulfill the mobility/link function and are customarily evaluated by measuring Levels of Services (Handy, 2020; Jones, 2016; Valença et al., 2021). On the other hand, access places have been implemented through parking spaces in car-oriented planning cities (Seco et al., 2008). Nonetheless, the “place” status of the street has gained importance in recent years, acknowledging the place's importance for staying, loading/unloading, playing, socializing, or loitering (Jones, 2016).
According to Jones (2016), the limited street width is one of the main challenges in allocating space for competing demands and functions. Recent road allocation strategies do not tackle the complexity of road space distribution and are often biased towards prioritizing one main function (mobility or access). Strategies such as complete streets and road diets are claimed to promote space for all modes. However, they often fail to consider the place function of the street (Mehta, 2015). Instead, these strategies focus on putting many transport modes to dispute for space in a mobility perspective, ignoring other public space functions and that the space could be shared (Nello-Deakin, 2019; Zavestoski and Agyeman, 2015). Differently, experimentation and pop-up initiatives reallocate the space to promote public spaces, mainly in local areas (Gehl, 2013), where there is less complexity and competing demands and activities.
Nonetheless, in streets that have a limited amount of space, there is a political and practical dilemma of allocating road space when high mobility/link and access/place functions need to be fulfilled and there are high traffic and public transport levels (Gössling et al., 2016; Jones, 2016; National Association of City Transportation Officials, 2016; Valença et al., 2021). Also, the complexity increases when the street is located in a zone with high connectivity to other locations in the city, being a key destination for trips (De Gruyter et al., 2022). Thus, complex spaces have more actors (dense places) and different activities (diverse land uses) competing for the space (Jones, 2016; Valença et al., 2021).
There is still a gap in the literature to select areas in cities where it is more complex to reallocate space. The site selection of complex zones can guide planners, at an initial stage, to understand which zones require a deeper evaluation to implement the right solution. This is particularly relevant in zones where mobility/link and access/place objectives conflict with one another and where cities aim to prioritize more sustainable forms of transport or place activities such as outdoor dining and parklets (De Gruyter et al., 2022). In this context, this paper aims to propose a methodology for selecting complex zones that potentially have streets that face a dilemma of allocating road space for both mobility/link and access/place functions.
Additionally, complex zones may require innovative ways of reallocating road space that consider the many modal and activity demands over different times of the day, week, or season. For example, traffic lanes can be saturated during peak hours but often are underutilized in off-peak hours, which could be used for another purpose. There is a certain inefficiency in the use of space in static urban designs due to their limitation of not adapting according to urban dynamics in short periods (Valença et al., 2021).
In this context, Valença et al. (2021) propose the concept of dynamic road space allocation to reallocate space dynamically over time in complex streets with many diverse needs during the day, and that may not be possible to accommodate them all using static designs. Although Valença et al. (2021) suggest a methodology for site selection, it does not go into detail nor apply it to a case study. This paper fulfills this gap by proposing a method for identifying the complex zones for distributing road space that are candidates for dynamically allocating road space. We apply the proposed method for the case study of Lisbon, Portugal. First, we discuss dynamic applications in road reallocation strategies and the concept of dynamic road space allocation. Then, the methodology of the site selection of complex zones is presented, together with the conceptual assumptions for selecting candidate zones for dynamic road space allocation. Sequentially, we present the data sources. Then, the results and discussion are shown. We finish with a conclusion and references.
From dynamic lane allocation to dynamic road space allocation
Dynamic Lane Allocation (DLA) proposes to dynamically allocate traffic lanes to different transport modes over periods of the day (e.g., peak and non-peak hours). The main goal is to reduce delays and use the space more efficiently to prioritize a transport mode or allocate underutilized lanes to other modes. DLA has been researched for transit priority by maintaining a dedicated bus lane during peak hours and mixing with traffic when traffic and bus demands are low (Wang et al., 2016; Zhang et al., 2018; Zheng and Geroliminis, 2013). Other authors have studied how to dynamically open the hard shoulder for traffic during peak hours to optimize traffic flows (Mehran and Nakamura, 2009). The concept of DLA has also been applied as dynamic reversible lanes according to different directional demands over time (Hausknecht et al., 2011; Zhao et al., 2015); and studied in the case of using autonomous vehicles in expressways (Chen et al., 2022; Duell et al., 2016). Overall, DLA has mainly been studied in expressways and arterials. Not much has been done considering urban environments, signalized intersections, and other road hierarchy classifications that have high mobility/link and access/place functions in dispute (Alhajyaseen et al., 2017). Most studies focus on automobile and bus optimization strategies with some rescue and autonomous vehicle applications.
Summing up, DLA only considers the traffic lanes as part of the urban space, lacking consideration of curbs, sidewalks, land use, and interaction with active transportation. Thereby, active modes, urban activities, land use patterns, and the access and place function of the street should be considered when proposing a dynamic allocation of space in urban and complex environments. The concept of dynamic road space allocation aims to include the gaps identified in the literature on dynamic lane allocation to allocate space dynamically in urban and complex environments (Valença et al., 2021).
The dynamic road space allocation, from façade to façade, aims to balance the access and place function (i.e., parking, parklets, and restaurants) with the mobility/link function (e.g., network multimodal flows) of the urban space over time (Valença et al., 2021). Dynamic road space allocation is context-oriented and more applicable in complex zones, where there is a dilemma and limited space to reallocate space. As complex zones have diverse actors and activities competing for space, dynamic road space allocation has the potential to accommodate different uses in a cross-section over time, when a specific space is underutilized or to prioritize a particular mode or activity. While DLA maintains the mobility function by allocating the space to different modes over time, dynamic road space allocation can promote both mobility and access functions and adapt the space to mix both functions. Technologies such as variable message signs, in-pavement lighting, and flexible bollards may indicate these transitions. The following section explains the methodology for selecting complex zones that have the potential to implement dynamic road space allocation.
Methodological framework
Figure 1 presents the methodological framework for choosing complex zones to reallocate road space, including the data collection, conceptual assumptions, indicators, and results of the indicators that match the criteria. This process ultimately culminates with the identification and selection of areas categorized as complex and very complex for reallocating road space. The methodology uses a zoning grid to compare different data sources and indicators, as explained in more detail in Section S1 of the Supplementary Materials. Methodological framework for selecting complex zones to reallocate road space that has the potential for implementing dynamic road space allocation. Source: Author.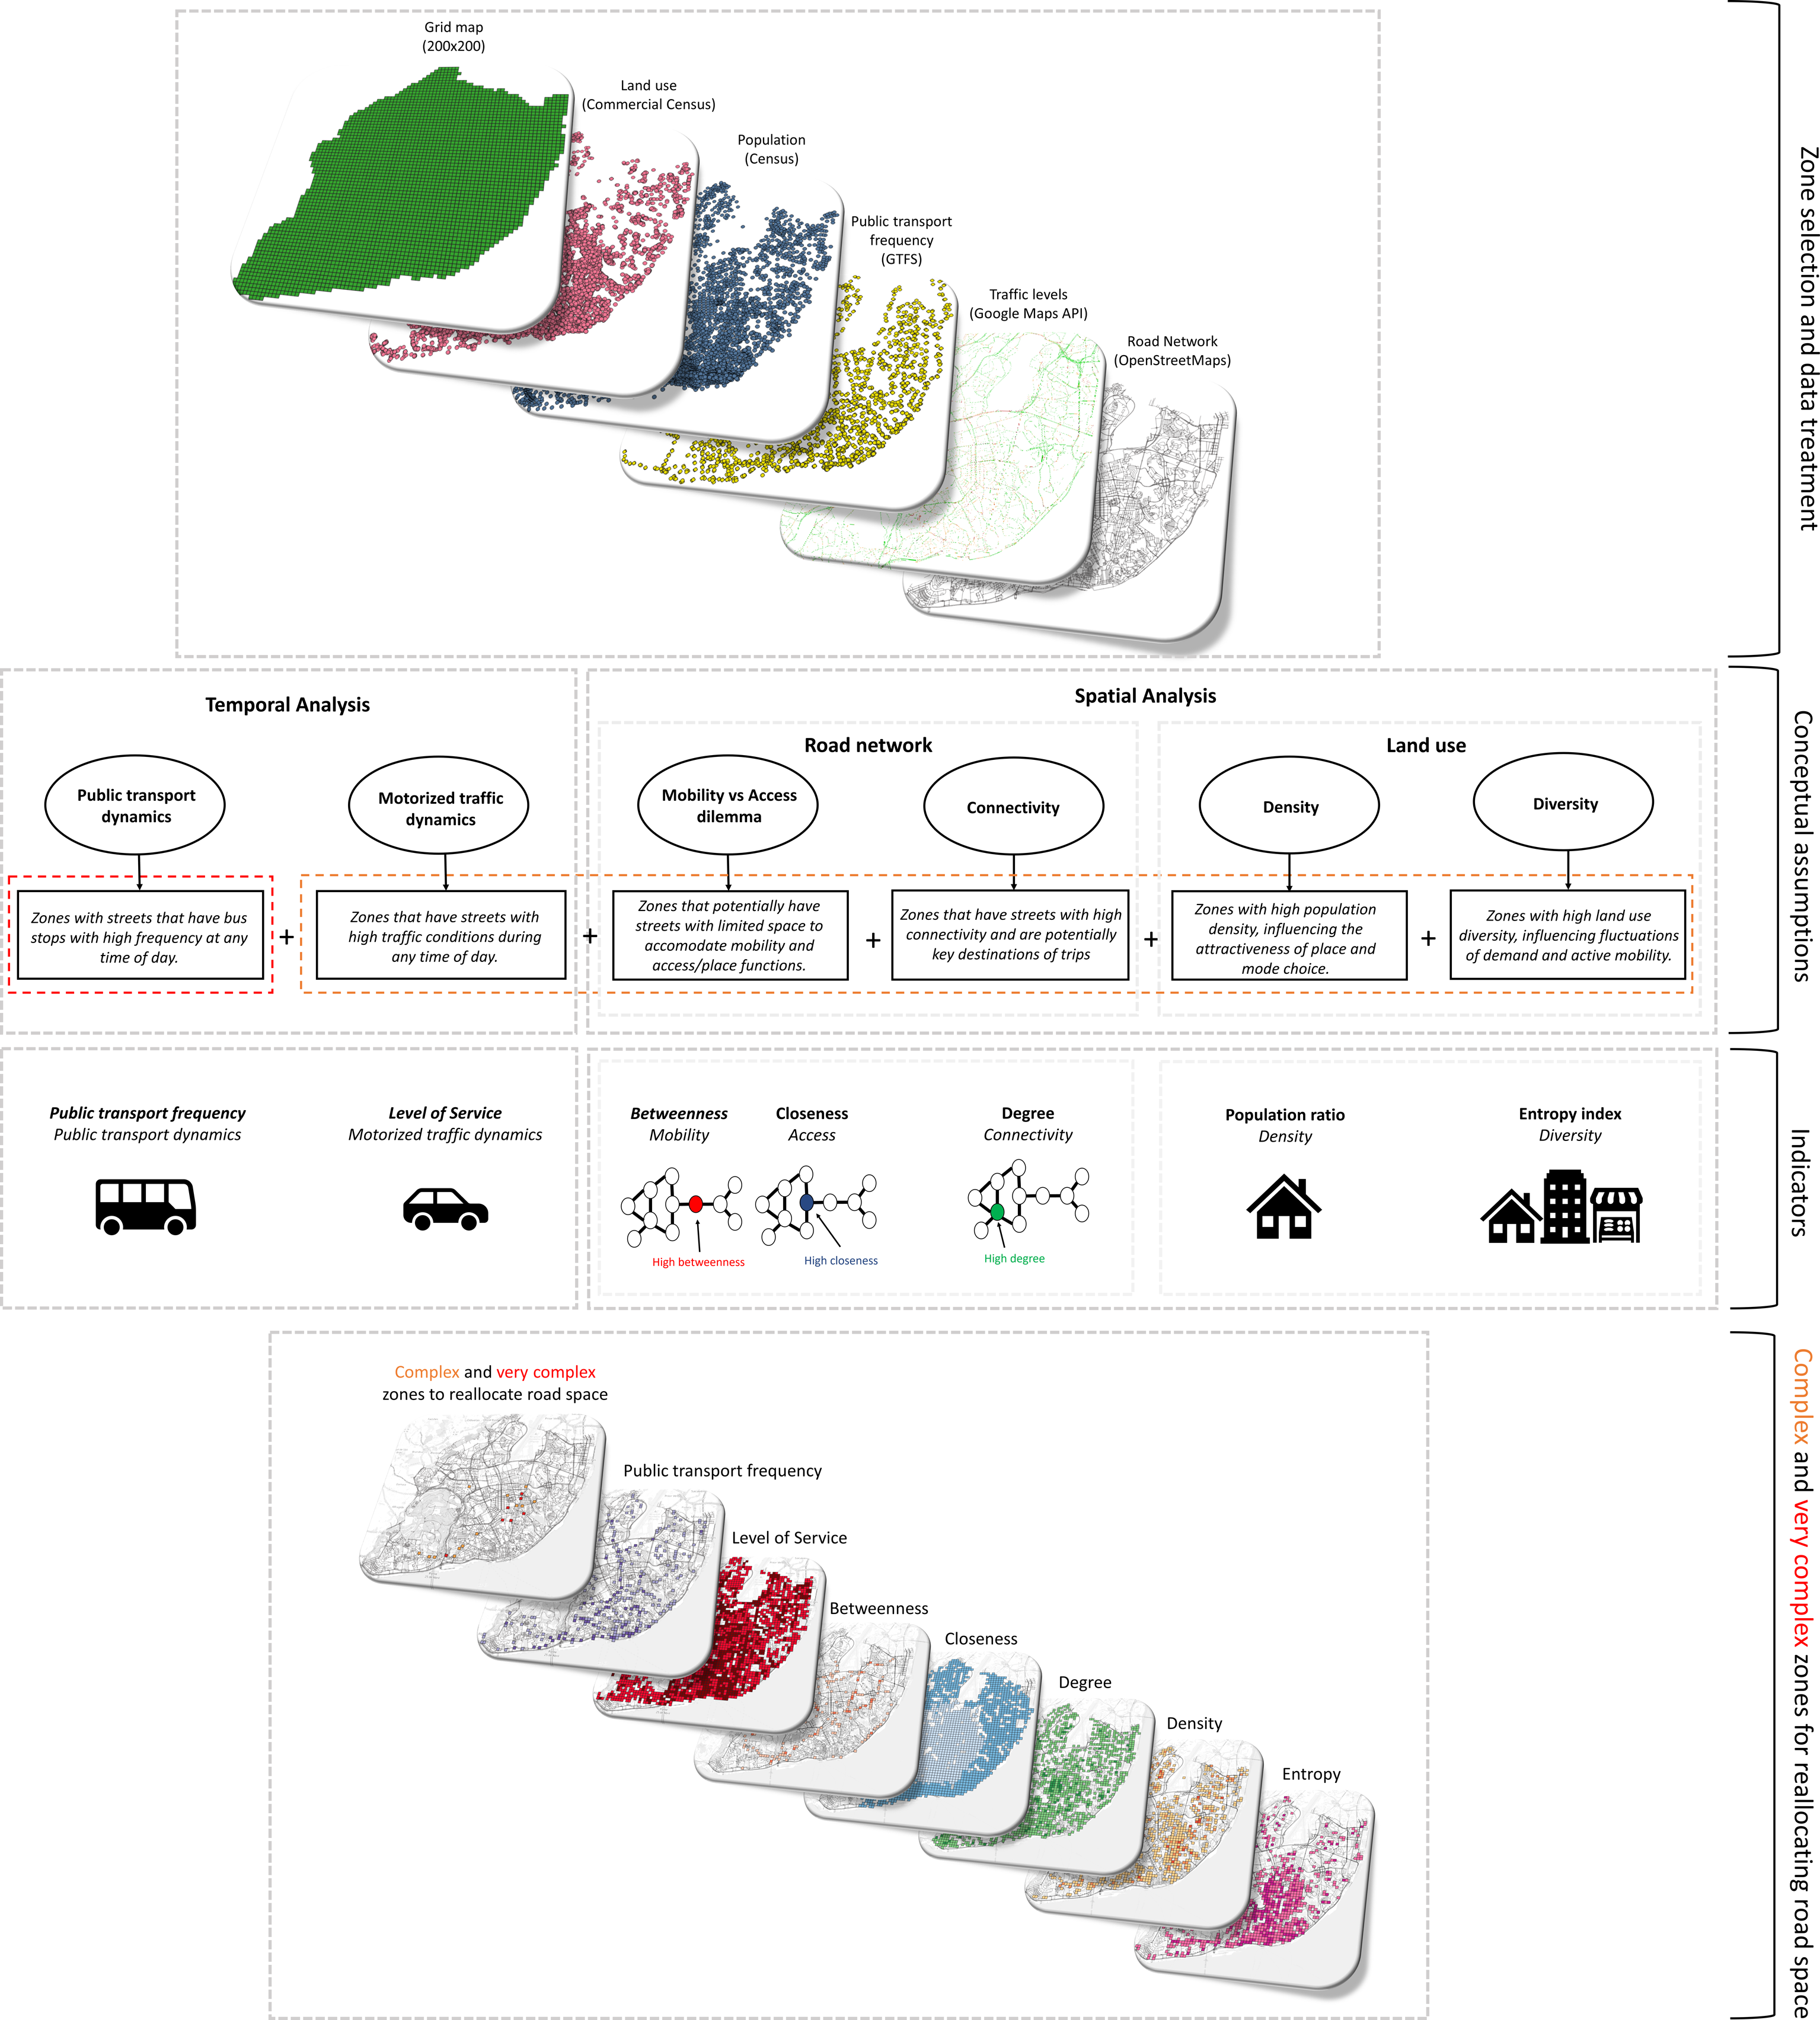
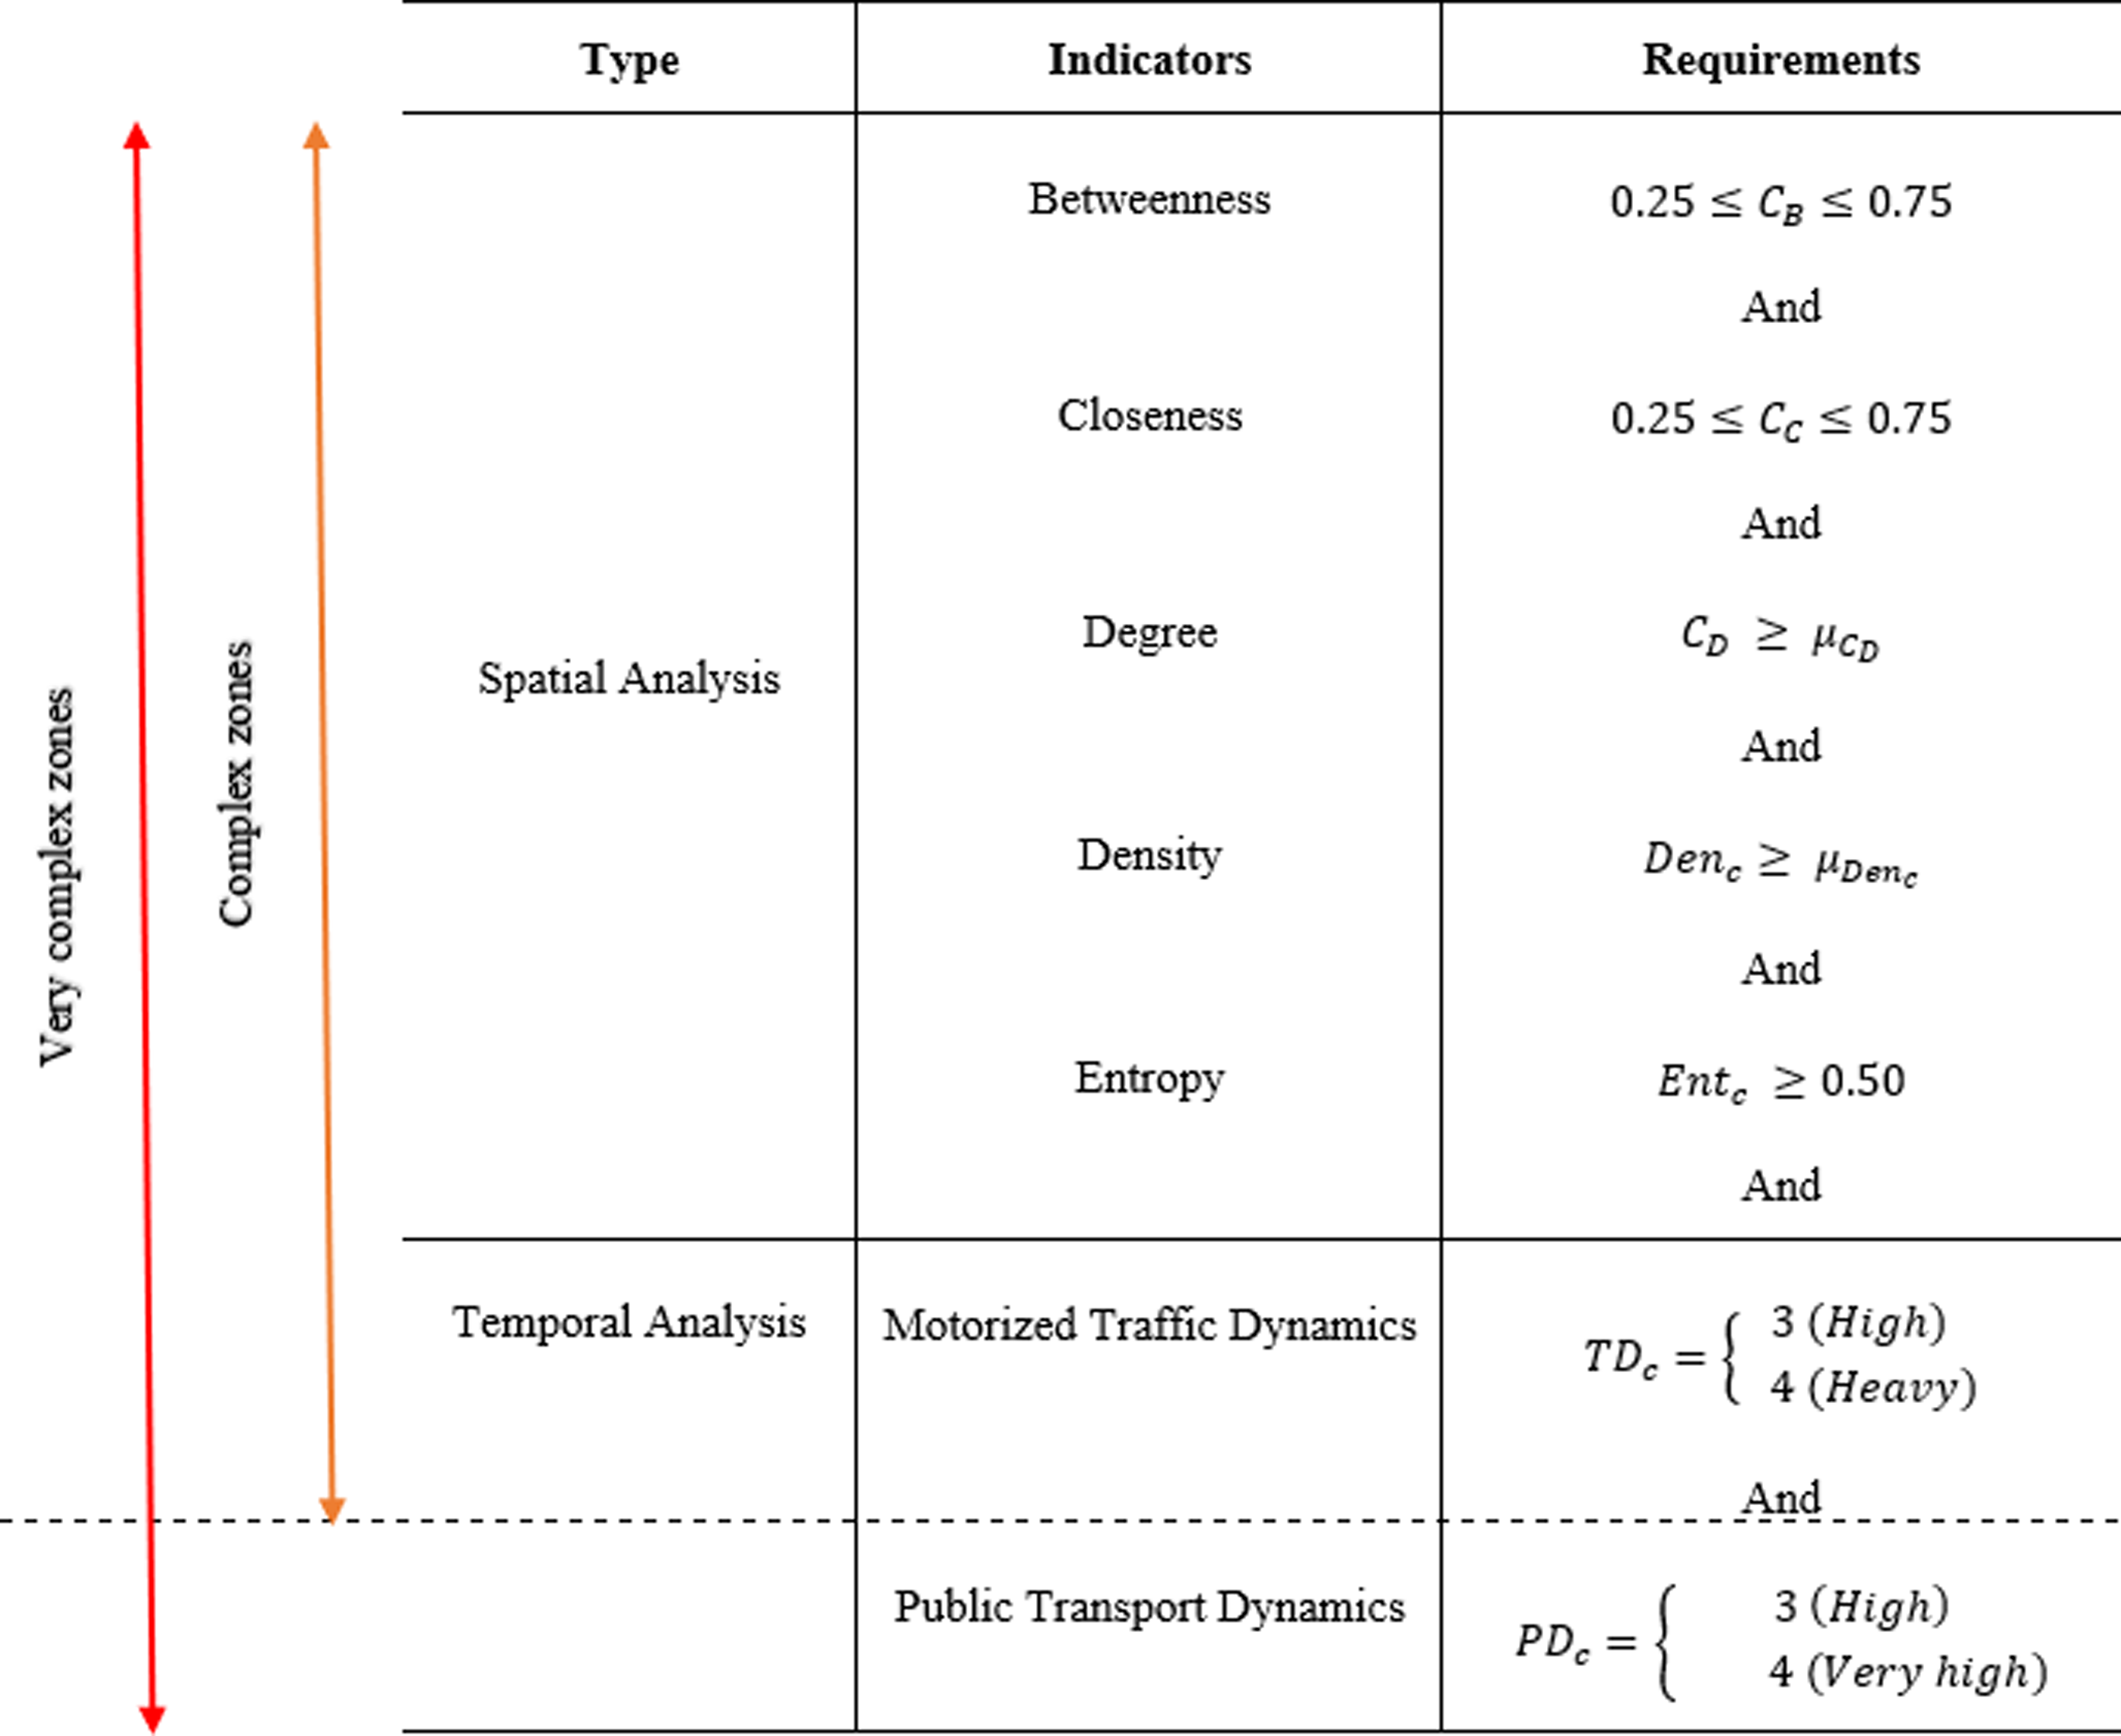
The zone selection on a macro scale (e.g., municipality or metropolitan scales) considers two main analyses: spatial and temporal. For the spatial analysis, the morphology of the road network and prevailing land use in the zones are considered. The selected zones must verify all requirements: i) dispute between mobility/link versus access/place functions of the road network; ii) high connectivity; iii) high land use densities; and iv) high land use diversity. The temporal analysis considers motorized traffic and public transport dynamics. If certain zones experience high traffic or/and public transport demand at any given time of day, then reallocating road space becomes more complex since road capacity is not consistently underutilized (vacant).
The conceptual assumptions marked in orange in Figure 1 are the requirements for having complex zones. Very complex zones are the ones that go in line with the conceptual assumption marked in both orange and red (Figure 1). The criteria and indicators are explained in more detail in the next section. It is important to emphasize that this paper does not evaluate which road segments are more suitable for dynamic road space allocation. Instead, from a global perspective, we consider which zones may have the most complex road segments to reallocate space.
Conceptual assumptions: criteria and indicators
Spatial analysis
Road network: Road space allocation dilemma
While the arterials in an urban environment prioritize mobility (or movement), local streets focus on access to activities and residences. However, when dealing with a zone in the graph near the overlapping area, as illustrated by the hatched pattern in Figure 2(a), policymakers may not perceive if they should prioritize access/place over mobility functions or vice-versa. According to Seco et al. (2008), the main distributors are the main challenge in determining which function to prioritize, as illustrated in Figure 2(b). Specifically, main distributors often struggle with limited urban space, which is a problem to fully and adequately design for mobility and access. Additionally, many of these roads were previously designed to increase automobile capacity. The amount of space that should be reallocated for sustainable modes and the consequences on traffic jams are still unclear in many cities that seek to transfer traffic lanes to other urban functions. Road hierarchy classification and road space allocation dilemma (hatched and colored parts of the graph are the functions’ overlapping zones). Source: Author.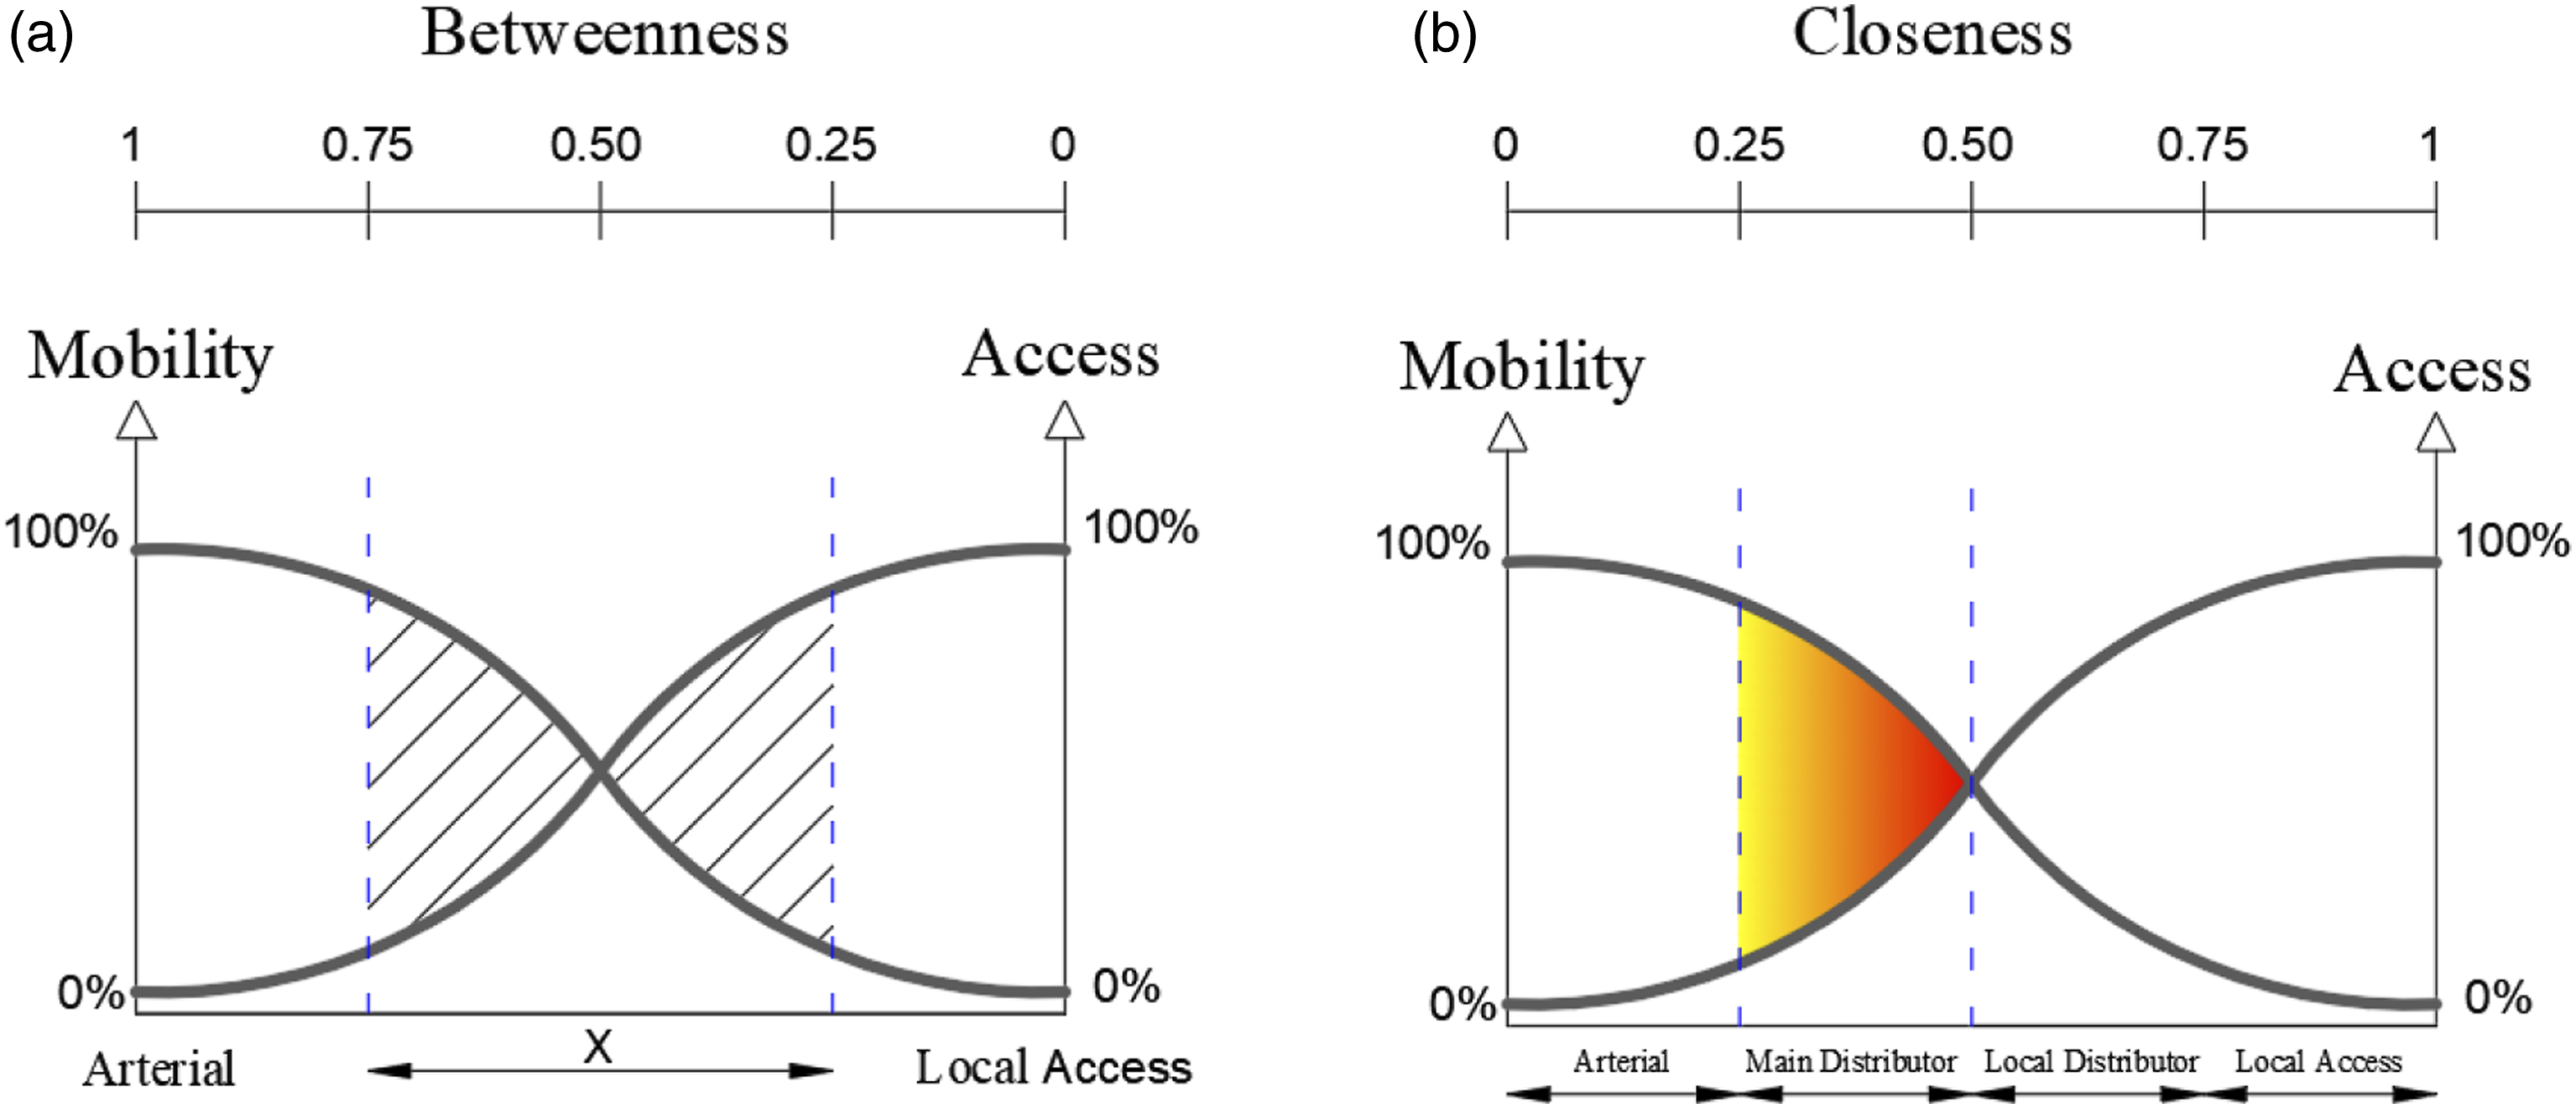
Notably, urban space is a dynamic entity, and thereby it may have different spatial and temporal needs during peak and non-peak hours, weekdays, weekends, and seasons. We highlight in Figure 2(a), the overlapping zone where, conceptually, the several types of road network hierarchies can serve one function or the other (i.e., mobility versus access/place), depending on transport demand and activity requirements over time.
We used centrality measures to evaluate the road space allocation dilemma in the disputed area illustrated in Figure 2(a) (main and local distributors). Centrality measures can represent the urban street network based on its urban morphology (Demsar et al., 2008). The network configuration is measured through topological distances while considering every node in the network with equal importance and opportunity access (Hillier and Iida, 2005; Wang et al., 2011). Centrality measures have proven to be an effective method to characterize the urban form and its influence on mobility patterns from a global perspective (Berghauser Pont et al., 2019; Penn et al., 1998). Therefore, we evaluate the road network effects in each 200 × 200 m grid cell using the centrality indicators explained below. We calculated the average values within each grid cell for each centrality indicator.
Conceptually, betweenness centrality is a measure of network flow, and thereby, it is suitable to evaluate the mobility function of the network (Wasserman and Faust, 1994). Betweenness centrality measures the number of shortest paths that pass through a node. The higher the value of the betweenness of a link and a node in a road network, the more likely it corresponds to a higher hierarchy level of road classification and a network hub, respectively (Barthelemy, 2017). Suppose the betweenness values are classified into four categories from minimum to maximum (0 to 1). In that case, the conceptual dilemma's undefinition area will be in the second (main distributors) and third classification (local distributors), as illustrated in Figure 2(a). Betweenness centrality is defined as (Freeman, 1979):

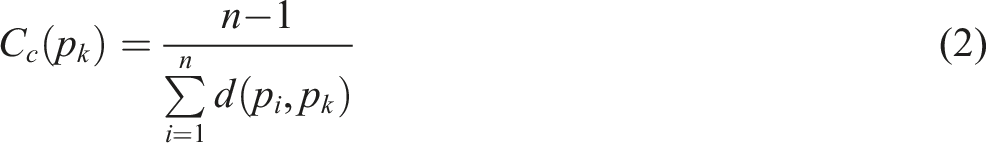
The closeness centrality is a measure of proximity since it measures how close a point is to other network points. More local streets usually have denser nodes than higher hierarchal road classifications (Ozbil et al., 2011). High closeness values indicate minimum distances to the shortest paths in the network. The third level (main distributors) and second level (local distributors) of closeness values are more likely to correspond to the road space allocation dilemma's undefinition area, as demonstrated in Figure 2(b). Freeman (1979) defines closeness as (Equation (2)):
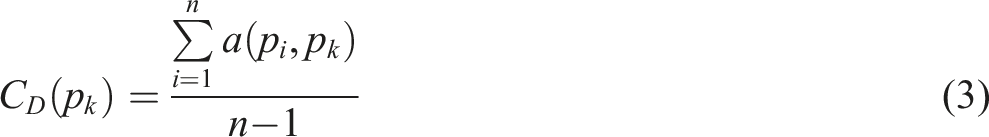
After detecting the road network’s undefinition area, we use the degree centrality to measure network connectivity, which is an important step to verify how streets are connected and are more likely to fulfill their primary linking function. Additionally, streets with high connectivity tend to be important trip destinations (De Gruyter et al., 2022). The degree centrality is defined by Freeman (1979) and demonstrated in equation (3): higher values of degree, levels 3 and 4, are desired on a 4-level scale.
Land use: Density and diversity
Land use density and diversity significantly affect travel patterns and behavior. While urban densities greatly influence mode choice in daily commuting, mixed land use mainly influences how the trips are distributed throughout the day (Berghauser Pont et al., 2019; Cervero, 1996). Additionally, mixed land use enables dynamic settings since parking spaces during working hours for offices can serve restaurants and theaters at night (Cervero, 1996).
In this context, we evaluate land use in two dimensions: density and diversity. Using the Portuguese Census, we considered the population within each cell grid of 200-meters square for calculating the density (Instituto Nacional De Estatística, 2011). We summed the population corresponding to each centroid of all statistical Census blocks (smallest geographic unit for available statistical information) within each grid cell. Additionally, we divided the value within each cell by the average of all cells to analyze the population distribution in the territory (Equation (4)). The last step is essential for establishing zone selection requirements, discussed in section 5.

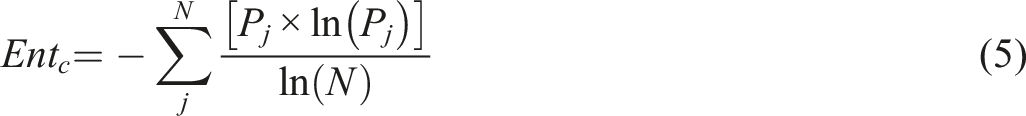
To calculate the land use diversity, we use the Entropy index. The Entropy index was first applied in information theory (Shannon, 1948), but has been used to calculate land use diversity for several years (Cervero and Kockelman, 1997). The index ranges between 0 and 1, where 0 has homogeneous land use, with only a single land use type, and 1 has an equal distribution of land use types. The entropy index is calculated in the following equation (5):
Temporal analysis
Motorized traffic dynamics
Streets with higher car volumes are more likely to be more contested since cars considerably use more space than other transport modes to carry the same number of passengers or freight and, therefore, reclaiming more space than other modes (Gössling et al., 2016). There is a higher challenge to reallocate space in highly congested streets due to limited space, and the need to perform tradeoffs and compromise one mode for another.
In this context, we use real-time floating car data from Google Maps to evaluate the complexity of reallocating road space within a zone from a temporal perspective. Google Maps tracks the location of mobile devices that users permit to share their location or that are actively using the app. Floating car data has proven to be a reliable and cost-effective method to collect and analyze traffic data of an entire road network (De Fabritiis et al., 2008). Also, this type of data is very useful to complement data from sensors in the network and evaluate travel time variability over time (Rahmani et al., 2015). The traffic levels in Google Maps are defined by a congestion delay index with color indicators: no traffic delays (green); medium traffic (yellow); high traffic (red); and heavy traffic (crimson).
We extracted real-time traffic data on a Thursday as a representative standard day, every hour from 6 AM to 11 PM. We consider that if a zone does not have any streets with high or heavy traffic conditions at any time of day, then the space is consistently underused. The problem, in this case, is not a lack of space, but rather an oversupply of space when compared to the existent demand. On the other hand, if a zone has a street with high or heavy traffic levels at any time of day, there is a dispute for space, which increases the complexity of reallocating it. We calculate the maximum traffic level of service of every street within each zone from 6 AM to 11 PM. Only zones where the maximum value of the level of service is high (level 3) or heavy (level 4) are selected as a requirement for complex zones to reallocate road space. This means that we select zones that have at least one street that intersects the zone, with high (level 3) or heavy (level 4) traffic levels at any time of day. The traffic dynamics indicator proposed in this paper is measured by the equation below:

Public transport dynamics
When public transport operates at a high frequency and the roads are congested, there must be a trade off between the amount of space that should be allocated for one mode or the other. Solutions, such as dedicated bus lanes or dynamic bus lanes (e.g., only during peak hours), can be employed to effectively reallocate road space in complex urban environments. Additionally, the presence of bus stops on the street occupies a significant amount of space that is crucial for accommodating pedestrians and facilitating convenient boarding of public transport, further adding to the complexity of the situation.
We use General Transit Feed Specification (GTFS) data to evaluate public transport frequency at bus stops over time. GTFS data contains a standard format of transit schedules including bus stop locations, routes, and trips, available from many public transport agencies. GTFS is a valuable tool for visualizing and analyzing the conditions of the public transportation network (Barbeau and Antrim, 2013). In Lisbon’s case study, only data from buses were used, since the metro is underground and does not directly compete for road space.
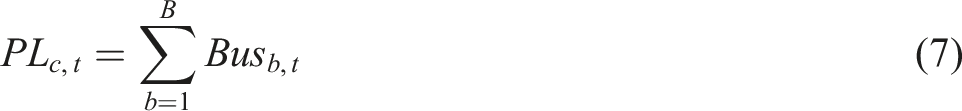
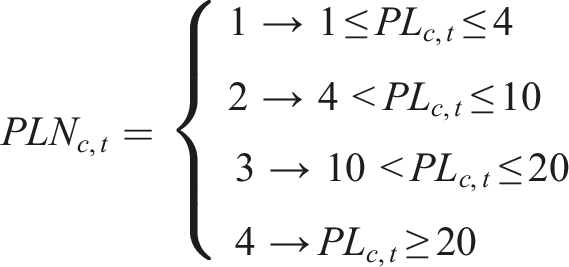
We calculate the hourly number of bus trips that pass through a bus stop from 6 AM to 11 PM. Sequentially, we calculate the total number of buses per hour within a zone. In this case, it is important to evaluate the zone and not the bus stop separately, since the combination of all bus stops within a zone will influence the complexity levels of reallocating road space. We adopt the classification of the Transit Street Design Guide of bus frequency and volume (National Association of City Transportation Officials, 2016). The guide classifies the bus frequencies into four categories based on headways, frequencies, and passenger occupancy levels. However, there are some overlaps of values referring to the bus frequency required for each category. Since we use only the frequencies of buses, we adapted slightly the classification proposed by the guide to have a fixed difference between the levels of classification. We classify the bus frequencies in four levels based on the Transit Street Design Guide, following equation (7): low volume (4 or fewer buses per hour); moderate volume (5 to 10 buses per hour); high volume (11 to 20 buses per hour); and very high (above 21 buses per hour).
The public transport dynamics indicator of a zone is measured by the maximum bus frequency level per hour throughout the day. Only selected zones that experience high (level 3) or very high (level 4) bus volumes for at least one hour are taken into consideration. The public transport dynamics indicator proposed in this paper is computed with equation (8):

Thus, the selected zones are chosen by the intersection of spatial and temporal indicators in the grid cells, classifying zones as complex or very complex, explained in more detail in Section 5.
Implementation
Data sources
Section S2 of the Supplementary Materials presents and explains the case study, Lisbon, Portugal. We used the centroids of each Census block to extract the resident population and the number of mainly residential buildings to calculate the land use density and diversity indicators, respectively. Besides the residential buildings, we used the Commercial Census in Portugal to gather data related to services and shops, restaurants and bars, and hotels to calculate the land use diversity (Câmara Municipal de Lisboa, 2010). We considered four main types of land use to calculate the Entropy index: primarily residential buildings, services and shops, restaurants and bars, and hotels. The road network was extracted from OpenStreetMap and treated using the sf, tidygraph, and rgrass7 packages of R version 4.0.3 (Bivand et al., 2021; Pebesma, 2018; Pedersen, 2020). The network typology was cleaned by breaking lines at intersections. As a result, nodes represent intersections, and the edges represent the road segments of the network. We used the googletraffic R package to extract real-time traffic conditions from 6 AM to 11 PM on April 27th (Marty, 2023). The calculations of the frequency of trips that arrived at each bus stop were executed by using the gtfstools library (Herszenhut et al., 2022). The GTFS from buses was extracted from the most recent data provided by CARRIS (30 December 2022), the main bus operating agency in Lisbon (Open Mobility Data, 2022). Furthermore, the open-source software QGis 3.18.1 (QGIS Development Team, 2021) was used to develop the maps and calculate the network's centrality indicators (degree, betweenness, and closeness) and land use indicators (density and diversity).
Results
Criteria for selecting complex and very complex zones to reallocate road space.
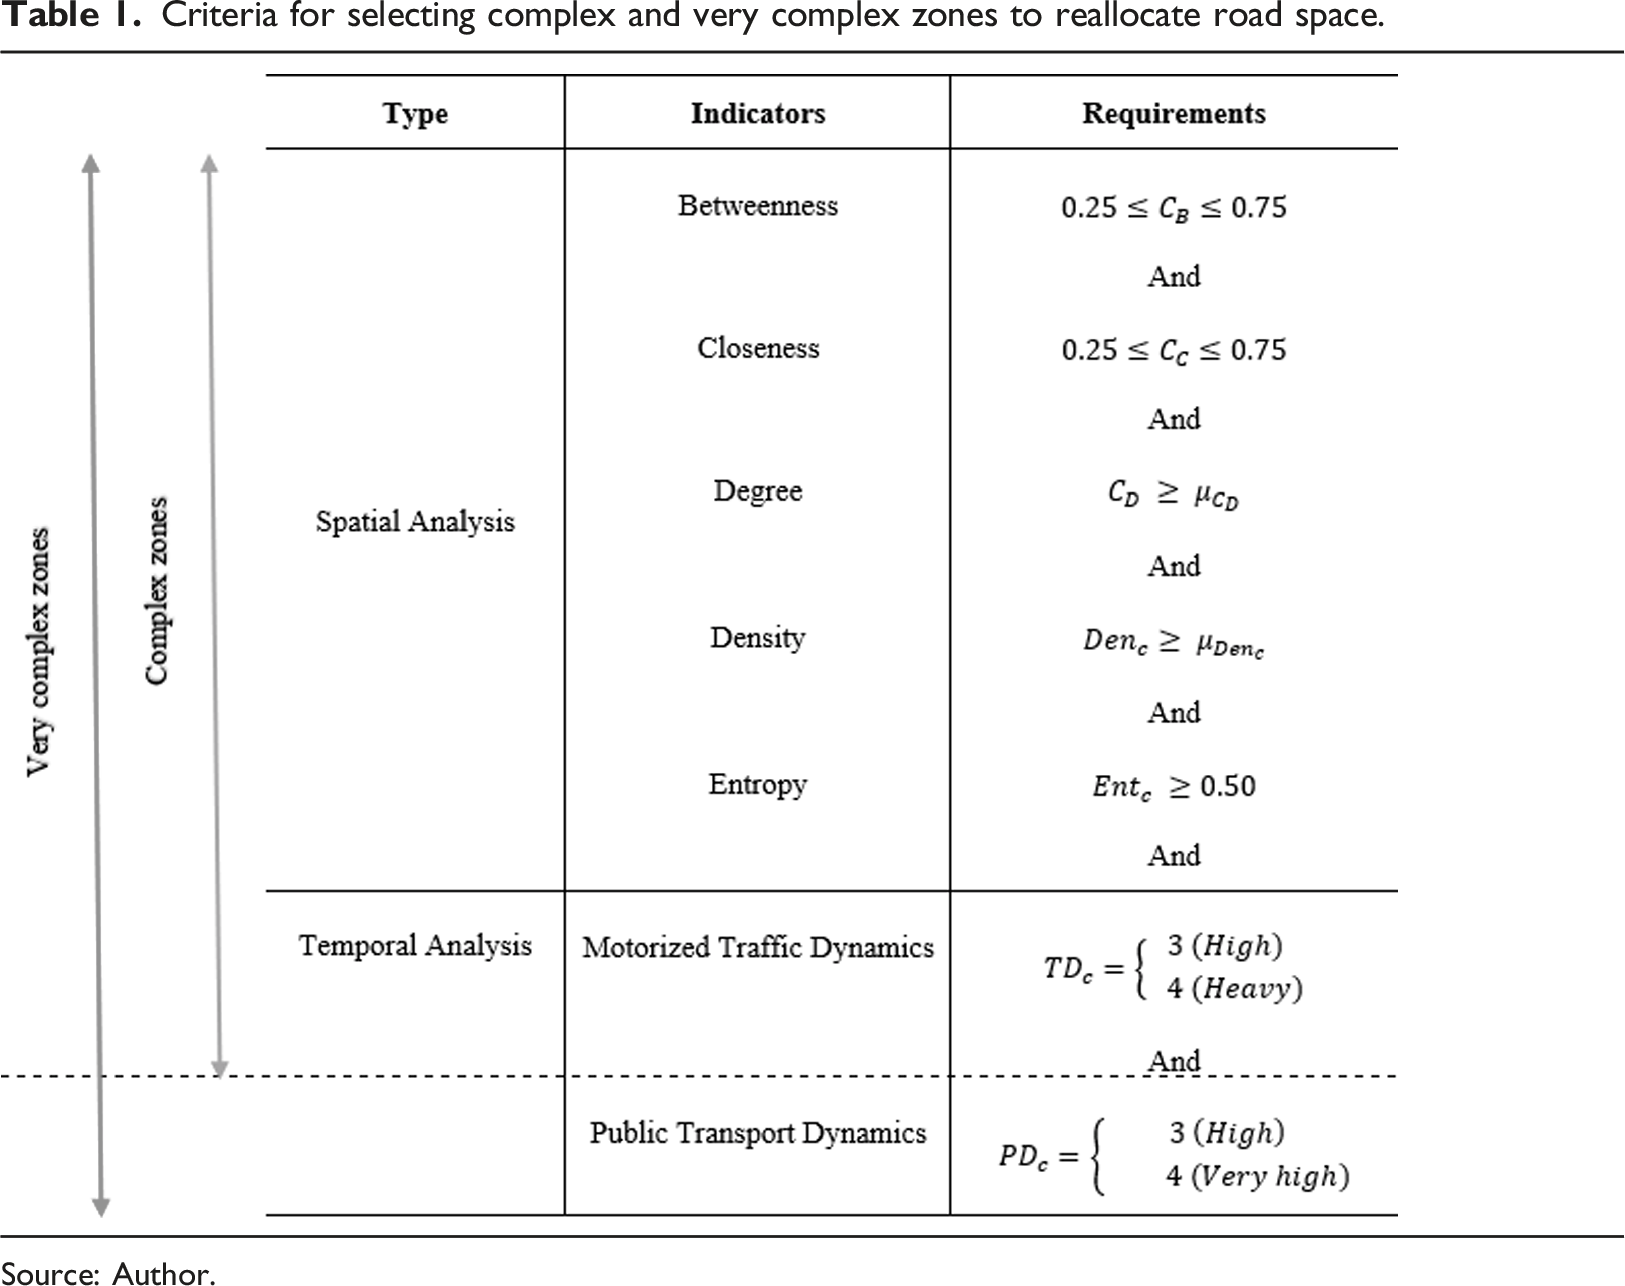
Source: Author.
We rescaled all the spatial indicators from 0 to 1 using the min-max normalization for each 200 × 200 m zone (except for the Entropy index since the original values already range within this scale). The temporal indicators are categorical variables with four categories each. The intersection approach was adopted since it is the combination of the indicators that correspond to zones with higher possibilities of having streets with diverse and intense activities while having limited space to fulfill all necessary functions and demands.
The threshold values of the betweenness and closeness are established based on the road allocation dilemma (Recall Figure 2). Therefore, road segments with values between 0.25 and 0.75 are expected to have conflicting demands between modes and urban functions. The degree and density mean values were used as the threshold values. This criterion is essential because these indicators can differ depending on the city. In the case of Lisbon, the degree average is 0.5. Approximately 60% of the 200 × 200 meter cells have higher values than the average. This indicates that most of the zones in the city have network connectivity above the average. The density average is 0.19, and 40% of the cells have a higher population density. 77% of the total population of Lisbon is located within the cells above the density average. This higher population coverage justifies using the average as the density threshold since most of the population meets this condition. Additionally, this criterion demonstrates how most of the population concentrates on only 40% of the territory.
Nonetheless, the absolute value of the Entropy index already represents the diversity of land use and does not need to be compared with the average. We established an entropy threshold of 0.5 since this value represents at least two of the four categories with an equal proportion of land use. Having two types of predominant land use already tends to promote some dynamics to the neighborhood since residents can walk to a shop, for example (Montgomery, 1998).
Descriptive statistics of the indicators for site selection.
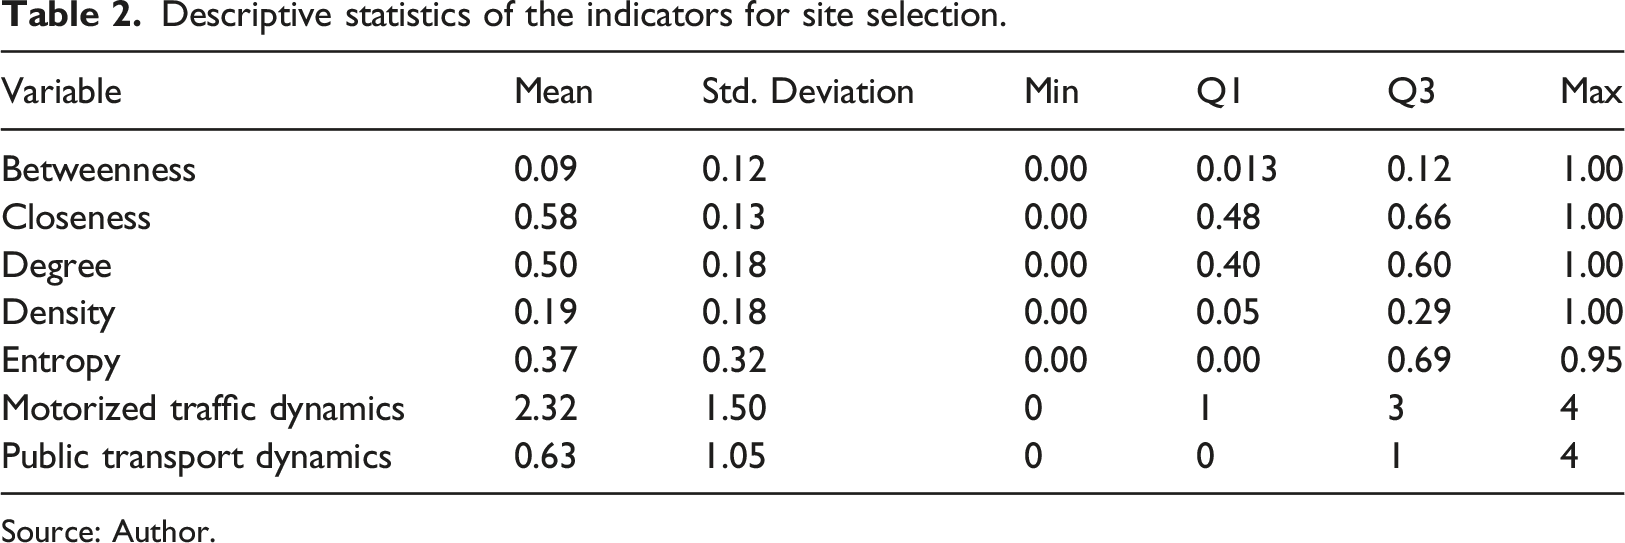
Source: Author.
Section S4 of the Supplementary Materials explains in detail the Sensitivity Analysis of the requirements for selecting complex zones. In summary, the betweenness and degree are the most sensitive since they are dependent on the road hierarchy. The replication of the method to other cities may require testing a range of constrained and expanded values for betweenness and degree.
Figure 3 demonstrates the individual result of each indicator following the requirements and the final selection of zones that intersected all the indicator's conditions. Out of the total 3675 cells measuring 200 × 200 meters across the entire territory, all the statistics were derived solely from the 1660 cells that intersect with a population centroid. This criterion was adopted because 55% of the cells lack population and are therefore not relevant to the analysis. Including them would significantly affect the results. Among the 1660 valid zones, a total of twenty zones were selected that fully meet the screening process requirements. However, seven of these zones pose significant challenges in terms of reallocating road space due to their complexity. Spatial distribution of the indicators and final selection of zones that meet the requirements of reallocating road space dynamically over time: (a) betweenness, (b) closeness, (c) degree, (d) density, (e) entropy, (f) Motorized traffic levels, (g) public transport frequency, (h) complex and very zones to reallocate road space. Source: Author.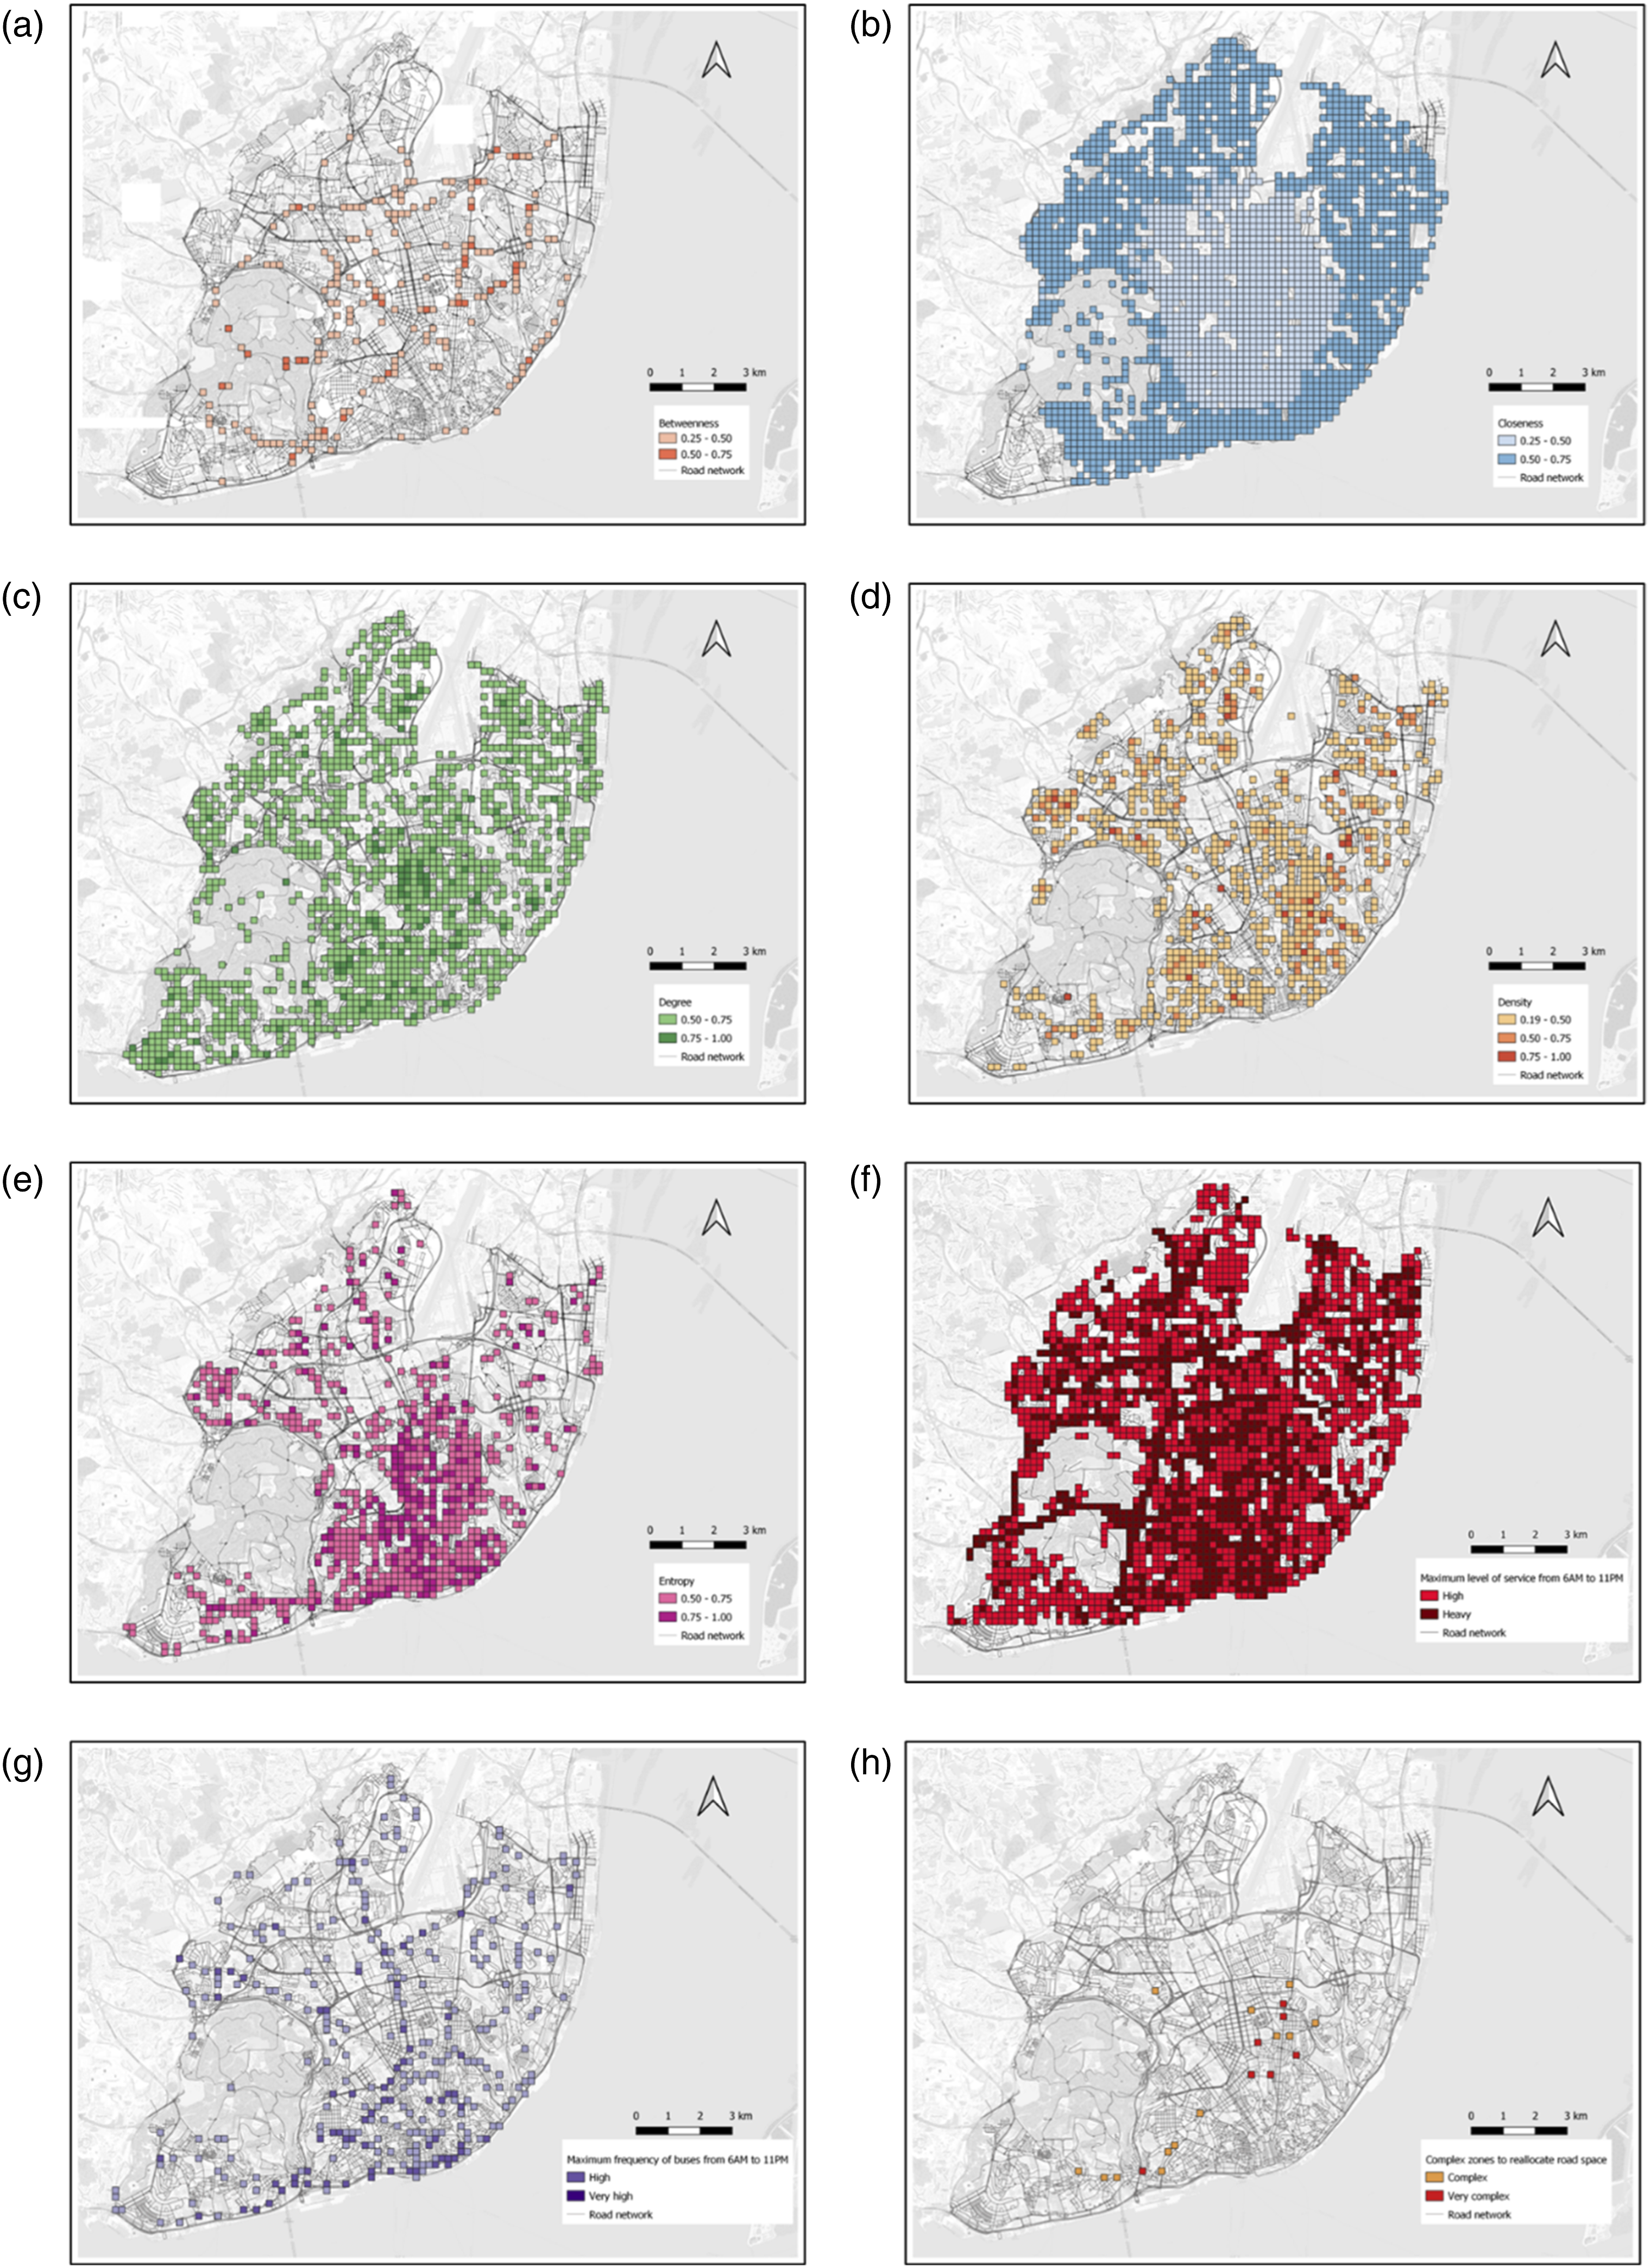
Discussion
Implications for practice
Figure 4 illustrates the designated zones’ spatial distribution and shows examples of road segments from one of the zones (GoogleStreetView images). Most of the selected zones are in the consolidated central area, where most of the economic activity is held around main corridors (Refer to Figure S1 in the Supplementary Materials). As expected, strictly residential and more local zones in the city were not selected since these usually have lower levels of land use diversity and values of betweenness and closeness near zero and one, respectively. Site selection of complex zones with potential for implementing dynamic road space allocation. Source: Author.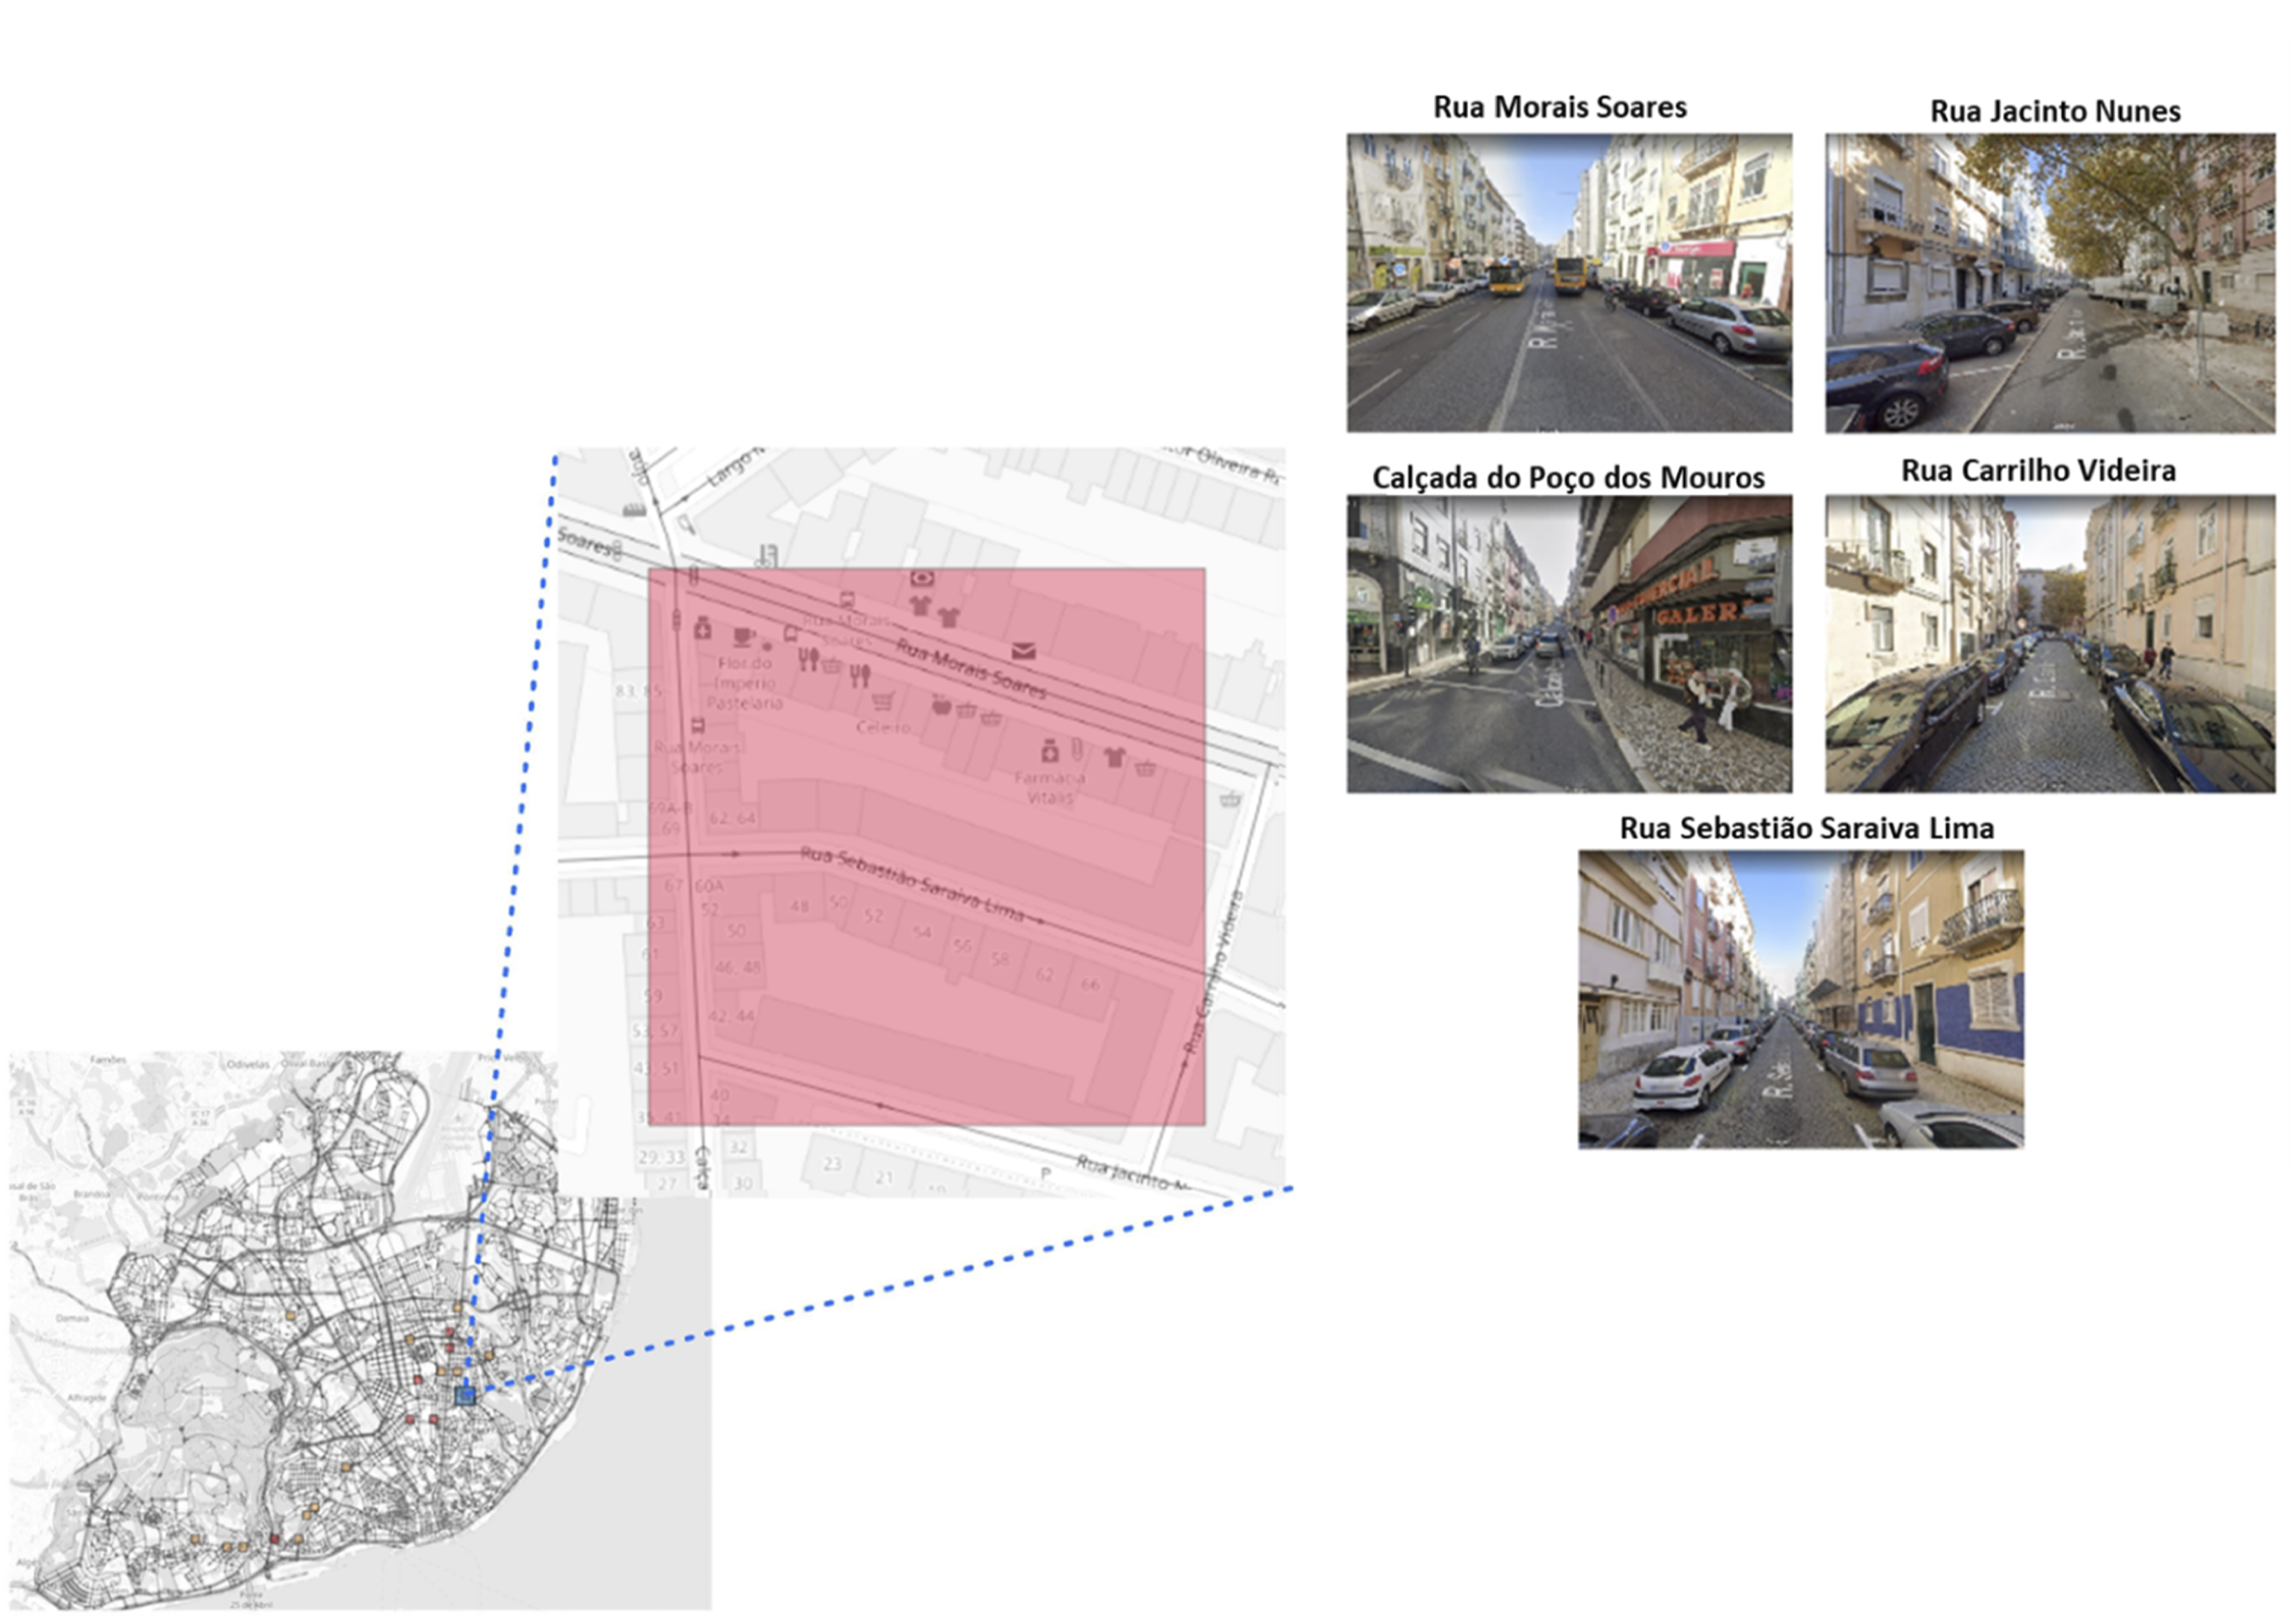
The use of the betweenness and closeness values to detect the disputed area of the road hierarchy classification has proven effective since all zones contain road segments classified as main or local distributors (e.g., Rua Morais Soares in Figure 4). As a result, zones containing mostly narrow streets are excluded from the screening analysis. However, since the road network is planned to provide capacity from higher to lower hierarchy classifications, some local streets appear in every zone. Consequently, the following step requires looking in more detail at each zone, identifying which streets have underutilized spaces and have a dispute between uses over the hours, days, and seasons (refer to Section S3 of the Supplementary Materials).
We observe that the zones have similar characteristics. Most zones have car-oriented streets, from two to five traffic lanes. Parking spaces are present in all zones, especially in streets that were car-oriented planned. Interestingly, most streets with more space dedicated to parking and traffic lanes tend to have less dedicated space for sidewalks and arborization. This fact confirms how road space is often scarce to accommodate all uses. On the other hand, we detected three zones that have a more equitable distribution of space. In these zones, traffic lanes are restricted to a maximum of two lanes, allowing more room for sidewalks and arborization.
Challenges and opportunities
Road space management is essential in complex zones since they are the most likely to have issues related to safety and public health. Congestion delays have a significant impact on air quality, resulting in higher health risks for on-road users (Zhang and Batterman, 2013). Evidence has demonstrated that crashes between motorized vehicles and active transportation have a higher probability in zones with more transit stops; wider road width; dense and diverse land uses; and elevated traffic volumes (Amoh-Gyimah et al., 2016; Ukkusuri et al., 2012; Wang et al., 2017).
Although there is a need to manage road space adequately in complex zones that have disputed and limited spaces, they often require tradeoffs. While traditional urban designs have a range of fixed solutions, dynamic road space allocation can increase the number of possibilities. Allocating space dynamically can be used to increase the accessibility of different modes and manage space more efficiently in terms of its use (Gonzales et al., 2010). As mentioned by Miller (2018), travel times of different transport modes vary along the day. Consequently, the accessibility to activities is also different depending on the time and transport mode. Potentially, road space could be allocated dynamically to improve accessibility of a certain mode to essential services (e.g., hospital, workplace, and groceries) in moments of the day when accessibility is low.
We acknowledge that allocating road space dynamically has its many challenges as described by Valença et al. (2021), including safety, acceptability of users, built environment restrictions, and cultural aspects. However, these challenges can be of different levels depending on the type of solution, the time interval of the dynamic application (e.g., hours, days, or seasons), and the local context. Also, the challenges and opportunities to allocate road space dynamically are different depending on the fluctuations of different demands and activities (Valença et al., 2023), as explained in more detail in Section S3 of the Supplementary Materials. Figure S2 illustrates an example of the types of fluctuations of demand in two zones in the city.
The highest potential for allocating space dynamically is when there are complementary demands over time, meaning that while one mode has limited space, the other is oversupplied at a certain time. When demands are disputed and high, the decision to reallocate road space statically or dynamically is not related to the use, but the policy goal, being the most complex and politically sensitive. In zones where spaces are vacant, and therefore, underutilized most of the time, we believe that dynamic road space allocation may not be suitable due to the priority to fulfill mainly the access and place function of the street.
Conclusion
This paper proposes a method to detect zones in the city with complex environments, that is, zones where allocating road space statically to all types of demands may be a political and operational dilemma. The method combines road network, land use, and traffic and public transport levels of service indicators to determine locations with main and local distributors, high motorized traffic and bus congestion levels, high road network connectivity, and dense and diverse land uses. Zones with these characteristics tend to have scarce urban space to fulfill the street's mobility/link and access/place functions. Furthermore, these zones tend to have high intensity and fluctuation of multimodal demands, leading to underutilized spaces at certain times of the day.
Traditionally, urban design has lacked consideration of urban dynamics, diverse activities, and working hours schedules. A dynamic allocation of underutilized road space in specific periods of the day can potentially satisfy the street's multimodal mobility/link or access/place functions requirements. Thus, it is necessary to evaluate the feasibility of implementing dynamic solutions in each zone based on possible barriers that may occur. The selected zones may have streets with morphological and topological characteristics of the built environment that may not be coherent or able to implement dynamic road space allocation (e.g., hilly streets or historic neighborhoods with environmental and architectural protection). Other barriers in terms of user acceptability and equity of proposed solutions must be considered and further evaluated.
Importantly, our selection method indicates the potential complex zones in the city but does not delimit the extent of the interventions. The limitation should be detected in a more specific analysis of the zones considering local characteristics through workshop activities or expert interviews. An example was given of how to define when to intervene in the road space dynamically based on the fluctuations of multimodal demands. It is essential to characterize the temporal patterns of land use and multimodal demands to detect when demands are competing or complementing each other.
A contribution of this work is that the method proposed is parsimonious only requiring open-source data from OpenStreetMap, Census, Google Maps, and General Transit Feed Specification. Detecting zones that may allocate road space dynamically over time is important for informing policymakers about the sites they should consider carefully. Additionally, the methodology is replicable for other cities and can be adapted to detect potential zones for other types of road space allocation. For example, by adapting the requirements of the indicators, it is possible to detect zones that have streets with more potential for implementing 30 km/h zones. In this case, lower levels of street connectivity and betweenness, and higher values of closeness would be expected.
Supplemental Material
Supplemental Material - Where is it complex to reallocate road space?
Supplemental Material for Where is it complex to reallocate road space? by Gabriel Valença, Filipe Moura and Ana Morais De Sá in Environment and Planning B: Urban Analytics and City Science.
Footnotes
Acknowledgments
We are grateful for the assistance of Rosa Félix in the data analysis of the paper. We also thank the two anonymous reviewers for their valuable contributions.
Declaration of conflicting interests
The author(s) declared no potential conflicts of interest with respect to the research, authorship, and/or publication of this article.
Funding
The author(s) disclosed receipt of the following financial support for the research, authorship, and/or publication of this article: This research is funded by Portuguese national funds Fundação para a Ciência e a Tecnologia (FCT), under project PTDC/ECI-TRA/3120/2021 (![]() ), entitled “STREETS4ALL - Dynamic and equitable Reallocation of Urban Street Space.” This work is part of the research activity carried out at the research centre of Civil Engineering Research and Innovation for Sustainability (CERIS) and the Centre for Innovation in Territory, Urbanism and Architecture (CiTUA). The work was funded by FCT in the framework of the following projects UIDB/04625/2020 (CERIS), and UIBD/05703/2020 (CiTUA).
), entitled “STREETS4ALL - Dynamic and equitable Reallocation of Urban Street Space.” This work is part of the research activity carried out at the research centre of Civil Engineering Research and Innovation for Sustainability (CERIS) and the Centre for Innovation in Territory, Urbanism and Architecture (CiTUA). The work was funded by FCT in the framework of the following projects UIDB/04625/2020 (CERIS), and UIBD/05703/2020 (CiTUA).
Data availability statement
Supplemental Material
Supplemental material for this article is available online.
References
Supplementary Material
Please find the following supplemental material available below.
For Open Access articles published under a Creative Commons License, all supplemental material carries the same license as the article it is associated with.
For non-Open Access articles published, all supplemental material carries a non-exclusive license, and permission requests for re-use of supplemental material or any part of supplemental material shall be sent directly to the copyright owner as specified in the copyright notice associated with the article.