
Abstract
Events are the driving force behind social media, whether we try to create them or keep up with them. A wide range of studies has focused on how content from social media can be used to detect, model and predict events and identify key topics of discussion. At the same time, very limited attention has been given so far to the quantitative study of the everyday, which has fascinated qualitative human geography research in the past few decades. That is partly due to the lack of a formal definition of what constitutes the everyday. In this paper, we aim to advance our understanding of the everyday, not by reducing it to any kind of definition but by bringing it into view through a quantitative analysis. We hypothesise that the by-products of current methods focused on event detection might be used to quantitatively explore everyday geographies as represented through Twitter data. We consider the use of both statistical approaches based on term frequency and state-of-the-art large language models, and we conduct a case study on content posted on Twitter and geolocated in the city of Leicester. Our paper makes two key advances for research concerned with the everyday and the analysis of geographic information. First, we illustrate how large language models combined with spatial analysis and visualisation can foster the study of everyday geographies, providing an insight into the still elusive concept of the everyday, representing what other approaches to the everyday have struggled to qualify. Secondly, we showcase the potential held by large language models and visual analytics in democratising sophisticated natural language processing and thus providing new tools for research in human geography.
Introduction
The story of how social media have been studied and used in geographic information science (GIScience) has been very ‘eventful’. Our attention has been captured by new possibilities in the detection and analysis of events. One of the earliest papers focussing on how the concept of citizens as sensors (Goodchild, 2007) can be applied to social media users was aptly titled ‘#Earthquake’ (Crooks et al., 2013), and disaster and crisis management have remained a primary concern and field of application of social media content in GIScience over the past decade (Yan et al., 2020). Impactful physical geography events like earthquakes, volcano eruptions and storms are perfect case studies in the field of Volunteered Geographic Information (VGI) which developed from the concept of citizens as sensors, as they are likely to leave a geographic digital shadow aligned with, but not fully matching, their geographic one (Shelton et al., 2014). The focus on events is also ubiquitous in studies that explore less dire online representations of our cities and countries, such as the study of the spatial and temporal patterns of social media posts (Longley and Adnan, 2016), their relationship with local demographies (Ballatore and De Sabbata, 2020) and the main topics discussed in the posts (Meyer et al., 2019). That said, the focus remains on what social media content can tell us about the key patterns and events happening in the spaces we live and key topics that emerge from the content describing the places we experience, with little to no attention being paid to the mundane, the ‘background noise’, the everyday – the mundane posts that compose a large part of social media content, like expressing midday cravings for chicken wings (Bennett et al., 2023).
Nevertheless, it is this noise – the ‘left over’ after all ‘superior’ activities have been extrapolated (Lefebvre, 1991: 97) – that is important in research concerned with everyday geographies, everyday places and everyday lives, which occupy geographers committed to the ordinary, commonplace, routine and local that shape people’s worlds (Wise and Velayutham, 2009). As an adjective, ‘everyday’ is commonplace, providing a sense of the places, lives or experiences in focus. As a noun, the everyday concerns a commitment to the human in geography, their experience of being in the world – one shaped by struggles, oppressions and power structures – as they routinely and creatively go about their daily lives. Whilst the everyday involves places routinely experienced, activities barely worth mentioning, experiences so deeply embodied they rarely tug at frames of awareness, the everyday matters because it can reveal how we relate to the places we live (Holloway and Hubbard, 2000) – how, for example, a superdiverse city is variously and routinely experienced, and shaped, in situ and in practice (Neal et al., 2013).
However, the study of the everyday is underpinned by a ‘crisis of representation’. Lefebvre suggested that with any kind of definition, the everyday ceases to exist – ‘an elusive reality that escapes every direction’ (Elden et al., 2003: 81). Such a fundamental gap between ‘reference’ and ‘real’, between ‘word’ and ‘world’ (Horton and Kraftl, 2013), has animated the human geography research agenda since the ‘cultural turn’. That shift has been mirrored in Natural Language Processing (NLP), where the focus has shifted from methods based on thesauri, synonyms and hypernyms, to a statistical, distributional perspective (Mikolov et al., 2013). Moreover, most current approaches to NLP have moved beyond the idea of understanding the meaning of single words. Rather, they focus on the relationship between words and the meaning of and similarity between sentences, paragraphs or documents (Le and Mikolov, 2014). Confusingly, these approaches are referred to as ‘representation’ learning in AI, although they are akin to ‘anti-representational’ (‘significatory’) and ‘post-representational’ readings in cultural studies, while ‘representational’ readings in cultural studies are more akin to ‘symbolic’ AI.
In this paper, we aim to leverage recent advances in NLP to explore the everyday without a formal definition. The everyday is more of a ‘notion’, for ‘it is always a residual category and never a concept’ (Elden et al., 2003: 70). Thus, to explore whether we can quantify what we can’t qualify (Bennett and De Sabbata, 2023), we use an approach based on self-supervised and unsupervised machine learning to identify that ‘residual category’ that could relate to the everyday. We then use a series of rule-based and supervised approaches to characterise that content through the context, topics, sentiment and emotions it encapsulates or excludes. Our intention is to shape an everyday that emerges at the point at which it is variously tweeted about, involving thousands of Twitter users as our informants as they publicly share snippets of their lives and experiences in Leicester (UK) as they routinely wait, queue, work, hang out, and so on. In particular, we address the following research questions: • • •
In the next section, we briefly review the recent work on social media content analysis in geography, before presenting our methods and results.
Related works
Steiger et al. (2015) provided the first systematic review of the then-emergent field of Twitter data analysis, tracing its development from its origins in computer science around 2005 to its spread to GIScience around 2011. Event detection was identified as the predominant field of application in GIScience, with disaster management as the most common type of case study. Moreover, the review identified the lack of combination of different methods as one of the key limitations of the research field. Stock (2018) provided another systematic review but focused on mining location information, whilst others have focused on more specific areas of the field (Wiegmann et al., 2021; Wilkins et al., 2021). Yan et al. (2020) identified Twitter as a major source of VGI, and disaster and crisis management were among the topics highlighted as the most common application field. Other applications identified are in mobility and spatial cluster analysis with Feng et al. (2022) providing a good overview of recent approaches to the analysis of VGI (mostly Twitter) for disaster identification.
Sentiment analysis has been a key tool in social media analysis. For instance, Larsen et al. (2015) designed ‘We Feel’ as a system for a continuous, global survey of emotions expressed via Twitter. Roberts et al. (2019) applied sentiment analysis to Twitter data to study people’s emotional responses to urban green spaces in Birmingham (UK). Karmegam and Mappillairaju (2020) analysed emotional responses on Twitter to the Chennai (India) floodings in 2015. Zivanovic et al. (2020) conducted a comparative study of a quality of life survey and tweets geolocated in Bristol (UK), listing the lack of machine learning and advanced natural language processing algorithms as a limitation of the study. Camacho et al. (2021) conducted a spatial point pattern analysis of the emotions expressed throughout the United States regarding the use of natural gas. They highlighted that using only one method of sentiment analysis was common but might not be sufficient, so they adopted an ensemble approach, demonstrating the advantages of combining sentiment analysis with naïve Bayes, support vector machine and logistic regression models.
Beyond sentiment analysis, both Steiger et al. (2015) and McKitrick et al. (2022) highlighted how Latent Dirichlet allocation (LDA) is the most common, unsupervised approach used to explore the topics emerging from a set of social media posts. LDA is a generative statistical model in NLP which can be used to discover latent topics within a corpus. Spatial variants of LDA have also been suggested by Wang et al. (2007), Pan and Mitra (2011) and Canh and Gertz (2013). Zhang et al. (2021) instead adopted Biterm Topic Model (BTM, Yan et al., 2013) as a more appropriate approach to topic modelling when working with short texts such as tweets, as BTM relies on corpus-level word co-occurrence rather than document-level co-occurrence, which suffers from data sparsity when working with short texts.
More recently, the emergence of transformers (Vaswani et al., 2017) and large language models – such as Google’s BERT (Devlin et al., 2018), OpenAI’s GPT-3 (Brown et al., 2020) and Meta’s LLaMA (Touvron et al., 2023) – had a transformative impact on NLP. These foundational models provide simple access to complex word, sentence and document embedding tools, which can be fine-tuned to a wide range of applications and contexts. Barbieri et al. (2020) used the RoBERTa (Liu et al., 2019) model to develop a series of models, specifically designed to handle short text like tweets and including text classifiers able to effectively predict four emotions (anger, joy, sadness and optimism). Grootendorst (2022) recently proposed BERTopic, which identifies topics in a corpus by reducing the dimensionality of embeddings using UMAP (McInnes et al., 2018), whilst preserving both the local and global structure of the embeddings. BERTopic then clusters the low-dimensional embeddings using HDBSCAN (Campello et al., 2013), which supports the clustering step based on the proximity among embeddings, rather than matching a pre-defined number of clusters. BERTopic clusters are then characterised based on the classic tf-idf measure.
Methods
In this section, we introduce the data and the six different approaches that we used in our analysis. Each approach provided a different lens through which we explored and characterised the data to extrapolate big events and latent topics, as well as the everyday and how it is experienced. We included both classic statistical learning and deep learning methods: • A topic modelling analysis based on BERTopic (Grootendorst, 2022); • A topic modelling analysis based on BTM (Yan et al., 2013); • A sentiment analysis using a dictionary-based algorithm with value shifters provided by Sentimentr (Rinker and Buffalo, 2021a); • A sentiment analysis based on document transformers provided by Flair (Akbik et al., 2019); • Two few-shot text classifiers (Brown et al., 2020) of emotion and context that we trained through a manually-labelled sample of our dataset based on Twitter-roBERTa (Barbieri et al., 2020) and Flair (Akbik et al., 2019).
These methods allowed us to test our first hypothesis (linked to RQ2): that a combination of the background topic generated by the BTM approach and the group of elements left unclustered by the density-based clustering of embeddings might be able to identify the ‘residual deposit’ (Moran, 2005: 8) that constitutes the everyday.
Moreover, we conducted a spatial point pattern analysis using the L-function (Besag, 1977) to test our second hypothesis (linked to RQ3): that everyday content (as classified through the methods listed above) is less clustered than events and topics, which might be more closely related to specific places and local events.
Twitter data collection and pre-processing
The data is composed of public tweets collected through the official Twitter Developer API, 1 posted between January 2018 and December 2019 and including a geo-tag in Leicester, both precise geo-tags and place geo-tags. The initial dataset contained 1,046,386 tweets posted by 32,545 users. That included 867,459 tweets posted by 30,505 users where the tweet’s metadata indicated English as the language, which is 82.9% of the total content posted by 93.73% of the users.
As quantitative analysis can be very sensitive to spam and content created by bots, we removed such content as far as possible. However, as the aim of the project was to study how Leicester is experienced as part of everyday life (Bennett et al., 2023), we took a very cautious approach to removing content and only did so when there was a possibility that the content might significantly skew the overall picture emerging from the data. Among the 30,505 users in the English dataset, we checked all users who posted on average more than two tweets per day, and we interrogated bursts of concentrated activity over a short period of time. We also explored users posting the same message more than three times. In total, we identified for removal 45 users who posted 17,471 tweets (i.e. 2.01% of the English tweets dataset, 1.67% of the original content). That left us with 849,988 tweets posted by 30,460 users, or 81.23% of the original content posted by 93.59% of the users in the original dataset.
We pre-processed the text using the R package Textclean (Rinker and Buffalo, 2021b) in two steps. First, we removed web links (i.e. URLs), emails and username mention when working with methods using a bag-of-words approach, whereas they were replaced by placeholders such as ‘username’ or ‘website’ when working with methods based on document embeddings, as well as with the sentiment analysis conducted using Sentimentr. Second, we removed the hash symbol from hashtag mentions, leaving them as plain text, and replaced contractions, word elongation and internet slang with plain text equivalents. Furthermore, dates, times, grades, ratings, numbers, symbols, emoticons and emojis were replaced with their text equivalent. These steps still introduce some uncertainty, as replacements might not always align with what the author meant when they wrote the tweet. Still, they usually provide more accurate results at the aggregate level. We then used the R package Textstem (Rinker and Buffalo, 2018) to lemmatise the text.
Transformers-based topic modelling
As a first approach to topic modelling, we adopted BERTopic as proposed by Grootendorst (2022) but implemented each step separately in python and R to allow for a more flexible and customisable process. We used Flair to generate sentence embeddings using the Twitter-roBERTa-base model (Barbieri et al., 2020). We then used UMAP (McInnes et al., 2018) to reduce the dimensionality of the data to only two dimensions, allowing a detailed inspection of the tweets and their semantic relationship. Such an approach was particularly insightful when exploring the everyday content rather than main topics and events that can be more easily extracted and examined separately.
We then used HDBSCAN (Campello et al., 2013) to identify not just the main, large clusters but also the smaller ones, along with those documents which are simply too isolated to be clustered – the ‘left over’. To identify the best parameters for the HDBSCAN procedure, we first ran the classic DBSCAN clustering process on the two-dimensional space created by UMAP, using 21 equally-intervalled values between 0.005 and 0.025 as epsilon parameter. The results suggested that a 0.01 value of the minimum epsilon for the HDBSCAN procedure would allow some larger clusters to be maintained and prevent the overall number of clusters from becoming unmanageable. To that purpose, we selected 50 as the minimum size for clusters. That resulted in 1739 clusters plus a set of unclustered tweets (the latter is automatically assigned the label ‘-1’ by the HDBSCAN algorithm). As outlined above, our hypothesis is that the set of unclustered tweets, the left over, might represent the everyday.
Finally, we implemented our visual exploration of the data in R, obtaining the results discussed below. As we do not use the BERTopic library directly, in the remainder of the paper, we will refer to this approach based on the use of document transformers combined with UMAP and HDBSCAN as transformer-based clustering (or TBC).
Biterm topic model
Our second approach to topic modelling was BTM (Yan et al., 2013), which requires the selection of a pre-defined set of topics. Meyer et al. (2019) used an iterative approach and finally identified 300 as an adequate number of clusters for 1.4 million tweets about the city of Madrid. Our project involved a smaller city (with a population of 368,800 according to the 2021 UK Census) and about half the number of tweets. The results obtained from the transformer-based clustering approach outlined above suggest that the size of the clusters starts to flatten after 200. As such, we settled on 200 topics. Moreover, we included a background topic, which aims to group all tweets whose content follows the overall word distribution, following our first hypothesis that such a group might characterise the everyday. To better align the BTM topic labels to the TBC cluster labels and render the remainder of the analysis clearer, we used the label ‘-1’ for the background cluster.
Algorithmic sentiment analysis
To explore not only the topics that shape the everyday but also how they are experienced, we also used two sentiment analysis approaches. Firstly, we used the R package Sentimentr (Rinker and Buffalo, 2021a), a dictionary-based algorithm designed to also account for a wide range of valence shifters, such as amplifiers, deamplifiers and negators, providing a significant advantage compared to simpler approaches (Naldi, 2019). Secondly, we used a pre-trained sentiment classifier from the Python library Flair (Akbik et al., 2019). This model was developed as a text classifier using document transformers and trained using data from IMDB. This second approach provides a ‘positive’ or ‘negative’ label along with a confidence value. To better compare the two classifications, we recoded the results based on the scores and confidence distributions, marking as neutral all tweets whose Sentimentr score fell within 0.1 on either side of the origin or whose Flair confidence score was below 0.95.
Learning qualitative labels
To better understand the emotion (beyond sentiment) and the context (beyond topic) that characterise how the everyday is experienced in Leicester, we decided to implement two few-shot text classifications (Brown et al., 2020). From the dataset of geo-tagged tweets in Leicester described above, small samples of tweets were extracted using two different approaches, based on the broader scope and activities of the project. 2 First, a sample of tweets was selected based on a set of keywords and hashtags related to everyday multicultural living in Leicester. Second, a sample of tweets geolocated with coordinates was extracted based on their location in selected areas of the city. Random sampling was applied to reduce the size of the samples related to some keywords and areas (e.g. the city centre), resulting in a final set including 2816 English tweets, which were used to train the two text classifiers.
The social media posts were qualitatively coded (i.e. labelled, but using a wide range of labels as is common in qualitative content analysis) based both on their emotion and context, resulting in 50 context and 60 emotion labels. As a text classifier would not have been able to learn such a large set of labels from a relatively small set of tweets, we iteratively narrowed down the set of labels to eight context and eight emotion labels.
The corpus was split into the training, validation and testing sets (70%-20%-10%) as per common practice, stratified by emotion for the training of the emotion model and by context for the context model. We created a deep learning model using the TextClassifier of the Python library Flair version 0.10 (Akbik et al., 2019) and using the Twitter-roBERTa-base and Twitter-roBERTa-base for Emotion Recognition (Barbieri et al., 2020) encoders to train the models for the context and emotion labels, respectively. The model was trained using an AdamW optimiser and a
Spatial analysis
Finally, to explore the spatial distribution of the classifications obtained through the methods outlined above, we adopted the L-function suggested by Besag (1977) as a transformation of the K-function suggested by Ripley (1977), to assess the level of spatial clustering of each class. For each class of each classification, a function (
Results
We initially hypothesised that the set of tweets left unclustered by TBC might compose a viable formalisation of the everyday as lived and expressed through social media. The TBC approach outlined above clustered 58% of the dataset into 1739 clusters, leaving 42% of the tweets as unclustered. A cursory review of a sample of tweets from that group suggests that most of those posts would fit the idea of a general comment on everyday life, from ‘snoring cats’ to Friday being ‘just around the corner’. However, we did not have to look far to find mention of events, such as marathons. Moreover, some clusters also do not seem to focus on a specific topic. The two largest TBC clusters (1016 with 7.2% and 906 with 3.2% of tweets) do not seem to attend to any easily identifiable topic, compared to the third largest cluster (543 with 2.8% of tweets), which seems to relate to Leicester City Football Club or cluster 251 (with 0.43% of tweets), which seems to concern boxing and fitness. As such, these results do not seem to support our original hypothesis, as we could not identify a clear relationship between tweets being clustered or not and whether they focused on an event or topic.
Figure 1 presents multiple variations on the same plot, where each dot represents a tweet and its meaning is represented by its position in the two-dimensional space generated during the TBC procedure by applying the UMAP dimensionality reduction process to the numerical representation of the tweets generated by the document transformer. That is, Figure 1 presents subsections of the space and data to which the HDBSCAN algorithm has been applied. That allows an effective visualisation of TBC clusters (Figure 1(d)), showcasing some of the connections and overlaps between different classifications mentioned above. For instance, the TBC clusters 458, 456, 250 and 251 (Figure 1(d)) align well with corresponding topics generated by the BTM model (Figure 1(c)). Overview of the results obtained via the six models of a subsection of the two-dimensional space generated during the TBC procedure by applying the UMAP dimensionality reduction process to the numerical representation of the tweets generated by the document transformer. Colour is used to illustrate the results of the sentiment scores produced by Sentimentr (a) and Flair (b), the topics identified by BTM (c) and TBC (d), and the classes assigned by the emotion (e) and context (f) models.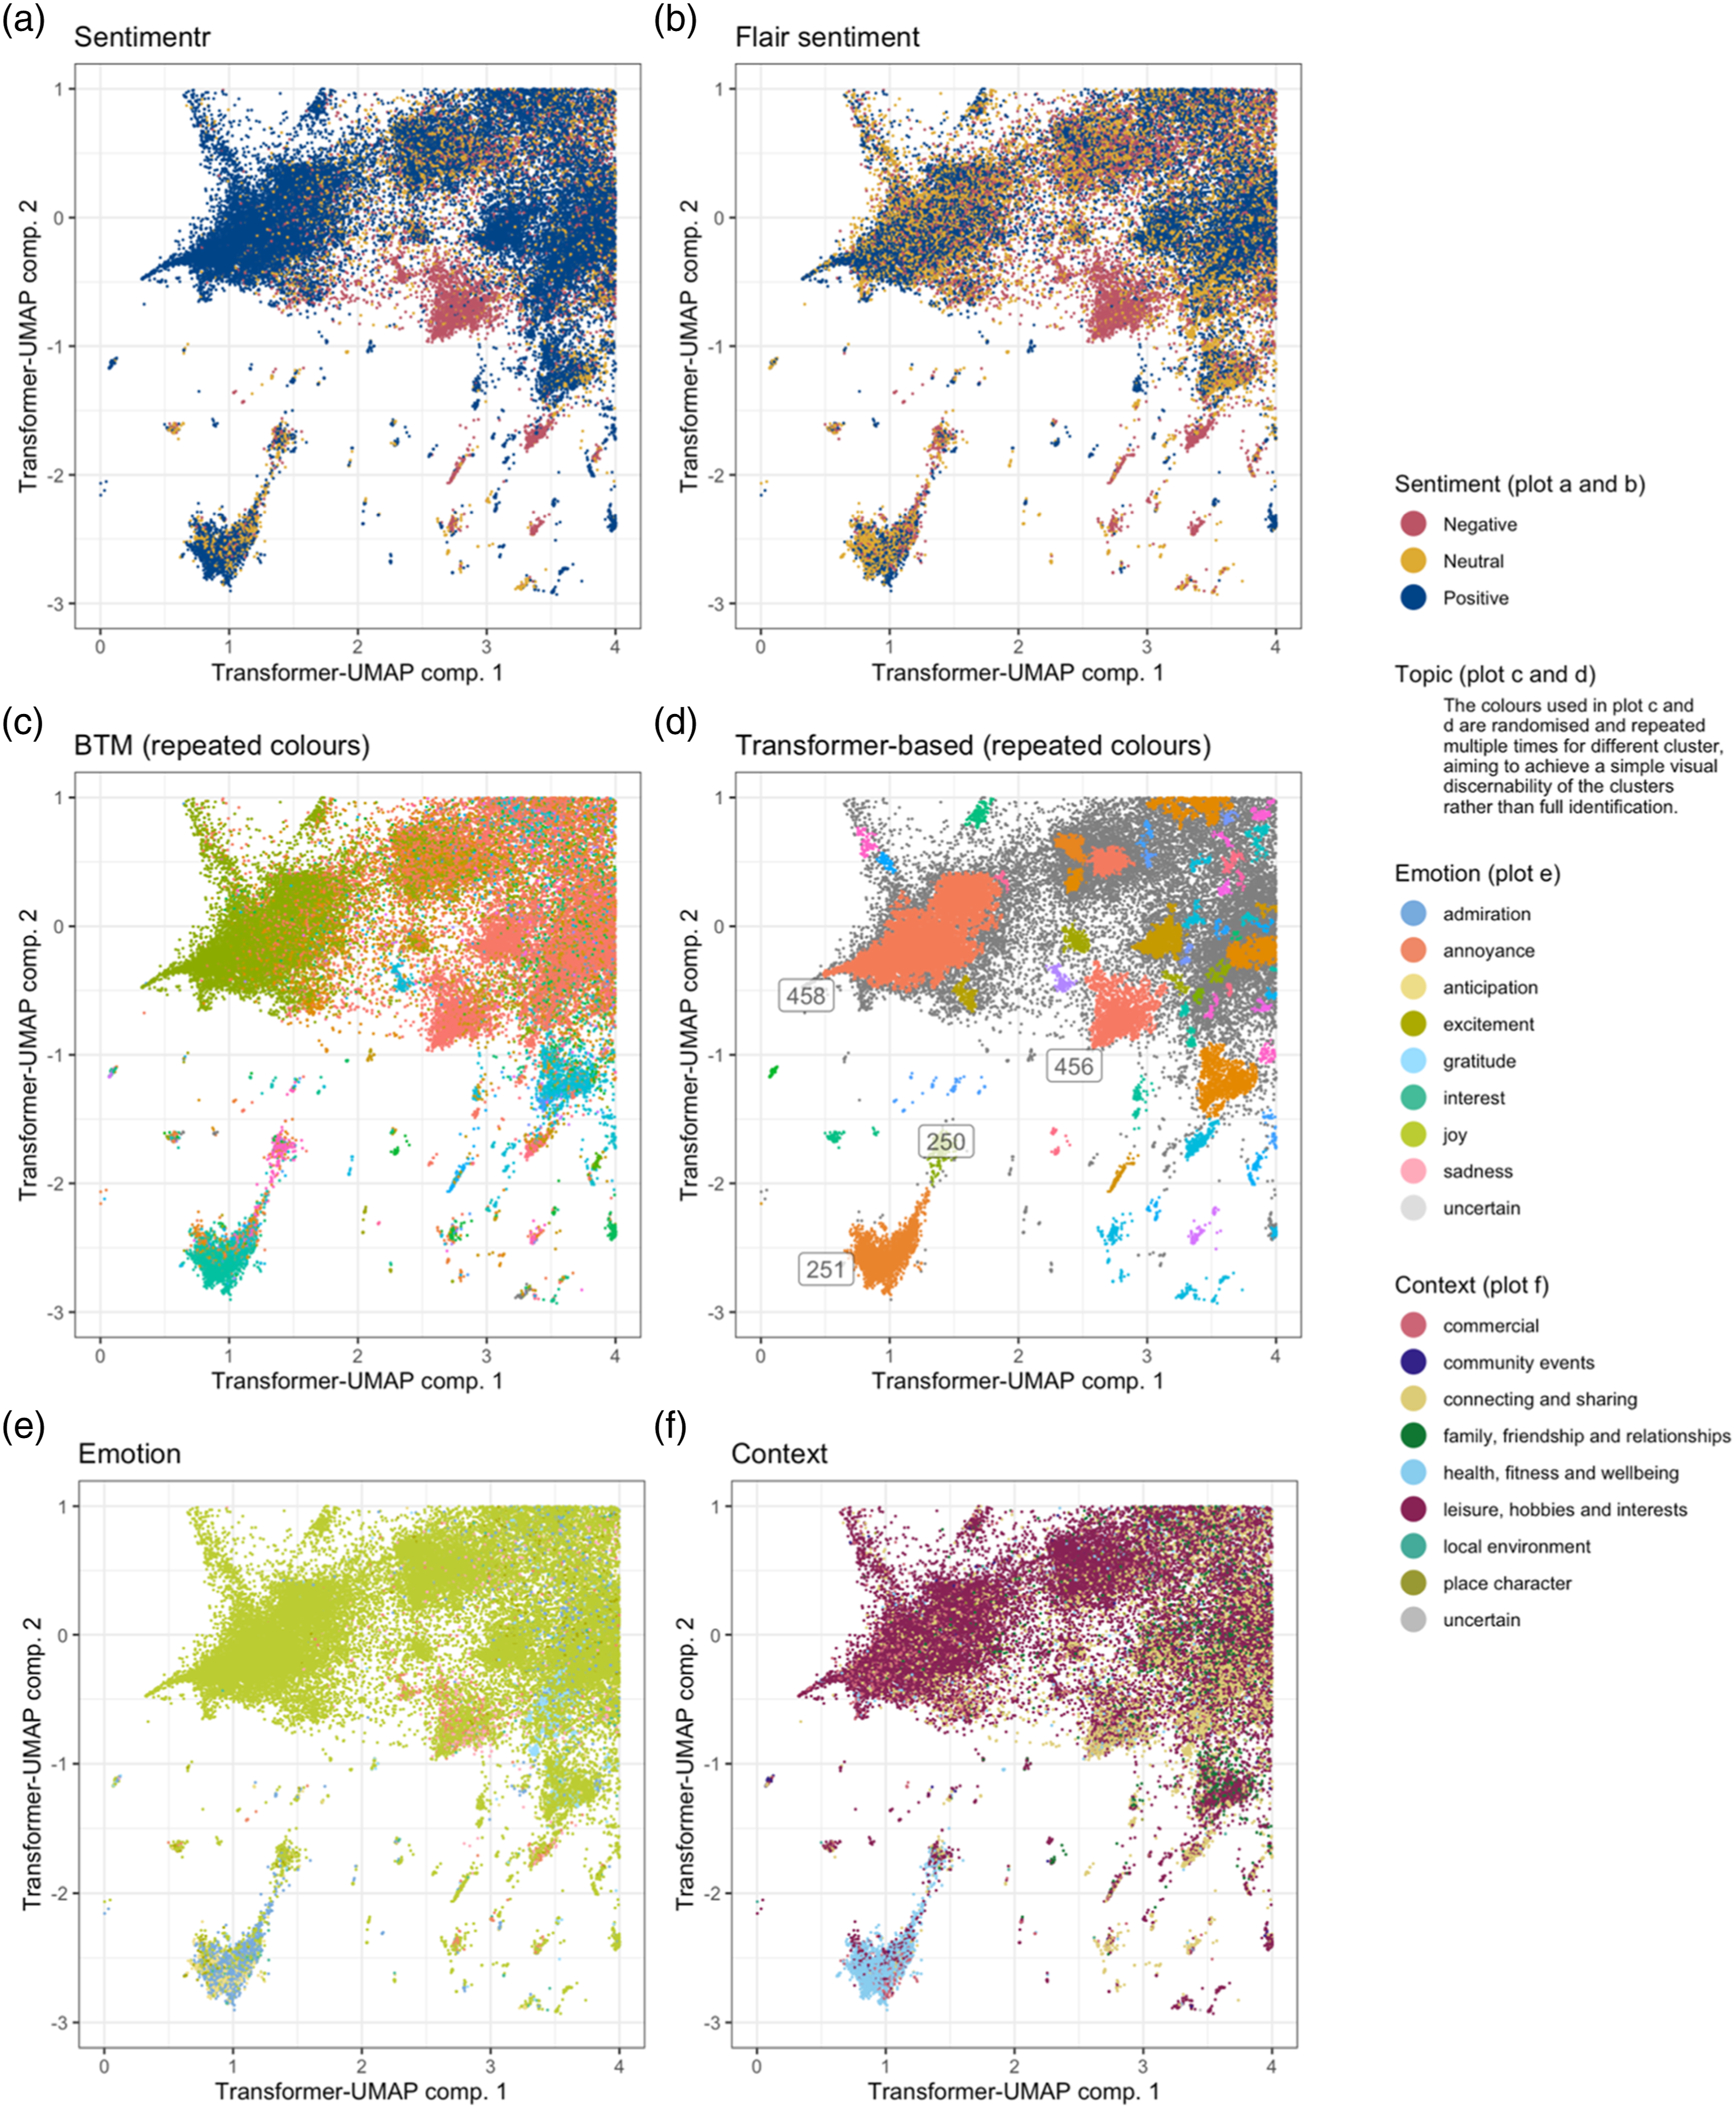
Among the main overlaps between the BTM model and TBC, cluster 458 largely overlaps with topic 74 and 251 largely overlaps with topic 78, including tweets seemingly linked to boxing and fitness. The nature cluster 251 is also supported by the results obtained from the emotion and context classifications, which label those tweets as related to health, fitness and wellbeing (Figure 1(f)) and mainly convey a sense of admiration (Figure 1(e)). Cluster 458 seems strongly related to the laughing emoji, while cluster 456 seems strongly related to the crying emoji (Figure 1(d)), and both seem to correctly align with positive and negative sentiments as identified by Sentimentr (Figure 1(a)) and Flair (Figure 1(b)).
However, there is clear evidence that classifications do not always align as expected. For instance, most tweets in the TBC clusters 458 and 456 (Figure 1(d)) are predicted to convey a sense of joy (Figure 1(e)), despite cluster 456 being seemingly more related to negative sentiment (Figure 2(a) and (b)). The label representing the tweets unclustered by TBC seems to overlap the various context and emotion categories somewhat uniformly. The BTM background topic seems to favour the community events context as well as the group of tweets marked as uncertain for both emotion and context. While the latter might be a sign of a relationship with everyday content, the former seems to indicate the exact opposite. The label representing the tweets unclustered by TBC seems to overlap widely with many BTM topics, including topics 38 and 154, which revolve around sports and brexit, respectively. The overlap between tweets unclustered by TBC and the BTM background topic is minimal, including only 9832 tweets. Most of those are short messages (replies make up 66% of the group) with little context, and while that might constitute a good formalisation of the everyday, the size of the group (1.1% of the dataset) might be too small to safely assume that it constitutes the whole of the everyday discussions. Overview of the spatial clustering (L-function) of the classes generated by the six models. (a) Semtimentr, (b) flair sentiment, (c) BTM topics (min 25 tweets), (d) tranformers-based clusters (min 25 tweets), (e) emotion and (f) context.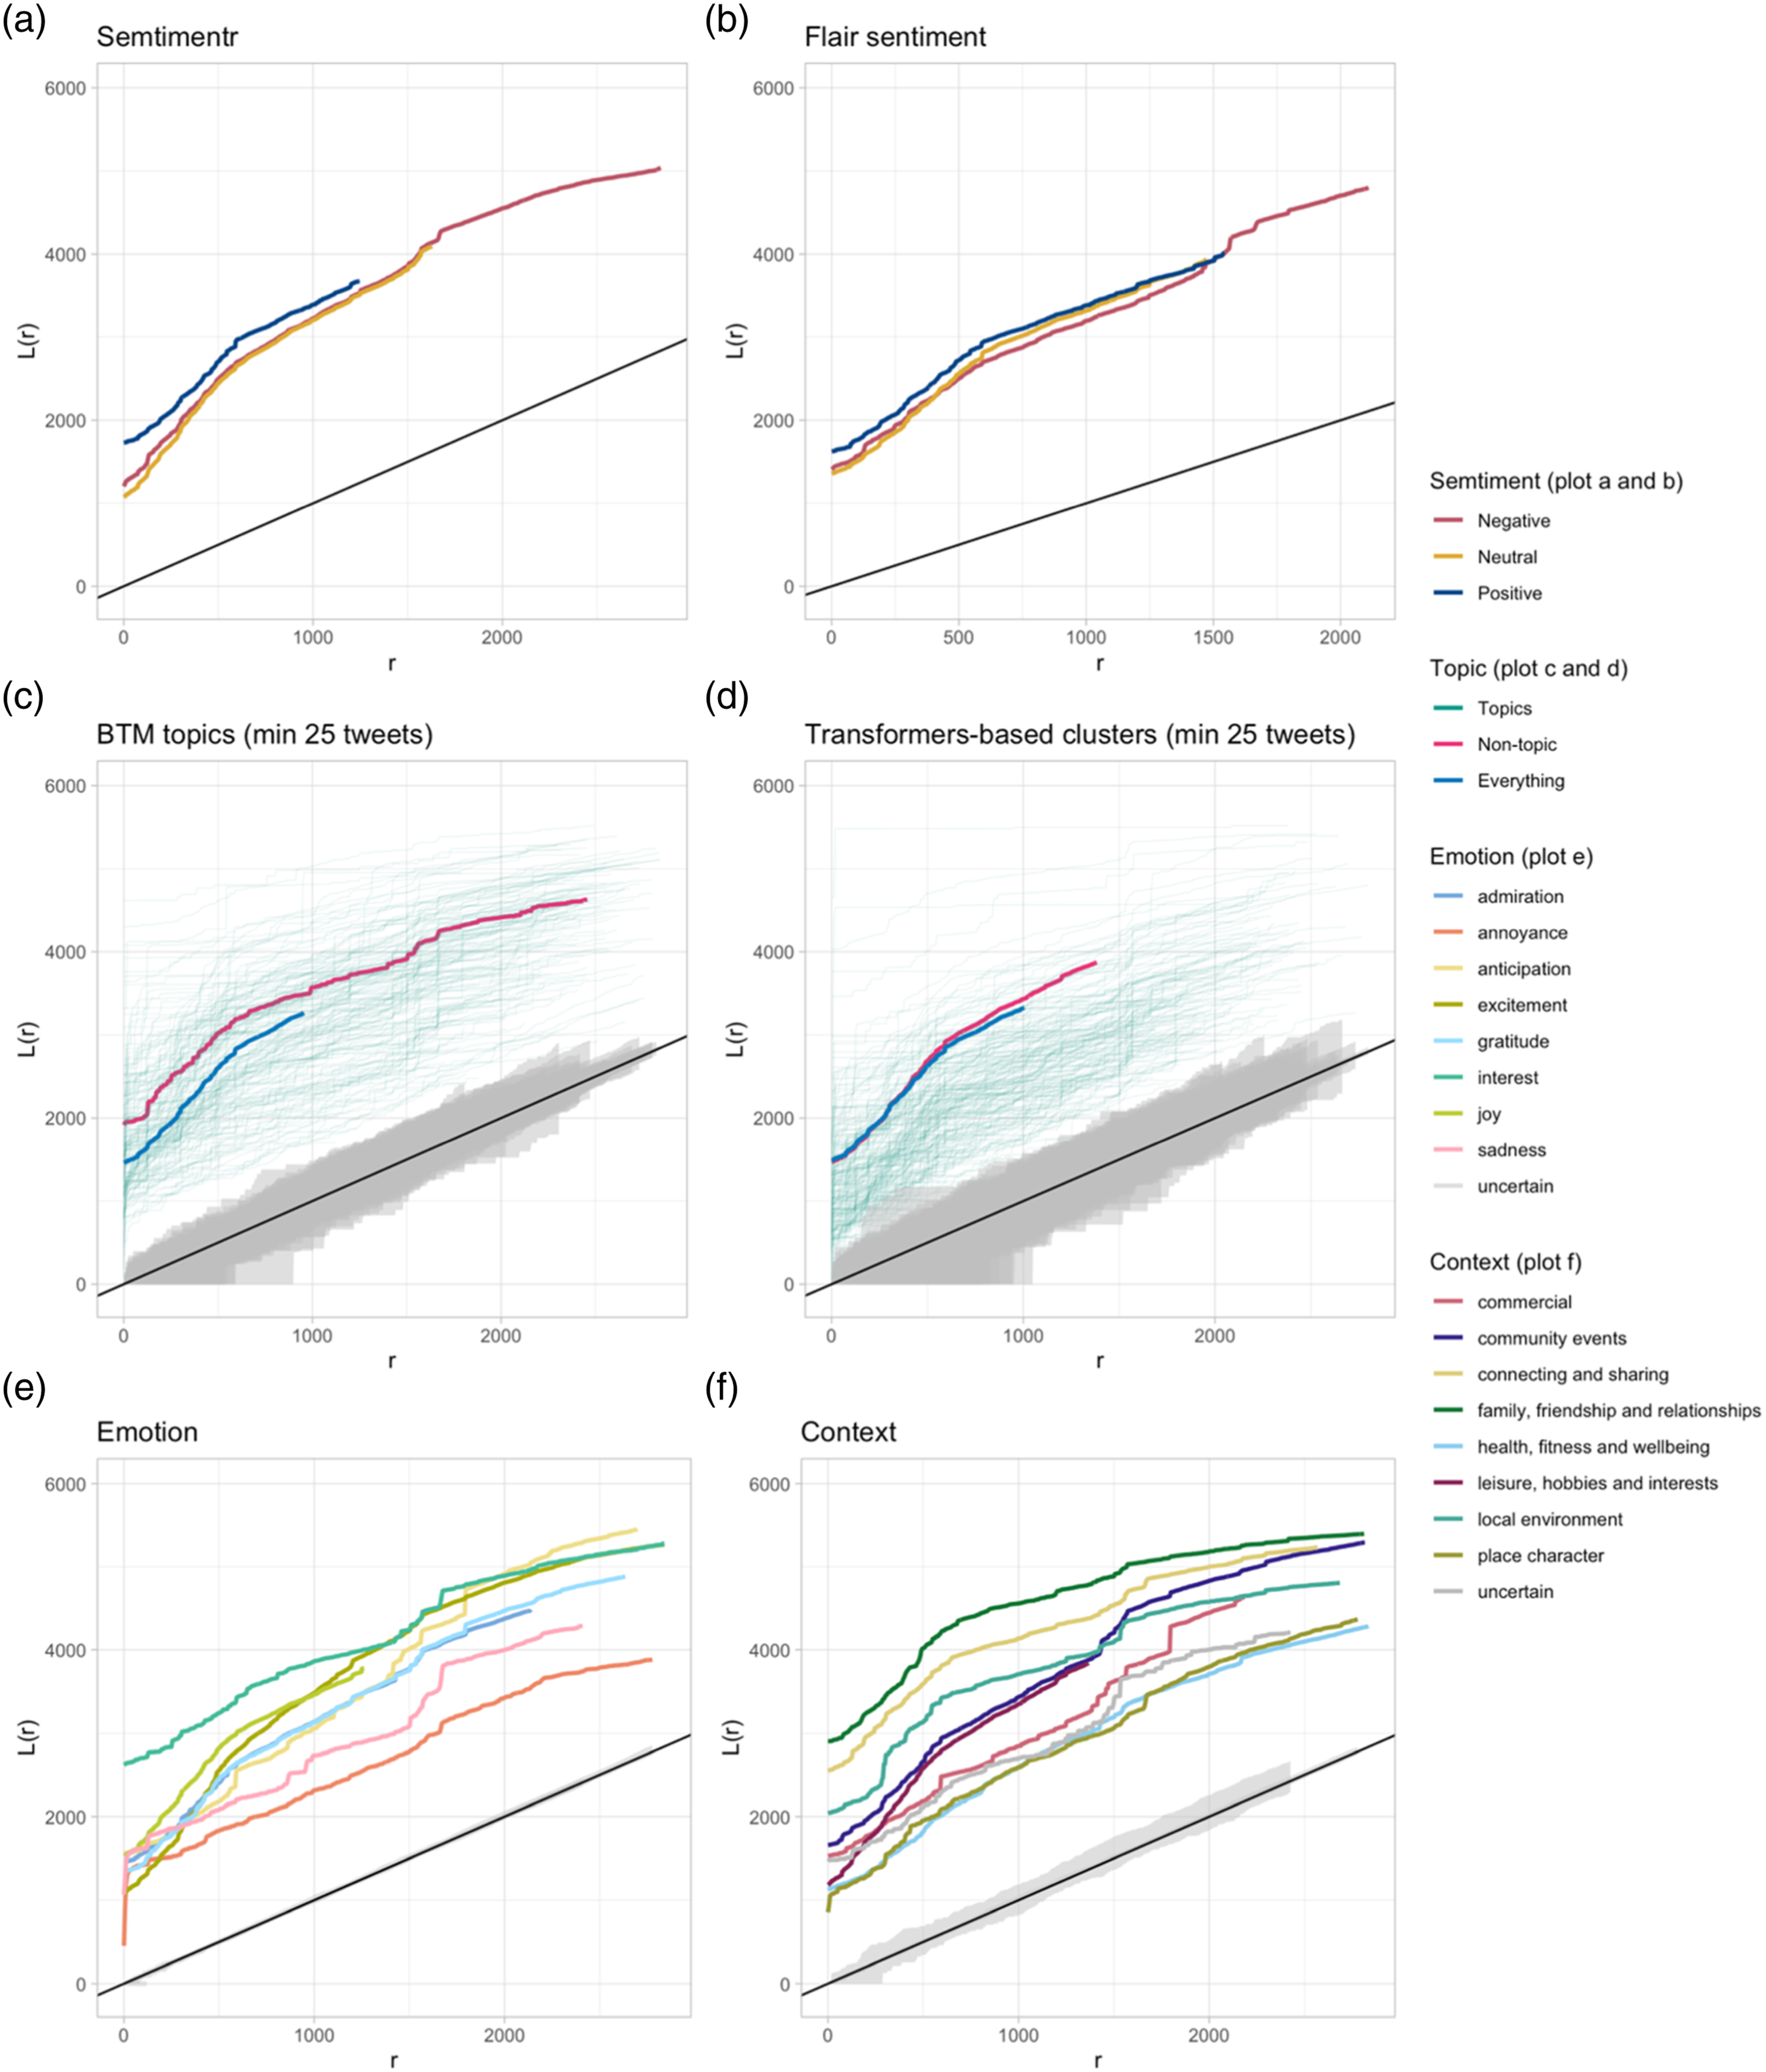
Figure 2 illustrates the results of the spatial point-patter analysis. It seems evident that most classifications are spatially clustered, falling well above the black line. That seems to be related to the very nature of the overall distribution of precisely geolocated tweets in the city, as most tweets are concentrated either in the city centre or in a few specific areas, such as parks and shopping areas.
Still, the TBC clusters (Figure 2(d)) and BTM topics (Figure 2(c)) seem to show quite different spatial distributions. Overall, the TBC clusters (Figure 2(d)) are far less spatially clustered than the BTM topics (Figure 2(c)). That might be due to the distinct nature of the two approaches. The BTM approach is based on term frequency, which might be better able to identify and encode the mention of specific places in Leicester, whereas the latter might be lost in the transformation of tweets into the 768-dimensional space produced by the document transformer used by TBC. At the same time, the label representing tweets unclustered by TBC (Figure 2(d)) seems to mostly overlap the overall tweet distribution, whereas the BTM background topic (Figure 2(c)) is much more clustered.
The two sentiment analysis approaches (Figure 2(a) and 2(b)) seem to produce very similar patterns, with more positive tweets being slightly more clustered than the negative and neutral ones. The result is confirmed by the distribution of emotions (Figure 2(e)), which shows more positive emotions, such as joy and excitement, as more spatially clustered than sadness and annoyance.
Interestingly, the two most spatially clustered contexts (Figure 2(f)) are related to the family, friendship and relationships label and the connecting and sharing label, which seem much further concentrated to areas dedicated to shopping, cafe and restaurants, while contexts such as health, fitness and wellbeing are more evenly distributed throughout the city.
It is, however, important to maintain a certain level of scepticism about the overall quality of the results, even when using multiple tools. A good example is provided by a randomly selected tweet from the dataset. The tweet compared the low price of petrol at a station to a Christmas miracle. A human reader would see how the tweet has a positive inclination, and it is not really about Christmas. Still, due to the presence of the word Christmas, both topic models classified the tweet into a group of tweets about Christmas. Both sentiment analysis tools defined it as negative, while the emotion model scored it high for interest, joy and gratitude, and the context model identified it as being about commerce.
Discussion and conclusions
Providing a glimpse into the representation of the everyday in Leicester as it emerges from one of the most popular social media platforms, the results outlined above not only allow us to address the three research questions we outlined in the introduction but especially to provide some insights that we believe should be key to the study of both social media and the everyday in geography.
To answer our first research question (RQ1), a reflection our results drove us towards a negative answer regarding whether social media are an adequate data source to study the everyday. Crucially, if the everyday is constructed in contrast to the grand narratives and the discussion of big events, a question should be raised about whether any post on social media is not per se an attempt to make any of the subject matter into an event, and thus beyond the scope of the very nature of this enquiry. At the same time, tweets are embroiled in the everyday, posted whilst waiting, at leisure, work or journeying around. They sometimes coil around and express experiences and activities as people go about the rhythms and routines of daily life.
To answer our second and third research questions (RQ2 and RQ3), we showcased how current topic modelling approaches can provide some insight to everyday geographies if used jointly. In fact, we argue that the conclusions articulated by Camacho et al. (2021) regarding the importance of using multiple methods to analyse the data need to be broadened beyond sentiment analysis. The six approaches described above provide a generally coherent picture, and they broadly align with one another, but not always. Those multiple lenses on the same content allow us to identify both areas of certainty and uncertainty. They allow us to increase our confidence in the data points on which all classifications agree, but they also allow room for those hard cases where different tools might propose different categories. However, one of the biggest challenges for quantitative approaches to the everyday is the lack of a formal definition regarding what constitutes the everyday. In fact, it has been argued that the everyday ceases to exist at the point of definition because its significance lies in its perceived insignificance. This lack of definition presents us with lots of challenges, especially around the point at which clustering shifts from being everyday to eventful. We really struggled around the ‘left over’ in terms of what was everyday and more than everyday. Both the group of tweets left unclustered by our implementation of the BERTopic approach and the BTM background topic, as well as their intersection, do not constitute a fully adequate set of what could be defined as everyday content. As such, we can’t provide a satisfactory answer to our third research question (RQ3) regarding the spatial characteristics of everyday content. The lack of definition regarding the everyday opened up interesting opportunities regarding the potential of quantitative approaches for research on the everyday, supported by a dataset self-generated by (but limited to) Twitter users regarding their activities and experiences of Leicester, while the research agenda was not underpinned by any definition of the everyday, and neither was the dataset.
Overall, our results illustrate how the potential and limitations of applying current NLP approaches to the study of everyday geographies relate to the potential and limitations of both our tools and concepts (or ‘notions’). A second challenge is that natural language processing is still highly complex despite advances by large language models. Many uncertainties surround these models’ inner workings and biases, which should be considered. Still, the very nature of these models, which rely on meaning emerging from the relationship between a word and its context rather than pre-defined connotations, aligns with a social science agenda of the research and the lack of definition shaping the everyday. What emerged from those tools sometimes surprised us, shaping a sense of the everyday unsupervised by us. It means that the quantitative work presented here begins to visualise a sense of what the everyday involves in multicultural Leicester for Twitter users, over a two-year period, in the aftermath of the EU referendum and Brexit. The combination of document transformers and UMAP dimensionality reduction provides a powerful visual analytics tool that allowed us to explore what constitutes the everyday, to try to quantify and explore the undefined. The ability to populate the dots with colours encoding the estimated topics, sentiment, emotions and context further enhanced the affordances of the visualisation. The use of HDBSCAN proved particularly effective in separating clusters of meaning from solitary comments. This ensemble of approaches allowed us to visualise the complexities and uncertainties that surround the everyday, reinforcing the notion of an elusive concept, to be explored but not pinned down.
To conclude, we encourage the reader to revisit the figures presented in this paper. To what extent are we beginning to visualise and quantify what is tricky to qualify – the combination of voices, concerns and emotions that shape a sense of the everyday underpinning place experience – in all its clustering and colour? The present work illustrates how a quantitative approach based on large language models and visual analytics might hold the seeds for a better understanding of the everyday, which is of public and policy significance for how places are lived and experienced as part of everyday lives. Moreover, we showcased how large language models now encapsulate in a few gigabytes the analytical capabilities that until recently were the realm of tech giants and which can now instead provide comparable functionalities on a consumer-level computer. As such, large language models hold the potential to democratise complex, interactive, visual exploratory analysis of content which has so far primarily been explored manually, such as interviews and oral history archives. In our future work, we aim to foster both the GIScience and human geography research agendas by focussing on the critical understanding and application of large language models in human geography.
Supplemental Material
Supplemental Material - Towards a study of everyday geographic information: Bringing the everyday into view
Supplemental Material Towards a study of everyday geographic information: Bringing the everyday into view by Stefano De Sabbata, KatyBennett, Zoe Gardner in Environment and Planning B: Urban Analytics and City Science
Footnotes
Acknowledgements
The authors would like to acknowledge the contribution of all those who have created content on Twitter that was used in this research and to thank Twitter for making that data available for research purposes. This research used the ALICE High Performance Computing Facility at the University of Leicester.
Declaration of conflicting interests
The author(s) declared no potential conflicts of interest with respect to the research, authorship, and/or publication of this article.
Funding
The author(s) disclosed receipt of the following financial support for the research, authorship, and/or publication of this article: This research is funded by the Leverhulme Trust Research Project Grant [RPG-2019-052] ‘Mapping Multiculture: Disrupting representations of an ethnically diverse city’.
Supplemental Material
Supplemental material for this article is available online.
Data availability statement
The data collected through the official Twitter Developer API are unavailable to readers. The code, logs and outputs that support the findings of this study are available under Creative Commons Attribution 4.0 International (CC BY 4.0) licence at https://doi.org/10.25392/leicester.data.22215559.
Notes
References
Supplementary Material
Please find the following supplemental material available below.
For Open Access articles published under a Creative Commons License, all supplemental material carries the same license as the article it is associated with.
For non-Open Access articles published, all supplemental material carries a non-exclusive license, and permission requests for re-use of supplemental material or any part of supplemental material shall be sent directly to the copyright owner as specified in the copyright notice associated with the article.