
Abstract
Comprehending urban form and function is crucial for effective urban planning and redevelopment. However, delineating urban functional zones and understanding the diverse activities within a city poses challenges. To address this, our study proposes a comprehensive analysis framework utilising point-of-interest (POI) data to identify and characterise urban functional zones and associated amenities. Leveraging geocoded user-generated content enables an effective capture of the spatial structure of human activities. We applied our framework in case studies in two Singapore locations, demonstrating its effectiveness in identifying urban functional zone shapes and examining associated amenities. The findings reveal a spatial configuration of amenities across the urban area, highlighting a diversity often differing from planned land-uses. This underscores the complex and non-uniform nature of the urban living experience, as observed variations in mixed uses challenge the homogeneity of intended land-use types. Our study and analysis framework provide a foundation for further investigations, including exploring travel behaviour patterns and assessing the vibrancy and vitality of urban areas.
Introduction
Urban space is complex (Batty, 2013; Gallotti et al., 2021; Zhong et al., 2014). From the urban planner’s view, each land parcel of a city can be assigned a specific land-use. From the residents’ view, the urban space is composed of various types of amenities (Niu and Silva, 2021). A modern city is usually planned with the mixed development concept – to design a compact place where people can get access to most of their daily needs within a short travelling distance (Carlton, 2009; Shen and Wu, 2020). Thus, it would be difficult to categorise an urban space into a specific functional type from the experience of living in the space. For example, a square can contain a garden (leisure), some cafés (food and beverage, F&B), a sitting area (social gathering), and is located between a train station (transportation), a shopping mall (commercial), and a library (education and public services). These amenities give the space – the square – a series of functions and a mixed user experience for people. These situations indicate that the ‘function’ of an urban space is usually composed of mixed amenities (Niu and Silva, 2021). Indeed, some amenities tend to be co-located (Hidalgo et al., 2020; Gao et al., 2017). While urban space and amenities play a key role in shaping the identity of an urban area (Ye et al., 2021), the mixed nature of urban spaces makes it challenging to identify and delineate the ‘urban functional zones’ (Bettencourt and West, 2010; Batty, 2013).
Urban functional zones are subsections of an urban area that provide a specific service or a set of services (Niu and Silva, 2021; Zhong et al., 2014). The understanding of urban functional zones can be split into two parts: urban form and urban activity (Živkovic, 2019). The analysis of urban form focuses on the physical space and structure of the urban environment, such as buildings, streets (Lynch and Rodwin, 1958; Kropf, 2009) – the physical environment that provide space for establishing amenities. Various amenities located within the urban space provide different services and functions. The existence of these services and functions at a location enables specific urban activities (Jiang et al., 2015). Thus, analysing the spatial distribution of amenities is an effective way to reveal the spatial structure of urban functional zones (Hu et al., 2021; Hong and Yao, 2019).
As a long-standing challenge in urban studies, delineating urban functional zones is essential in the planning of an urban area (Hong and Yao, 2019; Zhong et al., 2014). To identify zones in a city, previous studies used data from user-generated sources to identify the daily activity space of people. Examples of data sources include location-based check-ins (Gao et al., 2017), mobile phone records (Gao et al., 2013), migration records (Hemmasi, 1980), smart-card data (Zhong et al., 2014), and bike-sharing trips (Niu and Jin, 2021). These studies analysed the routine and regularity of human movement between spaces, that is, where they usually go, and how the spatial units are connected by the frequent visits of some common strangers (Zhang et al., 2022). In urban geography literature, this type of spatial region is also defined as a ‘functional region’ – an area that covers both the supply of a service and the location where the demand is (Klapka et al., 2013). Other studies have made use of static data to identify the location of amenities. For instance, points-of-interest (POI) data (Gao et al., 2017), crowdsourced mapping data (Jiang et al., 2015), and satellite images (Chen et al., 2020) have been used to understand how a city can be split into different zones or ‘formal regions’ that provide specific sets of services. A formal region describes an area that has a consistent cultural or physical attribute and which properties are uniform within the zone.
Among previous studies on the delineation of urban functional zones, three types of data were frequently discussed: (1) POI datasets that capture different types of human activities, (2) remote satellite images that shows the land-use and land-cover of the urban surface, and (3) spatial interaction networks within an urban area that represent the strength of social interactions. Based on Open Street Map data, Hong and Yao (2019); Wang et al. (2021) analysed the urban functional zones for each road blocks from POI data. Gao et al. (2017); Calafiore et al. (2021) integrated POI data and location-based social media data to analyse the context of human activities at different places within a city and delineate urban functional zones. Satellite images were used to analyse land-use/land-cover for identifying urban-rural structure. To further understand the detail functions and activities of each area, previous studies had fused several types of datasets, including POI data and social media data with the satellite images (Zhang et al., 2019; Niu and Jin, 2021; Yang et al., 2022). The human movement pattern within a city is also frequently used to identify neighbourhoods of strong internal flows, then the major functions of the places were identified using some semantic or topic modelling techniques (Wei and Wang, 2021; Zhang et al., 2022; Hu et al., 2021). Previous studies focused on recognising the urban function of areas with preset boundaries, including administrative areas (Wang et al., 2023), street blocks (Wang et al., 2021), and neighbourhoods (Hong and Yao, 2019). Urban functional zones can take any shape, regardless of urban planning or administrative boundaries. For example, Orchard Road in Singapore, Queen’s Road in Hong Kong, Ximending in Taipei City, and Akihabara Electric Town in Tokyo developed along roads and intersections, with density decreasing with distance. This raises the question of ‘where to draw boundaries for these zones’, and highlights the importance of identifying their types and shapes directly from the amenities and their mix (Hidalgo et al., 2020). Recent studies have emphasised the level of mix in urban functional zones, with some zones identified as mixed-use and others as single-use (Wang et al., 2021; Wei and Wang, 2021). This stresses the need to retrieve zone functions from actual data extracted from human activities, such as POI and social media data, rather than relying on urban planning data, which often does not capture the detailed spatial variations within the same type of planning zone.
In dense cities, the urban landscape tends to offer a diversity of functions – a mixed use development (Schröpfer, 2020; Carlton, 2009). This increases the difficulty of delineating urban functional zones as the spatial configuration is complex with a mixed composition of functions. Singapore is a high-density and high-diversity country. Previous studies had used remote sensing (Sidhu et al., 2018) and household surveys (Zhong et al., 2014) to understand the land-use/land-cover and urban structure in Singapore. Singapore’s limited land area forces a mixed and diverse spatial structure of urban functions, making planning and management difficult and complex. Most areas in Singapore contain multiple functions, while land use is typically assigned to a single category. From a planning perspective, assigning land use type in small spatial units is not useful for urban management and development. However, assessing the spatial structure of urban functions is important for managing and redeveloping the city after organic urban development. Therefore, the research question becomes: how can we partition urban space into zones and identify the mix of functions that are available in each zone?
Using two study sites in Singapore as case studies, the objective of this study is to develop a novel, analytical framework to map urban functional zones using POI data and discuss the composition of amenities in each zone. As a type of user-generated content, POI data can reveal the location of various services, thus providing a way to determine the spatial distribution of amenities, which reflects the functional use of each area (Hong and Yao 2019; Gao et al., 2017). Moreover, POI data reflects the current state of amenities, which can evolve over time, making it a valuable tool for analysing the distribution of amenities and delineating the boundaries of urban functional zones. Following this approach, we can identify the major urban functions and compare it with the planned land-uses. These analyses reveal the urban structure and relationships between planned land-use and actual human activities. The empirical results of identified urban functional zones will reveal the underlying structure of a city, and since POI data is generally available from various online map services, the proposed study framework is applicable to any other city.
Study framework and study sites
Analytical framework
The study contains three parts (Figure 1): (1) data and data pre-processing, (2) spatial partitioning of urban functional zones, and (3) analysis of the urban functional zones. The analysis flowchart of this study.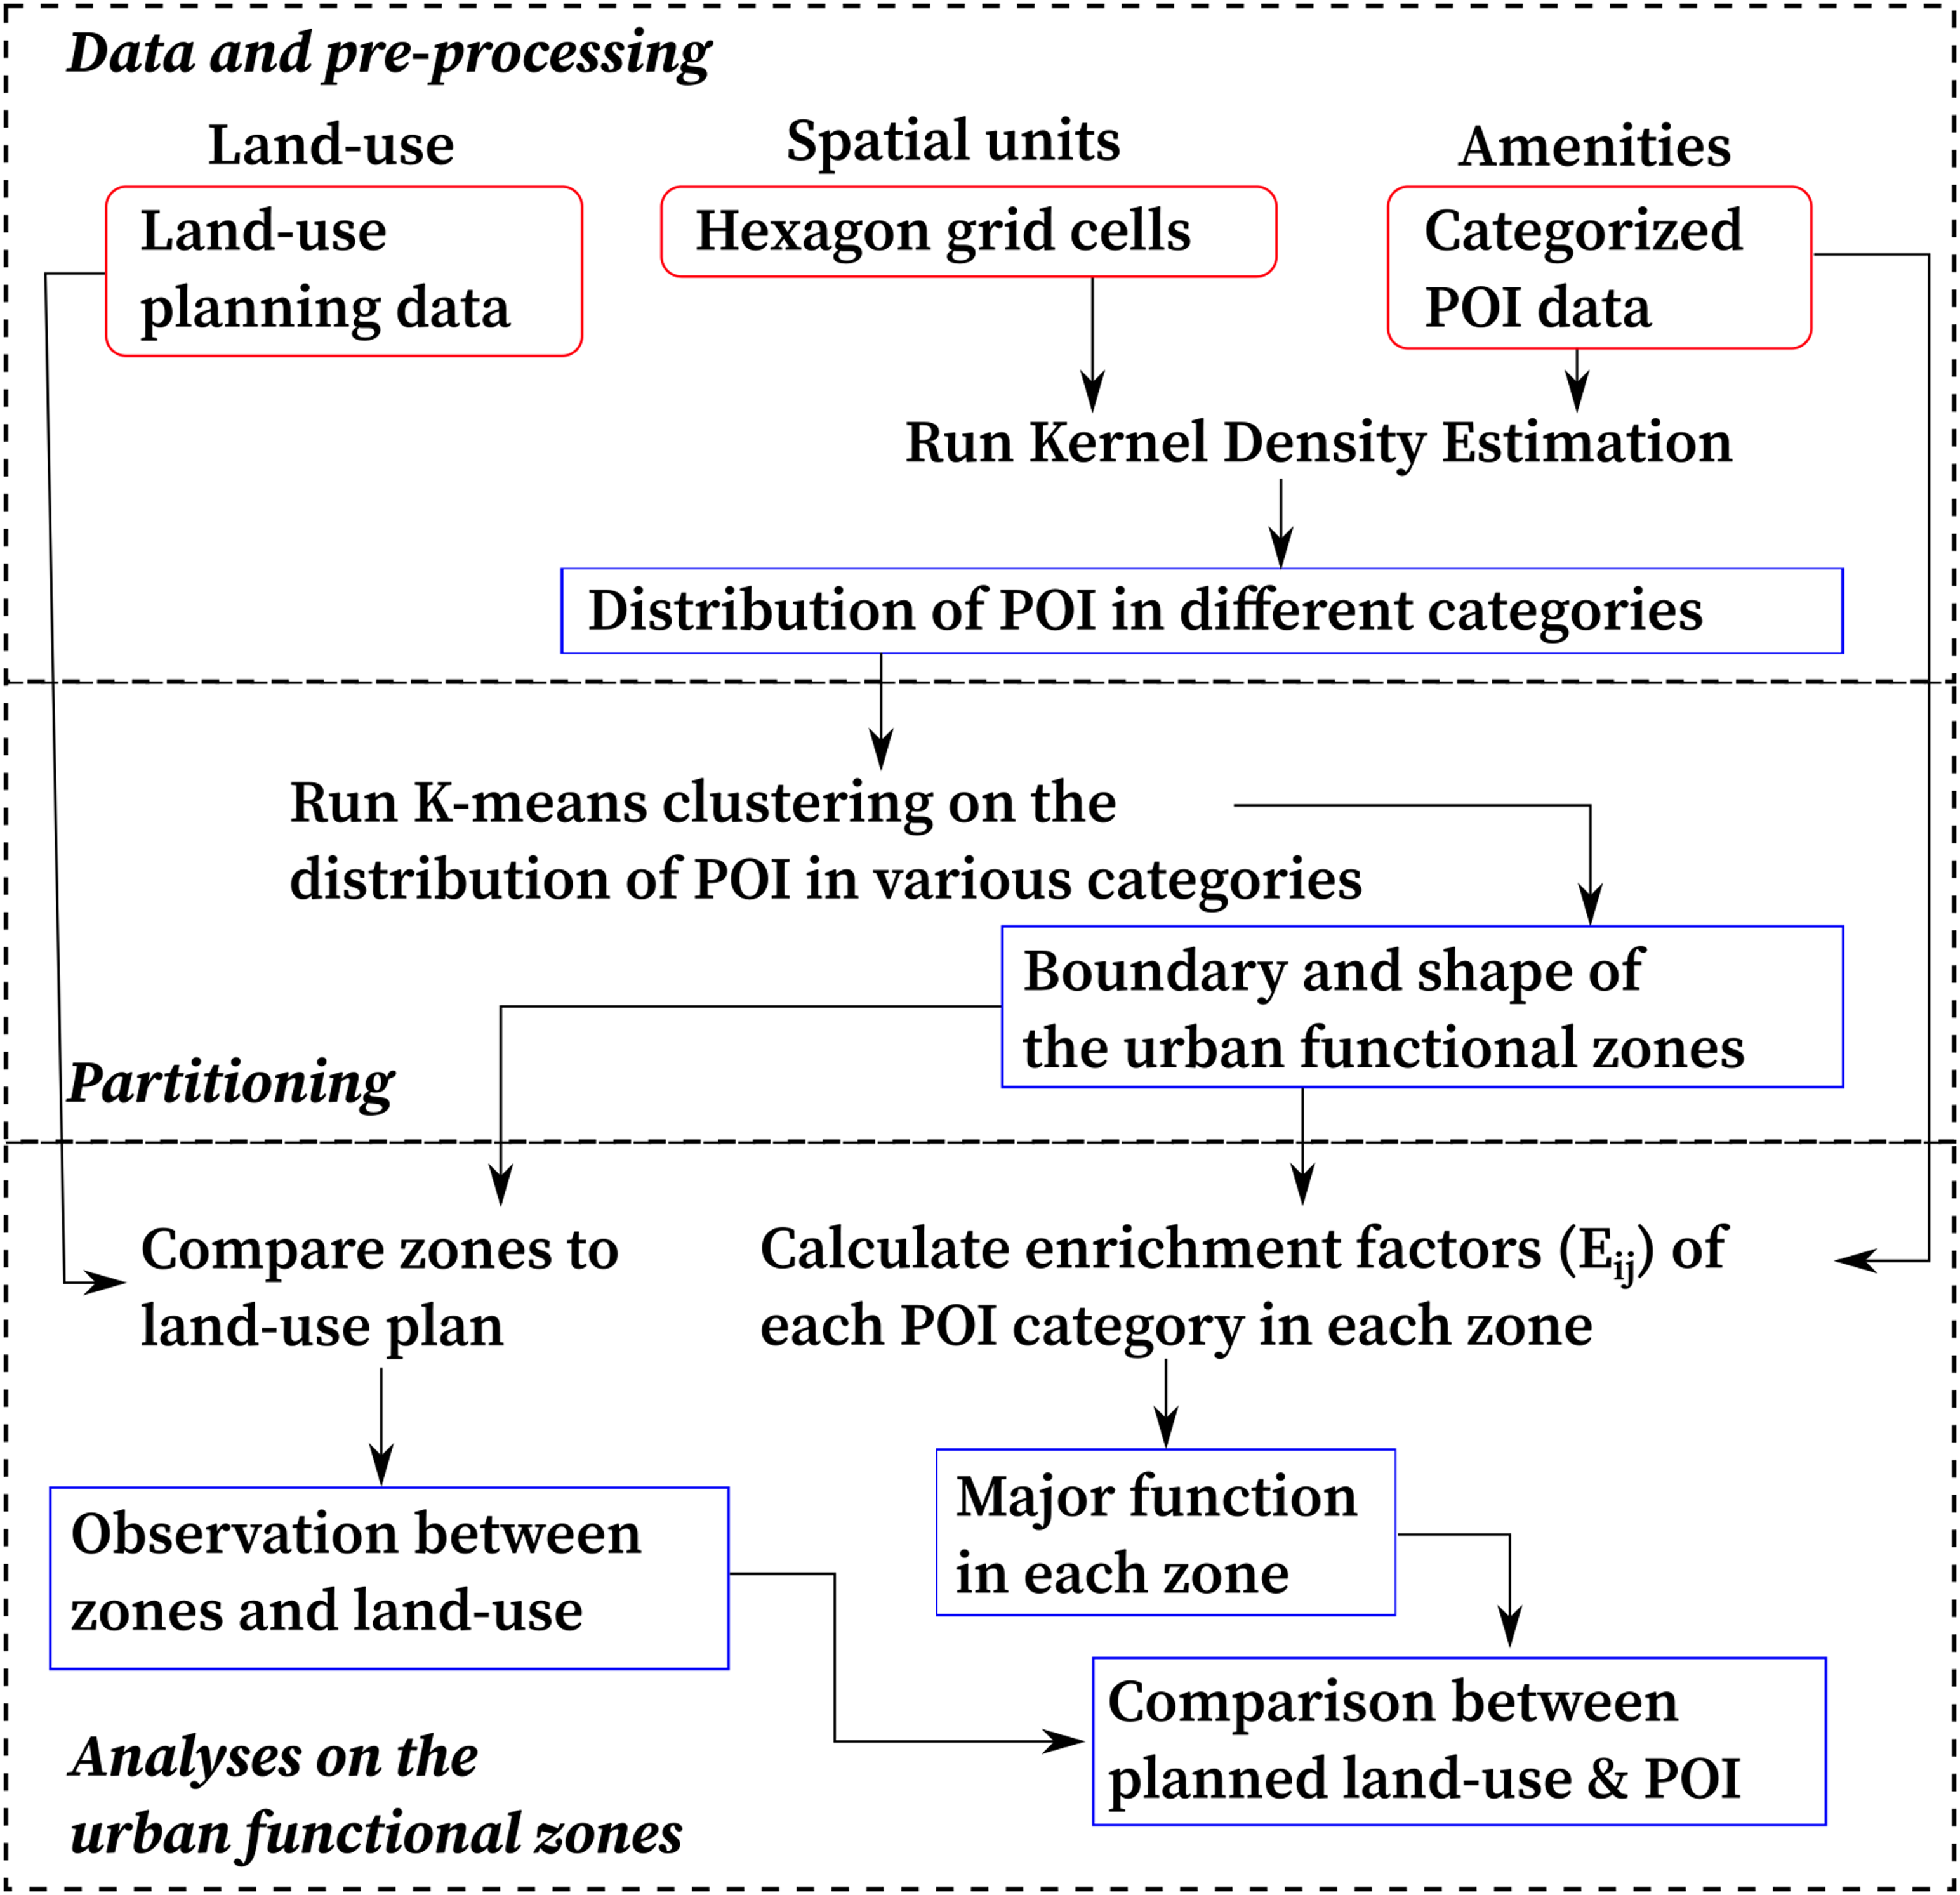
Study sites
To illustrate the universality of the framework, we chose two study sites with different area size, POI density, and development plans. Queenstown is a densely populated research hub with an area of about 21.7 km2. Punggol is a newly developed residential district with an area of 9.4 km2. In this study, land-use types are placed into 10 categories (Suppl. Figure S1): business, commercial, residential, mixed residential and commercial (mixed R&C), civic-education-medical combination (Civ./Edu./Med.), transportation, leisure-recreational combination (Lei./Rec.), waterbody, white, and other.
Queenstown is located next to the Central Region of Singapore, that is, the Central Business District (CBD) of Singapore. It is not only a satellite residential town, but also serves as an education, innovation, research, and technology development core of Singapore. Punggol is a recent development consists of residential, commercial, and business parks at the North-East Region of Singapore. As a newly planned and developed town, the street network in Punggol forms a regular lattice structure. Each rectangular block is composed mainly of high-rise residential buildings and community facilities such as schools, community clubs, restaurants, and shopping centres.
The points-of-interest dataset
In this study, POI data is used as a surrogate for the location of amenities. The POI data was downloaded in 2021 (July to August) from five map sources – two commercial online mapping platforms (Google Map and HERE Map), an open-source project (OpenStreetMap), the official map source maintained by the Singapore government (OneMap), and the licenced Street Directory data set from the Singapore Land Authority (SLA). We used as many available data sources as possible to capture the most comprehensive spatial distribution of amenities in the two study sites. These POI datasets from the five sources were conflated using a framework described in Low et al. (2021) to merge the data and remove any duplicates. The conflated data was subsequently reviewed and validated (Yeow et al., 2021).
The POI data was categorised into eight categories: business, food and beverage (F&B), commercial, education, transportation, outdoor, health, and others (Suppl Table S1–S2). A summary of the POI dataset is shown in Suppl. Table S3. Nearly half of the POIs in the conflated data were labelled as ‘premises’, ‘point-of-interest’, or ‘establishment’, which could not be categorised, so they were excluded from the analysis. It is worth noting that Queenstown has more POIs than Punggol, likely due to its larger size, more developed state, and proximity to the Central Region.
The spatial distribution of various amenities
In this study, a hexagonal grid with 50 m spacing was generated and each cell was used as the spatial unit. Because POI data consists of groups of point locations scattered across the study sites (Supp. Figure S2(c)), the actual location of POI and its relative location (aggregate by cells) may not be useful in presenting the spatial pattern. To uncover the spatial distribution of the different categories POI, the Kernel Density Estimation (KDE) model was used (Kloog et al., 2009; Adolphson, 2010). Each amenity point has an accessible area that could be captured by an accessible distance parameter. The calculation of KDE (Scikit-Learn, v0.22.1) estimates the density of a specific group of points for each spatial unit (hexagon cell). In the KDE calculation, each spatial unit is used to search and measure the distance from the cell centre to the POIs. The weight for each point for the spatial unit was calculated using the distance and a kernel function. A bandwidth parameter is set to determine the shape of the kernel function, which indicates a decreasing trend from the centre of the bell shape to outward area. If a point is nearer to the centre of the kernel, the weight is higher. The density of the cell is calculated based on the weights of the points. In the resulting KDE map, the more points of a specific POI are closer to a cell, the higher the density, which indicated that the higher the accessibility (Supp. Figure S2(b)). We use the KDE of a specific type of amenity to represent the spatial accessibility to that amenity (Adolphson, 2010).
The bandwidth parameter was set to be 200 m, and the Gaussian function was used as the kernel function. 400 m is considered as a walkable distance (Hou et al., 2020). Here we used half of the walkable distance as the bandwidth to determine the shape of the Gaussian kernel function, which indicated that the POIs within 200 m would get a relatively high weight, and the weights decrease with a steep slope beyond 200 m. In other words, the POIs within 200 m can be considered as accessible; the accessibility beyond 200 m decreased quickly with distance (Suppl. Figure S3–(s)4 and Table S4).
Partitioning the study sites into functional zones using POI data
Clustering analysis process
For each hexagon cell in the study area, density values were calculated for each of the seven POI categories. For each of the two study sites, the clustering analysis was done on the hexagon cells using the seven density values as vectors. While the seven POI categories indicate different types of human activities, the clustering analysis can capture how these amenities and human activities are mixed and distributed across space. The resulting clusters indicate that cells in the same cluster would have similar amenity density mix – they serve a similar urban function within the study site. For example, a shopping mall may have a high density of commercial and F&B points and a low density of outdoor and transportation facilities. The identification of clusters based on amenity density could reveal the composition of amenities and boundaries of these spatial clusters. These spatial clusters represent the urban functional zones in this study. The clustering analysis is performed separately for each study site. This is because the two independent sites were designed with different objectives, thus, the composition of amenities can have a different patterns.
The process of KDE calculation has considered the spatial neighbouring structure, that is, cells within a proximity range would find a similar set of neighbouring POIs and have similar distances to those points; thus, the density has a smoothing effect for neighbouring cells (Lum, 2008). Therefore, the spatial continuity can be neglected in the clustering analysis process. The spatial units in the same cluster would be adjacent to each other and not be isolated because of the smoothing effect from the KDE process. In addition, it is possible for places in different parts of the study site to serve the same urban function. These places would be shown as separated groups of hexagon cells belonging to the same cluster – multipart polygons.
In this study, the k-means clustering approach (Scikit-Learn, v0.22.1) is used to identify the urban functional zones (Gao et al., 2017). The k-means clustering can be used to identify clusters of data points (hexagon cells) with multiple vectors (the seven density values) using an iterative process. The number of clusters/zones (k) was decided based on a pretest using the elbow method (Suppl. Figure S5), and set to seven and five for Queenstown and Punggol, respectively. In the pretest, the changes of the k parameter from low to high presented a hierarchical structure that the added zones tend to split from the previous zones. In other words, the shapes of zones were similar between different k.
The boundary of urban functional zones
Seven and five functional zones were identified for the two study sites (Figure 2). The zones were sorted by POI density, which differed across the sites since the clustering analysis was performed separately. Table 1 summarises the identified functional zones, including their area size, number of POIs, and number of parts. The spatial continuity feature was not considered in the k-means clustering process, so separated areas could have similar spatial compositions of amenities (the same function). The ‘No. Parts’ column counts the number of separated parts belonging to the same urban functional zone. The last few zones in Table 1 had a larger area size or more separated parts, indicating that they served as buffer zones between the core regions and were thus scattered throughout the study sites. In contrast, the first few zones had a smaller number of parts, indicating that their function was usually unique within the study site and occupied a smaller portion of the area. The number of POI in each zone was shown in Suppl Table S5–S6. The spatial distribution of urban functional zones in (a) Queenstown, and (b) Punggol. The amenity compositions of the zones in the two sites are different. A summary of the sizes of the 12 zones (sorted by POI density) in the two sites: area size (of hexagons cells proximate to at least one POI, in km2), the number of individual parts, and density (total number of POI/km2) for each zone.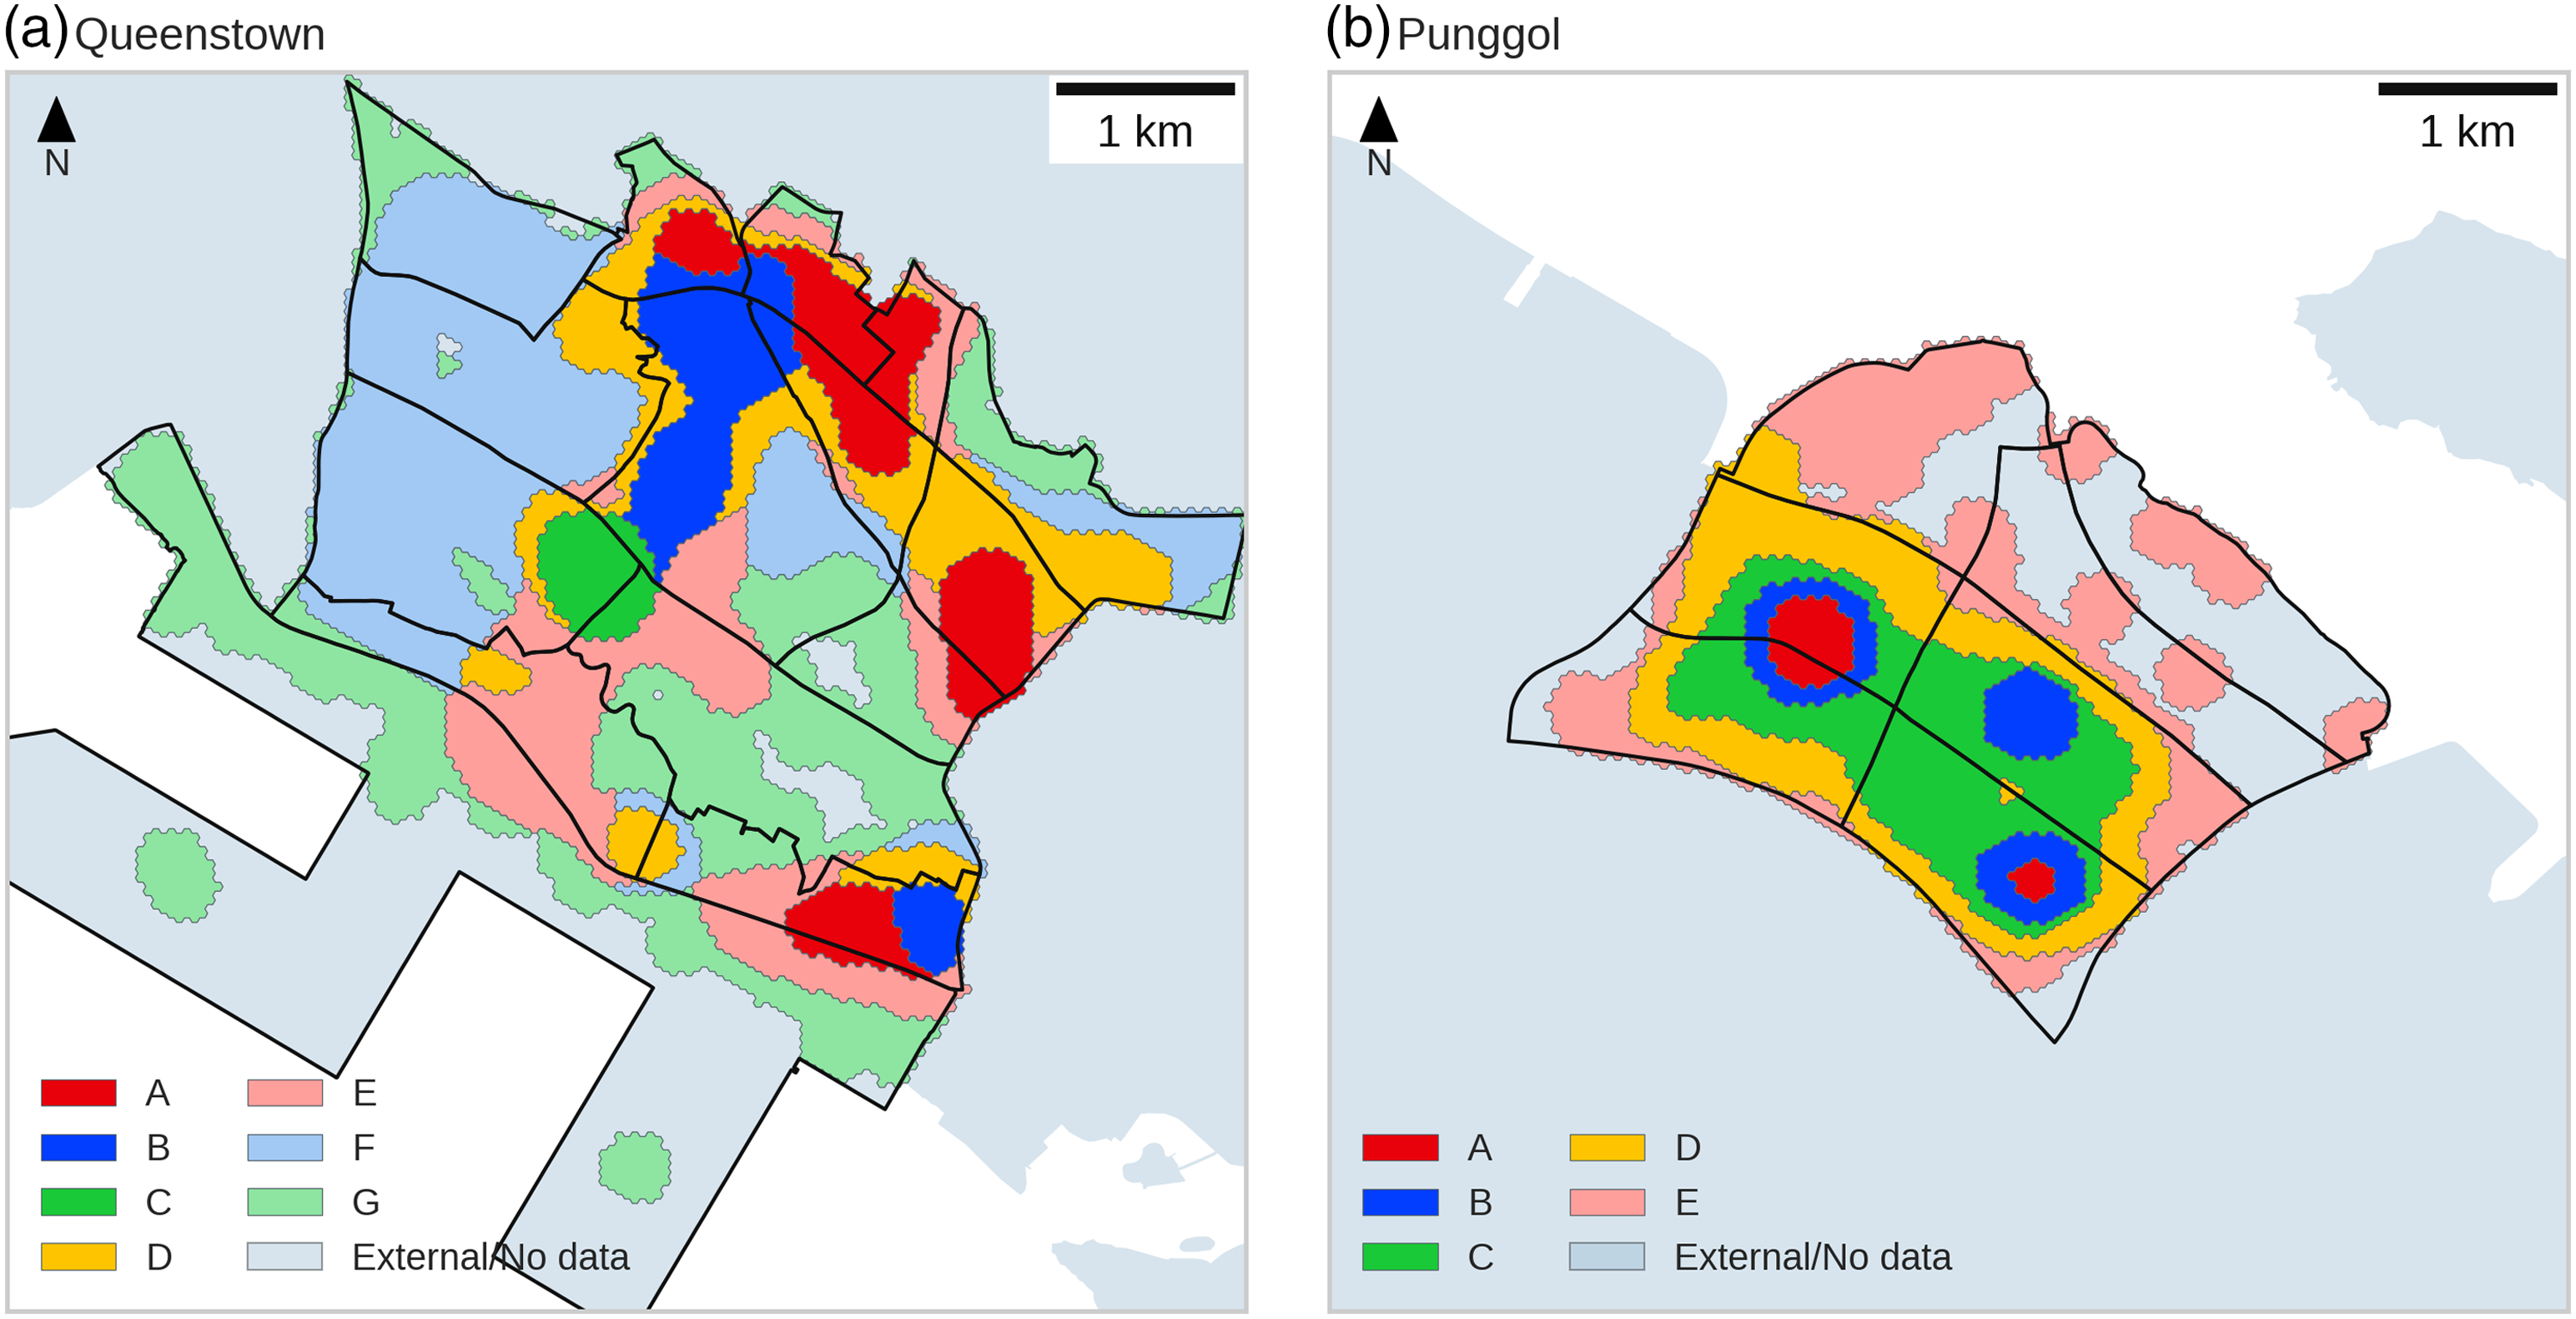
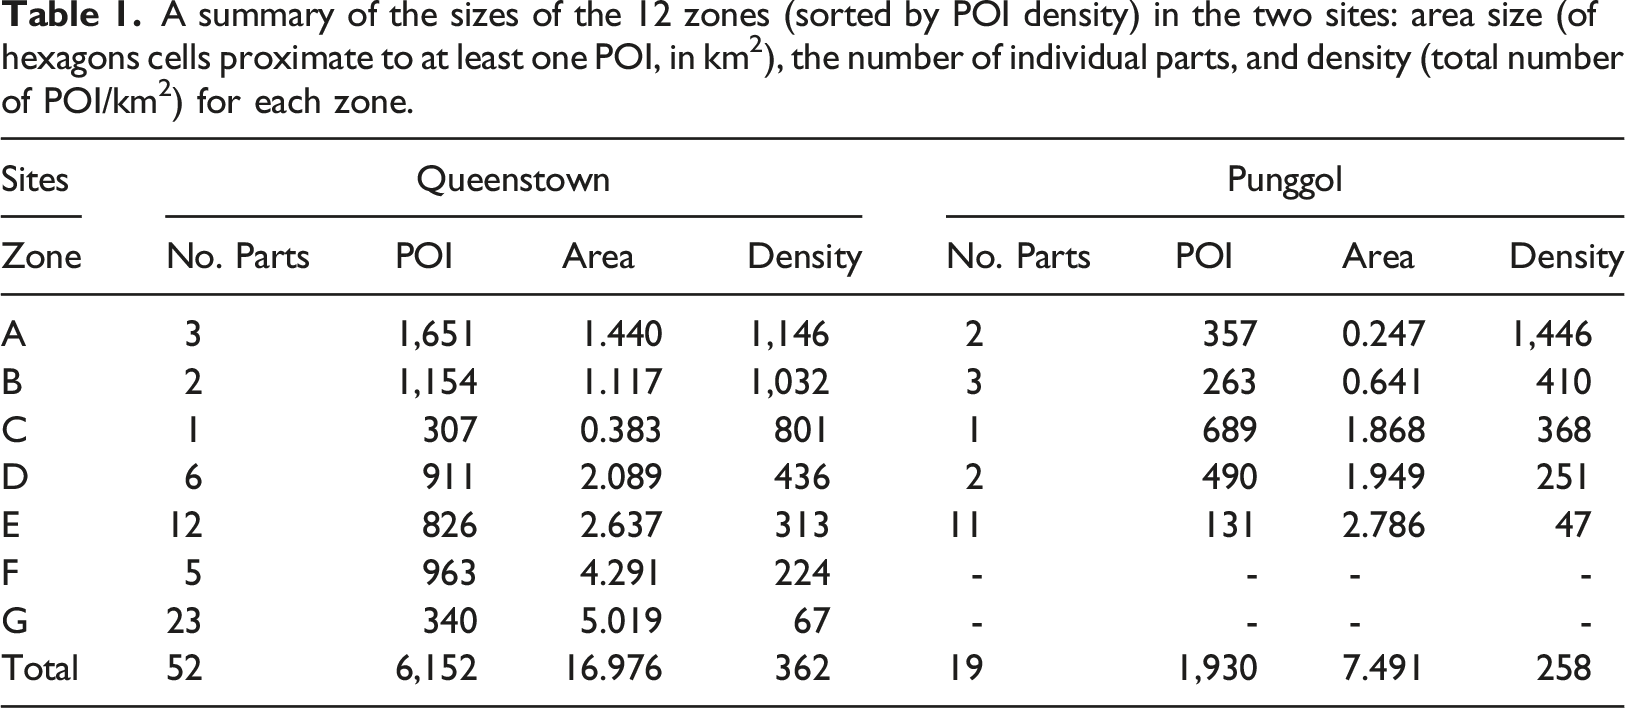
Figure 2 shows the spatial distribution of the clustering zones. Despite the differences in the composition, the results showed that the functional zones could capture the spatial patterns of the urban structure. Some core regions with more intense concentration of amenities could be observed. Some peripheral regions or buffer zones that filled up the spaces between core regions were also revealed. For instance, in Queenstown (Figure 2(a)), there were three core regions: (1) the eastern region that contained Zone-A, (2) the northern area that emerged as Zone-A and -B, and (3) the centre of the map that was mainly Zone-C and which connected to the second core through Zone-B. The eastern side of the third core (Zone-C) was composed of Zone-E and -G, and the western side was composed of Zone F – these places had lower densities.
Analysing the functional zones in the two study sites
The major functions of the zones
Enrichment factor (Verburg et al., 2004) is used as an indicator of the main types of amenities within each urban functional zone. Enrichment factor was used in previous studies to identify the main types of POIs that play significant roles within a region (Chen et al., 2017; Niu and Silva, 2021). The calculation for the enrichment of j POIs at zone i is shown in equation (1) The enrichment factor (E
ij
) matrix for the POI types in each zone for the two sites.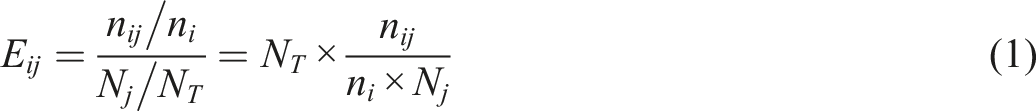
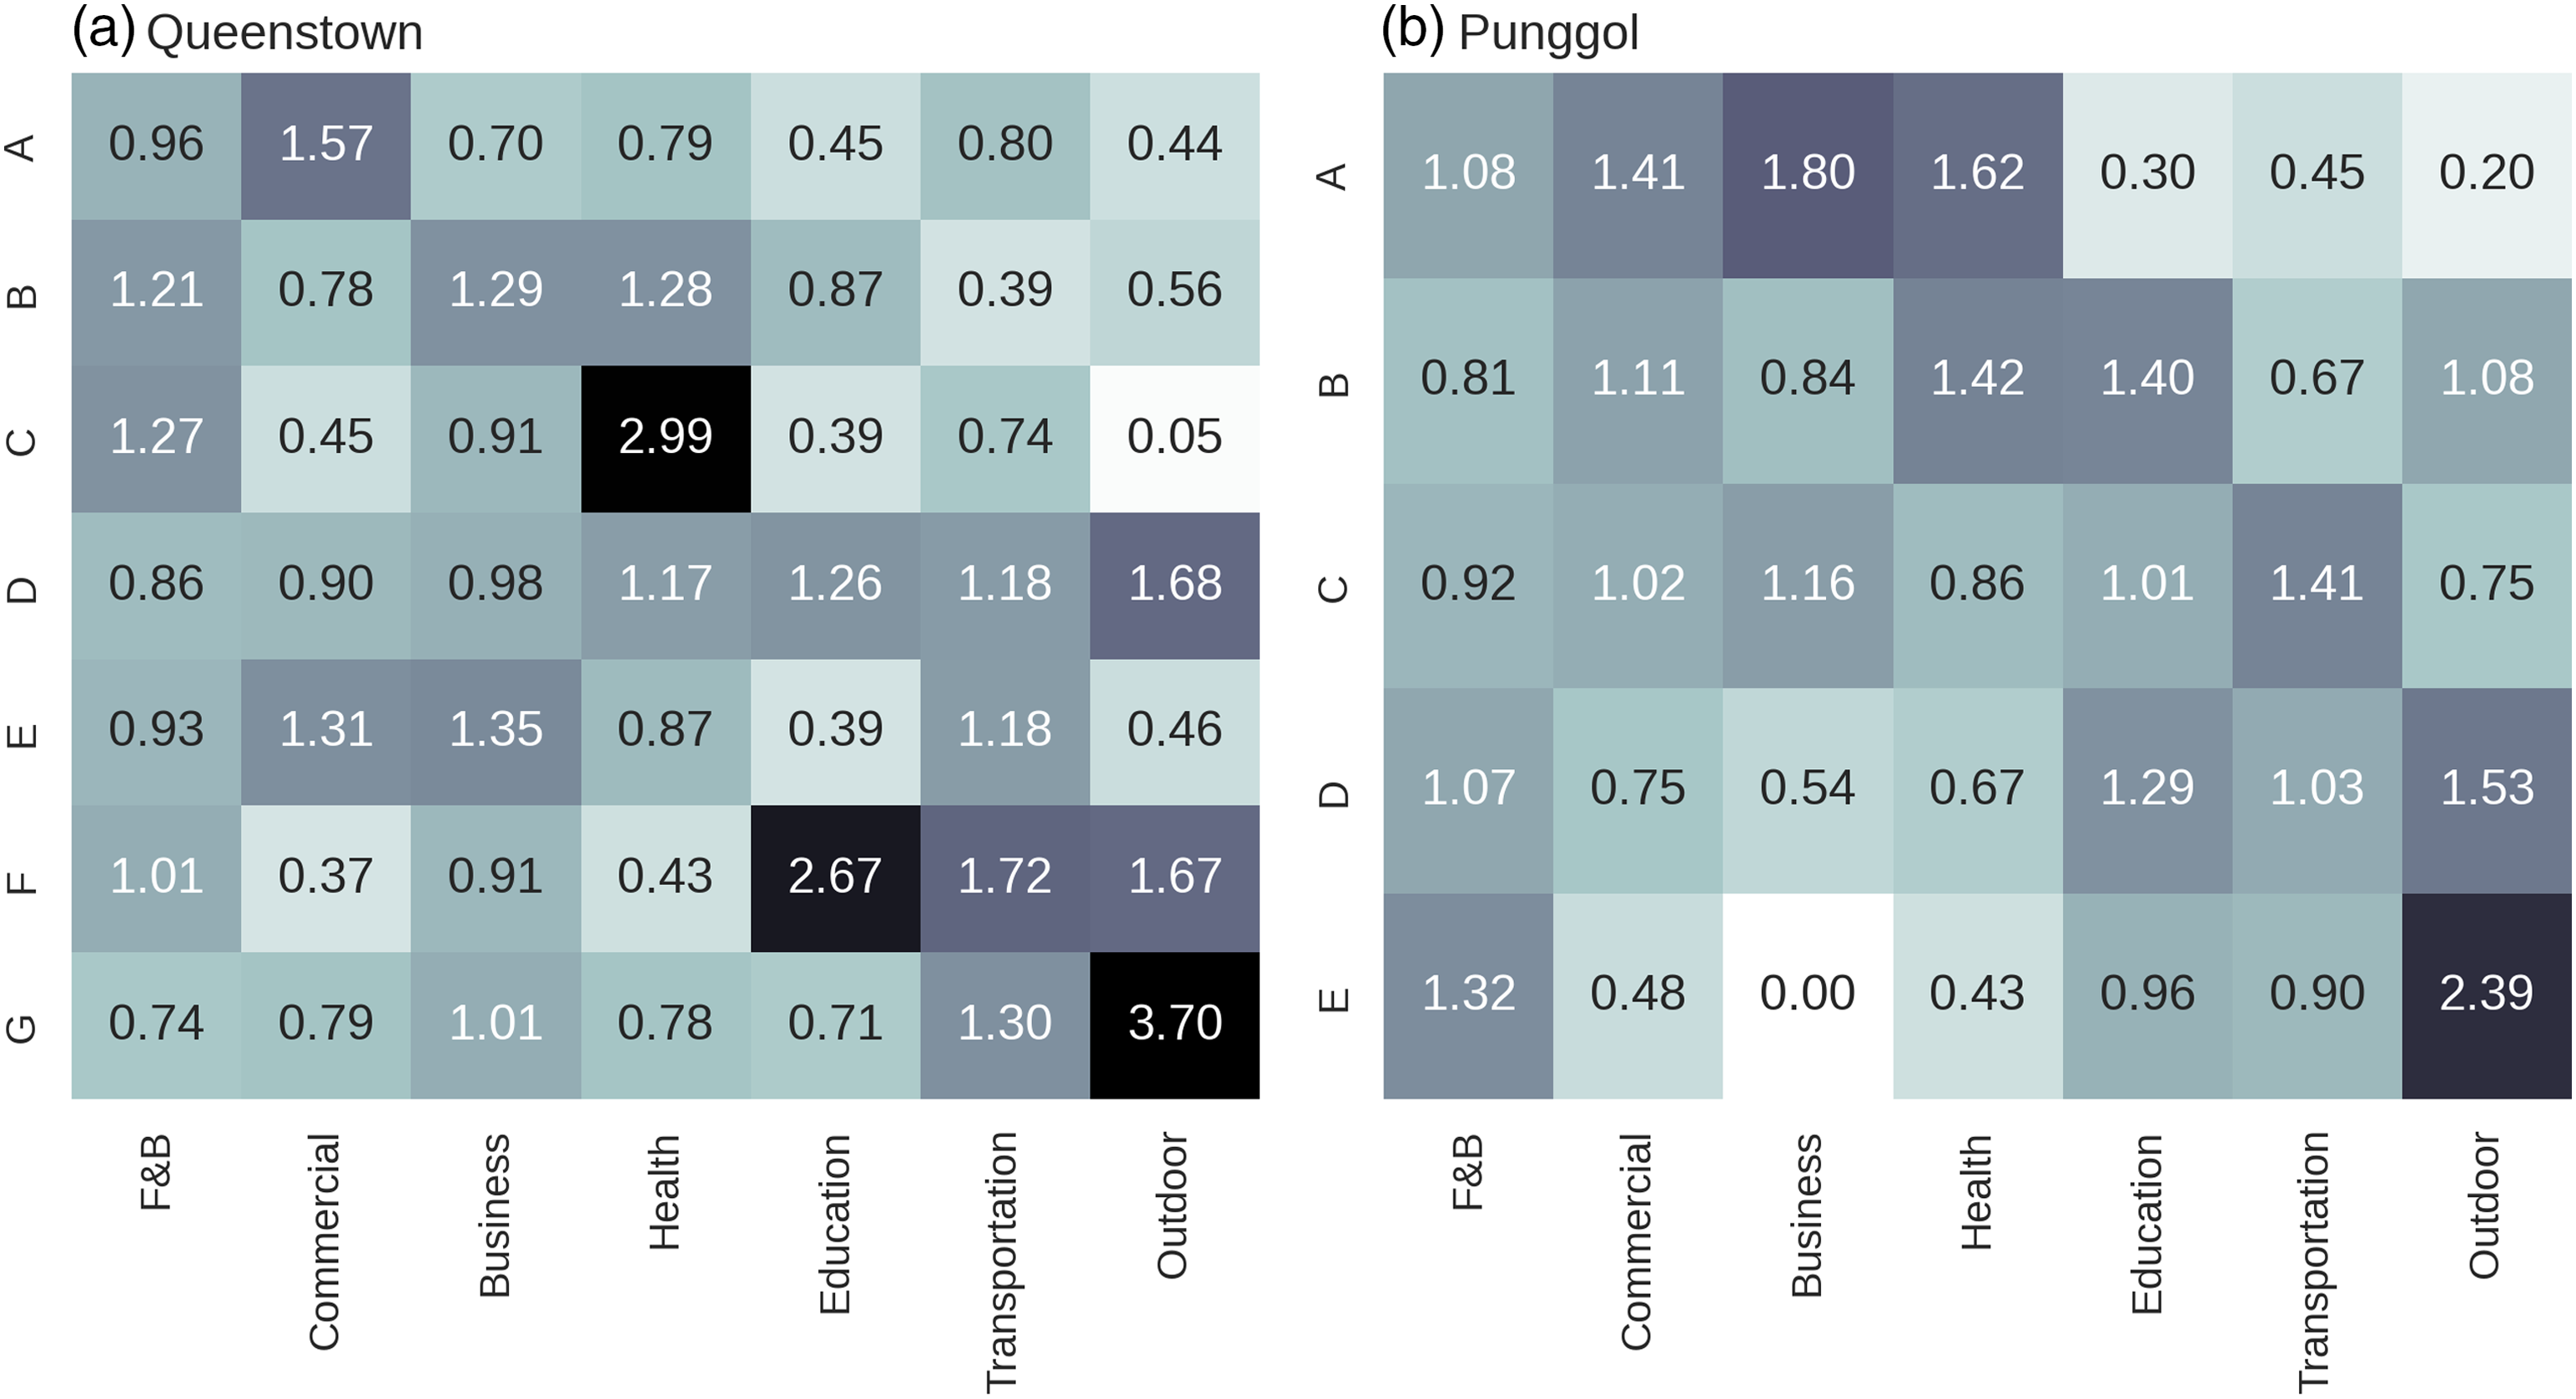
The POI count in different categories varies from hundreds to thousands (Suppl Table S3) – the amenity categories with smaller total numbers would be underestimated in all zones if we compare the count of POI directly. This implies that the metrics based on the proportion may be problematic given this situation. Therefore, in our study, the enrichment factor is appropriate for cross-amenities comparison and cross-zonal comparison because it includes both the total number of POI in each category (N j ) and in each zone (n i ). We used the enrichment factor metric for the subsequent zone function identification and similarity analysis across study sites.
The matrix of enrichment factors for all combinations between amenities and zones is presented in Figure 3. The enrichment factors could be compared and discussed in both directions: across different zones for an amenity (columns in Figure 3), and across various amenities for a zone (rows in Figure 3).
The enrichment factors of Queenstown were mostly in light colours and only one to three cells in each row had higher values. This means that most of the zones in Queenstown served some specific purposes. For example, Zone-A was mainly commercial, whereas the health function was mainly in Zone-C and education in Zone-F. The enrichment factor of F&B in most zones was relatively high compared to other functions, indicating that most area had some level of F&B function in Queenstown. The values for Punggol were generally higher, indicating that most zones contain multiple functions. Punggol was planned and built as a highly integrated residential town. Because houses and apartments would usually not be recorded as a POI, this led to a lower number of POIs in the area. Thus, other types of amenities became the major functions, which indicated a diverse urban function pattern. In other words, besides residential, other types of amenities were mixed and highly integrated in Punggol.
Based on the enrichment factors, the major functions in each zone are summarised in Suppl Table S7. In Queenstown (Figure 4), Zone-A – a commercial area – is at the west, neighbouring the Central Region of Singapore. Located beside Zone-A and Zone-C, Zone-B is a business park region (Suppl. Figure S1(a)). The major functions here were F&B, business, and health. Zone-C is a hospital, which also contains a slightly higher F&B enrichment factor. This might be because these types of amenities could usually attract more users. Zone-F covered some campuses of high education and research centres, leading to a high education enrichment factor. The other zones are the buffer regions or the outer regions of the core area that contain multiple functions. The 3D map for Punggol is shown in Suppl. Figure S8. Urban functional zones in Queenstown. Some key locations are labelled on the 3D map. The map was generated using Mapbox and OpenStreetMap.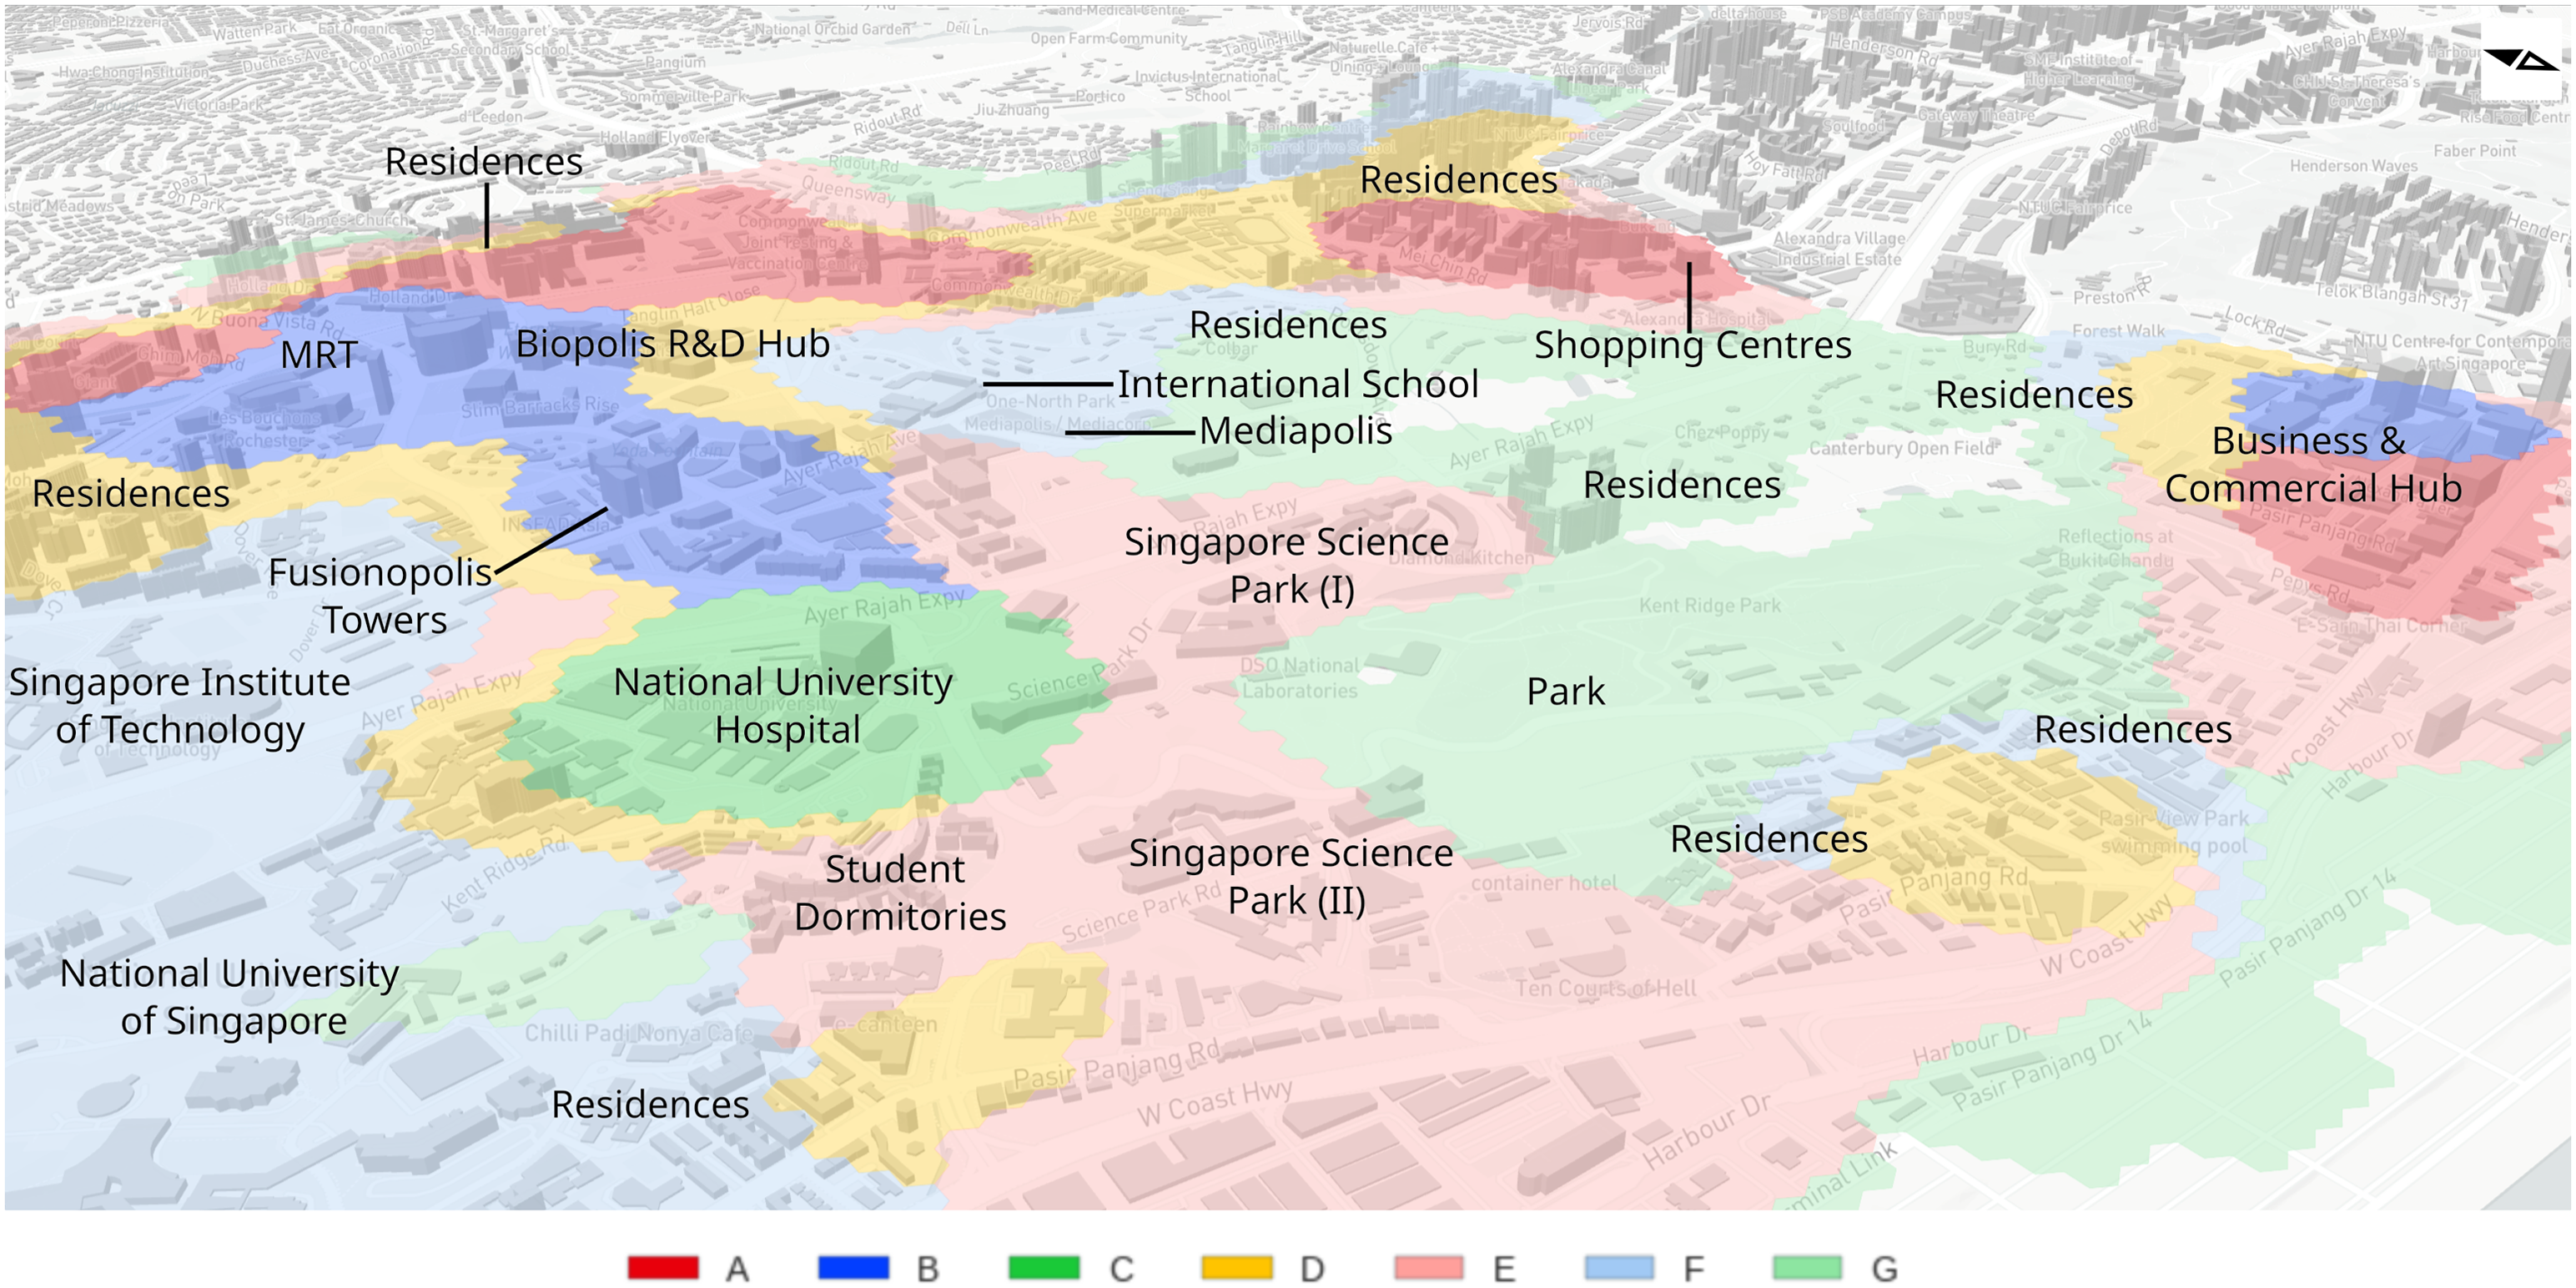
The planned land-use type for each zone
While functional zones were delineated based on the spatial distribution of amenity categories, the relationship between the planned land-use type and the zones remains unclear. We calculated the proportion of area for various land-use types in each zone and the enrichment factors (Figure 5). In both study sites, transportation land-use had occupied a relatively large proportion of area in almost all of the zones (about 0.2 to 0.3). Streets and MRT/LRT stations were uniformly distributed within the study sites. Other than transportation, each zone tended to be dominated by one or two land-use types. In Queenstown, Zone-B and -E were mainly business areas; Zone-A and -D contained more residential areas; Zone-C and -F were civic/education/medical areas. In Punggol, most of the zones contained large proportion of residential land-use, except Zone-A (a mixed land-use of residential and commercial). The matrix of identified clusters (rows) and the planned land-use types (columns) for the two sites. The top row shows the row standardised value in each cell indicates the proportion of individual cluster area that falls within the 10 land-use types and the bottom row shows the enrichment factor of land-uses’ areas.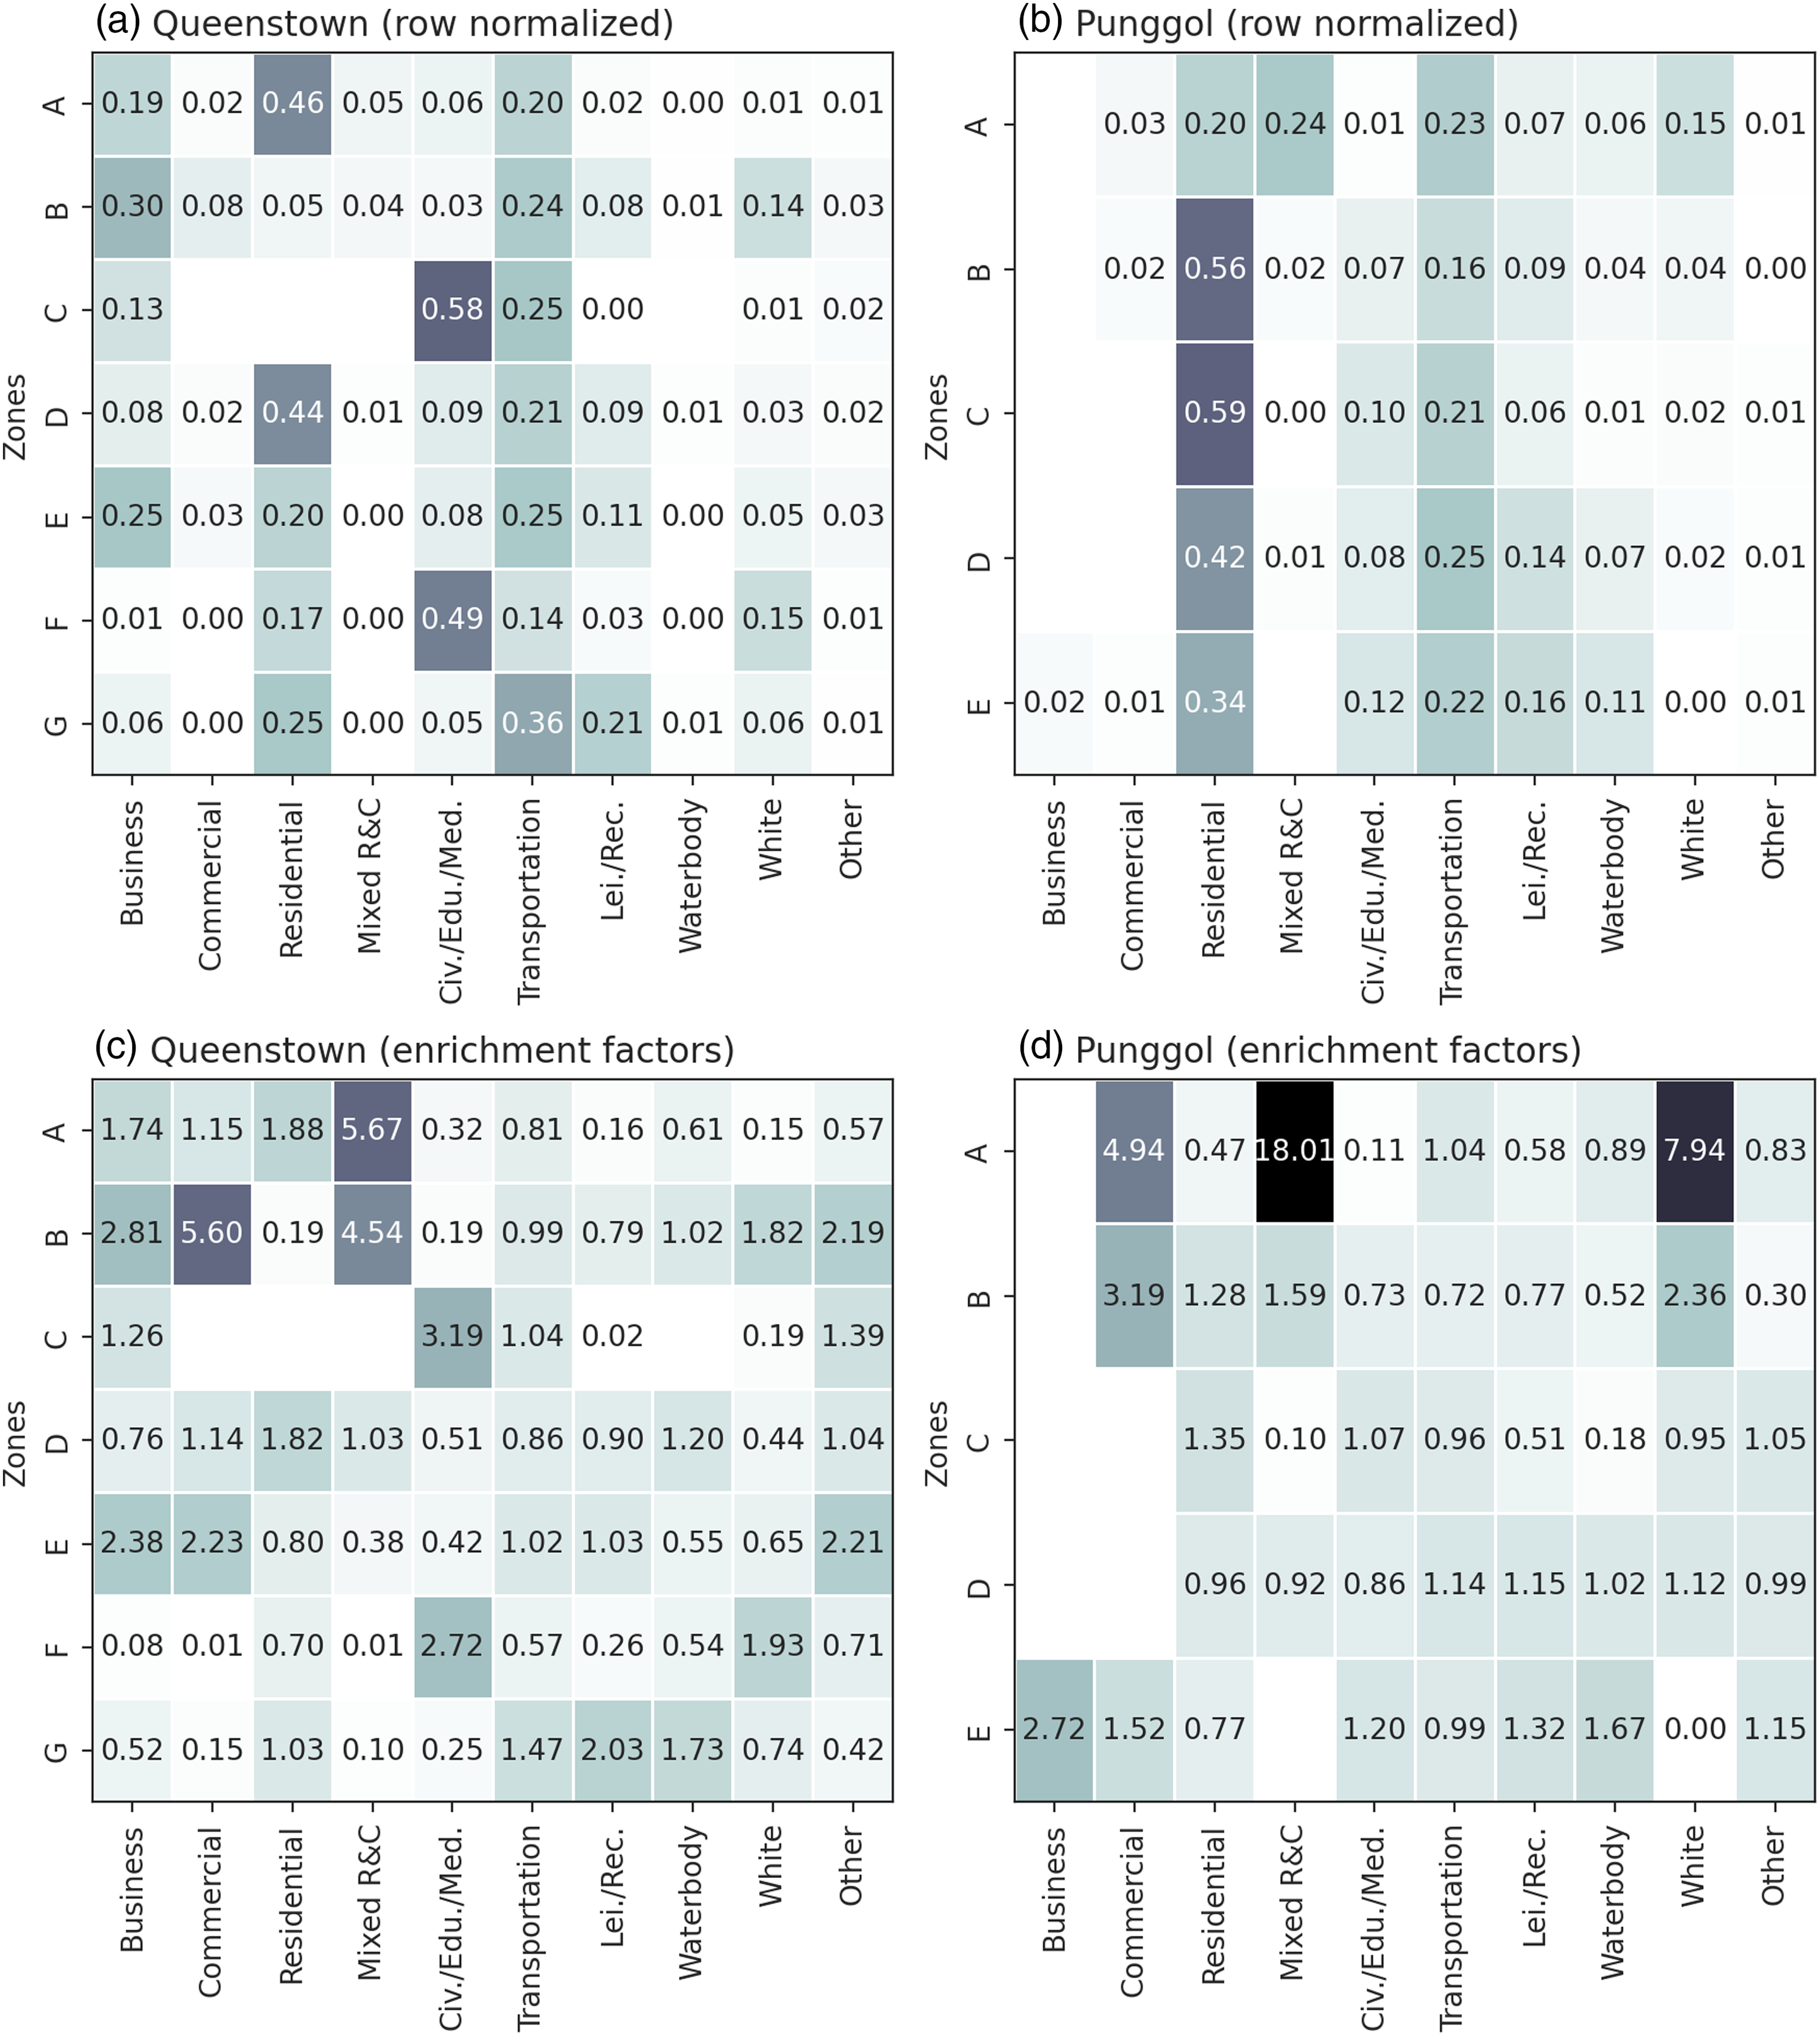
Enrichment factors (Figure 5(c) and 5(d)) revealed slightly different results than proportions. High enrichment factors were mainly located in the zones with denser activities, while transportation had low enrichment factors in both sites. In Queenstown, mixed R&C land-use had a stronger concentration within the Zone-A and Zone-D, while commercial land-use had high enrichment factors in Zones-B and -E, indicating that these zones covered most of the commercial land-use type within the study site. In Punggol, residential land-use was no longer the major land-use type within the zones, but business, commercial, mixed R&C, and white land-uses stood out, indicating that some of the zones included most of these land-use types within the site and formed some clustering pattern. The maps of the land-use and POI enrichment factors are presented in Suppl. Figures S9–(s)10.
Discussions and conclusion
This study presents a framework with two objectives: (1) identifying urban functional zone boundaries and (2) determining zone functions. Two case studies in Singapore were conducted to delineate urban functional zones based on the spatial distribution of different amenity categories. By leveraging social sensing (Liu et al., 2015) and Volunteered Geographic Information (Jiang and Thill, 2015) techniques, real-life experiences from crowdsourced data were captured from geocoded user-generated content, specifically POIs. POIs in seven categories served as a proxy for diverse amenities representing various human activities. KDE were applied to assess the accessibility to various types of amenities. Then, k-means clustering analysis was performed to identify urban functional zone boundaries, which denote areas with similar amenity compositions. The dominant amenity type and mixture within each zone were explored using enrichment factor matrices. As the primary input data, POI data is widely available for most cities worldwide, making the proposed framework applicable beyond the study area.
KDE was used to model accessibility as a smooth surface with higher density concentrated at locations with more points of a specific POI. This resulted in a blurred boundary for the amenity service area and opened up the possibilities of identifying different boundaries at the periphery areas, namely, the low-density areas or buffer zones. Therefore, the choice of the k value in the k-means clustering algorithm is critical in practice. A higher k may generate some secondary urban functional zones that surround the high-density area, pushing the boundary outwards from the core area. For example, Zones-E, -F, and -G in Queenstown were identified as buffer zones. The elbow method was used in this study to determine the optimal k. However, there are other methods that can be used, depending on the specific purpose of the zoning. While the resulting patterns may be similar (Suppl. Figure S6–(s)7), the modifiable boundaries may cause the modifiable areal unit problem (Goodchild, 2022).
Mixed development is the de facto trend in highly urbanised cities, emerging dynamically and organically. Different urban functions overlap to form composite urban functional zones (Hidalgo et al., 2020; Wang et al., 2021). This study proposes a framework to reveal the spatial structure of urban functional zones with mixed functions. The framework assumes urban functions are mixed from the outset and calculates accessibility to different types of amenities using KDE, followed by clustering analysis to delineate the shapes of urban functional zones with various compositions. Key strengths of this framework include no preset boundaries and the ability to capture differences between places with similar functions/programmes but different intensity/composition.
Human activity in urban space is complex and dynamic (Batty, 2013; Gallotti et al., 2021), and urban functional zones are the outcome of the organic urban development process. While urban land-use planning is the starting point, the identified urban functional zones often differ from planned land-use distribution. In our results, several zones were detected within the same planned land-use, with similar programs but different activity levels. This can be caused by the existence or lack of important landmarks. While modelling and predicting the dynamic development process from planned land-use to functional zones is difficult due to the complexity, this study demonstrates that retrieving urban functional zones from actual activities is possible.
Understanding the spatial structure of urban functions would have benefits for long-term and short-term urban planning. For long-term urban planning (urban revitalisation and urban redevelopment), understanding the current situation could facilitate the simulation of scenarios of future designs and plans (Li et al., 2021). Analysts can explore different possible combinations of POI and assess the resulting urban functional zone patterns. For short-term planning, the questions of what is provided at different location, who are the users, and where these users are coming from, become critical in the management of communities and relevant resource allocation. This study provides a partitioning approach according to the services that indicates the spatial distribution of resources and supports the allocation of essential resources. For example, during an epidemic, the spatial partitioning for movement controls and the allocation of medical resources can benefit from this perspective. Regarding the spatial partitioning process, decision makers may need to know the boundaries of urban functional zones that correspond to the spatial structure of amenities, adopting a zonal approach to restrict human movement. In addition, places where people gather or access their daily essential goods are more ideal for distributing goods and disseminating information.
Urban functional zones and land-use are two distinct concepts and both are pivotal in urban planning. Land-use planning optimises resource allocation, promoting sustainability and efficiency in urban areas. Urban functional zones classify dynamic urban functions and activities, offering insights into functional diversity and supporting efficient planning and resource allocation (Liu et al., 2020; Niu and Silva, 2021). Land-use zoning guides city layout, while urban functional zones, shaped by spatial distribution of amenities and services, support urban life. Land-use zoning categorises land by purpose, while urban functional zoning focuses on urban dynamic. Both concepts are vital for creating liveable cities, optimising land use, and supporting diverse urban activities (Niu and Jin, 2021).
By identifying urban functional zones and amenity composition in the two study sites in Singapore, we observed that the urban functional zones are not always correlated with planned land-use. For example, Zone-A in Queenstown is mainly occupied by commercial amenities, but almost none of the area is planned for commercial land-use; instead, most of the area is planned for business, residential, and transportation, for which enrichment factors are relatively low. Indeed, detailed information about urban space that provide higher resolution than the land-use data can bring benefits for the urban revitalisation and redevelopment (Niu and Jin, 2021; Hong and Yao, 2019). Planned and actual land-uses can differ, indicating a mismatch between top-down (planning and governance) and bottom-up (user experiences) perspectives. Planned land use only captures the main function of a place, while places are always mixed with different functions, especially in high-density urban areas (Hidalgo et al., 2020). This highlights the value of using user-generated data, such as POI data, to analyse urban spatial structure and understand the evolving use and functions of urban spaces.
The presented analysis has several limitations. We did not compare the results with other socioeconomic-demographic, and human activity due to the study scope, which focuses on identifying urban functional zones. Future research can integrate urban statistics to enhance urban process modelling. As there was no alternative validation data available, we couldn’t provide accuracy/precision analysis for the classification. Future studies can include data sources, such as social media (Gao et al., 2017) and movement data (Niu and Jin, 2021) for validation. Although POI data served as a surrogate for spatial distribution of amenities, some points like residential units and industrial facilities were missing. Future research can include additional data types to address this limitation. Moreover, this study did not consider the capacity of each amenity, treating every POI equally. This approach may underestimate amenities with a large footprint. Future studies should incorporate capacity and service distance variations into the data. The edge effect near boundaries may underestimate accessibility to amenities located outside the study area. Future efforts can expand the study area to cover surrounding spaces and focus on the designated region to mitigate the edge effect. Lastly, population dynamics, an important aspect of urban function, were not considered due to the difficulty in collecting human activity intensity data. Future research can incorporate population dynamics into the partitioning of urban functional zones.
Supplemental Material
Identifying urban functional zones by analysing the spatial distribution of amenities
Supplemental Material for Identifying urban functional zones by analysing the spatial distribution of amenities by Wei Chien Benny Chin, Yuming Fu, Kwan Hui Lim, Thomas Schroepfer and Lynette Cheah in Environment and Planning B: Urban Analytics and City Science
Footnotes
Acknowledgements
The authors would like to thank Raymond Low for preparing and processing the raw data of POI in the three study sites.
Declaration of conflicting interests
The author(s) declared no potential conflicts of interest with respect to the research, authorship, and/or publication of this article.
Funding
The author(s) disclosed receipt of the following financial support for the research, authorship, and/or publication of this article: This work was supported by a grant from the Singapore University of Technology and Design (Cities: Urban Science and Design for Density, PIE-SGP-CTRS-1803).
Supplemental Material
Supplemental material for this article is available online.
![]()
![]()
![]()
![]() .
.
References
Supplementary Material
Please find the following supplemental material available below.
For Open Access articles published under a Creative Commons License, all supplemental material carries the same license as the article it is associated with.
For non-Open Access articles published, all supplemental material carries a non-exclusive license, and permission requests for re-use of supplemental material or any part of supplemental material shall be sent directly to the copyright owner as specified in the copyright notice associated with the article.