
Abstract
The pathways used by cyclists, pedestrians, and users of micromobility to cross intersections do not always align with those planned by traffic engineers. Observing actual usage patterns could lead to a better understanding of the tactical behavior of users of active and micromobility, allowing planners and engineers to create urban environments specifically for these road users. An open-source Python tool is introduced that uses clustering to automatically identify the forms of pathways used by road users. The tool was used to cluster trajectories from five intersections in Germany. The exemplar of each cluster is selected to represent the average shape of each pathway type. The open-source Python tool RoadUserPathways is introduced, the case studies are examined and use cases are presented.
Introduction
The concept of desire lines was coined by Gaston Bachelard in The Poetics of Space (1958). Desire lines are paths worn by pedestrians on unpaved surfaces. These worn-out pathways highlight mismatches between the planned (and paved) walking network and the preferred routes of those using the space. Although the situation is slightly different, Copenhagenize Design Co. pioneered the use of desire lines in the context of cycling and has implemented their manual, observational data collection approach to investigate the behavior of cyclists crossing intersections in many cities (Colville-Andersen et al., 2013). The movement patterns for cyclists crossing and turning at intersections are stipulated by traffic engineers and correspond to the paved footpaths in the pedestrian case. For example, cyclists in Germany should use the indirect style for left turns at intersections with bicycle lanes (see Figure 1, top left), are expected to use cycling infrastructure if provided, and should cycle in the given direction of travel. An example of the expected and stipulated movement patterns of cyclists crossing and turning at an intersection with on-road bicycle lanes in Germany is shown in Figure 1, top right. The regulations for infrastructure use differ based on the intersection design and country. Commonly observed types of left turns (top left), examples of stipulated movement patterns for cyclists (top right) and trajectories from cyclists crossing two intersections from the inD dataset (bottom).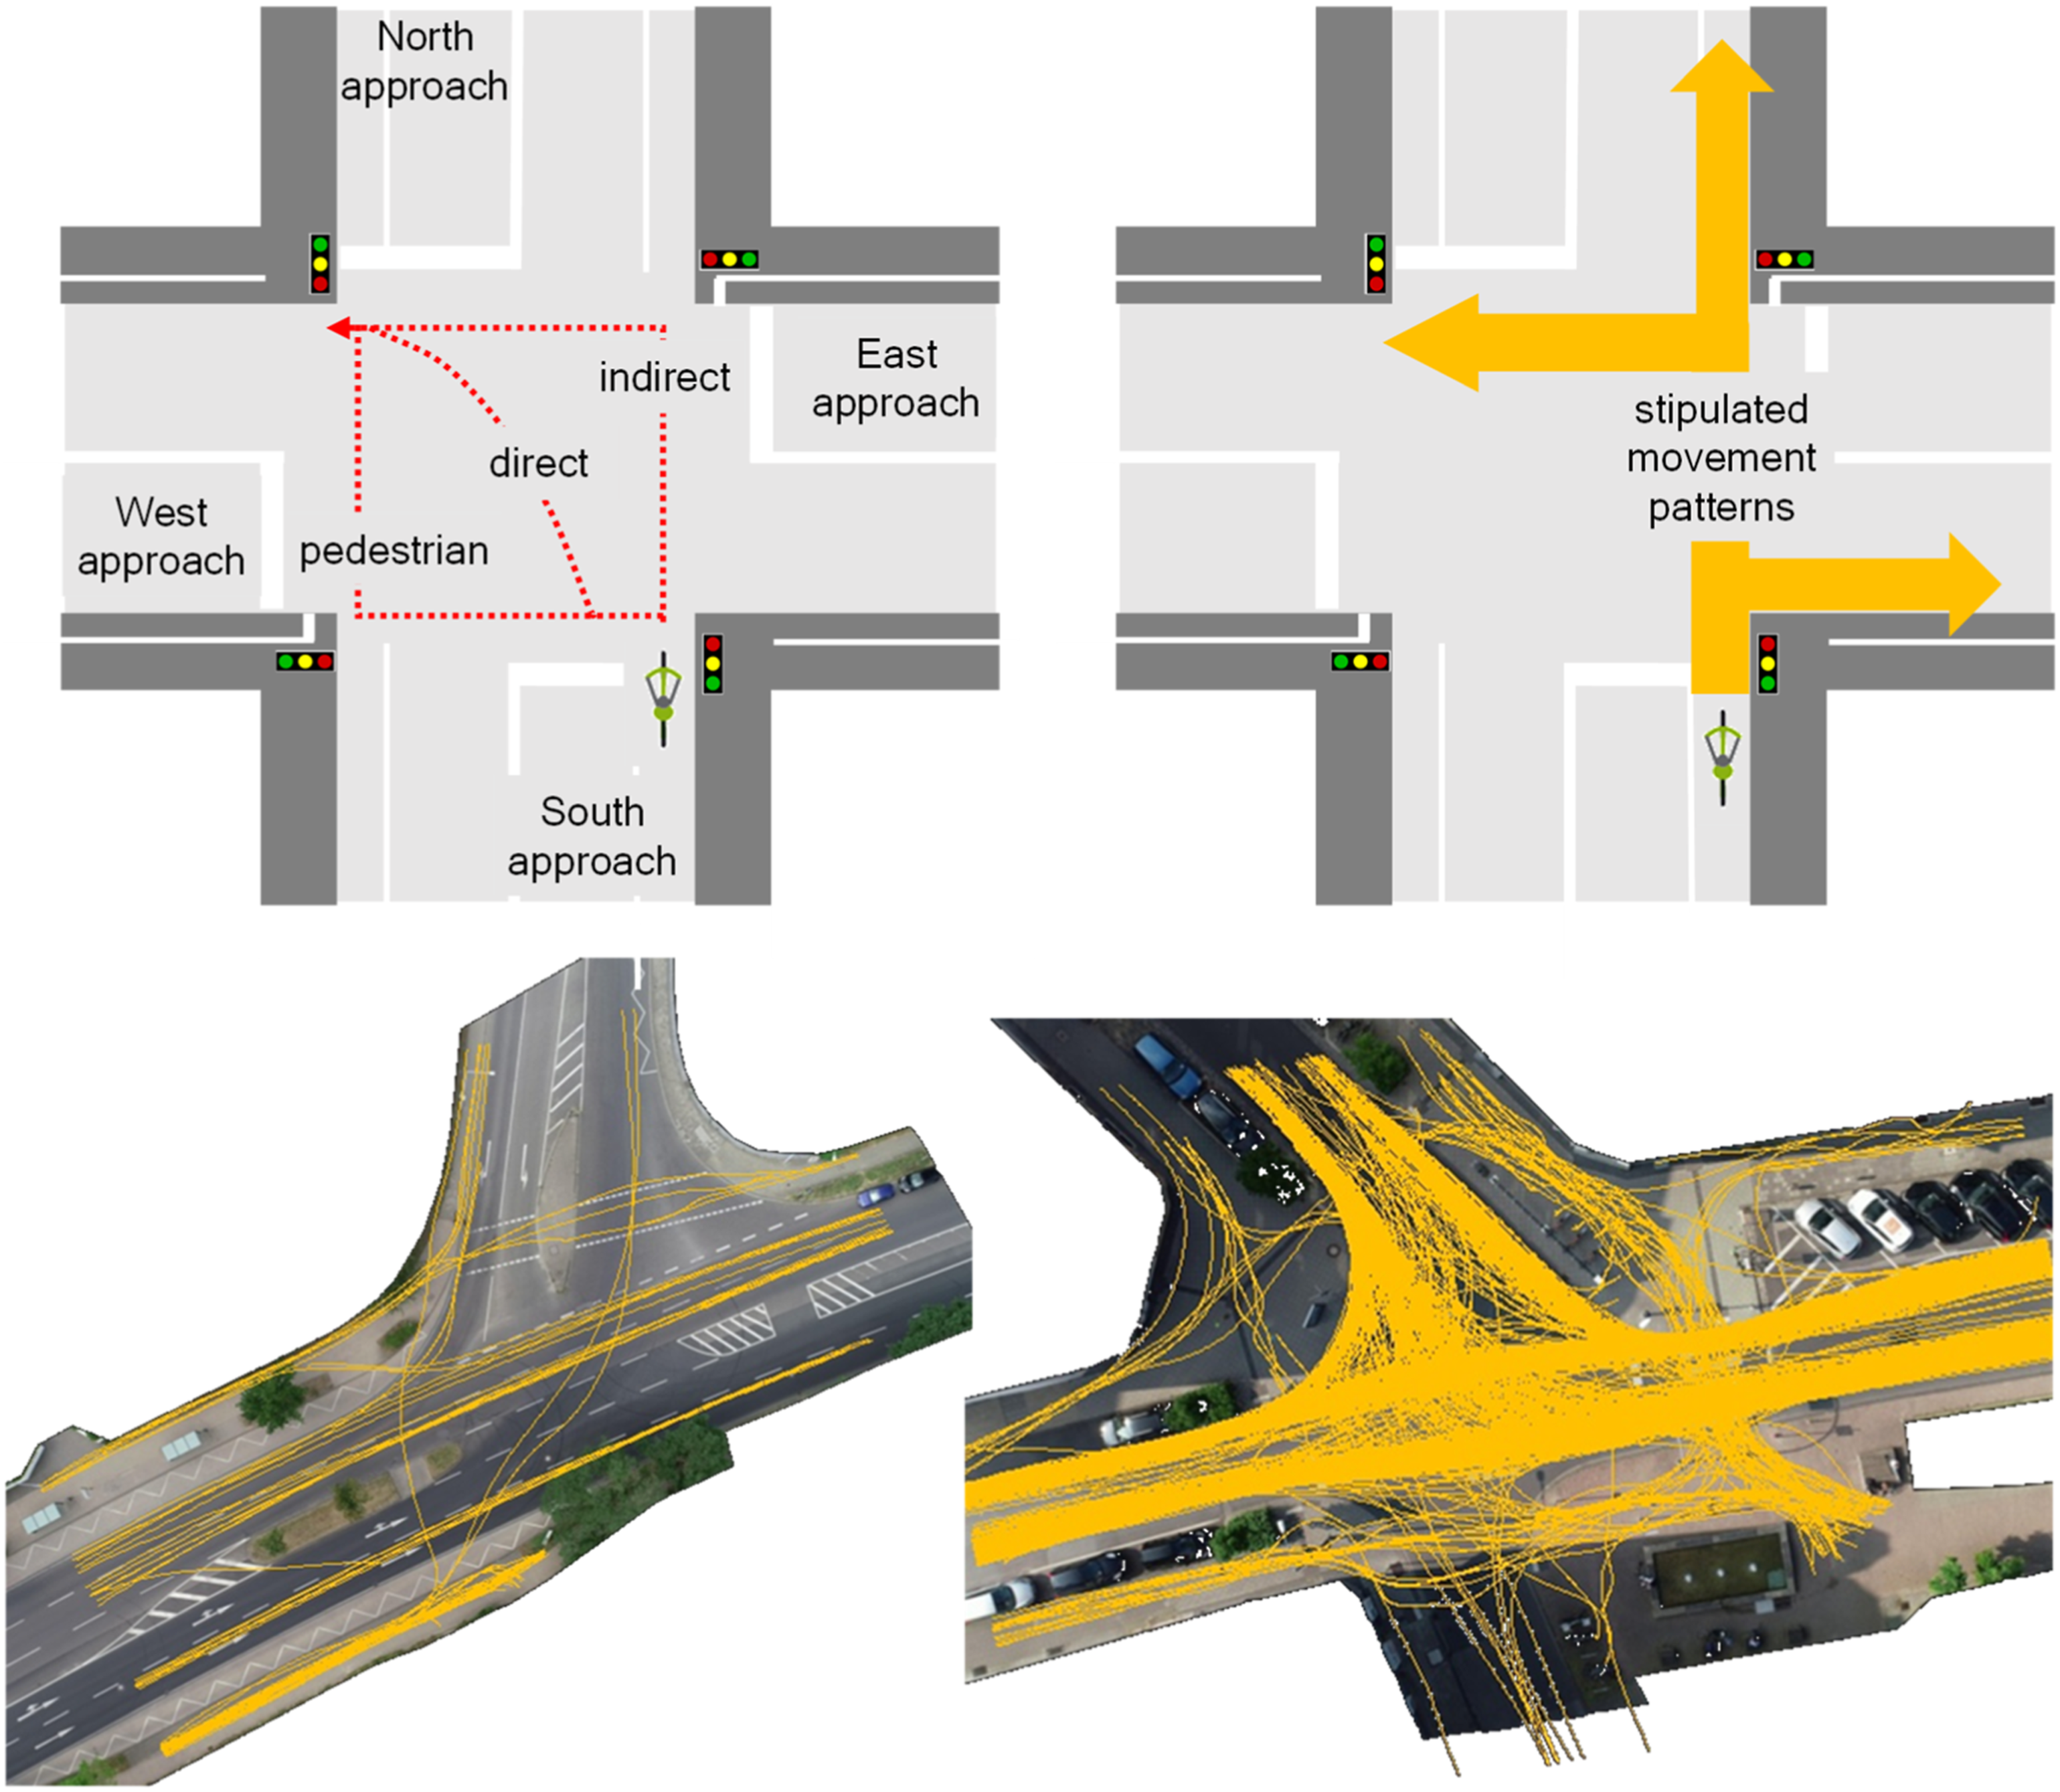
The actual movement patterns of cyclists at intersections is much more dispersed. In Figure 1 (bottom), the trajectories of cyclists crossing two intersections in Aachen, Germany from the inD dataset (Bock et al., 2020) are shown. Cyclists use unexpected parts of the infrastructure (e.g. sidewalk) and cross using pathways that differ from planned movement patterns. Akin to pedestrians treading new pathways, these actual movement patterns of cyclists can point to weaknesses in the intersection design and can be a source of inspiration for new planning or engineering measures.
Researchers studying the tactical pathfinding behavior of cyclists at intersections have identified the following trends: • Cyclists in Copenhagen use the infrastructure as intended most of the time. Only a handful of cyclists carry out direct left turns rather than an indirect left turn as intended by planners (Colville-Andersen et al., 2013). • The left-turn behavior of cyclists in Munich was found to be more diverse than in Copenhagen, with many cyclists using the pedestrian style left turn in addition to direct and indirect turns (Twaddle and Busch, 2019). • A study of the desire lines of cyclists in Amsterdam showed that many different pathways are used by cyclists, particularly when turning left (University of Amsterdam and Copenhagenize Design Co., 2014). • In Montreal, the number of typical pathways depends on the geometry of the intersection (Nabavi Niaki et al., 2019). • In Barcelona, a desire line analysis showed that 78.9% of cyclists abide by traffic rules at intersections and the main reason for unexpected behaviour is avoiding stops (Lind et al., 2021).
Most of these findings were drawn from manually collected trajectory data. Manual data collection allows for the qualitative assessment of the situation by the observer. However, it greatly limits the number of trajectories that can be collected and processed. The contribution of this work lies in the development of an open-source Python tool for the automated identification of pathway types from raw trajectory data. Although it is possible for an analyst to manually cluster trajectories in cases with few observations or with dense cluster structures (e.g. intersection on the bottom left in Figure 1), this task is much more difficult in situations with many observations or dispersed infrastructure use (e.g. intersection on the bottom right in Figure 1). The automated identification of pathway types will enable researchers and practitioners to easily identify unexpected behaviors (desire lines) that differ from the intended movement patterns at particular intersections. This can be done time efficiently for large trajectory datasets and many intersections.
Methodology
Data
The input data are trajectories comprised of position coordinates. Trajectories saved in SQLite databases with the structure defined in the open-source project Traffic Intelligence (Jackson et al., 2013) are loaded. RoadUserPathways was developed using trajectories with 25 position coordinate observations per second. Trajectories with a lower frequency of position coordinates will work as long as the shape of the crossing maneuver is adequately captured. A local coordinate system (UTM) is used, in which the coordinate point (0,0) is the upper left-hand corner of the video frame from which the trajectories were extracted. The actual UTM coordinates of the given UTM zone can also be used.
Trajectory data is preprocessed to select complete trajectories and enable comparability. This is accomplished in RoadUserPathways using polygons drawn by the analyst to filter and trim the trajectory data. In addition, a method for analyzing the trajectories from each approach separately is included. More information about these functions can be found in the README file on GitHub.
Clustering approach
A trajectory from each crossing road user
The expected clusters vary with regard to the number of observations in each cluster (cluster size) and the degree of similarity between observations in the same cluster (cluster density). Additionally, the number of different pathways across the intersection is not known in advance. The data are expected to be globular, or convex, meaning that any line drawn in
AP is a centroid-based clustering method, meaning that the clusters are built by measuring the distance of observation points from an assigned cluster centroid (referred to as an exemplar in AP). The algorithm rotates through trajectories as potential centroids and selects the set of centroid trajectories that results in the lowest overall distance between observation points and assigned cluster centroid. The use of a centroid-based method is important for RoadUserPathways because the centroid (or exemplar) represents the desire line of each pathway type.
Open-source tool
The Python code for loading and preprocessing raw trajectory data, clustering trajectories, and preparing the result is made available through the open-source Python project RoadUserPathways, which is hosted on GitHub. Detailed information about the dependencies, workflow, data input and preprocessing, parameters, output and clustering with AP are included in the README file.
The Python scikit-learn implementation of AP (Pedregosa et al., 2011) is used to cluster the trajectory data in the
The tool yields three main outputs: • The number of pathway types used by road users • A representative trajectory that characterizes the average shape of each pathway type • The number and percentage of road users who use each pathway type
Case studies
Output of the pathway identification tool.
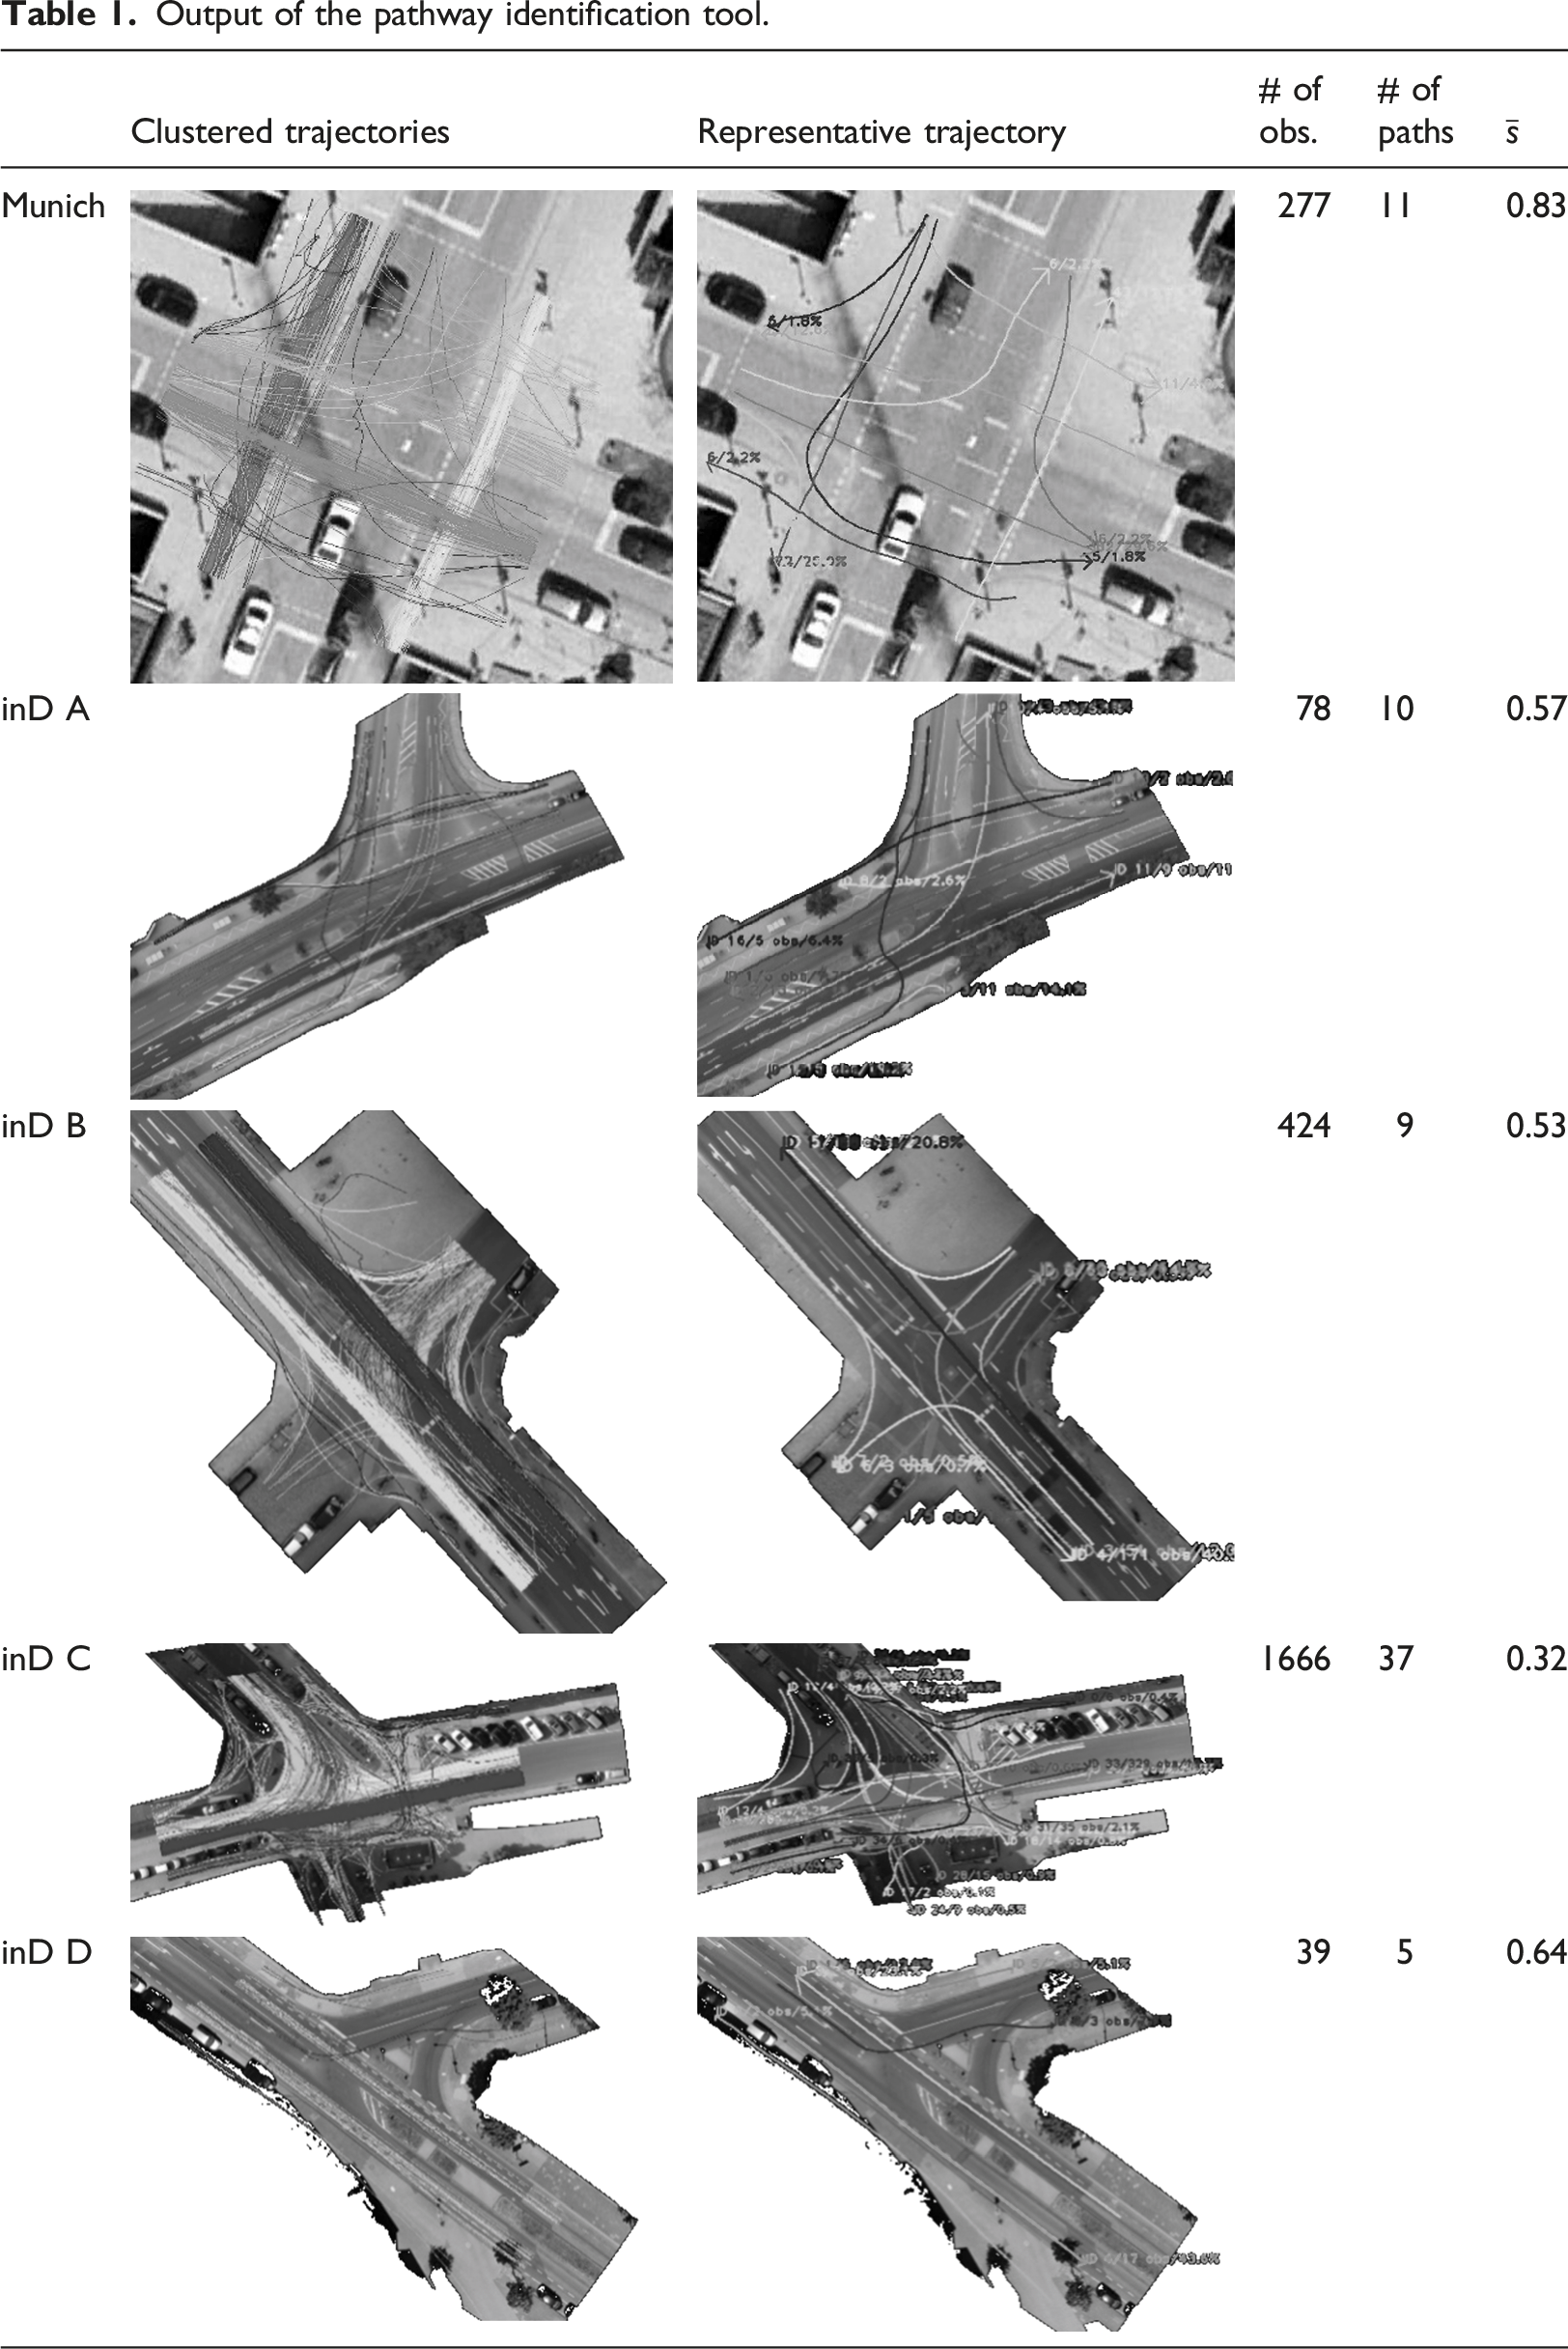
The images in the column ‘Representative trajectory’ show the exemplar trajectory, signifying the average shape of the pathways type. The direction of movement is indicated by an arrow on the exiting end of the trajectory. The number and percentage of cyclists using each pathway type are displayed and output in a text file. This information is useful for examining the shape of average trajectories and how common unexpected pathway types are at a given intersection. The desire lines of cyclists using the inD intersecton B match very closely with the planned movement patterns. In comparison, the desire lines at the inD intersection C show a wide divergence from the intended infrastructure use. The clustering results from this intersection could indicate that an infrastructure redesign is necessary. Given that many cyclists are using the sidewalks rather than the roadway, it may be beneficial to install bicycle lanes.
The clustering structures are evaluated using the average Silhouette Score, where
Discussion and conclusion
There are many possible use cases for the Python package RoadUserPathways: 1. Results provide planners and engineers with 2. Clusters provide insight into the 3. 4. The 5. The link between the pathway type and
RoadUserPathways is a starting point for analyzing the movement patterns of many road users at different intersections. There are, however, some weaknesses and points for future development. First, a qualitative comparison of the clusters obtained using AP, k-means and Mean Shift indicated that the best results were obtained with AP. In addition to the good results, a strong advantage of this algorithm is that the number of clusters is determined as an output of the algorithm. However, a more systematic assessment is necessary. Second, the trajectories observed do not reflect the pure desired behavior. Road users are also reacting to elements in the environment; other road users, traffic lights, obstacles, etc. Analysts should be aware of this while drawing conclusions. Although automated data processing methods allow researchers to study a large datasets, trajectories remain a sterile form of data that do not include contextual information. Other methods of quantitative and qualitative data collection can lead to a more comprehensive understanding of behavior.
Footnotes
Acknowledgements
Declaration of conflicting interests
The author(s) declared no potential conflicts of interest with respect to the research, authorship, and/or publication of this article.
Funding
The author(s) disclosed receipt of the following financial support for the research, authorship, and/or publication of this article: This work was supported by the German Federal Ministry for Digital and Transport.
Data Availability Statement
All data generated or analysed during this study are included in this published article. ![]()