
Abstract
In the last decade, the UK’s media have highlighted an apparent rise in the number of homes below the recommended Nationally Described Space Standard for a one-person, one-bed home. However, evidence for the growth of ‘micro-apartments’ is mixed, with existing data making it difficult to map the geographies of sub-standard homes below the Local Authority scale. Focussing on London, this paper uses Energy Performance Certificates (EPCs) as a source of floorspace data, matching this to the Land Registry’s Price Paid Data (PPD) and information from the London Planning Database. It quantifies the number of sub-standard homes in London registered for an EPC 2010–21, maps their location at the MSOA (neighbourhood) level, and compares property prices for small and larger homes. Focusing on newly-built homes, it shows that the numbers of small homes doubled across this period with growth in select outer London ‘hotspots’ accounting for much of this. It also demonstrates the overall numbers of small homes rose despite the formal incorporation of NDSS in the London Plan 2016, with the by-passing of space standards in property conversions under Permitted Development Rights, 2013–21 appearing relatively insignificant in explaining these temporal and spatial trends. Finally, it shows that the price per square metre of small homes often far exceeds that of much larger homes in the same area. While recognising the limitations of EPC data, our findings point to the need for further exploration of the enforcement of space standards, not least because it is often assumed that building more, smaller homes in the capital will create more affordable homes for Londoners.
Introduction
Housing space standards have long been contested, with some believing market demand should dictate the size of homes, others that space standards are essential to maintain public health and well-being (Carr, 2016). In England, the 1918 Tudor Walters Act established external and internal space norms, enforced through insurance policies and government funding for housebuilders (Park, 2017). These were subsequently relaxed post-WW2 in the rush to replace homes lost to aerial bombardment with maisonettes and pre-fabs (Carr, 2016), before the ‘Parker Morris’ (1961) report Homes for Today and Tomorrow set down improved standards based on anthropomorphic data determining the minimum space needed to use and move furniture. However, these standards were abandoned following the Government, Planning and Land Act 1980, part of the Thatcherite deregulation of planning (Clifford and Ferm, 2021). The outcome was an apparent rash of small homes: Drury and Somers (2010) estimated 75% of one-bedroom flats and 91% of two-bedroom flats built-in London in the 2000s were below Parker Morris standards. Alarmed by decreasing home sizes, Mayor Ken Livingstone commissioned a 2006 study recommending enforcement of minimal floorspace through the planning system: the resulting 2010 Interim London Housing Design Guide guidelines were heralded as ‘Parker Morris plus’ (Carr, 2016), stipulating improved Gross Internal Area (GIA) according to the number of storeys, bedrooms and occupants (e.g. for a one-bed, one-storey, single-occupancy flat, the minimum suggested floorspace was 37 m2).
These new design guidelines responded to disquiet about ‘shrinking’ homes in the capital, oftentimes described as ‘rabbit hutch’ developments (Jones, 2018) despite the marketing of these very same properties as ‘aspirational’ city-centre living spaces for post-students and young professionals (Harris and Nowicki, 2020). Mandatory for homes funded through the London Homes and Community Agency, the guidelines were intended to direct housing developers, architects and local authority planners, but in 2015 were superseded by the government’s Nationally Described Space Standards (NDSS), themselves based on the London standards. Whilst these ‘technical standards’ were not mandatory, needing to be formally adopted by local authorities before they became a material factor in the determination of planning applications, they were incorporated in the London Plan in 2016, meaning they are now given weight when a developer applies for planning permission for any domestic property (including the subdivision of existing homes into smaller flats). Between 2013 and 2021, however, these standards were not enforced for office or commercial conversions under so-called Permitted Development Rights (Clifford and Ferm, 2021). Here, the sidestepping of national space standards was justified with reference to the crisis of housing affordability in London and the South-East, with the government claiming that allowing developers to produce more housing at greater speed would produce cheaper housing (Holman et al., 2018).
For all this, there has been very little appraisal of the impact of space standards on the number, distribution, and cost of small homes since the introduction of the 2010 Design Guide. Crucial here has been the lack of readily-available, spatially-disaggregated floorspace data that would facilitate such an analysis (see below) and, as such, this paper aims to enrich the evidence base concerning the numbers, distribution, and price of small homes in London using unique data matching procedures. Here, we define small or ‘sub-standard’ homes as those below the minimum NDSS threshold of 37 m2 for a one-person, one-bed flat (including a shower and at least 1 m2 of built-in storage). Taking floorspace data from 2.4 m Energy Performance Certificates (EPCs) issued in London between 2010 and 21, this paper maps the location of c.150,000 small homes, revealing that sub-standard homes are a feature of both Inner and, increasingly, Outer London property markets, with notable ‘hotspots’ emerging in areas where land values are high and demand for homes is growing. Additionally, by incorporating data from the London Planning Database, we explore whether the Permitted Development Rights which exempted conversions from space standards have been a significant contributor to the overall number of small homes. Finally, matching EPC records to the Registry’s Price Paid Data (PPD) allows us examine small home prices, with evaluation of their cost relative to larger homes suggesting they are less affordable per square metre. This paper does not therefore seek to reconcile the arguments for and against small homes, or the need for space standard enforcement per se, but aims to shed light on the production of small dwellings in London, 2010–21.
The small homes data deficit
The average size of new homes in England – unanimously regarded as amongst the lowest in Europe – appears to be declining sharply. For example, analysis of floorplans in 10,000 estate agency listings by LABC (2019) suggested the average new home fell from 83 m2 in the 1970s to 67 m2 by 2018, based on average room size data. However, contrasting research based on the English Housing Survey suggests national average floorspace rose from 34.8 m2 to 38.1 m2 per person between 1996 and 2018, and from 31.4 m2 to 32.6 m2 in London (Gleeson, 2021). Dorling (2014) likewise argues against the ‘shrinking homes’ discourse, noting the number of rooms per capita has increased over time. Indeed, when nations are ranked by number of rooms per dwelling then the UK comes top of the list, but when ranked by average room size it is at the very bottom (Appolloni and D’Alessandro, 2021).
However, commentaries based on median or average floorspace are misleading given the degree of space inequality evident in England. Notably, London is thought to have the nation’s highest proportion of very large houses (150 m2 plus) and the highest proportion of very small homes outside the seaside resorts of Blackpool and Brighton (Centre for Cities, 2019), suggesting that even if its homes are, on average, becoming larger, the number of very small homes could also be increasing. Corroborating this, Taylor et al. (2022) have linked unreleased Valuation Office Data to Census of Population (2021) data at the Local Authority, concluding London has the highest proportion of small homes of any region in England, and the widest range between the largest and smallest median floorspace (with the borough of Bromley having a median floorspace of 97 m2 and the City of London just 47 m2).
Here, problems of data aggregation are compounded by the lack of accessible, continuous data on useable floorspace at a fine-grained scale: Valuation Office data is not publicly-accessible, Census of Population data indicates number of occupiers/rooms, not gross internal area, and the English Housing Survey is based on a limited sample (e.g. 5288 physical surveys in the COVID-hit 2020–21 survey, with no internal inspections of properties). Orford (2010) hence integrated OS Mastermap and remotely-sensed Environment Agency LiDAR data to estimate floorspace at a finer-grained scale, but most assessments have used data from property listing sites. Özer and Jacoby (2022), for example, used machine learning analysis of select, scanned floorplans from the property portals Zoopla and Rightmove, concluding that 61% of London’s homes across all decades of construction were below the 2010 Design Guide minimum floorspace. While this analysis allowed the property’s decade of construction to be linked to floorspace, the analysis drew on a 5% sample of neighbourhoods, making it difficult to draw conclusions about wider trends: their commentary also said nothing about price, which is potentially important given the argument that developing more, smaller housing will make London more affordable (Holman et al., 2018). Property portals like Zoopla seem to contain all of the requisite data to support this kind of research but have important limitations: firstly, this data is not open for batch download except by application; secondly, details on the market-share and coverage of listings are not known; and thirdly, property websites indicate asking price not the actual price a home was sold for (Suss, 2023).
This paucity of accessible, spatially-disaggregated data hampers discussion of the local geographies of smaller homes, precluding longer-term assessment of their impact on urban housing markets. In this paper we hence show how regularly updated, open datasets such as Environment Performance Certificates (EPCs), when matched with the Land Registry’s Price Paid Data (PPD) and sub-national sources such the London Development Database (LDD), provide a basis for exploring spatial and temporal trends in small home development. Our focus on the very smallest homes, below 37 m2, is justified with reference to the guidance in place in London since 2010, and though homes below that threshold are not necessarily overcrowded per se, anecdotal evidence suggests occupiers may have lower levels of physical and mental health than those in larger homes (see Kearns, 2021; Preece et al., 2021). We hence use matched data to draw inferences about overall trends in sub-standard homes, their distribution across the capital, and, where sold, their selling price, ultimately questioning – in the context of a long-running ‘housing crisis’ – the claim that increasing the overall number of smaller homes will provide more affordable homes for Londoners.
London’s housing crisis and the production of sub-standard homes
London has long offered small homes to newly-arrived residents, especially migrants. In the post-war era, for example, the unsanctioned subdivision of terrace properties created sub-standard lodging houses occupied by racialised minorities (Cartwright, 2020). While these illegal practices were seemingly on the wane in the last decades of the twentieth century (though see Lombard, 2019), the pressures encouraging the production of small housing in the capital grew more intense as London’s ‘housing crisis’ deepened in the twenty-first century. Average house prices in 2016 in London were double the national average, rising to as much as six times the national average in hotspots like Kensington and Chelsea thanks in part to overseas investment, much of this in the form of Real Estate Investment Trusts (Hamnett and Reades, 2019). Consequently, more of London became unaffordable to the average wage earner than ever before: according to the ONS (2022), median house prices were 12.5 times the average local salary. While prices declined 2022–23 as the general cost of living rose, rentals continued to rise at 20% per annum, with London renters in the private sector spending an average of 53.6% of post-tax household income (excluding housing benefit) on rent, compared with a more manageable 33% in North-East England (Alan Boswell, 2023). As such, new definitions have been introduced given national measures of affordability simply do not apply in London (e.g. London Living Rent is two-thirds of market rate, whereas in much of the country it is 80%).
In this context, the 2013 removal of the requirement to conform to space standards when converting offices and commercial into residential properties was an attempt by the government to boost housing supply, especially in London and the South-East where both demand and land prices were high (Park, 2017). In 2017–18, 13.4% of all new dwellings (29,720 of 222,190 additions) were created nationally via the light-touch ‘Prior Approval’ PDR route, with uptake highest in London (Wiles, 2020). While not all PDR conversions produce sub-standard homes, Ferm et al. (2021: 2049) argue that office-to-residential conversions created via PDR were ‘skewed towards smaller (studios and one-bedroom) units compared with conversions through planning permission’ and ‘less likely to meet national space standards or have amenity space’. Others have alleged that facilitating sub-standard conversions was ‘reckless and short-sighted’ given ‘living in a space the size of a typical hotel bedroom will inevitably put strain’ on occupiers (Park, 2018: 10). Such conclusions mirror Kearns’ (2022) arguments about the negative mental health consequences of living in sub-sized housing, something that came to the fore during COVID-19 lockdowns when it became evident many Londoners were struggling to combine working and living in smaller homes. Interviews conducted by Preece et al. (2021: 14) with those in homes ‘near or below’ NDSS concluded ‘participants in small homes reported a sense of life merging into one, boredom and in some cases anxiety and stress, exacerbated by the inability to vary their use of space’. Such assessments, when coupled with negative headlines about ‘rabbit hutch’ homes, informed the 2021 reform of Permitted Development Rights which now insists that space standards must be adhered to in conversions.
Yet, not everyone opposes very small homes. Arguing against the imposition of minimum space standards, Kichanova (2019: 8) claims young Londoners are ‘comfortable with living in smaller apartments’ because micro-homes are ‘smart, modern, custom-designed units’, ‘often accompanied by communal amenities such as games rooms and open living spaces’. The suggestion here is that they match young Londoners’ aspirations for city-centre living, and that some occupants are happy to trade space for location. Indeed, new micro-apartments are frequently marketed as suitable for young urban professionals, or described as ‘student-friendly’, suggesting the distinction between student and post-student accommodation is blurring in the capital (Harris and Nowicki, 2020). However, the provisioning of gyms, private cinemas and rooftop gardens in some schemes suggests micro-apartment developers are not always aiming to provide affordable homes for young Londoners but catering primarily to foreign investors and members of the ‘transnational elite’ seeking an urban crash-pad (Glucksberg, 2016). But before questions of who occupies small homes in London can be broached, more fundamental questions remain unanswered, namely, just how many small homes are there in the capital? Have they increased in number? And where are they?
Utilising energy performance certificates as measure of home size
Domestic EPCs offer an accessible source of information on home size since the calculation of energy efficiency ratings entails the collection of data on floorspace, glazing, and other internal features. These certificates were introduced in 2007 as part of the now-defunct Home Information Packs which needed to be compiled for purpose of a house sale, and from October 2008 were also made compulsory for all new-build properties on completion. At the same time, they also became compulsory for lettings, leading to an initial ‘surge’ in issues as landlords brought older properties into compliance with new regulations. Our analysis therefore begins after this surge, in 2010, at the point where the London Design Guide introduced new minimum standards for housing.
Between 2010 and the end of 2021, roughly three million certificates were issued for properties in London, a city with an estimated 3.7 million domestic properties; of these, 205,214 certificates were for properties below the NDSS baseline of 37 m2 for a one-bedroom, one-person flat. There were, however, only c.150,000 uniquely-identifiable properties in this GIA range: given EPCs must be renewed after 10 years, and many owners will request a new certification after improvements to demonstrate an improved energy efficiency rating, this suggests many properties were issued more than one EPC in our study period, meaning we took only the first-issued EPC for each property (see below). As well as removing duplicate records, we removed all EPCs smaller than 10 m2 (2371 certificates representing 2101 unique properties) to strip out property in institutional settings (e.g. student halls of residents, retirement homes) which are not designed as permanent homes per se. This is potentially problematic, as there are a few known instances of flats less than 10 m2 reaching the market (e.g. in 2020 a 7 m2 flat in Clapton was marketed at £50,000), but such instances are exceptionally rare.
There are, however, other potential limitations of EPCs as indicator of property size which are less surmountable. EPCs are subject to measurement error: repeat assessments of the same property sometimes yield different energy efficiency ratings and floorspace because the measurement procedures followed by assessors are not tightly-defined (Crawley et al., 2019). Notably, guidelines allow the use of either internal or external dimensions, and procedures for dealing with internal partition walls and chimney breasts are vague (Nagarajah and Davis, 2019). To explore this issue further, we visited seven neighbourhoods (MSOAs) that showed up in our analysis as ‘hotspots’ of small homes in both Inner and Outer London (see below): Canary Wharf (Tower Hamlets), St. John’s Wood (Westminster); Colindale (Barnet), central Croydon, central Lewisham, Wembley (Brent), and Wimbledon (Merton). We found two forms of ‘small home’ with a distinct spatial patterning discussed later: flats in subdivided houses, and flats and studios in newly-built or recently-converted properties. It proved impossible to verify the square meterage of flats in (typically) older subdivided properties unless these had been on the market recently, so we focused on new-build developments, and obtained floorplans via borough planning portals as well as, for comparison, estate agents’ listings.
Comparing these data sources revealed some discrepancies: one large development was approved by the local authority as a mix of 189 apartments between 47 and 104 m2 but appears to have been built with flats generally smaller than the lower figure, perhaps indicating a construction error or mistake in the submitted plans. Conversely, other developments appeared to have been constructed as per plans submitted to local authorities, but the useable floorspace differed from that indicated on the EPC, suggesting errors in the latter. In general, it is thought around one-in-four EPC-reported floorspaces differs by 10% or more from the ‘true’ habitable floorspace; Nagarajah and Davis (2019) suggest that 56% are underestimated and 44% overestimated. We found only a few cases where EPCs overestimated flat size, it was more common to find flats measured at or below 37 m2 on the EPC appearing to just exceed the NDSS on floorplans. However, in only three cases (across 62 new-build developments of more than 10 units where floorplans could be sourced) did flats estimated as sub-37 m2 on an EPC appear more than 10% larger (i.e. above 42 m2), amounting to 132 of some 3200 units (4%). This suggests that even if EPCs are not entirely reliable indicators, they do not differ from ‘the reality’ enough to meaningfully impact our general findings.
Data matching and price paid data
Noting these caveats about measurement accuracy, when matched to the Land Registry’s PPD, EPCs allow us to develop a fairly robust estimate of the price per square metre for domestic properties (Chi et al., 2021b; Fuerst et al., 2016). Both PPD and EPC data are regularly updated and available for bulk download for non-commercial research purposes. Linking these datasets together provides opportunities to assess the geography of sub-sized homes using transaction and energy-related attributes. While delays in reporting property sales – in a few cases these amount to a year or more – may create latency in the creation of a PPD record, the transaction date remains accurate in all cases.
It might seem straightforward to match addresses across two property datasets, but that assumption ignores the nature of large-scale redevelopment which often leads to changes in postcode, street and building names between the issuing of an EPC and a property’s sale or rental. In 2022, EPC data was revised to include Unique Property Reference Numbers, which will simplify data linkage, but before this researchers have had to use a mix of deterministic and probabilistic approaches: Chi et al. (2021a) employed more than 200 matching rules, while Comber and Arribas-Bel (2019) used Conditional Random Fields to make probabilistic linkages between EPC and PPD. Our method was different again, employing fewer rules (to minimise overfitting) but more intensive computation, such the use of the Minimum Edit Distance (as implemented by Hyyrö, 2001) and spatially-constrained queries to improve matching on conversion and in-fill projects (Figure S1).
Our approach produced an overall match rate of 81%, which was consistent across the study period. While lower than the 91% reported in Chi et al. (2019), the most recent version of this data (Chi et al., 2021c) includes ten million records where the date of transfer in the PPD appears to precede the EPC inspection, with 177,814 from London dated after August 2007 when EPCs became mandatory for sale or rental. Further analysis showed that when a sale preceded the issuing of an EPC the median difference was 3.46 years (mean: 4.19 years) and the maximum was 13 years, which is substantially longer than the period of validity for an EPC. Logically, this is the result of searching for any match able to yield a price per square metre rather than strictly adhering to the sequencing of the inspection and sale. Our priority was, instead, identifying the first time an address appeared in the EPC register, regardless of purpose, and then restricting our analysis to that first address occurrence to avoid double-counting properties that had multiple EPCs issued during the study period. Controlling as best we could for this difference in approach, and aligning the two study periods in respect of both transaction (PPD) and inspection (EPC) dates, we obtained 873,981 matches shared between the two datasets: implying that we matched 93% of the matches in Chi et al. (2021c), and that they matched 85.6% of ours; however, in the absence of an unmatched data file (and the unique LMK identifier, which seems to be missing) from Chi et al.’s process it is not possible to determine the extent to which this is a function of latency in the PPD data (see Figure S3 for indicative rates by year and Figure S4 for a comparison against Chi et al.’s results at postcode level).
Our validation checks also showed that the smallest and largest dwellings (as measured by the floorspace attribute on the EPC) matched less-often than mid-sized dwellings (Figure S2); this is consistent with alternative ownership structures such as shared equity, indirect ownership, and communal ownership being more common at the extremes of the property market (i.e. very small and very large properties). The match rate also varies significantly across London: Westminster, Kensington and Chelsea, and the City of London have the lowest match rates (less than 40%) while Havering, Bromley, and Bexley all match at over 90%, consistent with the fact there are EPC exemptions for listed buildings and those intended for occupation less than 4 months a year.
To explore questions not of property price per se but relative affordability, we geo-referenced postcode centroids to create look-up files for Borough, Middle Layer Super Output Area (MSOA) and Broad Rental Market Area (BRMAs). Information on Local Housing Allowances (LHA) was obtained to provide details on local rents (the LHA is set at the 30th percentile in each BRMA), and then compared to the number of sub-37 m2 homes in the area. Whilst affordability is often calculated by pegging median housing cost to local average income (Meen, 2018), the LHA indicates the actual levels of housing benefits for tenants renting from private landlords in a BRMA, providing an indicator of local housing costs against which to gauge the relative price of small properties.
Lastly, planning data was used to understand if PDR has been a major driver of small home development. This data was taken from London Datastore’s Datahub Prior Approvals Analysis file, December 2021 (Greater London Authority, 2021). The download includes details on application type, Northing and Easting coordinates, and a variety of details about the scheme, including a description, decision date, and (most importantly) the number of residential units proposed. Here, merging with an ancillary dataset on development completions and selecting only ‘Prior Approval’ applications allowed us to filter out speculative proposals and retrieve a count of completed units in converted properties to use in our matching. Together, these combined data sources allowed us to explore the significance of PDR in the production of new small homes in London, as well as clarifying the overall number, selling price and location of new small homes completed, 2010–21.
Small domestic properties in London 2010–21
Analysing the indicated floorspace in the first EPC issued for unique properties in London 2010–21 allows us to explore trends in the number of sub-37 m2 properties in the capital. Over the study period, small homes represented about 7% of all properties for which EPCs were issued. This includes 4.4% of all EPCs issued for newly-completed units, but 11% of EPCs issued for the purpose of rental or sale, implying most small domestic properties extant in London are actually flats in properties completed before 2010. Yet, the rate at which newly-completed sub-37 m2 homes were registered increased dramatically in the second-half of the study period, rising from a low of 4% in 2014 to over 8% of EPCs issued to new properties in 2021. Overall, this suggests nearly one-in-ten new homes in London are now below the recommended minimum size for a one-bed, one-person flat.
Figure 1 shows the distribution of floorspace across London’s housing market, focussing only on newly-completed dwellings being issued EPCs and not those which were completed prior to 2010. As is typical with housing data, this has a long tail with some very large properties reaching over 1,000 m2, albeit Figure 1 shows most newly-developed properties are in the range 47–87 m2. The observed London average of 77 m2 is actually higher than the national average of 67.8 m2 for all new-build homes since 2010 (LABC, 2019), and nearly twice the minimum NDSS for a single-bed property, suggesting the presence of very large homes in the capital considerably skews this floorspace average. Newly-built London homes by floorspace.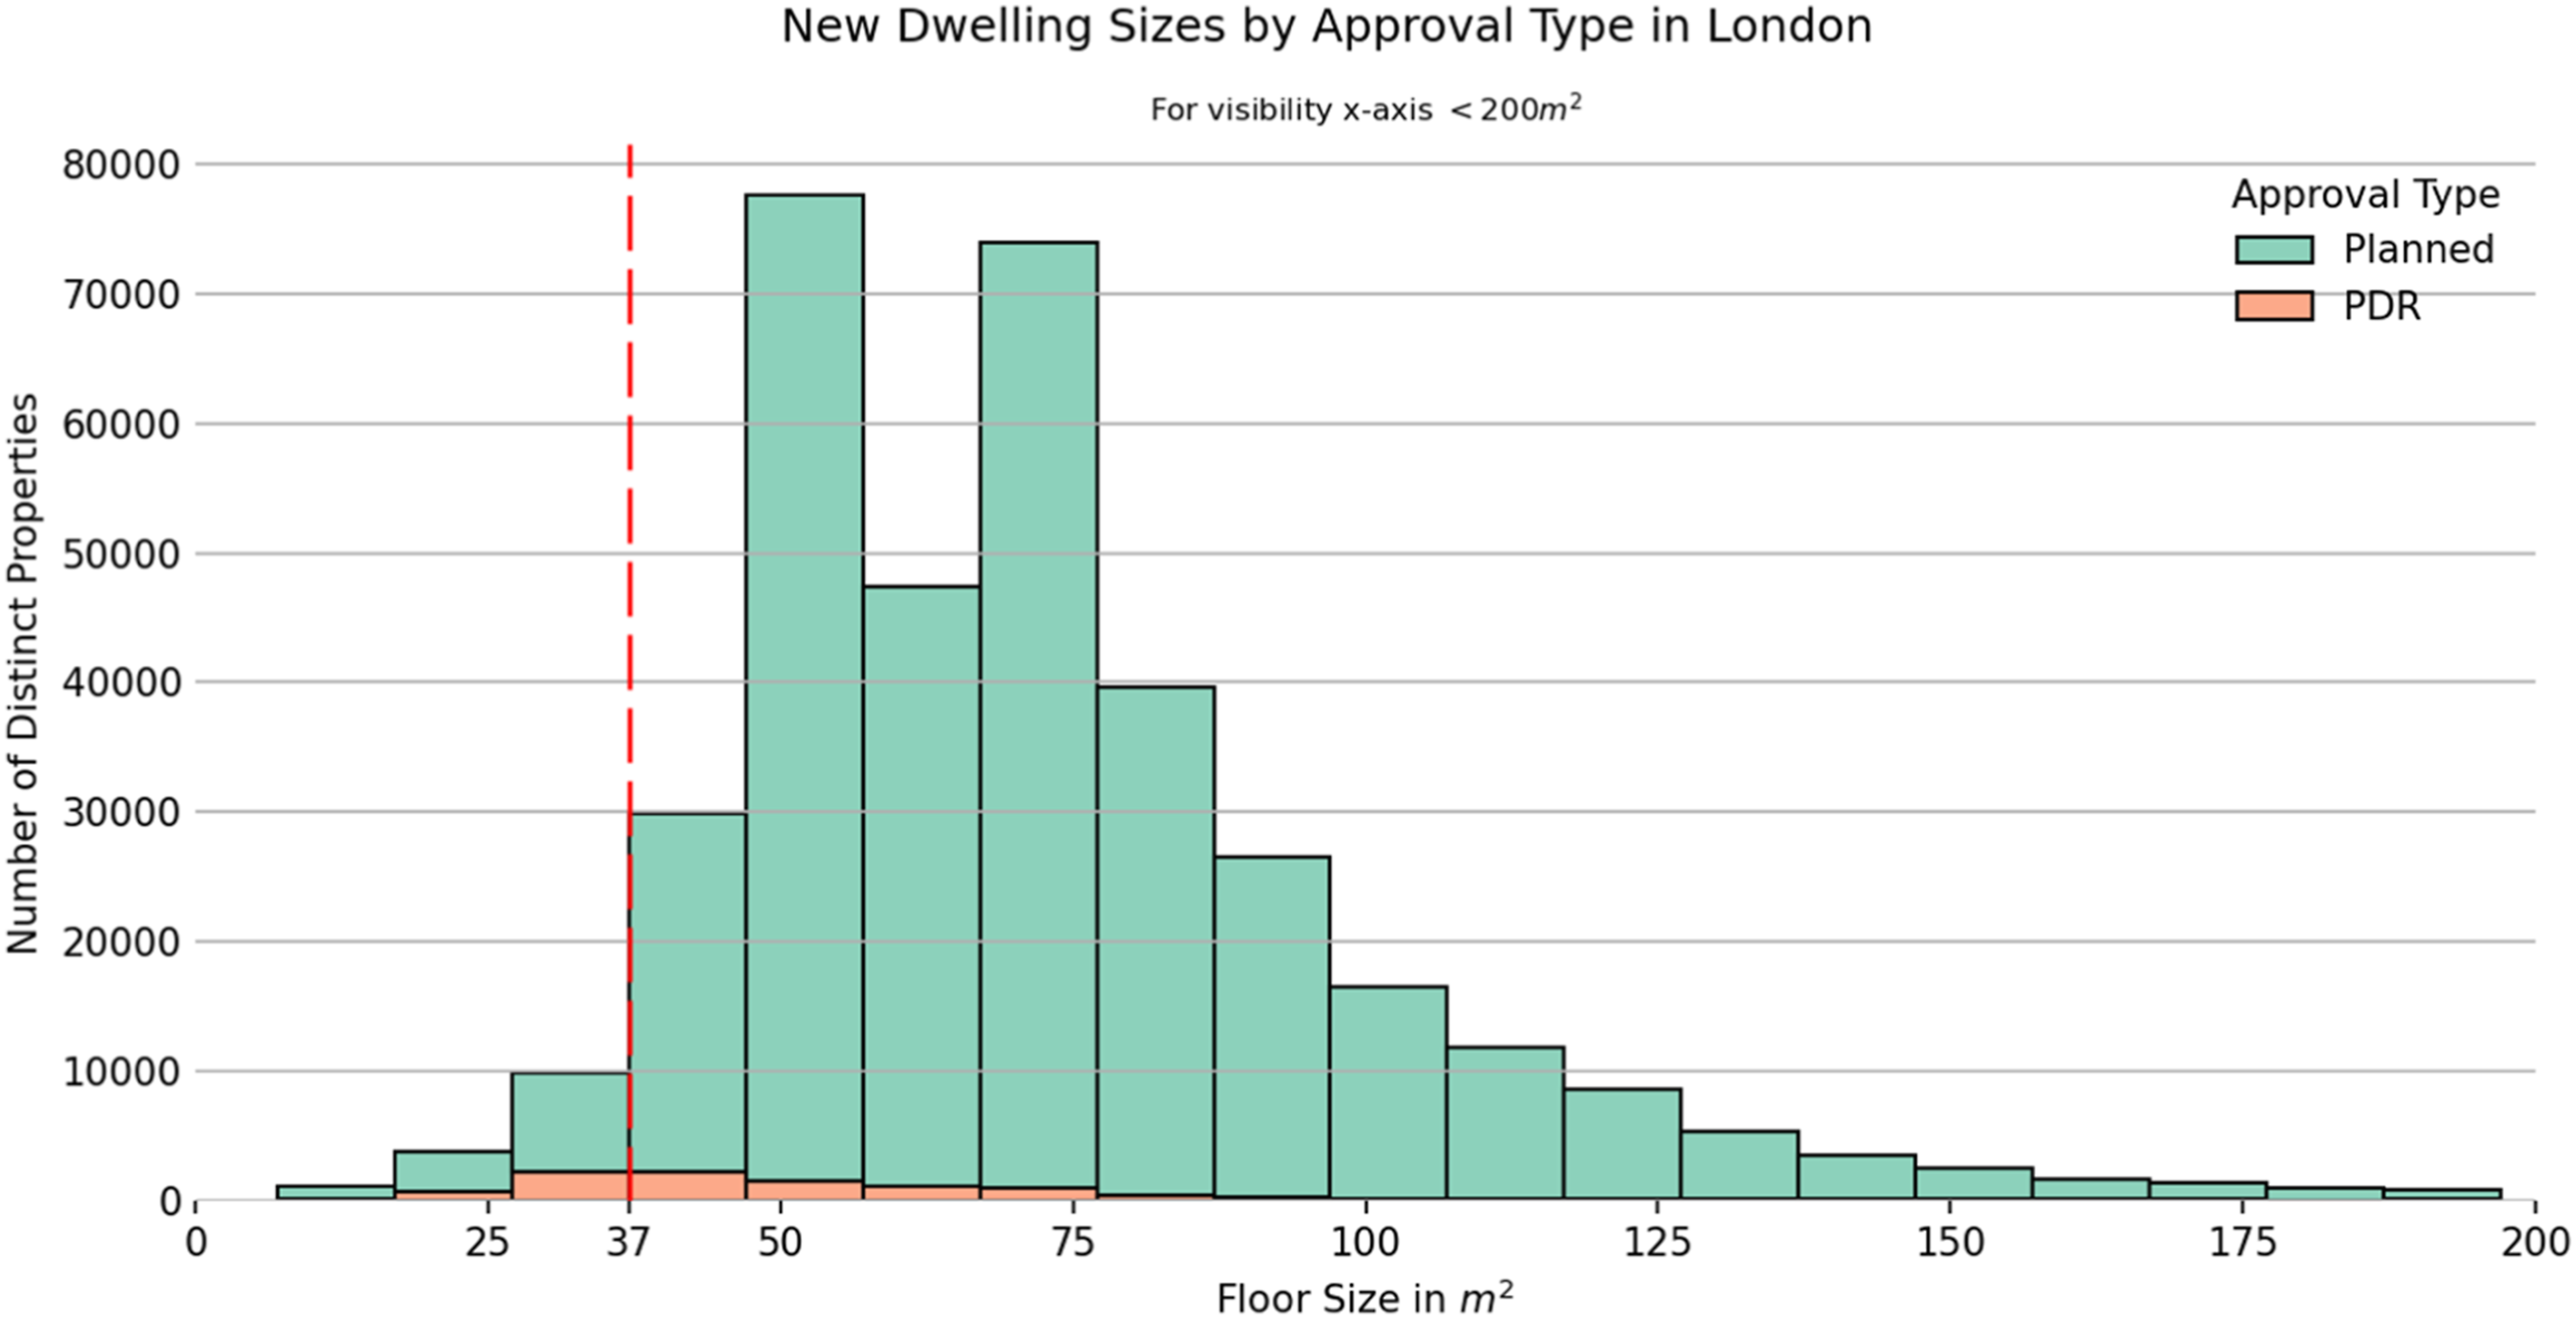
Given PDR conversions do not have to conform to space standards, they have been identified as a major source of sub-standard housing (Clifford and Ferm, 2021; Park, 2017). Figure 1 hence also indicates the share of the total number of small homes developed through PDR rather than through the formal planning system: this shows PDR conversions are more likely to produce sub-37 m2 homes than developments approved through the normal planning system, but that the overall number of small dwellings produced under PDR constitutes a small share of the total.
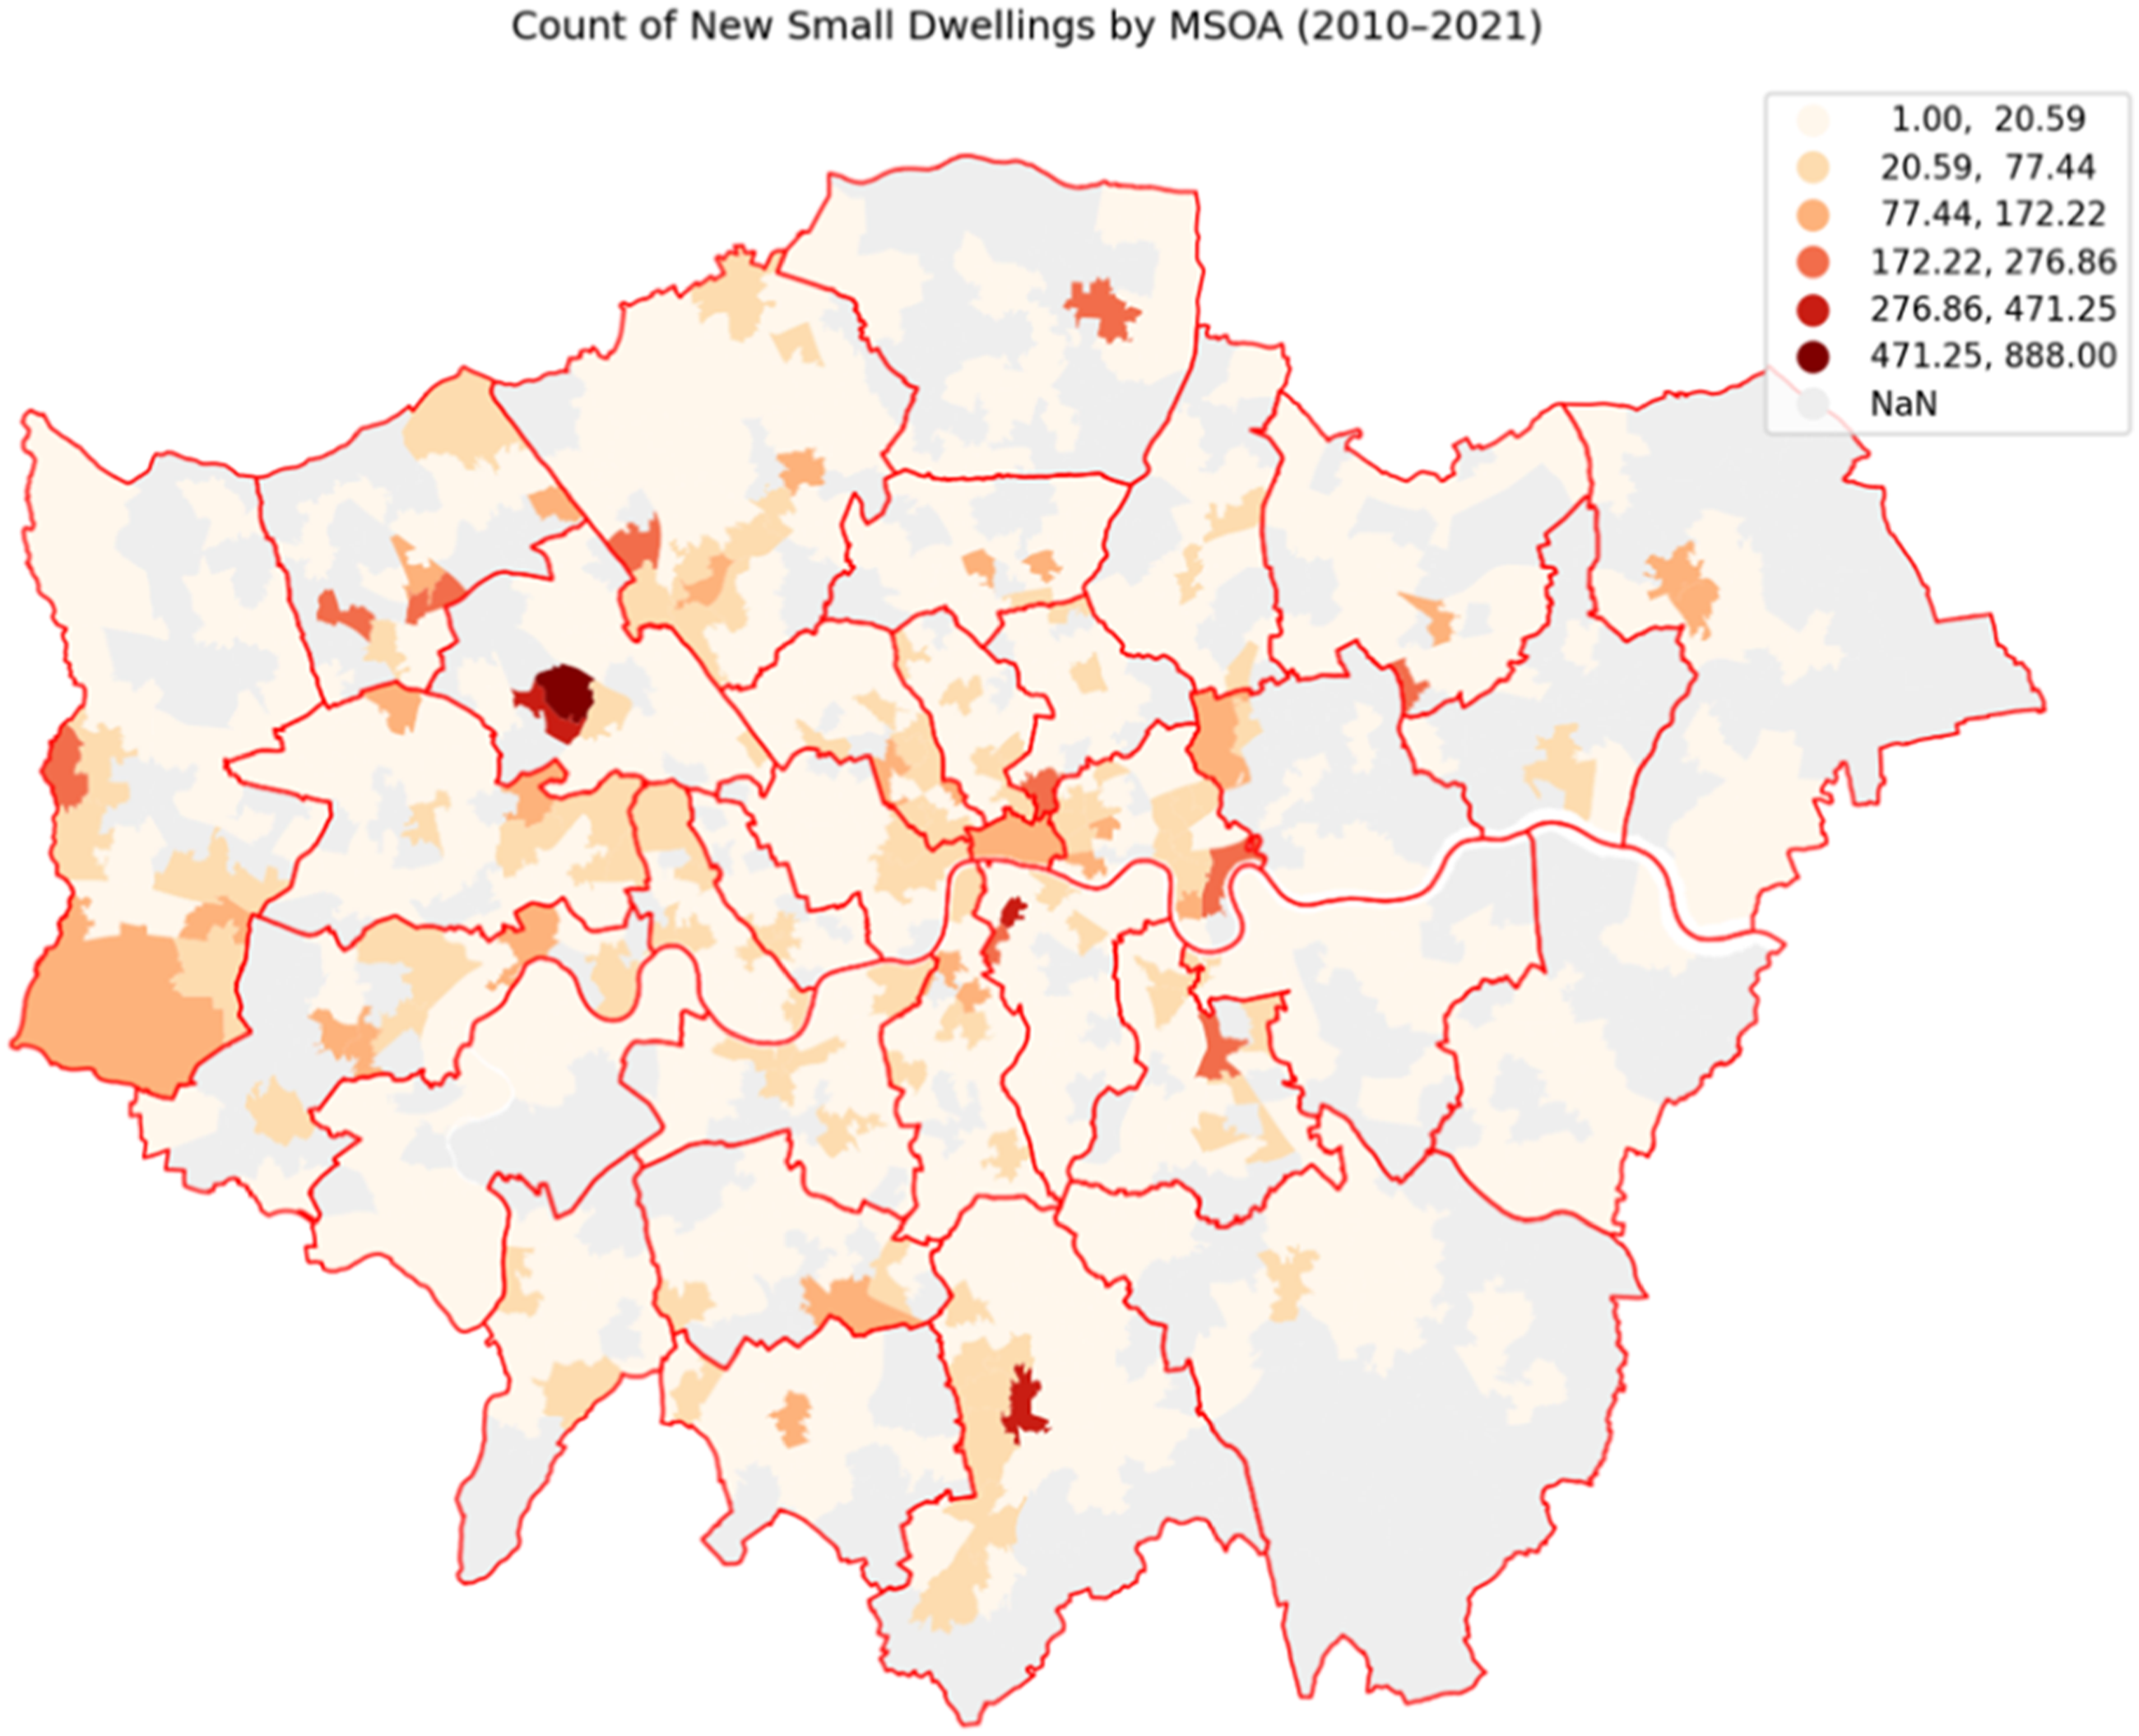
Mapping sub-37 m2 homes by MSOA (a proxy for neighbourhoods), we find small homes most prevalent towards central London (Figure 2), albeit with some outliers (e.g. Croydon and Wembley). Kensington and Chelsea, Westminster, and Tower Hamlets appear to have generally high numbers of small homes. Given that historically higher land prices in these Boroughs have encouraged the subdivision of very large, prestigious homes into smaller, denser properties (Bracke, 2015), this is hardly surprising. However, when we look solely at newly-developed small properties we see a somewhat different pattern (Figure 3): the hotspots are now sub-regional centres in outer London including Croydon, Brent, and Harrow, for instance. Overall, our mapping suggests small homes appear to be of two main types: small properties for rent in central London developed pre-2010 and newly-developed small properties in more-dispersed locations post-2010 built for both sale and rent. All sub-37 m2 homes by MSOA 2010–2021. Newly-developed sub-37 m2 homes by MSOA 2010–2021.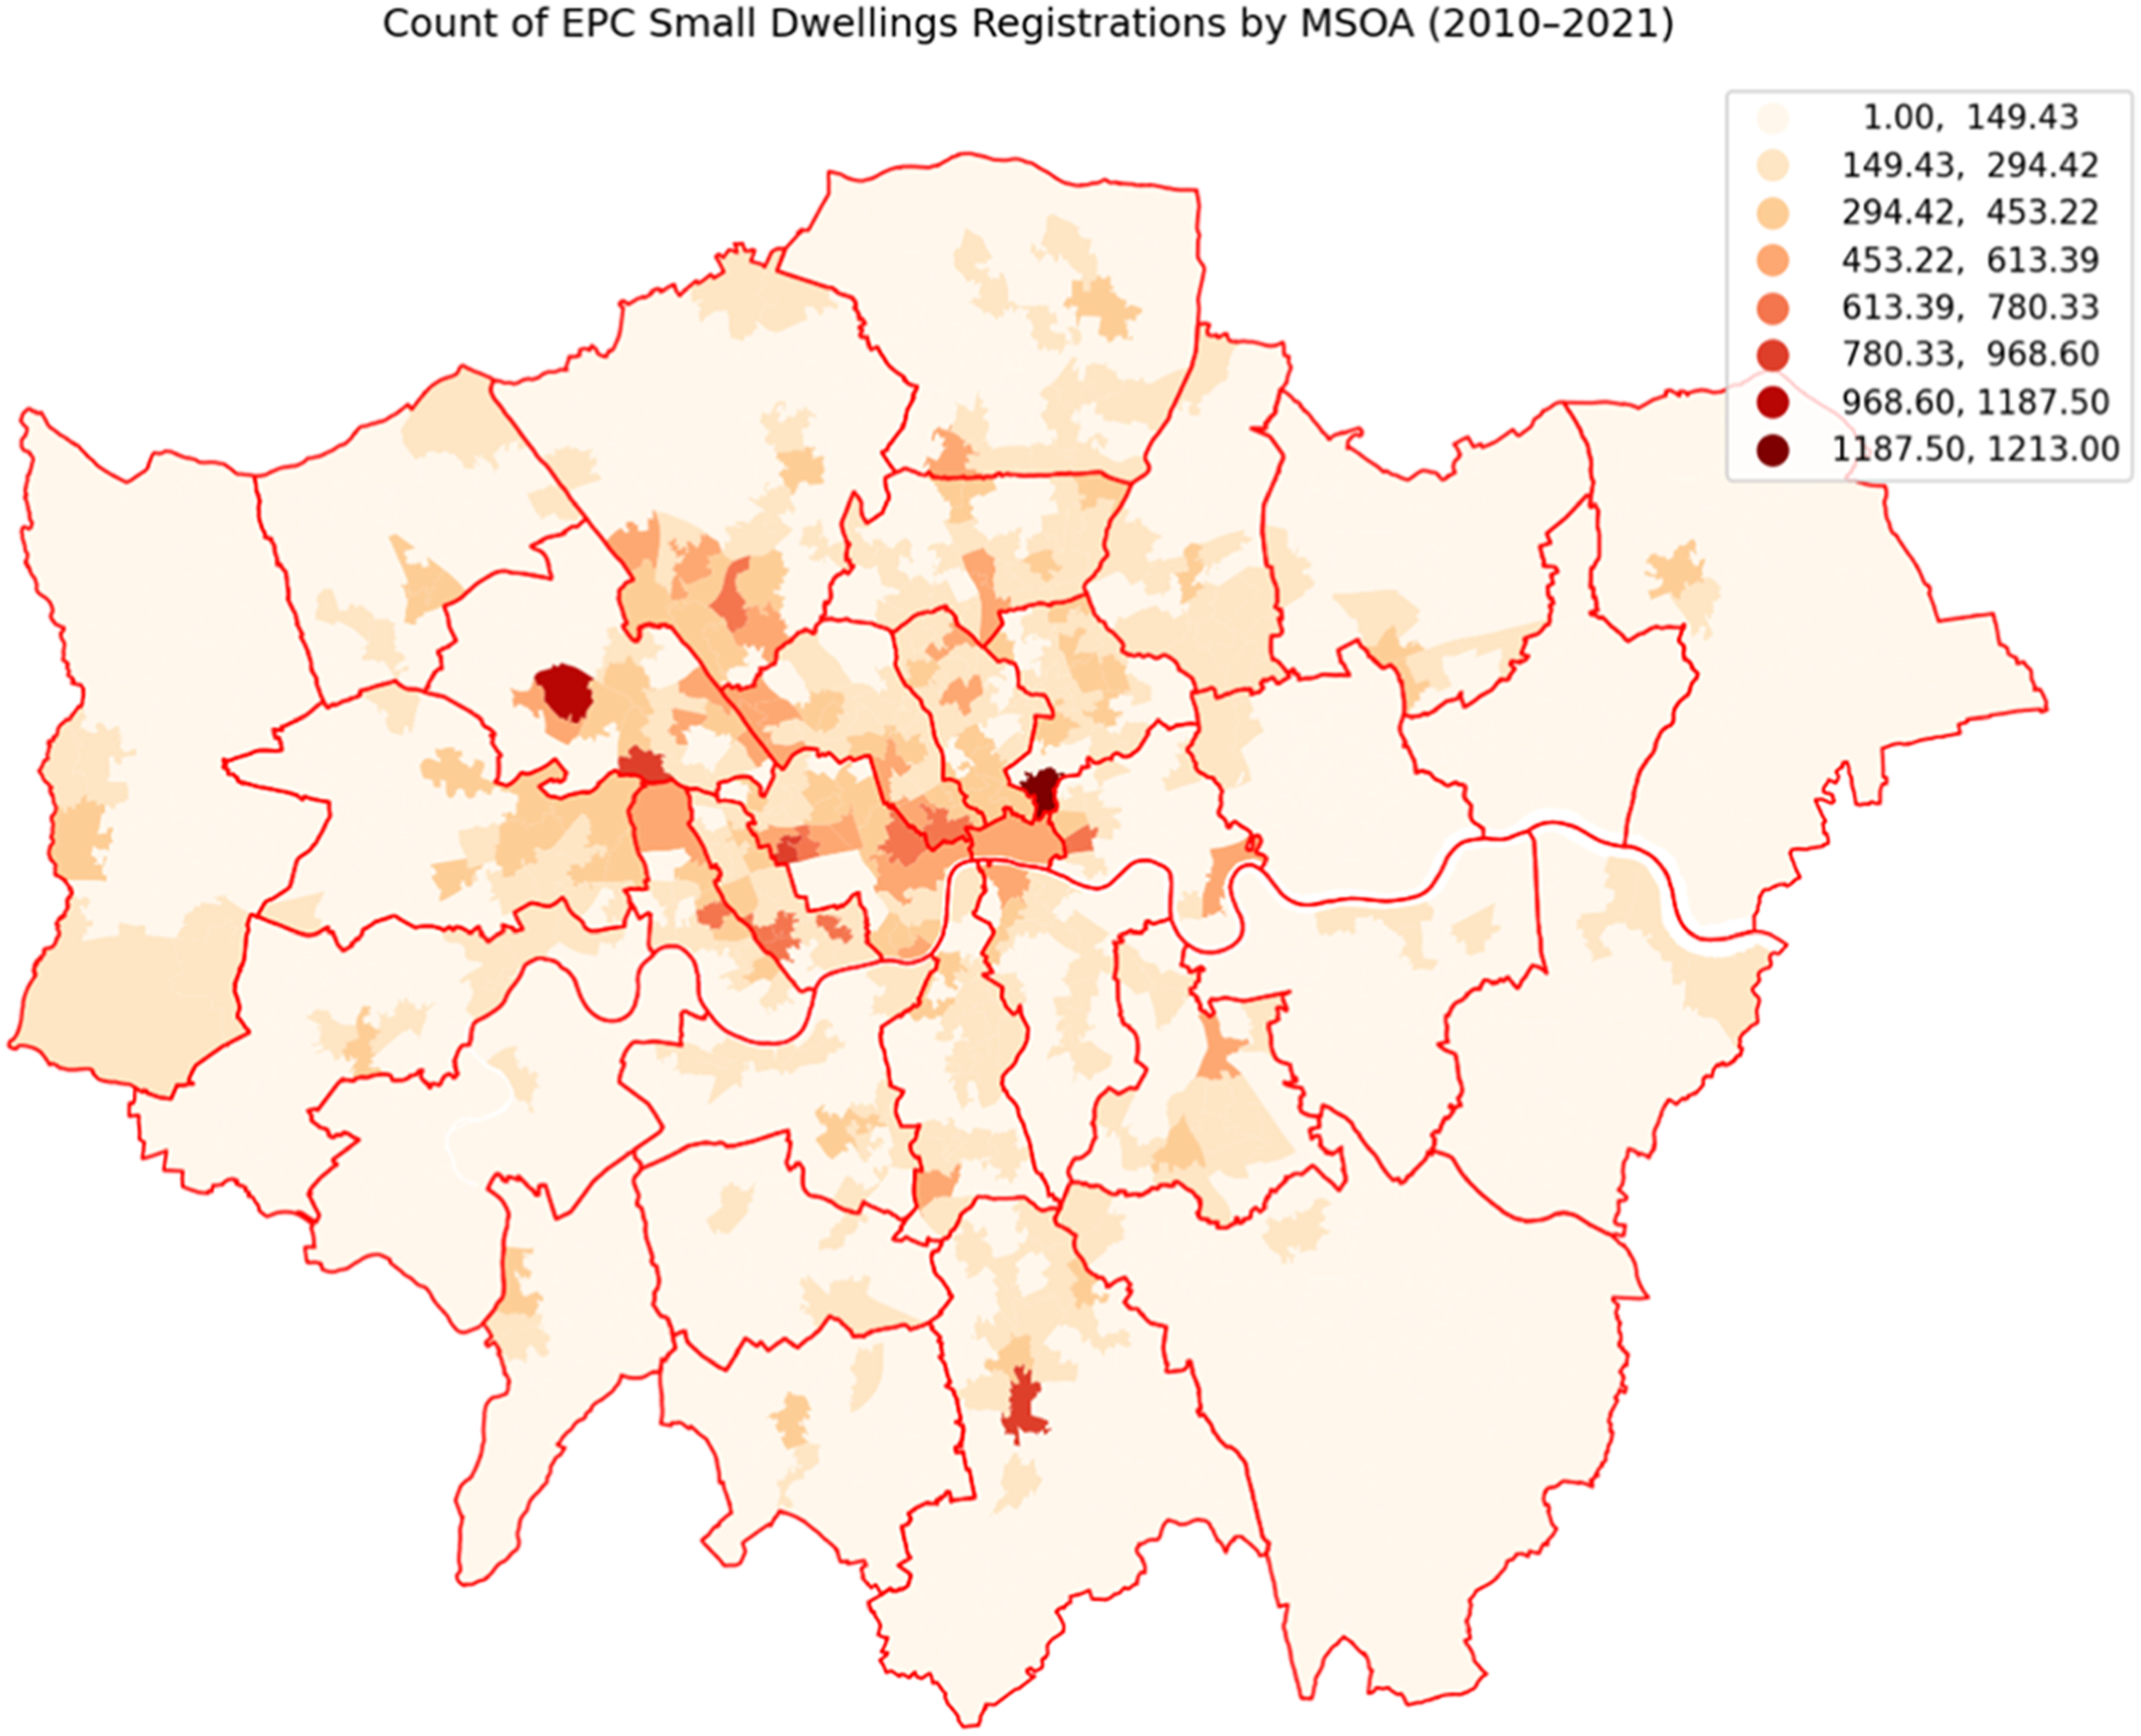
Given the assumed relationship between PDR conversion and the emergence of small homes (Park, 2017; Clifford and Ferm, 2021), there should be more small homes in neighbourhoods where there have also been significant numbers of PDR conversions. However, this does not appear to hold true: comparing the number of completed PDR units in the London Development Database to the overall number of small homes in the same MSOA shows a weak positive correlation (slope: 0.231, Adj. R2: 0.143, p-value: 0.000, and, after removal of two outliers: slope: 0.361, Adj. R2: 0.216, p-value: 0.000). Hence, while many sources have suggested Permitted Development Rights are a major source of small homes, Figure 4 suggests most small homes either predate the Prior Approval process introduced in 2013 or were granted formal planning permission by the local authority in question (noting some of the divergence visible in 2020 and 2021 may be because units were not yet recorded as completed in the London Development Database despite having been issued an EPC). Related examination of the London Planning Database suggests only around 15% of units in major PDR conversions of more than 10 units are below the NDSS (see Chng et al, forthcoming), a figure lower than suggested in some other, more narrowly-focussed, studies of permitted development (Clifford and Ferm, 2021). Newly-built homes granted an EPC, 2010–21, comparing those with planning permission and those completed via PDR.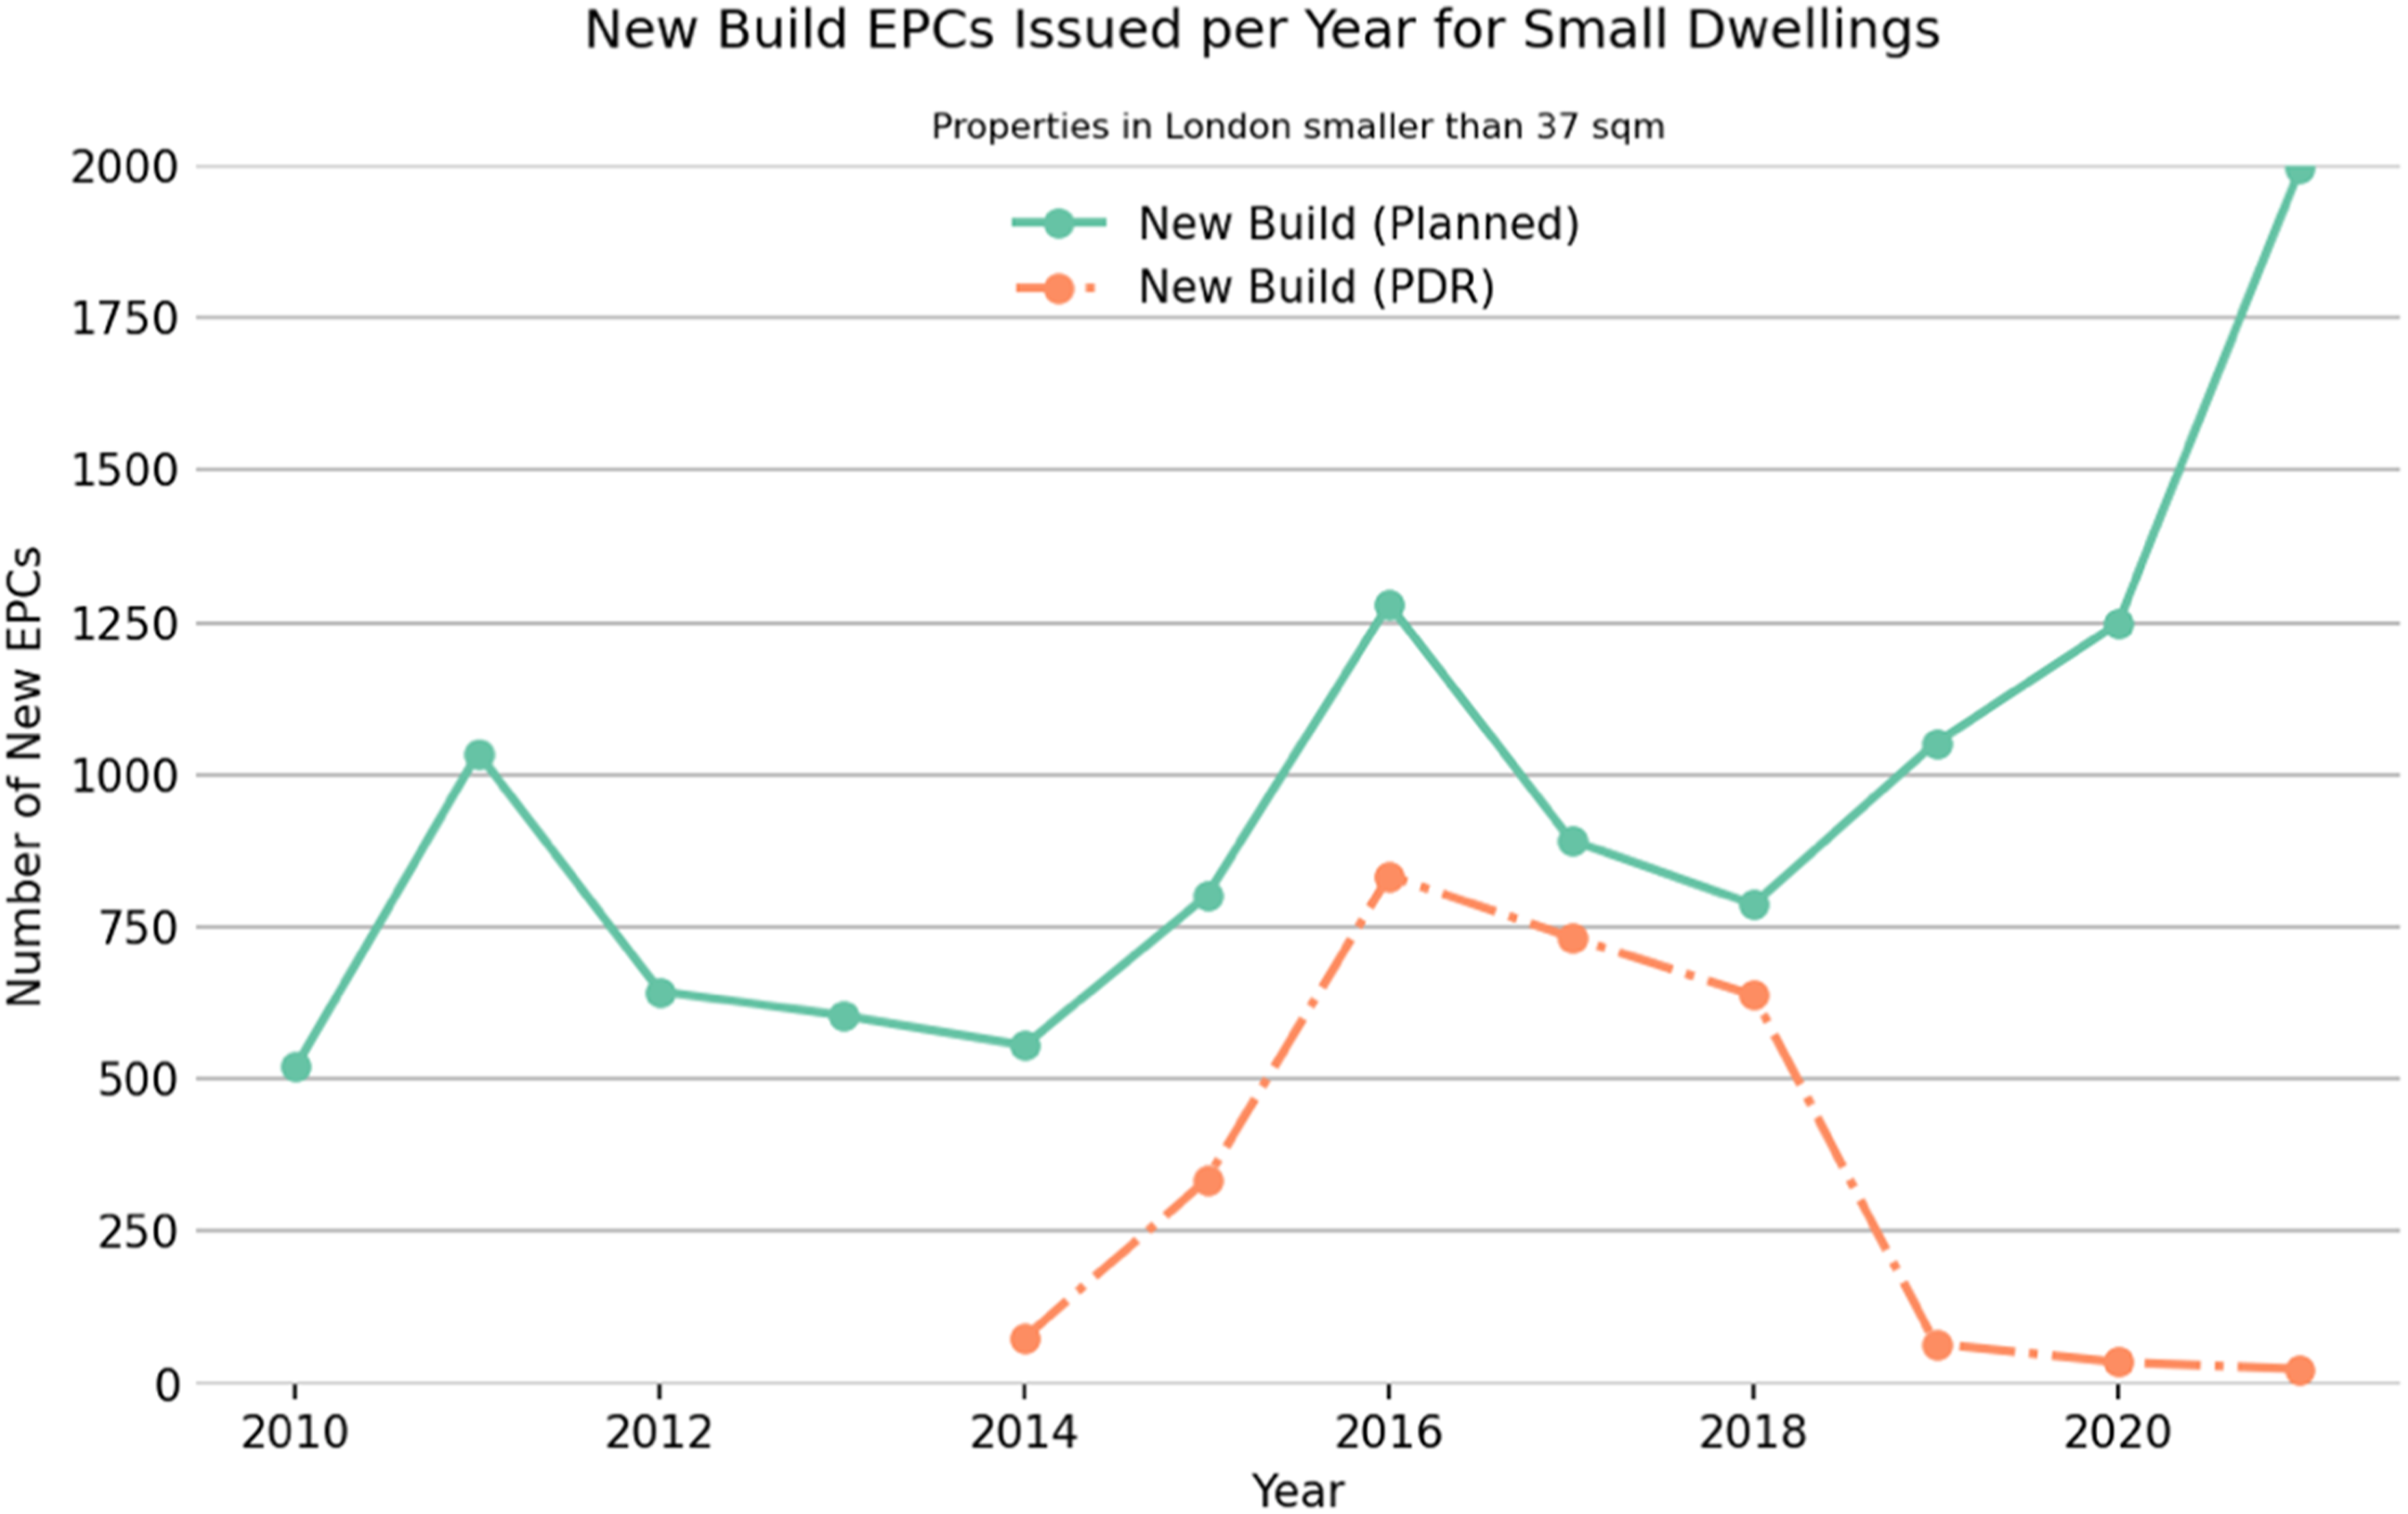
Are small homes in London affordable?
Our initial analysis of small domestic properties in London hence confirms some assumptions but confounds others. For example, while the number of newly-developed sub-37 m2 flats increased rapidly after 2014, reaching 8% by 2021, homes between 49 and 56 m2 grew at a much faster rate, quadrupling between 2010 and 21, suggesting there has been more rapid growth in the number of two-person flats than micro-apartments for urban singles. Moreover, despite PDR being taken up with enthusiasm by developers and landlords, the majority of newly-completed sub-37 m2 flats completed after their introduction were actually ones granted formal planning permission, despite being below the advised minimum floorspace indicated in the London Design Guide (2010) and NDSS (2015). This suggests that newly-developed small homes are not as obviously linked to planning deregulation as some have previously suggested (e.g. Park, 2017).
Yet, the evidence does show the number of newly-completed sub-37 m2 homes in the capital has been increasing. Given the relative unimportance of PDR, the only conceivable explanation is local authorities have allowed these developments because they regard the additional homes as serving local housing needs. Indeed, small homes could be considered beneficial in the context of London’s housing crisis if they create a pool of more affordable properties for those struggling to afford larger ones. To explore this, we correlated the total number of small homes for rent in each Broad Rental Market Area (BRMA) against the local level of Local Housing Allowance (LHA) – the amount those on housing benefit can claim for private renting per week. This showed there are more generally more small homes for rent in areas with higher House Allowances (Figure 5; slope: 171.419, Adj. R2: 0.406, p-value: 0.008). Looking at housing smaller than 37 m2, it is also clear that the housing in more expensive BRMAs has a generally smaller floor area (slope: −0.057, Adj. R2: 0.20, p-value: 0.064). This implies that smaller housing tends to be in the more expensive rather than more affordable parts of London, and that in the most expensive areas it tends to be smaller than elsewhere in the capital. This is not wholly unexpected, as it implies that small homes are particularly found in areas where rents and land values are high, being less ‘needed’ in cheaper areas where homes are (theoretically) more affordable to the ‘average’ Londoner. Relationship between Local Housing Allowance and number of small units (left) and median floor space (right) by Broad Rental Market Area.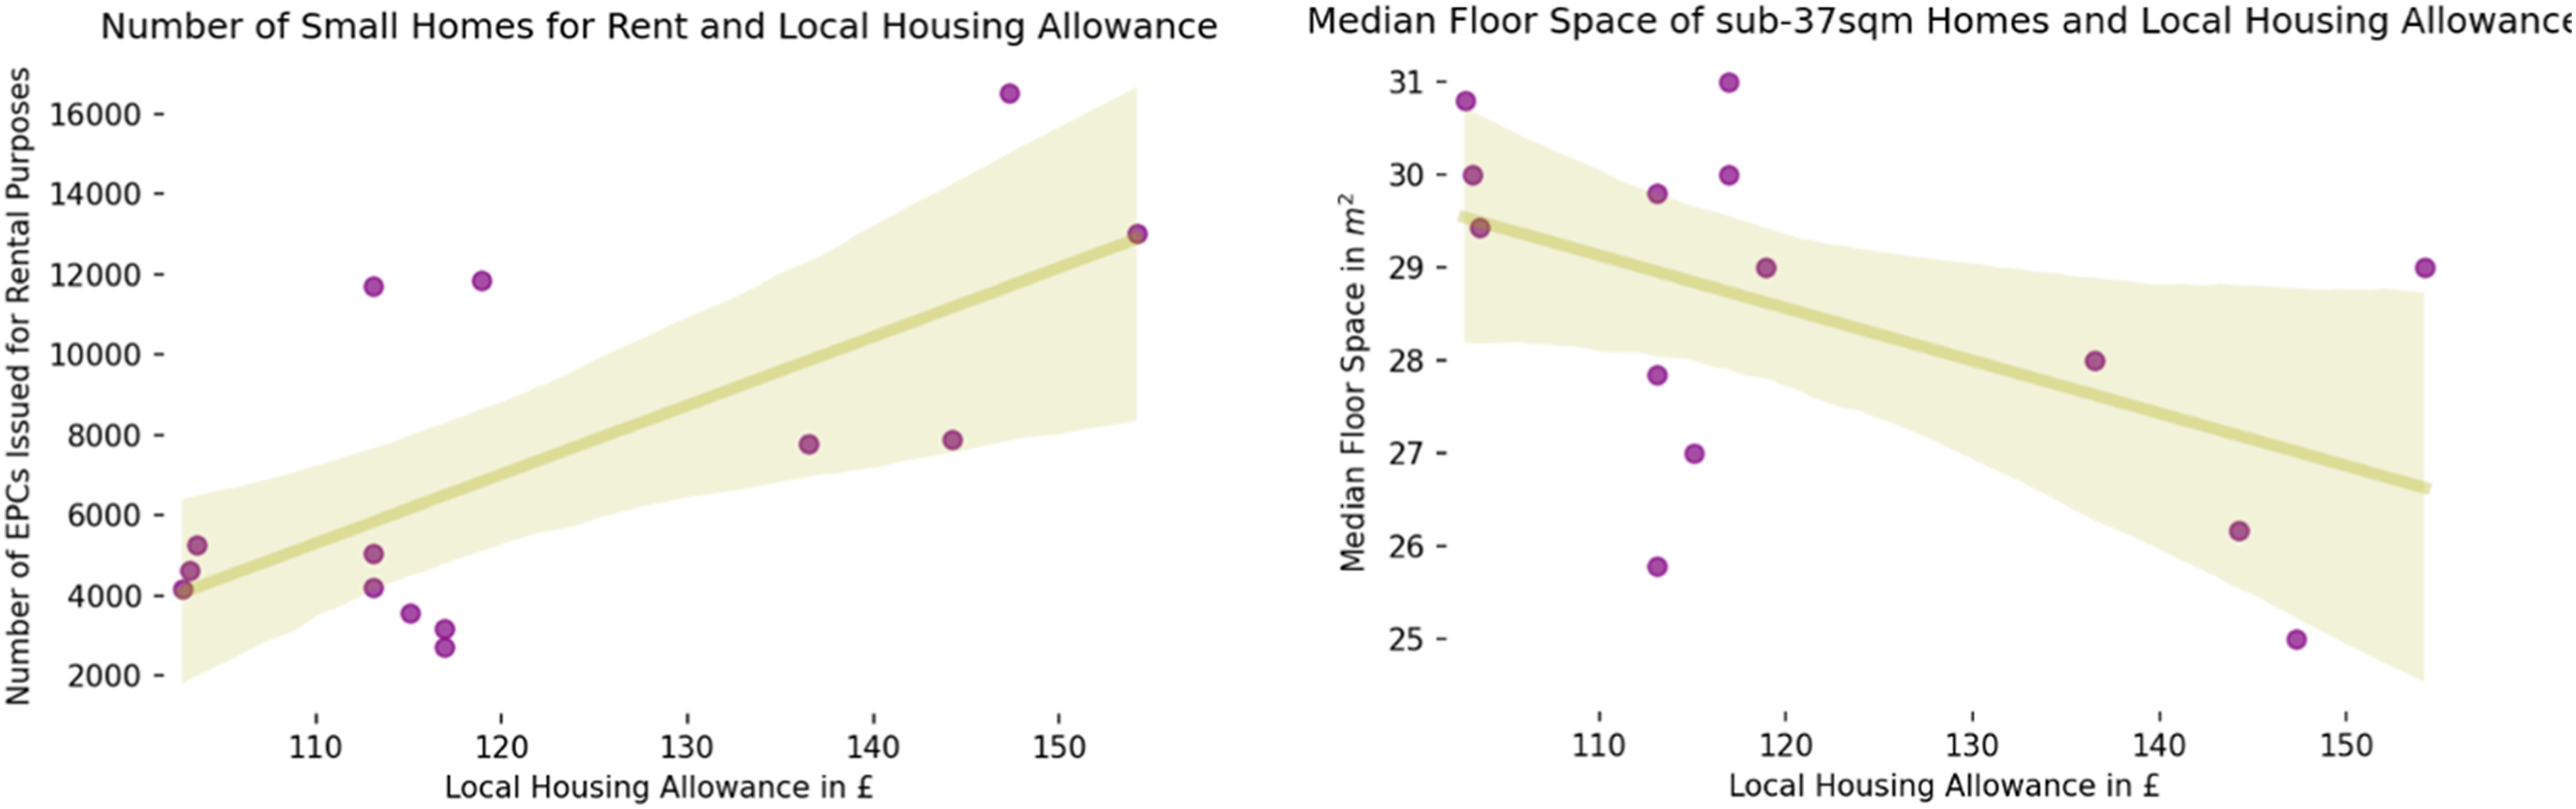
Yet, there are multiple instances of micro-homes being developed in more peripheral areas where rents have been historically cheaper. Indeed, since 2014 sub-standard homes were delivered at a faster rate in Outer West and North London than Inner and Central London (Figure 6). In Outer London, micro-homes may be well-connected to the city by public transport, but in distance terms they are further from the workplaces, leisure spaces and cultural facilities of the West End and City, potentially failing to offer the ‘aspirational’ lifestyle sometimes attached to micro-living in the capital (Harris and Nowicki, 2020). In notable Outer London hotspots like Croydon, Enfield or Wembley (Figure 2), this means that sub-37 m2 homes potentially offer worse value for money than those in Central London, albeit they will tend to be, on average, a little larger than small flats in the centre. EPCs issued for newly-built small homes by BRMA, 2010–21.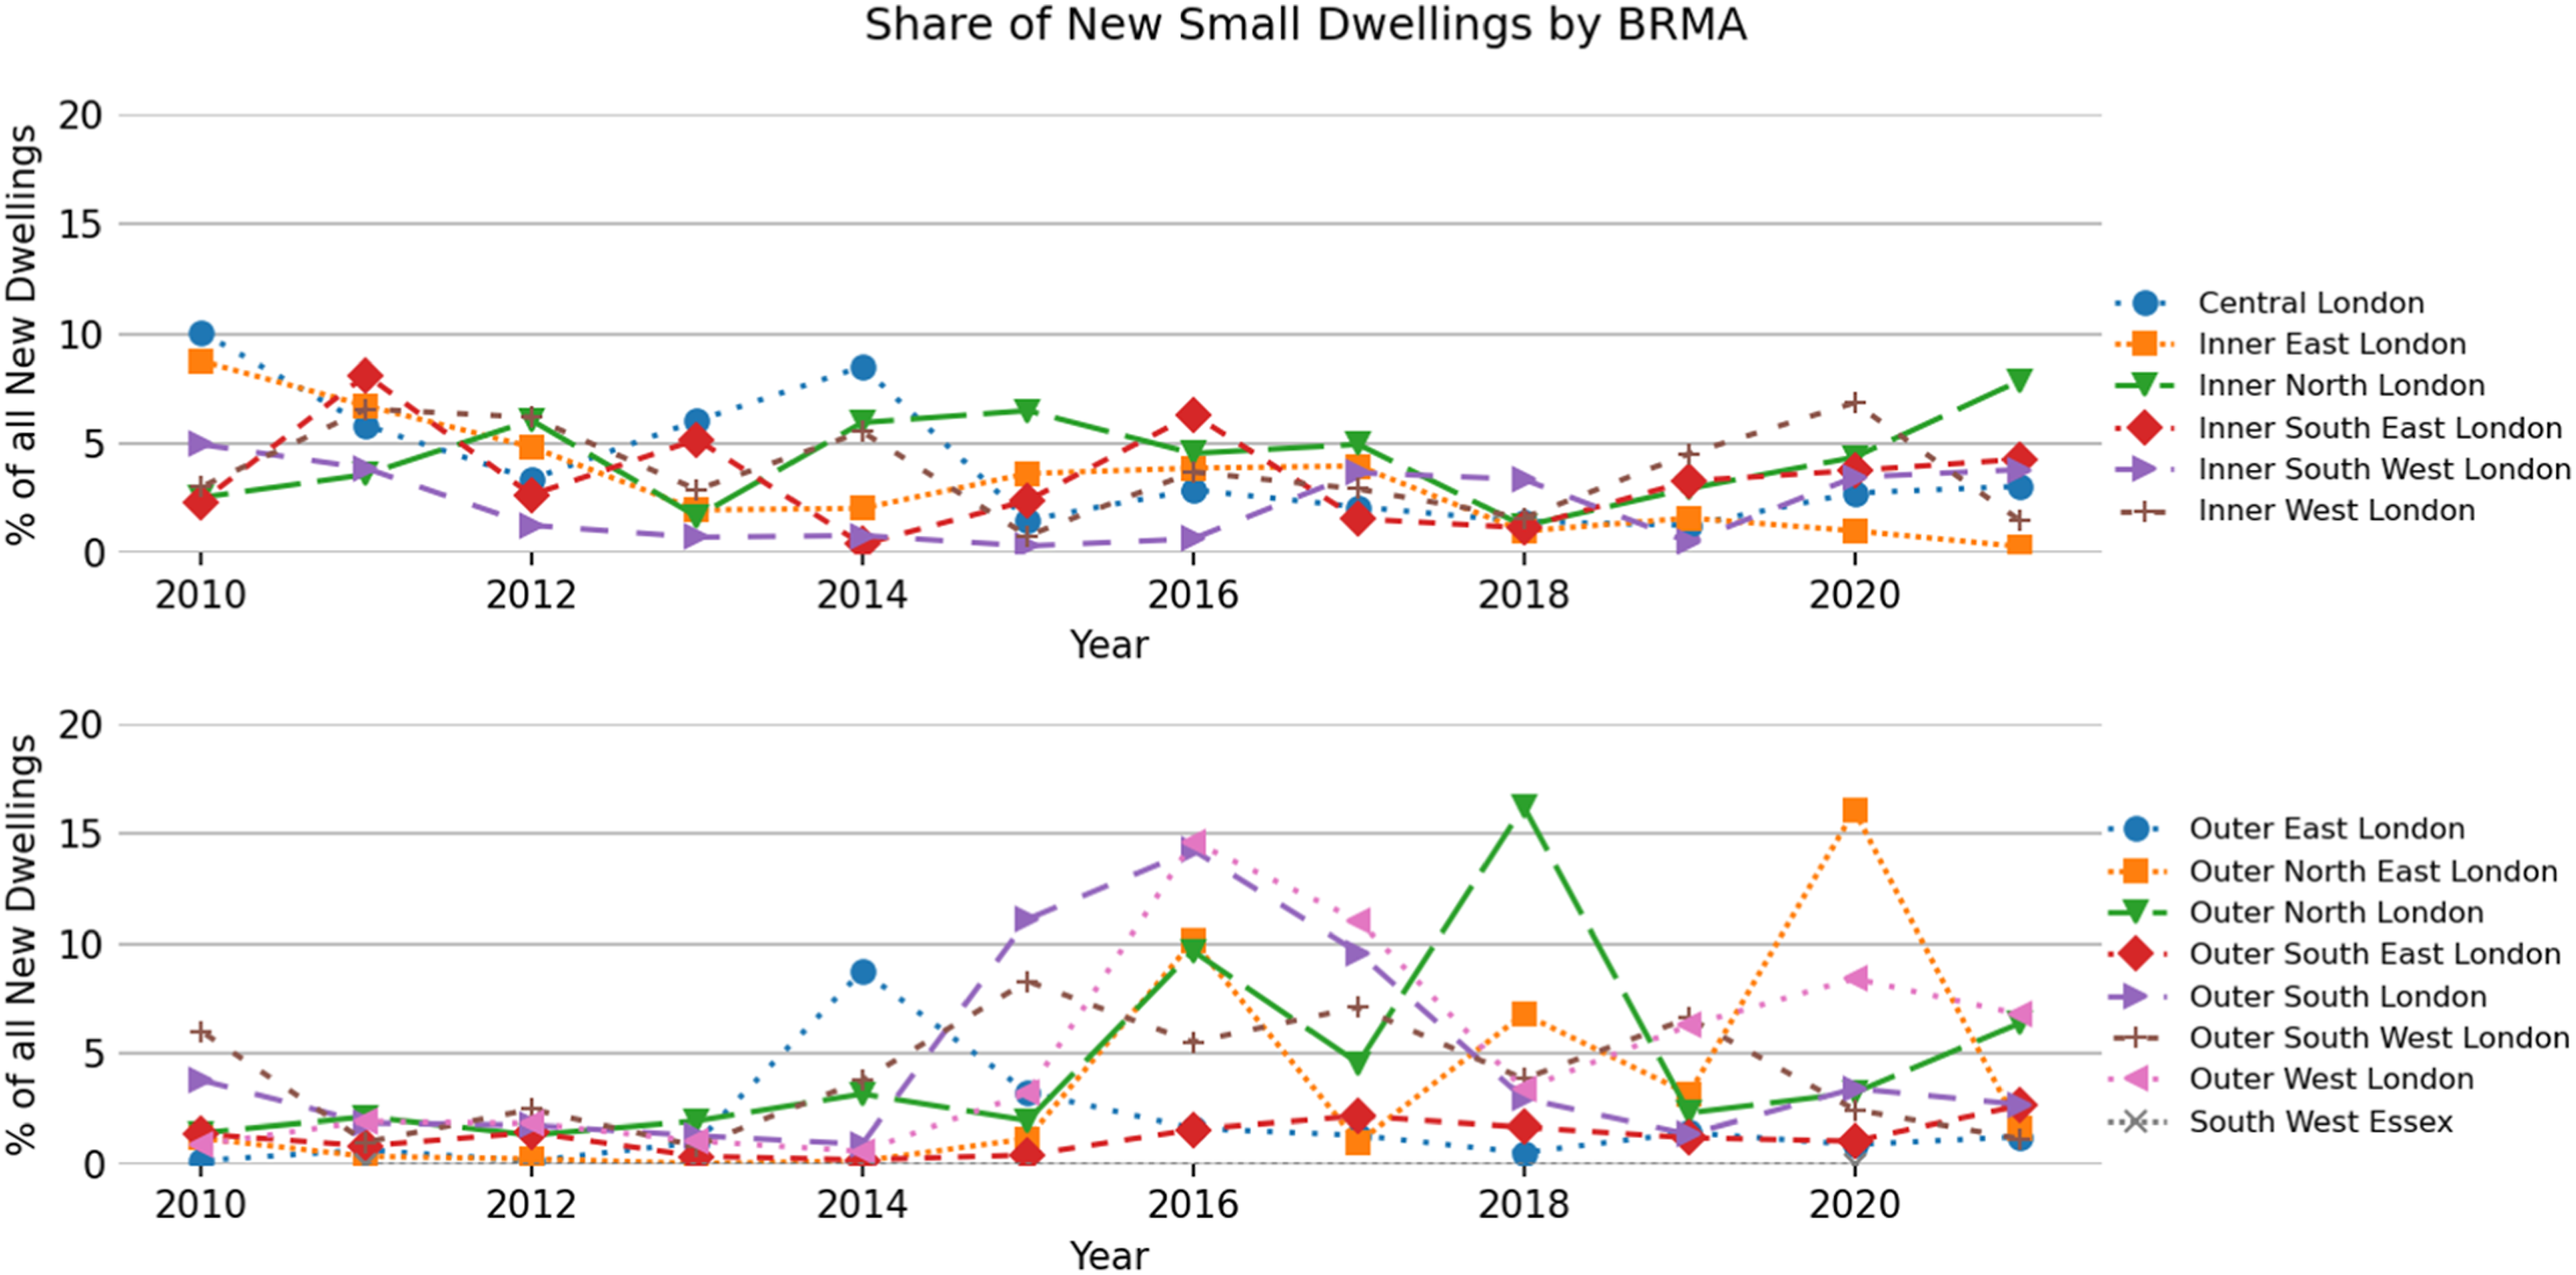
Yet, the fact smaller homes are becoming increasingly prominent in Outer London raises important questions about housing supply/demand given those arguing for sub-standard homes as a solution to London’s housing crisis suggest they are needed to provide cheaper housing (Kichanova, 2019). In absolute terms, they are right: smaller homes in London are generally cheaper than larger ones. In sharp contrast to the top end where the global ‘elite’ shop for houses and properties have spiralled in price (Glucksberg, 2016), the median sale price of the very smallest new homes (under 30 m2) rose by ‘just’ £127,000 between 2010 and 21 whereas those larger than the London average (over 77 m2) grew by at least £200,000 (Figure S5). However, Figure 7 suggests that owners of micro-homes pay as much per square metre as those shopping for much, much larger properties and considerably more than those buying mid-sized properties. In all BRMAs, the tick shape observable in Figure 7 persists across the period 2010–2021, even in the immediate wake of COVID lockdowns and the much-vaunted ‘race for space’ that saw many better-off residents in Central London sought larger properties with gardens on the outskirts (Cheshire et al., 2021). Price per m2 of New Dwellings in London.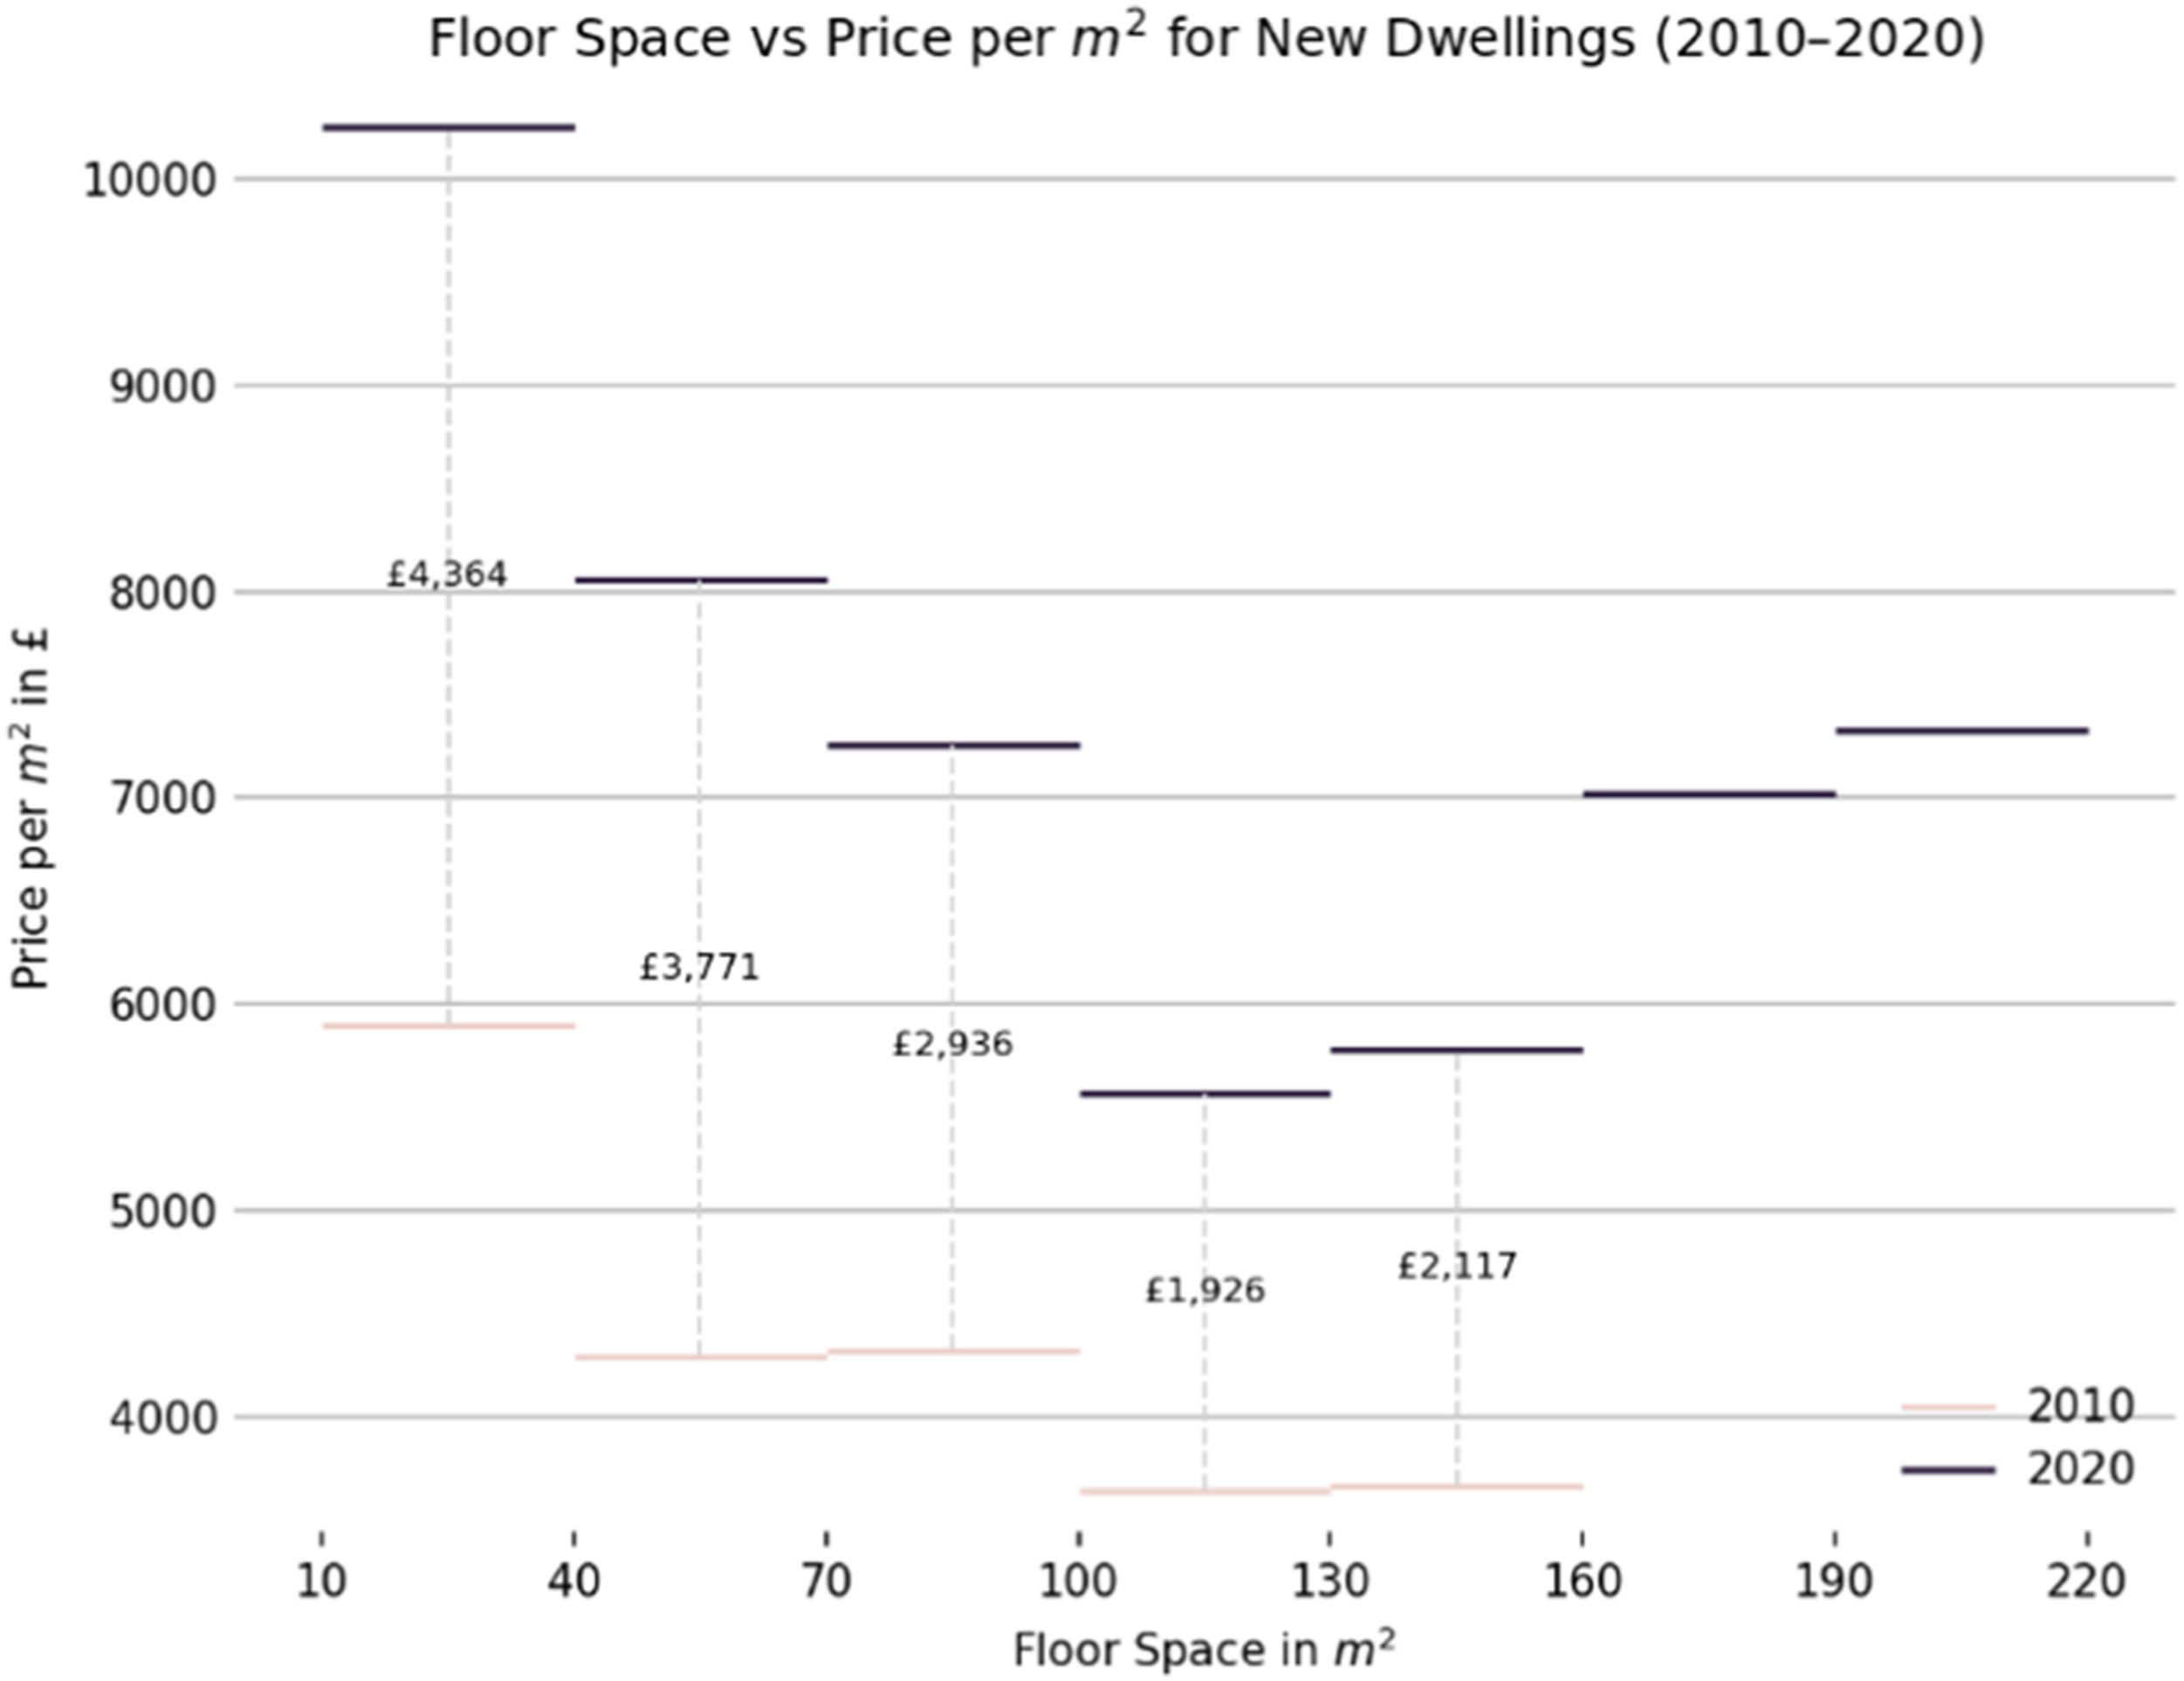
In other words, those unable to afford ‘average’ sized properties (e.g. a two-bed flat between 60 and 70 m2) pay an effective penalty for being unable to afford larger properties: prices are, on average, nearly 50% higher per square metre for sub-37 m2 homes than for properties closer to the London mean of 77 m2. While this is partly accounted for by higher build costs relative to floor area (i.e. any sized flat has to be equipped with plumbed kitchen and bathroom, electrics and services), developers generally attempt to extract maximum value from property (e.g. through subdivision of existing properties, or densification of development), and Figure 7 shows the relative inflation of sub-37 m2 properties higher than for any other floorspace category. The implication is that small developments may be more profitable for developers and that those who are least able to afford housing in London are getting less for their money, especially in Outer London. This raises serious questions about the overall ‘value’ of small homes (e.g. the average Croydon property is 76 m2 and costs nearly £400,000, whereas a micro-apartment half that size can cost the buyer £300,000).
Conclusions
While EPC measure of floorspace are not wholly reliable (Nagarajah and Davis, 2019), and address-matching across building, sales, and planning datasets is time-consuming, until Valuation Office Agency data is publicly-released and Unique Property Reference Numbers consistently adopted by data providers, this is the only approach that allows an exhaustive exploration of small home trends. Linking these datasets using robust matching rules, our analysis has sought to provide nuanced insights into the number, location and cost of sub-37 m2 homes in London, a city thought to have some of the smallest homes in England. To date, most studies of London’s small homes have involved snapshots of individual developments (e.g. Park, 2017), or the presentation of aggregated data based on partial samples (e.g. Özer and Jacoby, 2022), saying little about spatial or temporal trends. In contrast, our method provided extensive coverage, estimating that 4.4% of all newly-built domestic properties subject to an EPC rating in London 2010–2021 fell below the recommended one-person minimum of 37 m2. While subsequent ground-truthing suggested a handful of these may be slightly above the NDSS, our method appears robust enough to identify differences in the proportions of smaller homes between Inner and Outer London, gauge relative affordability, and explore the relationship between relaxed planning laws (PDR) and the production of micro-homes.
Overall, our analysis suggests that the number of apartments falling below NDSS is not as high as sometimes imagined, that most of these were developed before 2010, and that their production since then has been, in general terms, only weakly-associated with the conversion of former office or retail units under PDR (cf. Clifford and Ferm, 2021; Clifford and Madeddu, 2022). On the other hand, the data shows the proportion of new homes below 37 m2 nearly doubled in the period 2014–21, from 4% to 8%. This poses important questions about the enforcement of space standards. After all, if most small housing in London is not the outcome of PDR, the question remains why 8% of all new properties registered in 2021 remain below the minimum stipulated in the London Design Guide (2010) and NDSS (2015)? One obvious hypothesis here is that planners have allowed homes below space standards because they feel such properties can be justified in relation to local housing needs and the general crisis of affordability in the capital.
Our analysis also allowed for consideration of the geographies of sub-sized housing in London at the neighbourhood level. This revealed that smaller homes completed before 2010 are most prevalent in ‘prime’ London where rents are high, with hotspots like Canary Wharf and St John’s Wood suggesting these properties are often city ‘crash-pads’ and investments for the wealthy as much as attempts to provide affordable housing for young, working Londoners (e.g. a one-bedroom studio of less than 29 m2 on the 23rd floor of the ‘gated’ Pan Peninsula Tower, Canary Wharf, was on sale for £389,000 in 2021). In contrast, since 2014 in particular, newly-built small homes were more often developed in well-connected Outer London sub-centres, such as Croydon, Lewisham and Wembley. But whether high- or low-end, Inner or Outer London, residents are paying a premium for this very small housing, which on average costs up to 50% more per square metre than an average-sized property.
This noted, it remains important to stress that smaller properties may – in some cases – be well-suited to the lifestyles of single, young people with few possessions (see Collins and Stanes, 2023, on ‘decluttering’). This suggests the need to further explore the trade-offs made by the occupants of small homes, and the extent to which they are prepared to pay a premium for what is sold as ‘aspirational city living’. Clearly, EPCs cannot tell us who occupies small homes, or whether they are de facto overcrowded (in terms of people per room), but linking them to other datasets provides a basis for further quantitative and qualitative assessments of the liveability of smaller homes, including their proximity to local amenities such as green space, an issue that remains poorly-understood in terms of its contribution to physical and mental health (Kearns, 2022). In the context of post-COVID patterns of living and working, understanding how London’s small homes are occupied – and by whom – hence remains an urgent priority.
Supplemental Material
Supplemental Material - Shrinking homes? The geographies of small domestic properties in London, 2010–2021
Supplemental Material for Shrinking homes? The geographies of small domestic properties in London, 2010–2021 by Phil Hubbard, Jon Reades, Hendrik Walter and Catrin Preston in Environment and Planning B: Urban Analytics and City Science
Footnotes
Acknowledgements
The researchers wish to acknowledge the support of a King’s College London SSPP Research Grant and KURF funding. They also wish to thank the Editor and referees for their constructive comments on initial drafts of this paper.
Declaration of conflicting interests
The author(s) declared no potential conflicts of interest with respect to the research, authorship, and/or publication of this article.
Funding
The author(s) received no financial support for the research, authorship, and/or publication of this article.
Supplemental Material
Supplemental material for this article is available online.
References
Supplementary Material
Please find the following supplemental material available below.
For Open Access articles published under a Creative Commons License, all supplemental material carries the same license as the article it is associated with.
For non-Open Access articles published, all supplemental material carries a non-exclusive license, and permission requests for re-use of supplemental material or any part of supplemental material shall be sent directly to the copyright owner as specified in the copyright notice associated with the article.