
Abstract
Studies on mobility inequalities have so far mostly relied on Survey data or Censuses. While such studies have demonstrated that inequalities strongly influence everyday mobility choices, these data sources lack granular information on people’s movements on a daily basis. By capitalising on high spatio-temporal resolution data provided by Spectus.ai, this study aims at investigating how the deprivation level of the area where people live influences the kinds of urban environment they are more likely to use for their everyday activities. To do this, raw GPS trajectories collected in 2019 in Great Britain (GB) are transformed into semantic trajectories where short-time changes and the functional nature of urban contexts are acknowledged as two key dimensions to understand human spatial behaviours. Hourly sequences of stops are extracted from GPS trajectories and enriched with contextual information based on a new area-based classification detecting urban functions. The data exploration shows that some human patterns are widely common across all levels of deprivation, such as the tendency to be mostly exposed to the urban context near the home location. At the same time, we show that differences exist, especially between those who live in the most deprived areas and those who live in the least deprived areas of GB. It appears that people living in the most deprived areas tend to have a less regular working pattern and be more exposed to urban-based functions and well-served areas, while those living in the least deprived areas have a more regular working patterns and are mostly exposed to the countryside and low-density areas. Our approach and results provide new insights on the temporal and contextual dimensions of mobility inequalities, informing on who is exposed to issues characterising certain urban environments.
Introduction
Inequality interweaves multiple aspects of human life. Daily mobility, being strongly constrained by where people live, work and where they are able or can afford to go, is inevitably influenced by the structural inequalities entrenched in contemporary societies.
Mobility and inequalities have been the focus of urban studies for decades (Hidayati et al., 2021). These research works have demonstrated that socio-economic factors significantly influence mobility choices both in terms of transportation modes and access to parts of the city (Lotero et al., 2014). Along with people’s socio-economic status, studies show that daily mobility is also intersectionally influenced by ageing (Titheridge et al., 2009) or having disabilities (Imrie, 2000) as well as gender (Adeel et al., 2017).
Most of these works have so far relied upon Surveys or Census data to capture mobility inequalities. While such data sources provide a representative snapshot of how people move around at a certain point in time, they ignore short time, daily dynamics. This lack of granularity in the temporal resolution can obfuscate what people daily experiences are while analysing human mobility (Kwan, 2013).
Nowadays, the growing access to new forms of data, such as GPS trajectories obtained from mobile phone apps, Call Data Records, Travel Cards and georeferenced social media data, has provided novel opportunities to identify mobility patterns on a vast scale and at an increasingly granular spatio-temporal resolution (Rowe et al., 2023; Yuan and Raubal, 2012). With near real time mobility data, it has now become possible to investigate with higher resolution how people experience urban spaces and the existence in this respect of systematic inequalities as part of their everyday life activities (Gauvin et al., 2020; Macedo et al., 2021).
To uncover the influence inequality has on everyday mobility patterns in Great Britain, this work capitalises on human mobility data at high spatio-temporal resolution provided by Spectus.ai, a location-intelligence platform. Building upon studies that seek to understand inequalities in people’s everyday life, we aim at investigating how the deprivation level of the area where people live influences the kinds of urban environment they are more likely to use for their everyday activities.
Differently from existing works that analyse new forms of mobility data by focussing on the specific locations people visit during the day (González et al., 2008; Noulas et al., 2011; Schläpfer et al., 2021), we draw our attention to the context of such locations, especially in terms of their functional nature. In this sense, where people go during the day acquires meaning in its being the stage for certain activities. To characterise context, this work leverages a novel functional classification of urban spaces developed in Samardzhiev et al. (2022). It consists of 17 types of functional signatures which capture the functional nature of the urban context by synthesising 146 variables through clustering. This contextual layer extrapolates the key functional features of urban spaces, which significantly influence how we experience an area, providing a more generalisable but still meaningful description of someone’s mobility behaviour.
Time is another fundamental dimension to capture the nature of human activities (McKenzie et al., 2015; Miller, 2018). In this study the temporal dimension is approached in a novel way, by focussing not only on mobility patterns across independent points in time but also analysing the sequential character of daily mobility. Therefore, along with uncovering mobility typicalities at a certain time of the day, this study also carries a sequence analysis on the data. The latter, giving prime focus on the consequential nature of daily activities, provides insights on how visits to certain urban contexts follow each other temporally across different population groups.
To combine location, time and context, we transform raw trajectory data into semantic trajectories (Furtado et al., 2016). A semantic trajectory consists of: a time-ordered sequence of stops, which are the locations where a person has spent a significant amount of time and represents the space dimension; the start and end time of the stop, corresponding to the time dimension; and contextual information for each stop, which is the category of the place where the stop was detected, semantically enriching the trajectory. We therefore investigate whether and how these trajectories vary depending on the level of deprivation of the traveller’s home location.
Data
Spectus.ai data
Data employed for this analysis are supplied by Spectus.ai, a location-intelligence company. These are GPS trajectories collected from opted-in users in 2019 in Great Britain, which Spectus.ai pre-processes to identify approximate privacy preserving home, work locations and stops. A stop is a collection of locations in close space-time proximity which therefore constitutes a single stay. Close locations are aggregated to obtain a single stop entity with one space referent and dwell time. To preserve users’ privacy, home and work locations, and stops are expressed in the form of geohashes. Geohash 1 is a unique identifier of specific regions over 12 hierarchical levels. Home and work locations are expressed at level 6, which corresponds to an area of 1.2 km × 609.4 m at the equator, while stops are more detailed and expressed at level 9 (4.8 m × 4.8 m) with an associated timestamp and dwell time. Having information on home locations is pivotal to disaggregate mobility traces by different population groups based on the level of deprivation characterising the area where they live. As a proxy for the level of deprivation of an area, we rely on the Index of Multiple Deprivation (IMD).
Index of multiple deprivation
The IMD is a measure of deprivation for small areas in the UK that combines several different domains into a single score and ranking. Indices are available for all UK countries, although in this work we focus on Great Britain, therefore gathering data for England, Wales and Scotland (Fraser, 2020; Jones, 2019; Noble, 2019). The English and Welsh IMD are computed for Lower-Super Output Area (LSOA) – statistical unit having roughly the same population (∼1500) – while the Scottish IMD is computed for DataZones, which are the corresponding statistical units of LSOAs 2 .
The latest version of the Scottish IMD has been published in 2020 and combines seven domains: housing, crime, education, health, income, employment and access to services, while the English and Welsh IMD were published in 2019 and include air quality variables to form an additional domain, namely, physical environment. Although there are a few differences in the types of variables and domains, the index is computed fairly similarly, by normalising the variables, transforming them to z-scores to finally combine all domains, giving them different weights. The existing differences in the index across GB countries discourage direct comparisons between areas. However, studies on previous versions of IMDs have shown that creating an adjusted IMD for all GB based on the Scottish approach results in only 5% and 10% of the areas being reclassified in different quintiles (Payne and Abel, 2012).
As the scope of this work is not to compare areas across countries in GB but to leverage the IMD as a proxy for deprivation and obtain population groups, we combine the Scottish, Welsh and English IMD deciles, which in previous studies have demonstrated to be only slightly affected by differences in computing methods. In the IMD deciles, the first decile corresponds with the most deprived areas while the 10th decile classifies the least deprived areas.
Functional signatures
To identify the context of stops, we employ a novel area-based classification named functional signatures and released as an open data product (Samardzhiev et al., 2022). The classification is composed of 17 functional signatures covering Great Britain, emerging from the combination of bespoke spatial units called enclosed tessellation cells (ETC) (Fleischmann and Arribas-Bel, 2022).
ETCs are granular spatial units delineated by natural or built barriers (i.e. streets or rivers) and building footprints designed to be indivisible, internally consistent and exhaustive (Arribas-Bel and Fleischmann, 2022) 3 . As detailed in Samardzhiev et al. (2022), ETCs have been used as the smallest common denominator combining data from several open data sources – obtained from ONS, WorldPop, Copernicus, andConsumer Data Research Centre – that describe the functional characteristics of space, gathering information on the population, workplace population, night light intensity, types of amenities, land cover, NDVI, accessibility to retail and services and presence of listed buildings, extracting up to 146 variables. The final data product is a result of a two-level K-means clustering resulting in 17 functional signatures employed in this analysis (Samardzhiev et al., 2022).
The colour scheme for the functional signatures is based on their five macro-types, with reds corresponding to urban-based signatures, purple-pink to service-based signatures, blue-green to residential-based signatures, brown-ocher industrial-based signatures and dark green for countryside.
Methods
The data exploration consists of two stages. First, the population sample that can be extracted from Spectus.ai is compared with the official population estimate to assess the existence of biases. Second, the GPS trajectories are transformed into semantic trajectories and then analysed.
Population bias assessment
Leveraging information on the user’s home location in Spectus.ai data, we can investigate how similar the Spectus.ai population sample is with respect to population estimates provided by the Office for National Statistics (ONS) in 2019. The analysis focuses on two dimensions to capture similarities and differences in mobility patterns across population groups, the level of deprivation and the functional signatures of the visited places. As a consequence, we stratify the population by these two dimensions: IMD deciles and functional signatures.
First, we aggregate the Spectus.ai population and the ONS population by IMD decile and functional signature, obtaining the Spectus.ai and ONS population share distributions across the 170 combinations of IMD decile (10 classes) and functional signature (17 classes) at the national level. Second, we combine the two distributions to create a dataset that for each decile-signature stratum has the corresponding ONS population share and the Spectus population share. Finally, we compute the Pearson correlation coefficient between the two population share distributions. The latter measures how similarly the Spectus.ai population share and the ONS population share are distributed across decile-signature strata.
Pre-processing and trajectories exploration
To capture everyday life across space, time and context, we transform sequences of stops into semantic trajectories. Semantic trajectories are spatio-temporal trajectories that are enriched by contextualising the locations visited with additional information (Furtado et al., 2016).
The temporal units encapsulated into our semantic trajectories are days and hours, where a day starts at 8:00 and ends at 22:00. We generate daily trajectories that are segmented as hourly sequences of stops. If there are multiple stops within an hour, the selected stop for each individual device is identified based on the location with the highest dwell time within that hour. Furthermore, we discard sequences that are mostly incomplete. Specifically, we only retain sequences with information on stop locations for at least half of the day, a minimum of 7 h in a 14-h day. Therefore, some temporal gaps where we have missing information remain. We fill these gaps to have complete sequences of the same length following two approaches: forward filling gaps based on the last detected stop location until a change in location is observed; and, assuming that the start and end locations of individual trajectories correspond to home locations, if gaps at the start or end of a sequence exist, they are filled with the geohash of the relevant home location. Finally, each stop location is associated with the functional signature it intersects spatially. Following this step, we can discard the exact stop’s location and focus on the stop’s context. All pre-processing steps are detailed in Supplementary Table 1 and an example of the generated semantic trajectory is shown in Figure 1. Exemplar semantic trajectory. Time is expressed in hours, locations are geohashes and context synthesizes the functional nature of locations through the functional signature classification. Street view images illustrate how some functional signatures look in the real world.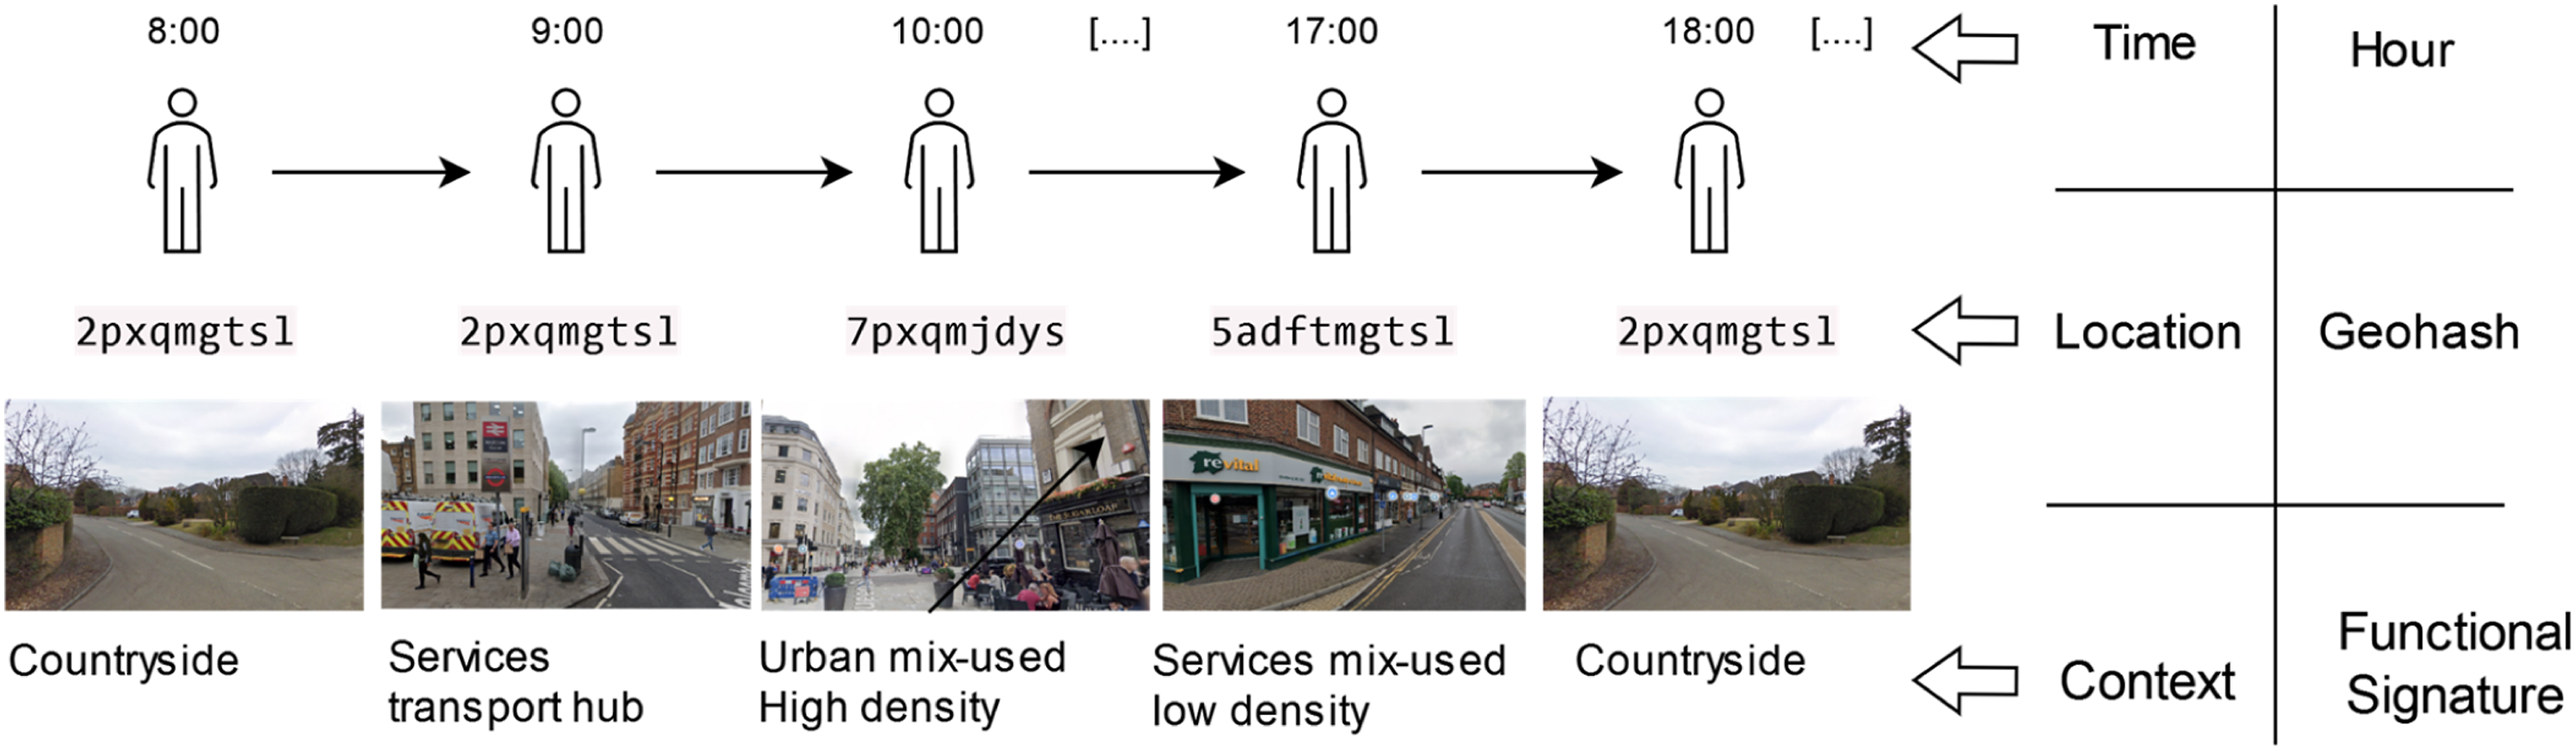
Once the trajectories are transformed into semantic trajectories, we group them based on the deprivation level of the traveller’s home location and analyse similarity and differences in mobility patterns across population groups. The analysis is fundamentally driven by an interest in understanding how the role time and urban functions play in mobility behaviours vary depending on the deprivation level of where people live. With this aim, we especially look at when each population group is more likely to change context during the day, transitioning from a place classified by one functional signature to another; as well as investigating what contexts are more commonly the origin or destinations where people in different population groups travel the most. Along with a focus on transitions at specific points in time, we also examine how the sequencing of functional signatures characterises the everyday mobility of people living in areas of different deprivation levels. To do this, we assess the sequences frequency for each population group.
Results
Population bias assessment
To assess how well the distribution of resident population in GB is mirrored across IMD deciles and functional signatures in the Spectus.ai sample, we compare the population estimates provided by the ONS with the Spectus.ai population stratified by IMD and functional signature of their home location. We find a high correlation (see Figure 2) on how population shares are distributed across IMD deciles and functional signatures at the national level in the two data sources. Scatter plot of population share (%) living in the 170 combinations of IMD decile (10 classes) and functional signature (17 signatures) based on the ONS estimates (x-axis) and Spectus sample (y-axis) and their correlation line and coefficient (ρ = 0.94).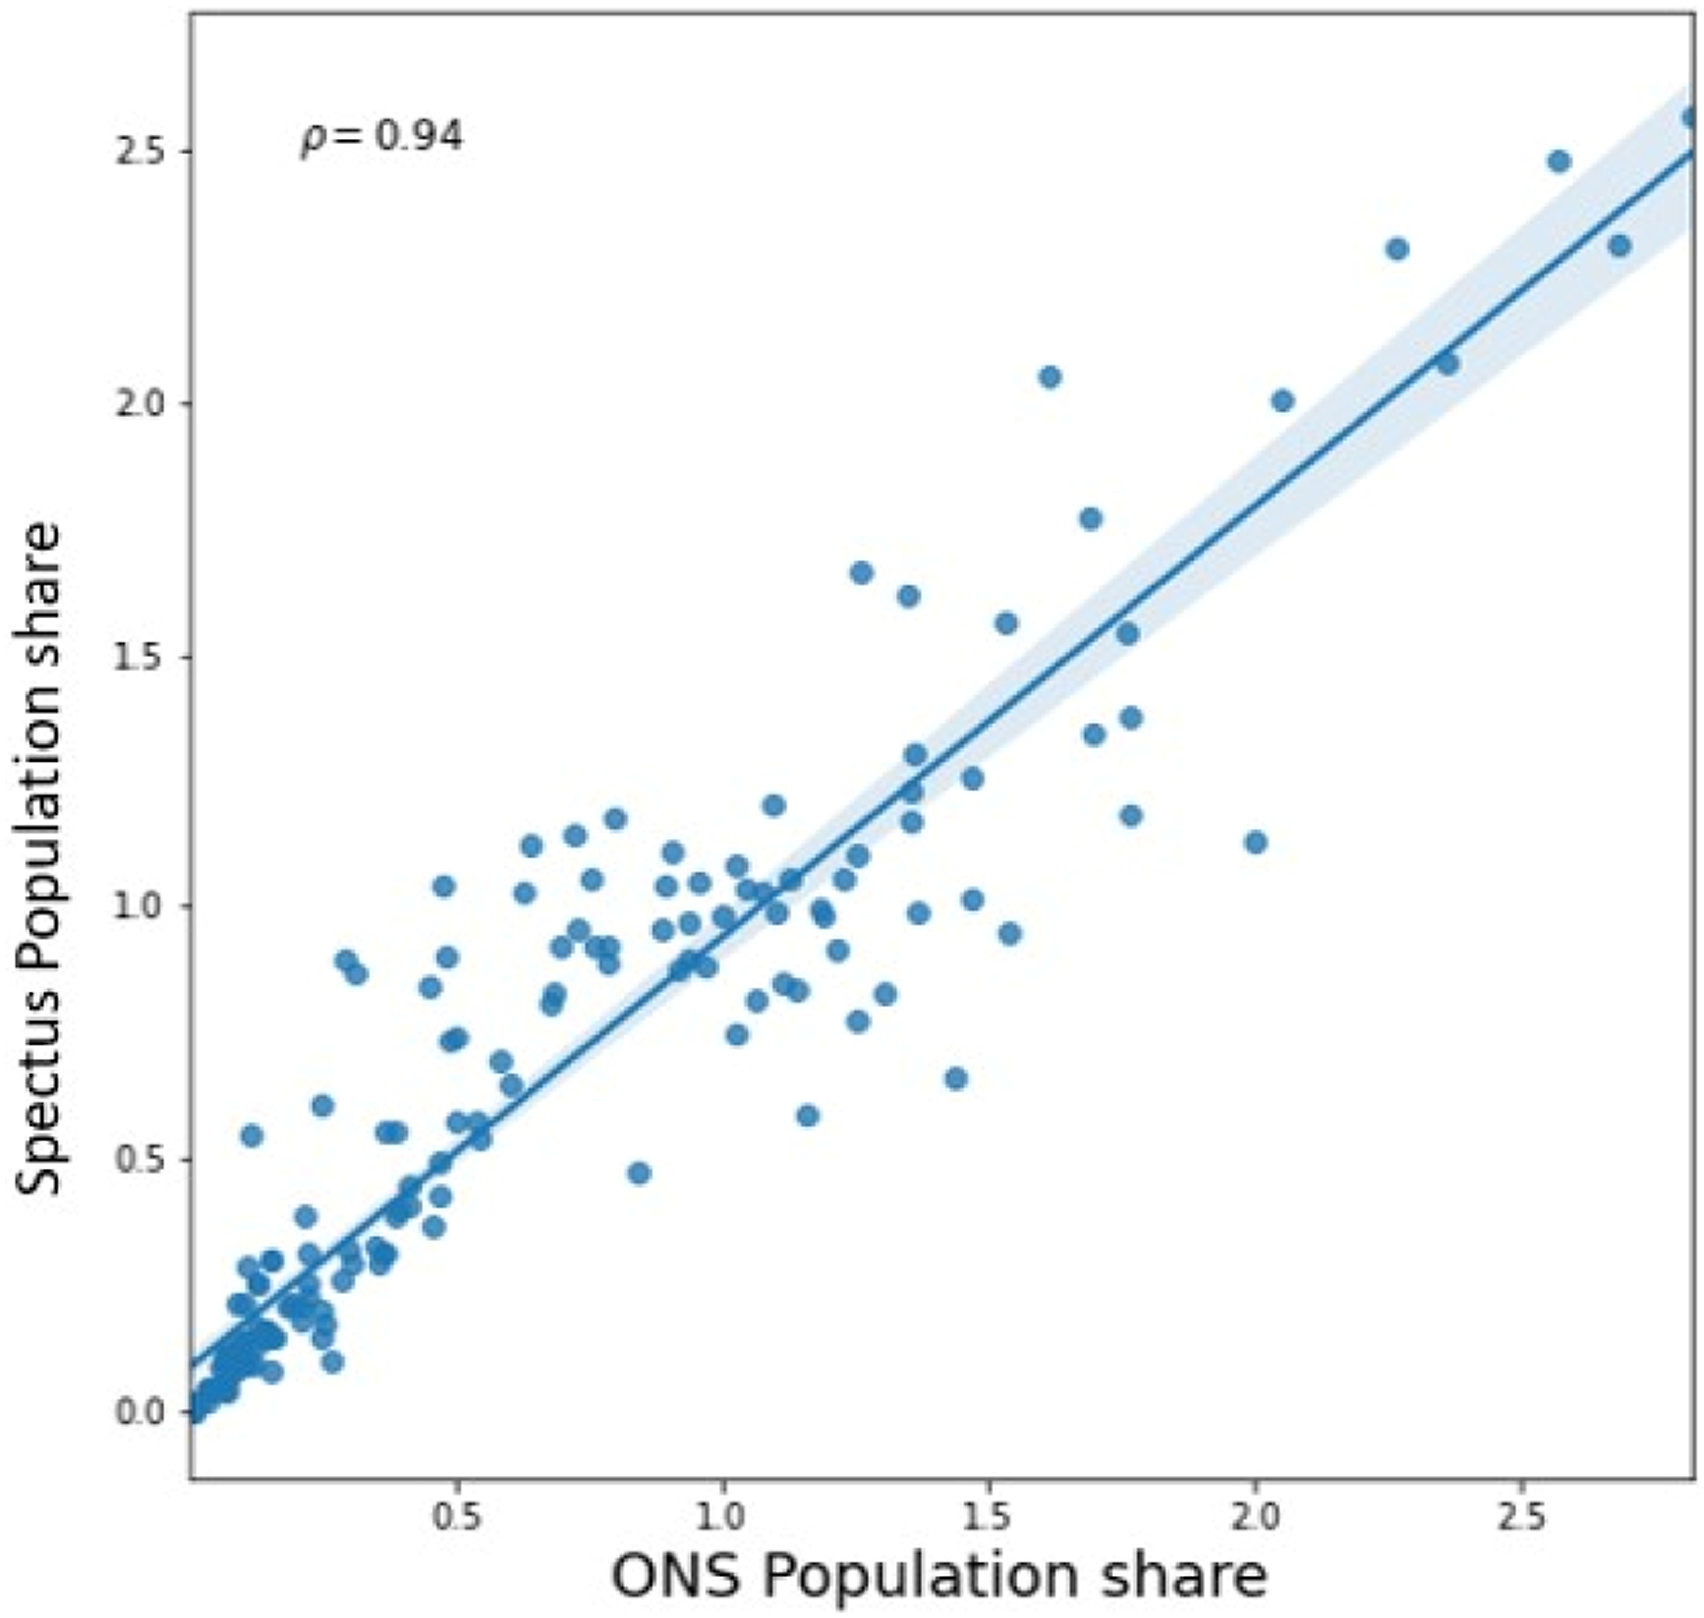
This suggests that the Spectus.ai sample has a distribution across strata of IMD and functional signature which is very similar to the ONS population estimates
4
. While such a result demonstrates that there is no systematic disproportion between the Spectus.ai and ONS population share in IMD-signature combinations, the population is not distributed evenly among IMD deciles and functional signatures. Figure 3 shows how the Spectus.ai population is distributed and its main patterns. Specifically, we note that the percentage of people living in the countryside tends to increase when the level of deprivation decreases. On the contrary, in urban/more dense areas there tend to be a higher percentage of people living in areas with a higher level of deprivation. Expectedly, areas categorised as the various types of residential take on the vast majority of the population across all IMD deciles. Finally, it appears that the population living in the industrial-manufacturing areas is mostly associated with higher levels of deprivation. While Figure 3 shows how the Spectus.ai population distributes, given the high correlation with ONS estimates, this is extremely similar to population shares emerging from official data. Supplementary Figure 1 shows differences between Spectus.ai and ONS distributions. Spectus population (%) by IMD deciles and functional signature of the home location.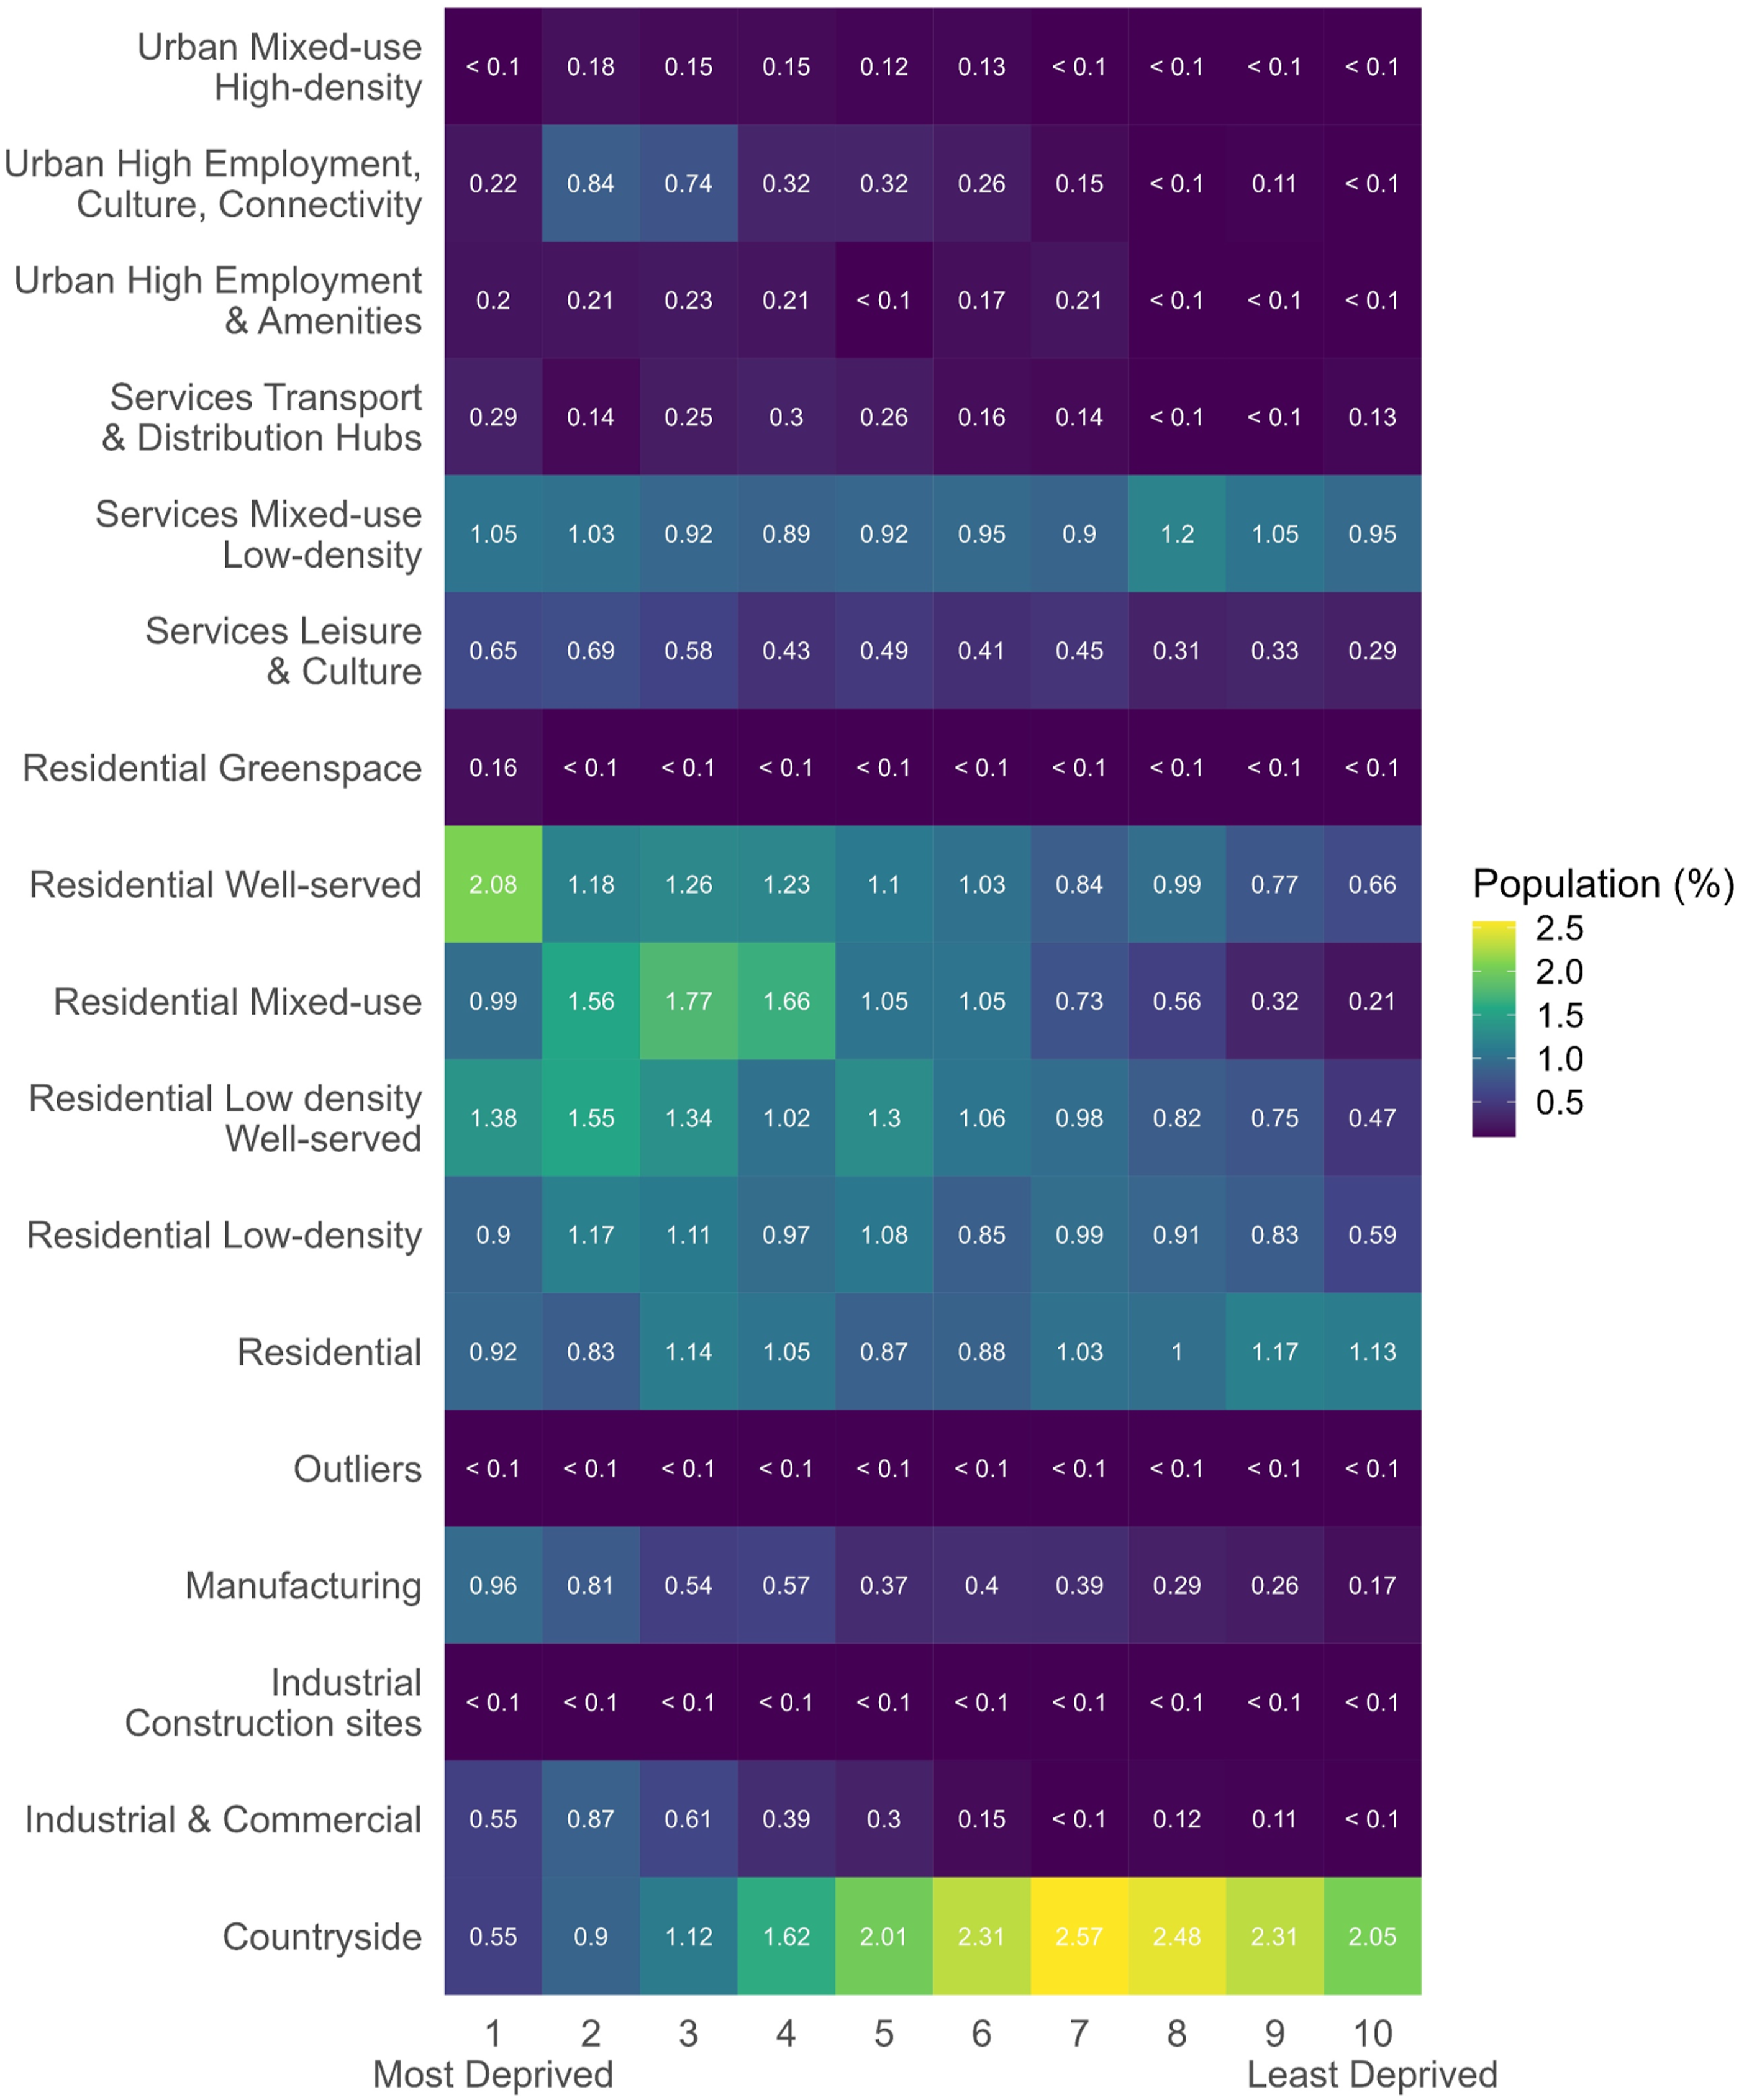
Trajectories exploration
Moving on to the temporal dimension of the data, we compare the semantic trajectories by IMD deciles over time exploring both the most common sequences of functional signatures, therefore accounting for the consequential character of daily activities, and the broader temporal patterns emerging when looking at each point in time in weekends and weekdays.
Figure 4 shows how common certain sequences are across IMD groups. It appears clear that the most frequent sequences correspond to movements within the same functional signature, noting that this does not mean that those people do not move from one location to another, but that they more often stop in areas that are classified by the same functional signature. This broadly holds for all IMD groups with an average of 9% of the observations having no transitions from one functional signature to another, although we also note differences. The group living in the least deprived areas is the most exposed to variations in functional signatures with only 7.6% of the observations having no transitions, whereas the least exposed to changes are those living in areas classified within the third decile in the IMD (see Supplementary Table 1 in SM). With respect to the types of signatures in sequences with no transitions, we note that residential-based signatures (blue-green) are in the top five most frequent sequences almost for all IMD deciles, industrial-manufacturing (ochre) appear in the top five only in population grouped by IMD 1, 2 while the countryside (dark green) signature becomes relevant only from IMD 4 towards the least deprived groups. Top sequences by IMD decile capturing 10% of the observations. The first sequence starting from the top is the most common, the sequence closest to the x-axis is the least common. The y-axis reports the % of observations following that sequence for each IMD decile.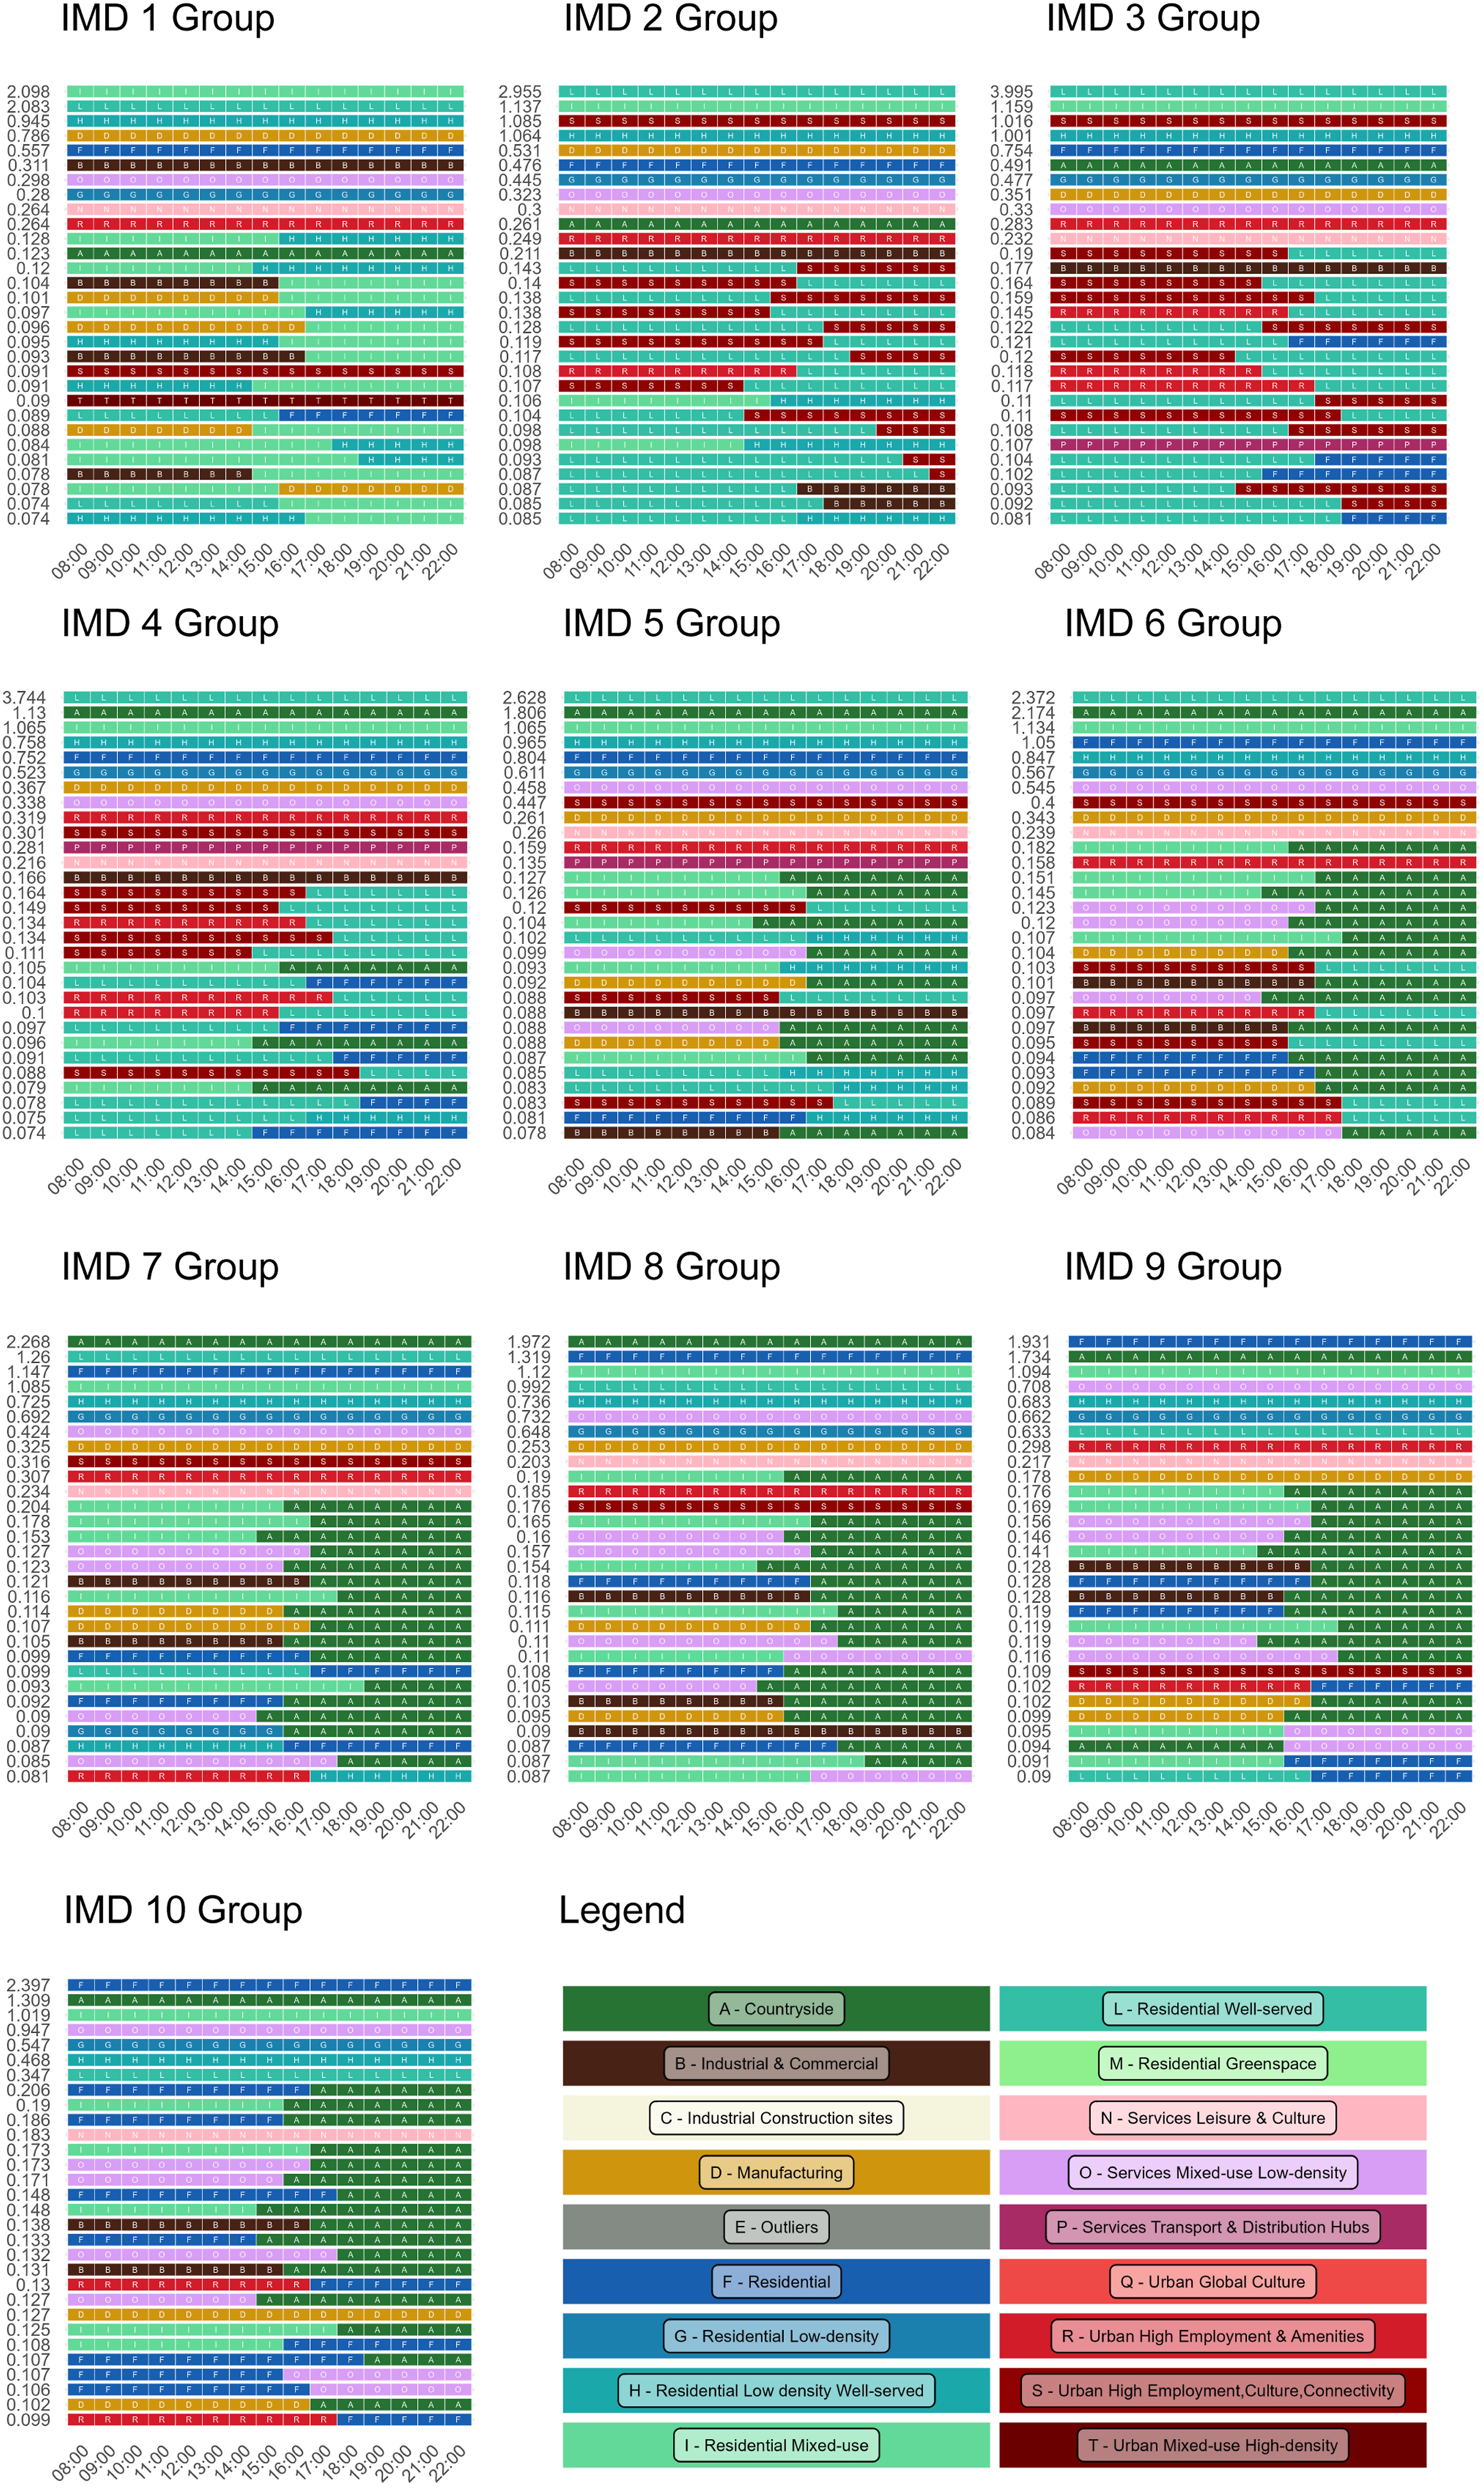
Moving the focus from sequences with no transitions to those that have at least one transition, we note that all of them consist of two functional signatures. While we observe similar patterns in terms of the more common functional signature with ochre (industrial) and reds (urban) in higher deprivation groups and countryside green in lower deprivation groups, we can also see what the more common relationships between functional signatures across IMD deciles are. Particularly, we note that morning activities in manufacturing, urban-based signatures happen more frequently among IMD 1 up to IMD 4 with these groups moving to residential-based and well served signatures areas in the evening; groups with lower level of deprivation tend to spend the mornings mostly into residential well-served areas followed by service mix low-density areas, with exception of IMD 10 which has a significant number of morning stops in residential only areas and spend the evenings in the countryside.
To further explore how the relationship between functional signatures across time vary among different population groups, we investigate the frequency and nature of the transitions’ temporal patterns, where a transition is a movement from an area classified by a functional signature to another classified by a different signature.
Figure 5 shows the hours when transitions are more likely across IMD deciles during weekdays and weekends. From Figure 5(a) we see that the likelihood of transitions tends to follow the typical commuting pattern for all IMD deciles, with changes in functional signatures mostly happening in the morning at 9:00 and in the evening at 17:00. However, we also note that the most divergent transitions trends are between the most and the least deprived groups, with people living in areas with higher deprivation levels having less transitions during typical commuting hours and more transitions during the rest of the day. During weekends the most evident gap still appears between those living in the least and the most deprived areas of GB, with the former changing functional signature more frequently late in the morning while the peak for the latter group is late in the afternoon. % of transitions by hour for each IMD group during weekdays (a) and weekends (b).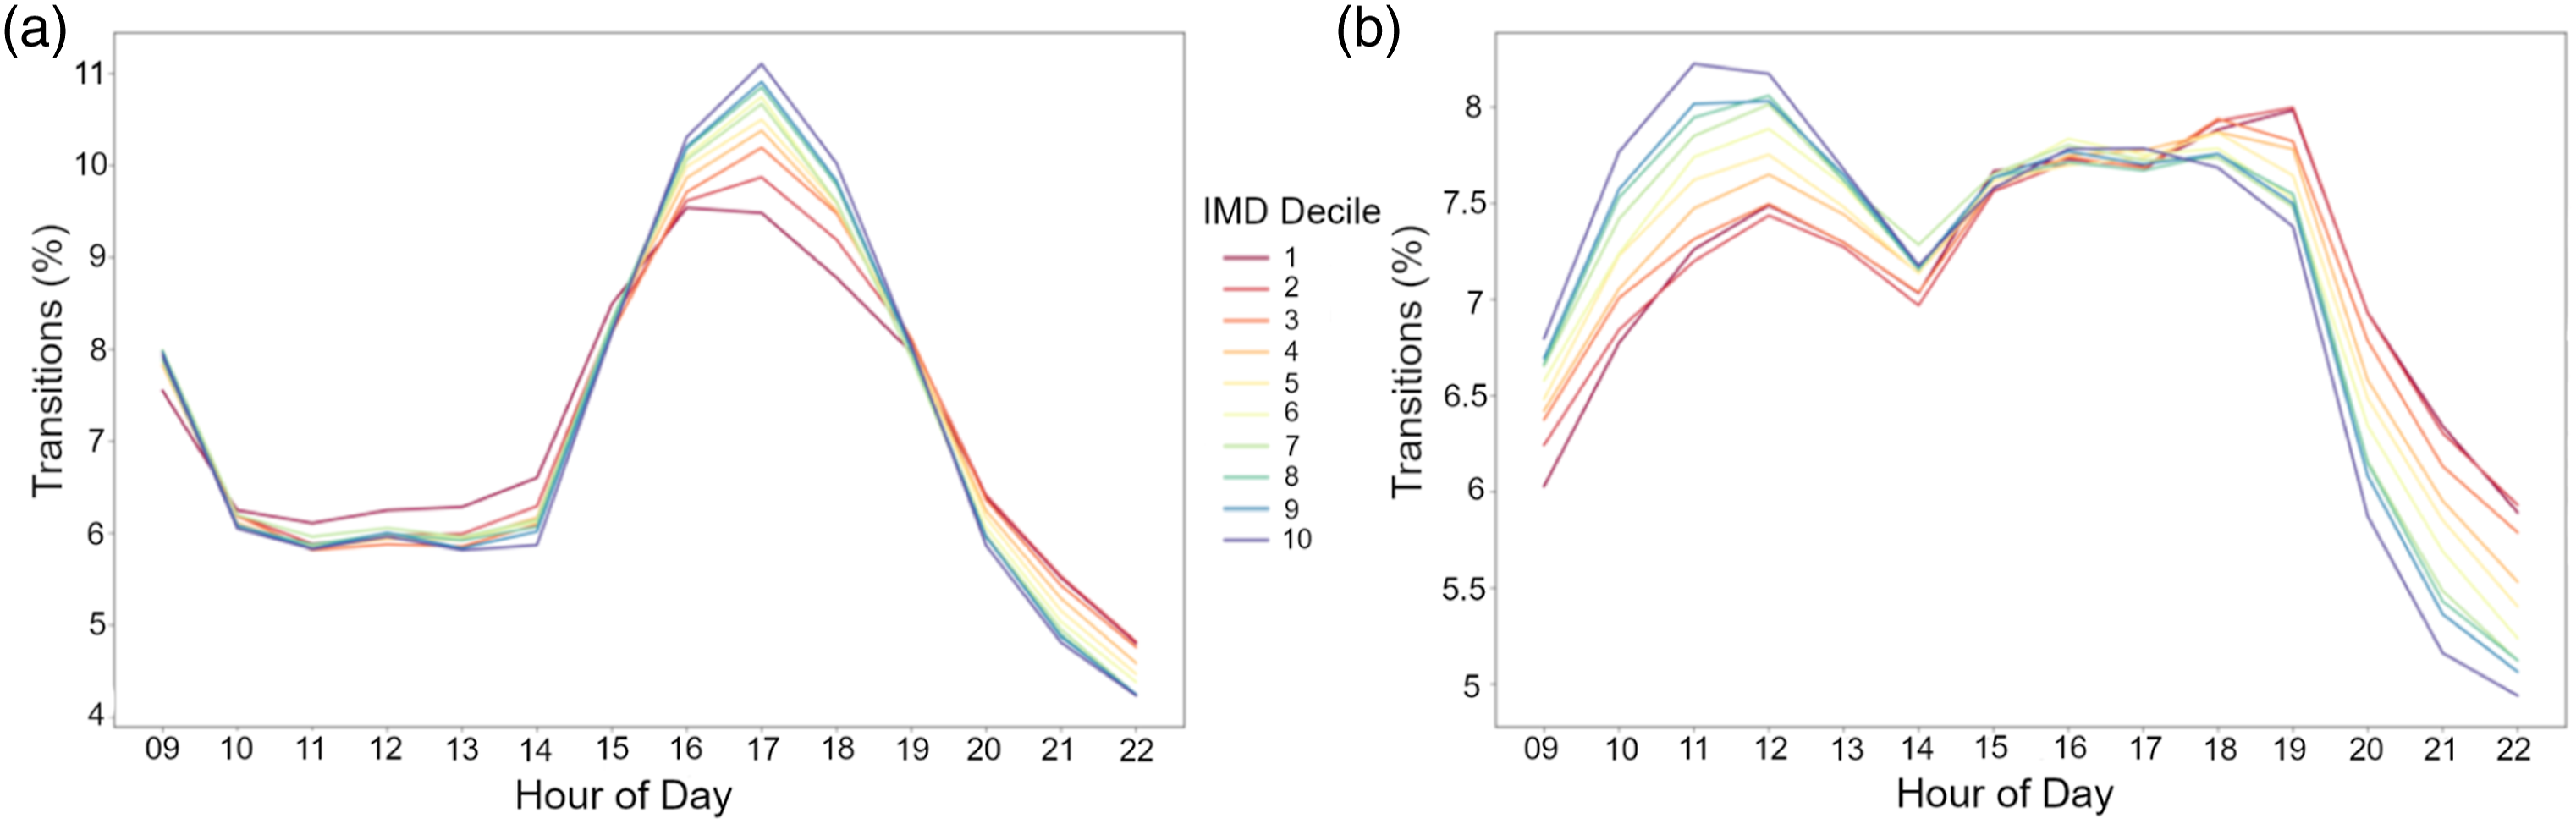
To better understand the nature of these transitions, we also explored from and to which functional signatures these movements originate and are directed to. Figure 6 shows the functional signatures classifying the origins and destinations of these movements when transitions are more likely during weekdays and weekends. For those living in the least deprived areas, the peaks in transitions during weekdays mostly correspond with movements originating from countryside or low-density areas (A-Countryside, F-Residential, O-Services) towards a more mixed composition of served/urban areas, affording more and varied functions spanning work-related and entertainment activities, at 9 a.m. and returning to a prevalence of low density or countryside areas at 5 p.m. (see Figure 6(a1) and (a2)). On the contrary, those living in more deprived areas have a more mixed composition of signatures in the origins and destinations of their trips. In this group, we see a prevalence of stops in well-served/mixed-use areas throughout (I and L-Residential), with slightly more stops directed to employment centres in the morning peak (R and S-Urban) and leaving these areas in the afternoon peak (see Figure 6(b1) and (b2)). Functional signatures at the origin (O) and destination (d) during peak transition hours. (a1) OD for the population group living in IMD 10 areas transitions at 9 a.m. and (a2) 5 p.m. during weekdays. (b1) OD for the population group living in IMD 1 areas transitions at 9 a.m. and (b2) 5 p.m. during weekdays. Detailed functional signatures are: A-Countryside | B-Industrial-Commercial | C Industrial-Construction sites | D-Industrial-Manufacturing | E-Outliers | F-Residential | G-Residential-Low Density | H-Residential-Low Density-Well Served | I-Residential-Mixed-use | L-Residential-Well Served | M-Residential Greenspace | N-Services-Leisure and Cultural | O-Services-Mixed-Low Density | P-Services-Transport and distribution hubs | Q-Urban-Global culture | R-Urban-High employment, amenities | S-Urban-High employment, culture, connectivity | T-Urban-Mixed use-High density.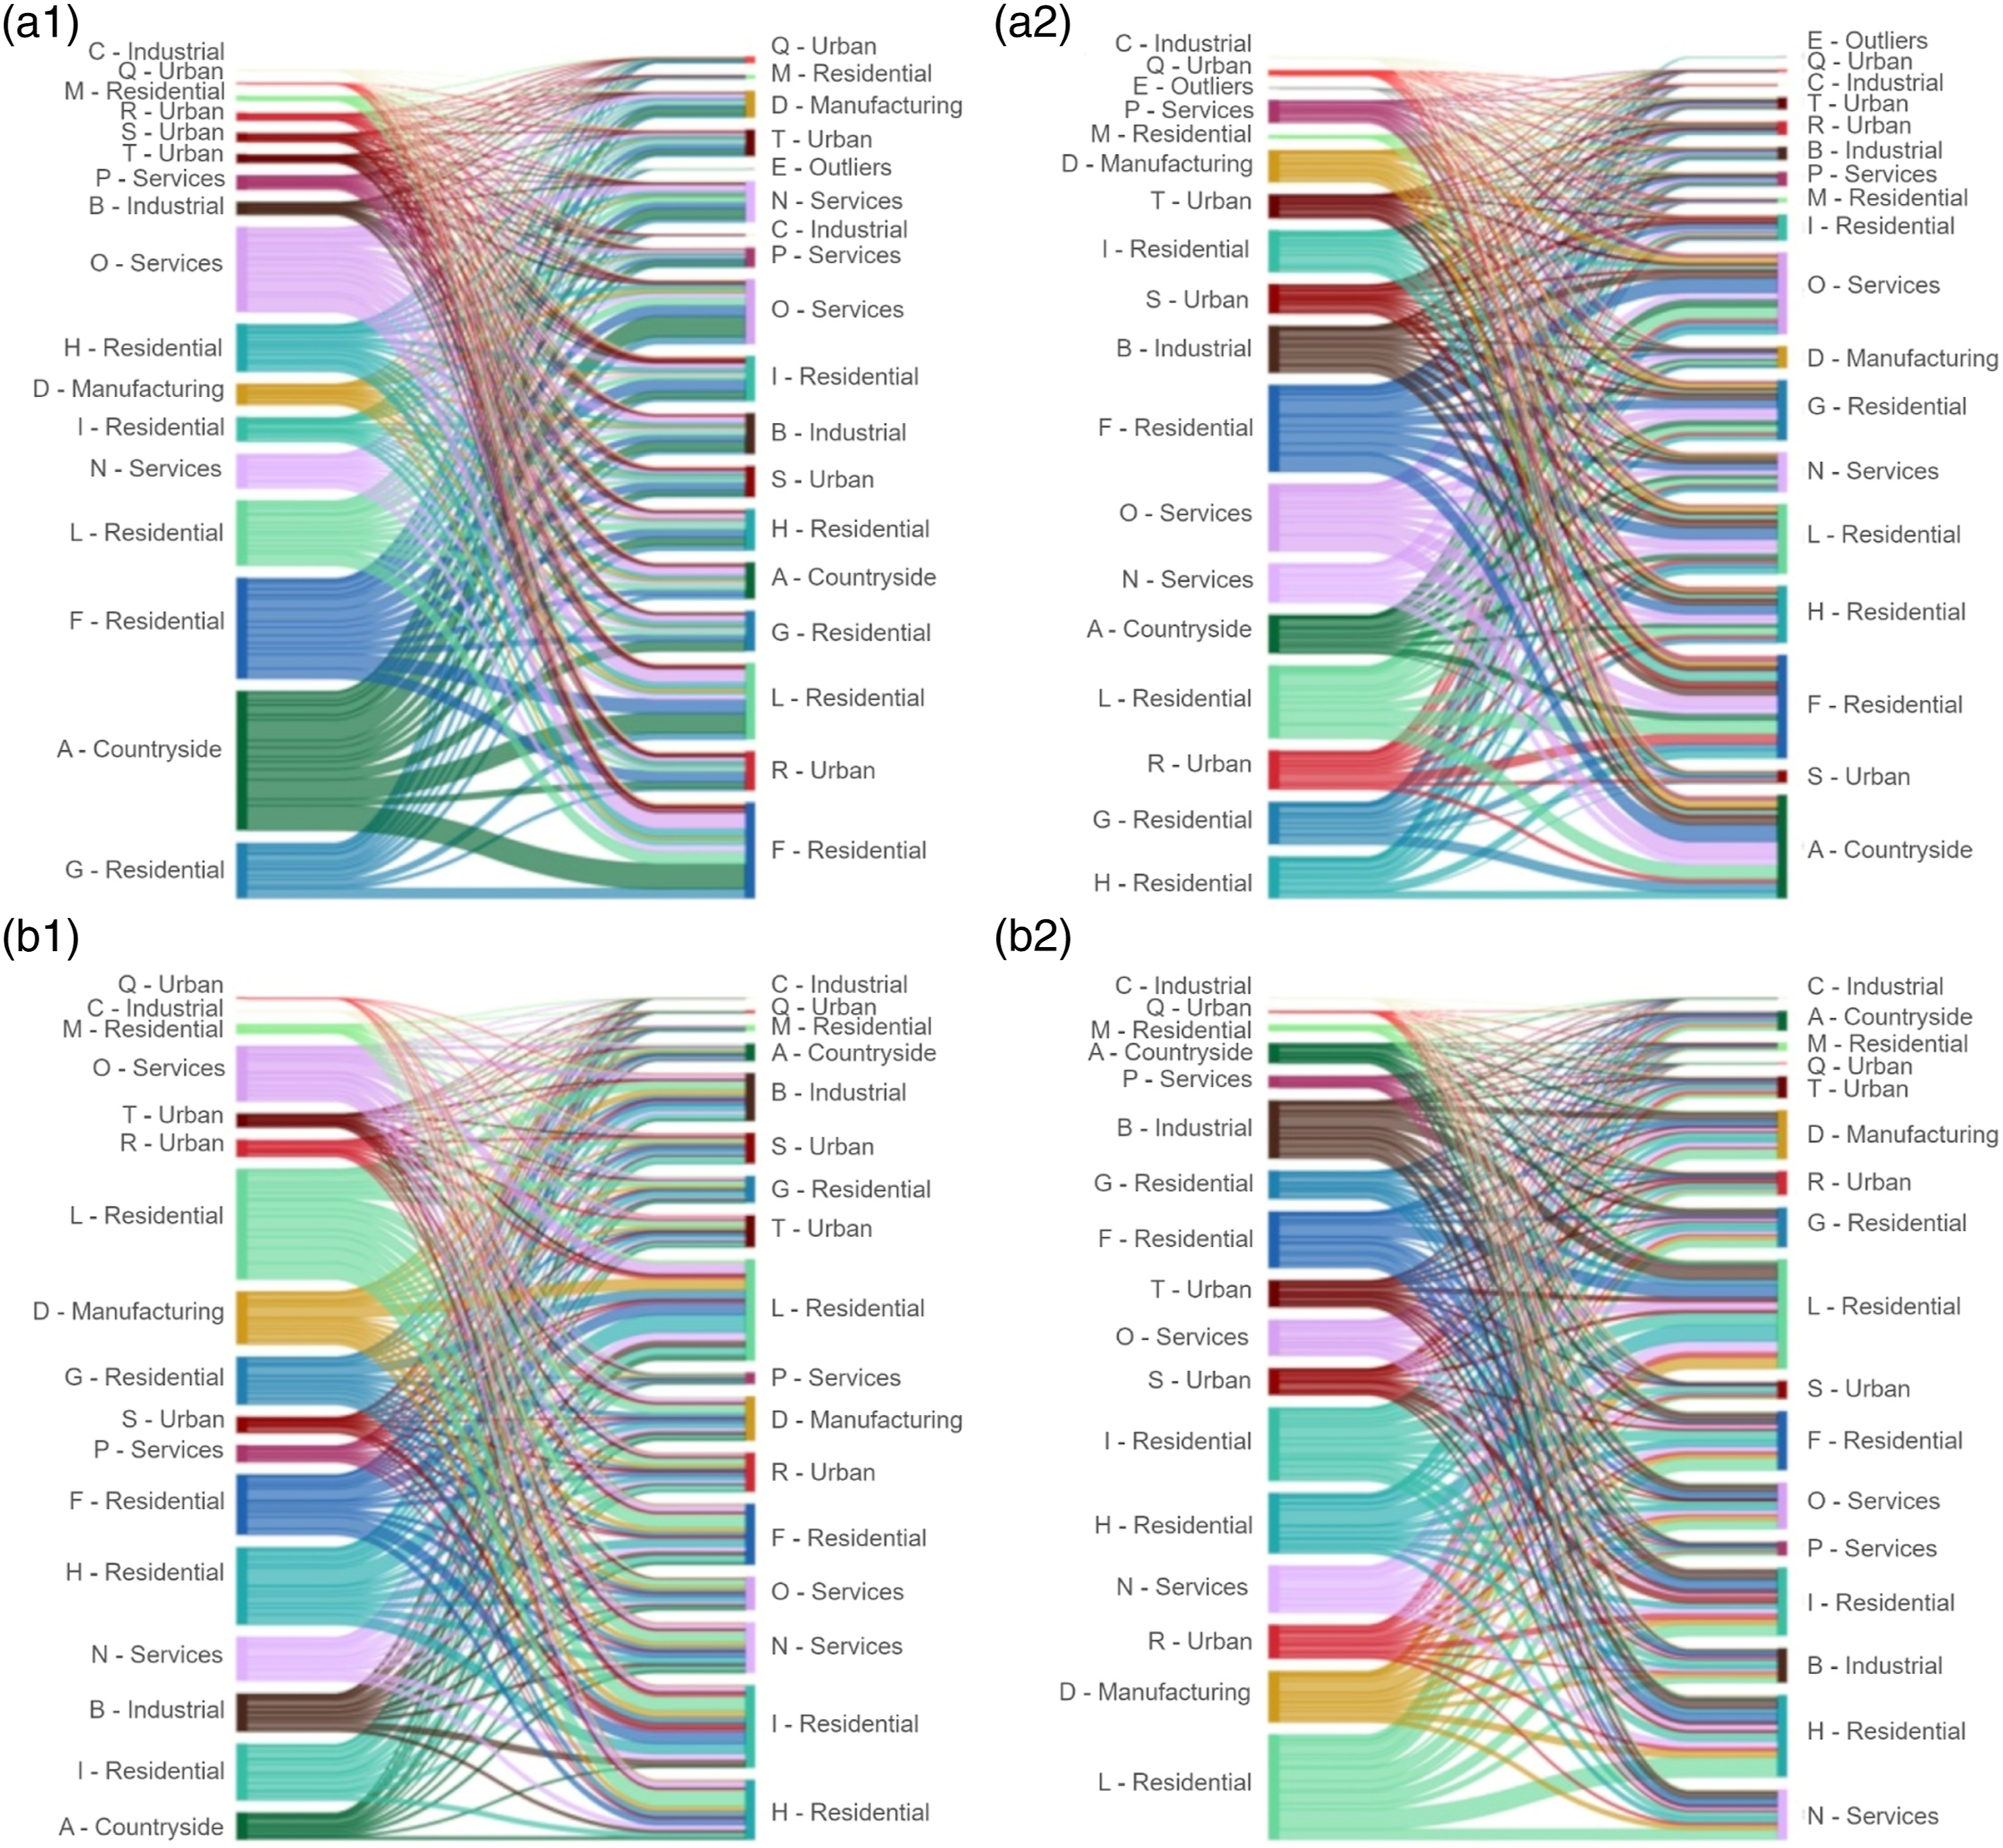
The weekend transitions, compared to what we see during weekdays, follow different temporal trajectories while being similar in terms of the kind of signatures the various groups are travelling from and to. Figure 7 shows where transitions originate and are directed to at the weekend peak hours for IMD 10 (late morning) and IMD 1 (late afternoon). For the former, it is noticeable that a wide majority of transitions are from the countryside rather than to the countryside, while for those living in the most deprived areas and moving late in the afternoon, we note a much more balanced signature mix at origins and destinations. Transitions during weekends at peak hours for people living in IMD10 areas at 10 a.m. (1) and for those living in IMD1 areas at 7 p.m. (2). Detailed functional signatures are: A-Countryside | B-Industrial-Commercial | C Industrial-Construction sites | D-Industrial-Manufacturing | E-Outliers | F-Residential | G-Residential-Low Density | H-Residential-Low Density-Well Served | I-Residential-Mixed-use | L-Residential-Well Served | M-Residential Greenspace | N-Services-Leisure and Cultural | O-Services-Mixed-Low Density | P-Services-Transport and distribution hubs | Q-Urban-Global culture | R-Urban-High employment, amenities | S-Urban-High employment, culture, connectivity | T-Urban-Mixed use-High density.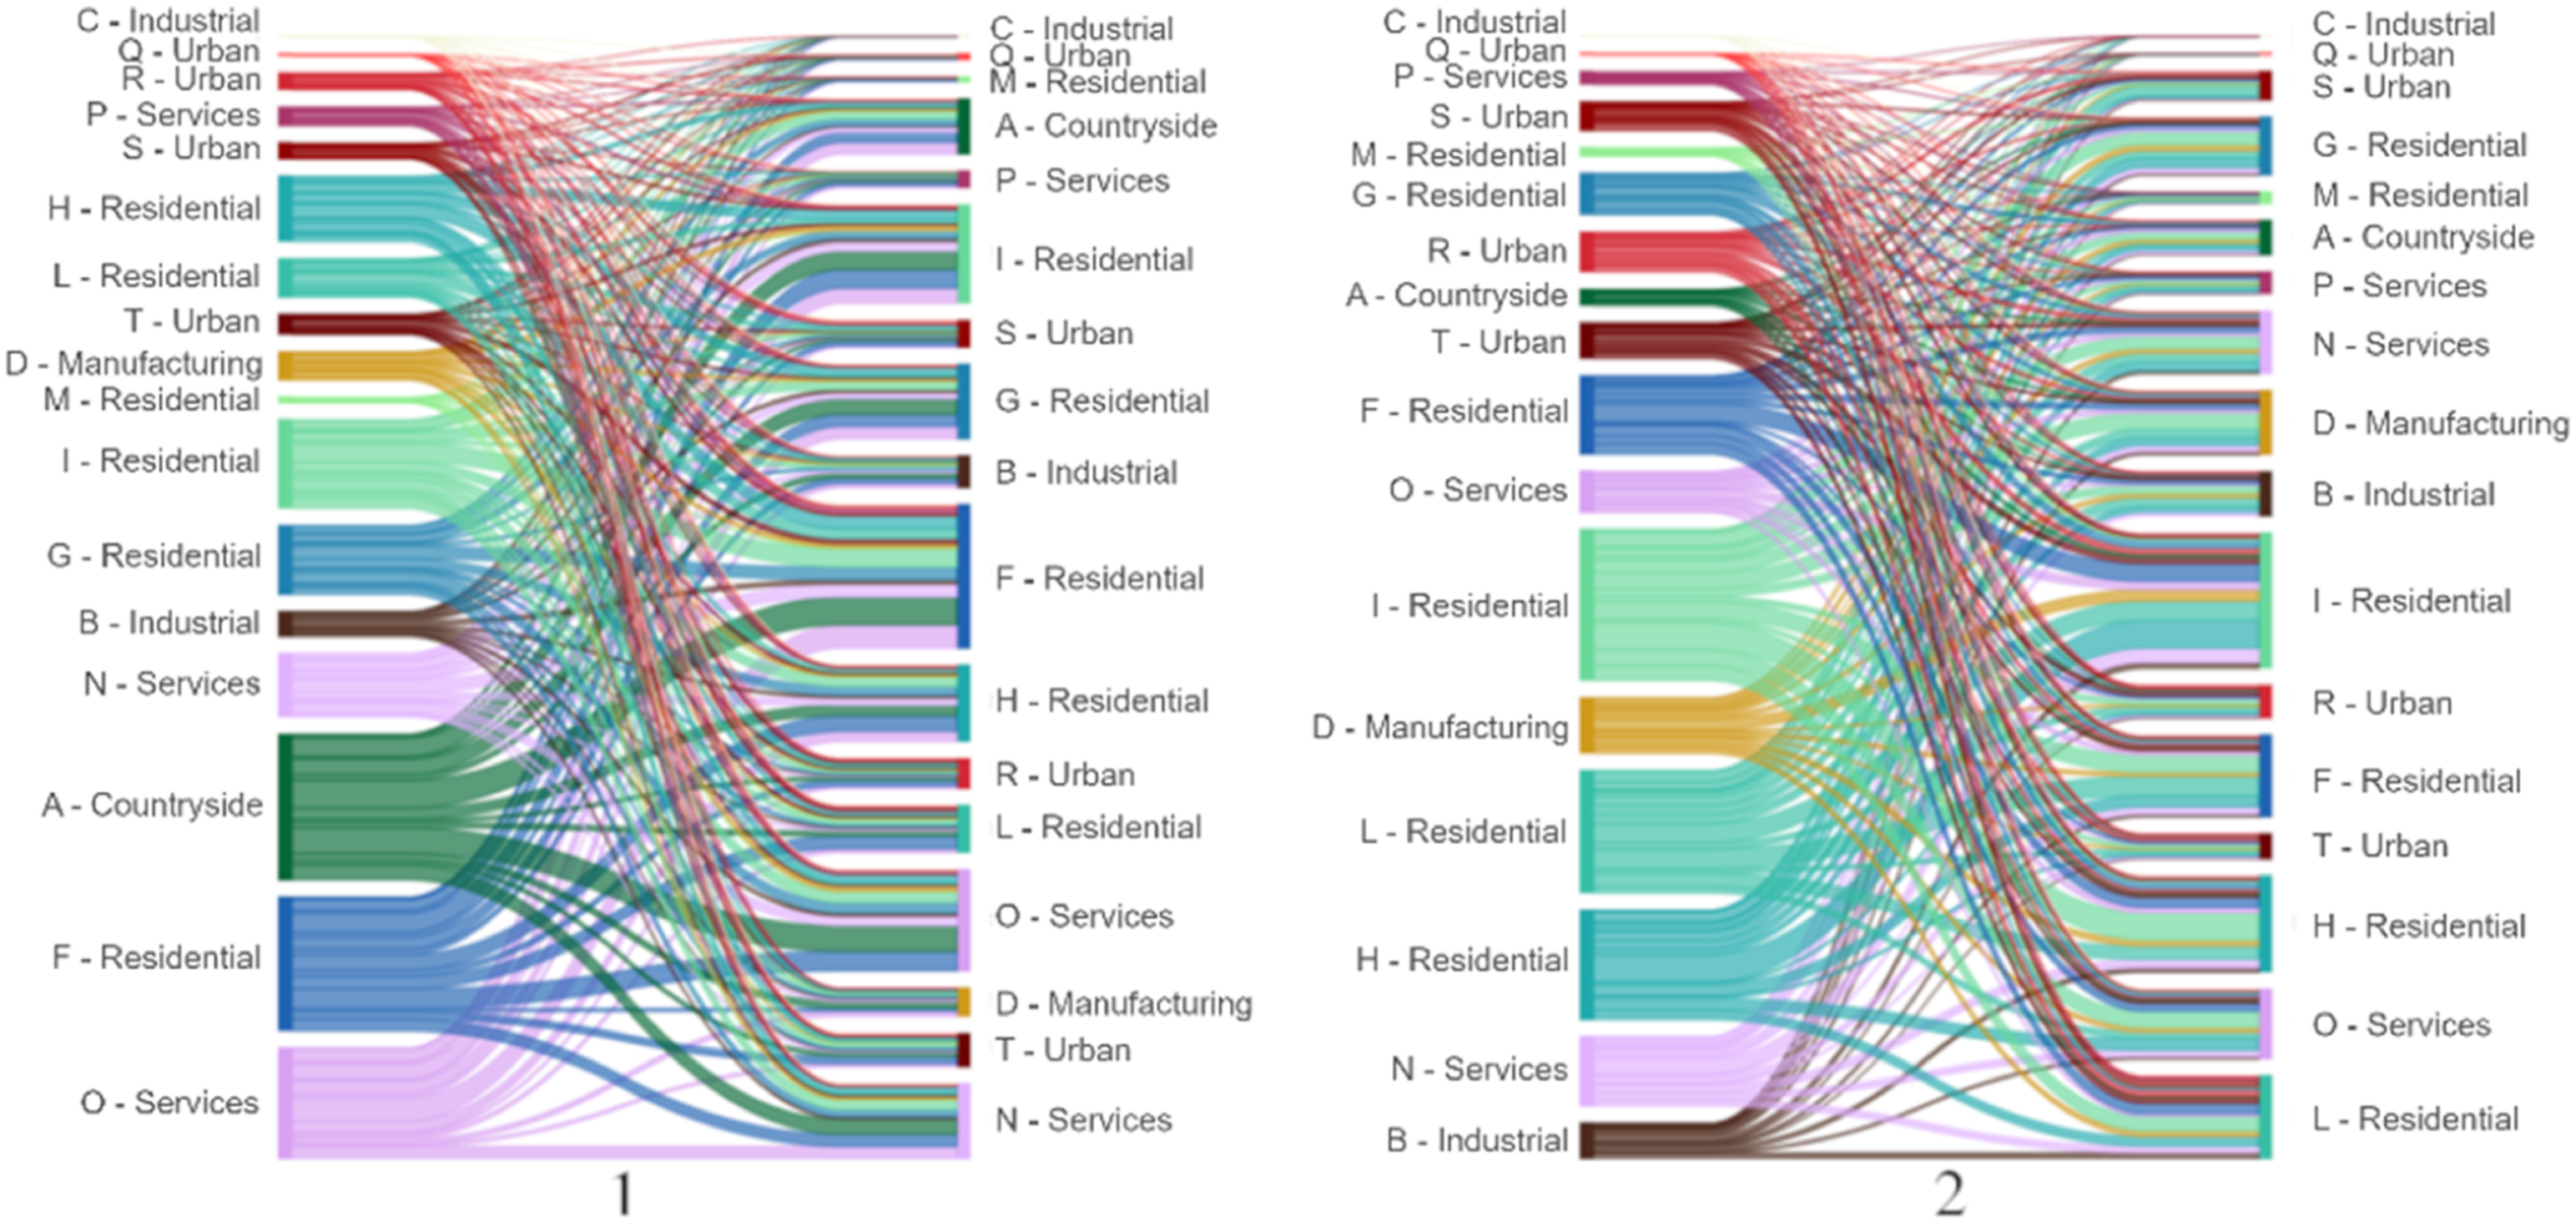
Discussion and conclusion
This work aims at identifying differences and similarities in how people living in areas of varying deprivation levels are exposed to certain urban contexts over the day. Advancing previous studies that investigate the relationship between human mobility and social inequalities we give a predominant focus to the temporal dimension and functional contexts of locations. GPS trajectories are transformed to become daily sequences of functional signatures synthesizing the functional nature of the environment a person is exposed to during the day.
We observe behavioural patterns that are typical of all population groups, such as the increased likelihood of moving within the same functional signature and the crucial role of commuting in everyday life. At the same time, we also note marked differences between the kind of functional signatures and the temporal pattern of transitions that are more commonly experienced by those living in more deprived areas and those living in less deprived areas.
Overall, these patterns partly reflect how the population is distributed across IMD-signatures strata, as we can see by comparing the trajectory analysis results with the Spectus.ai population distribution (see Figure 3). This expectedly suggests that the functional signature of the home location has an influence on the types of environments experienced during the day. People residing in urban-based signatures, residential mixed-use and well-served as well as industrial-manufacturing areas are more likely to be also living in areas with higher levels of deprivation. This relationship is mirrored in the daily semantic trajectories of people that live in more deprived areas which also tend to be more exposed to denser, better served urban environments. On the contrary, the countryside and low-density residential areas seem to be more highly associated with lower level of deprivation when we look at both where people live and where they tend to spend more time in, although the working day activities (9 a.m. to 5 p.m.) happen in well-served, service and urban areas rather often for these groups as well.
These differences can be interpreted based on the capability to reach opportunities that different population groups have. As previous studies have shown, in Great Britain (Dargay and Clark, 2012; Stead, 2001) people on lower income tend to travel shorter distances and live in larger urban areas (Bailey and Minton, 2018), while those earning more can afford higher transportation costs and travel longer distances from employment centre. Although poor access to services is one of the contributing factor to increase the deprivation level of an area, we note that people living in more deprived areas tend to be more exposed to better served signatures, which could be linked with these people aiming at travelling shorter distances and reduce transportation costs. At the same time, our results shed light on the importance of developing an integrated system connecting the countryside and suburbs with urban areas. As discussed in recent studies (Carlow et al., 2022; Yang, 2020) the boundaries between urban, sub-urban and rural areas are blurred, with urban areas increasingly tied to the countryside through commuting (Lichter et al., 2021). Our study provides further evidence that people, particularly those living in the least deprived areas, often transition from the countryside to more served, urban areas. Being these groups also those that more than others can afford expensive transportation costs, such as privately owned cars, it is key to plan and incentivise sustainable transportation options connecting urban areas with the countryside, to avoid high traffic and concentration of emissions in better served areas.
Our novel context-focused approach to analyse GPS trajectories, capturing daily exposure to functional signatures by population groups, allows to identify who is more or less affected by the characteristics of certain urban environments considering all day. For example, in this data exploration we found that urban-based signatures tend to be more common among the more deprived groups; this makes such groups more vulnerable to issues characterizing urban-dense contexts, such as heat islands (Li et al., 2020) or air pollution (Yang, 2020).
Along with context, we also explore the role of time in mobility patterns, finding differences between how the most and the least deprived groups transition across different functional signatures over a day. The higher likelihood of transitions at typical commuting times that we see for people living in the least deprived areas suggests that this group tends to have a rather regular working pattern. On the contrary, trajectories of those living in more deprived areas show an increase in transitions during typical working hours, which could be due to a higher proportion of unemployed people in this group and/or people employed in jobs that require moving during the day, such as jobs in logistics, transport and city services. In future works, our approach can be applied to explore how such patterns might have been changed by the COVID-19 pandemic which has brought about increased homeworking as well as increased demand for at home deliveries (Unnikrishnan and Figliozzi, 2021).
Further avenues for future research are opened up by this study. In particular, the results discussed so far are based on semantic trajectories in which stops are characterised by their functional signature. Although functional signatures are a synthetic description of 146 variables to define the functional nature of urban contexts, some individual factors, for example stops being home or workplace, also have a significant role in determining how we experience certain places. Future works will aim at further enriching the semantics of these trajectories with information on distance from home or work location to better capture the context of each stop in closer relation to the individual’s experience.
Furthermore, here we are considering population groups as separated silos based on IMD deciles and then we compare them. In the next steps, the analysis will focus on the semantic similarity across trajectories by clustering all observations to identify groups of behaviours independently from the IMD of the user. This will provide population groups based on their behavioural patterns in a data-driven fashion which can then be modelled against a wider variety of socio-economic and environmental indicators.
Supplemental Material
Supplemental Material - Inequalities in experiencing urban functions. An exploration of human digital (geo-)footprints
Supplemental Material for Inequalities in experiencing urban functions. An exploration of human digital (geo-)footprints by Alessia Calafiore, Krasen Samardzhiev, Francisco Rowe, Martin Fleischmann and Dani Arribas-Bel in Environment and Planning B: Urban Analytics and City Science
Footnotes
Acknowledgements
We gratefully acknowledge funding from the Engineering and Physical Sciences Research Council (EPSRC) through the following projects: ‘ITINERANT: InequaliTies IN Experiencing uRbAn fuNcTion. Spectus.ai data subscription’ and ‘InequaliTies IN Experiencing uRbAnfuNcTion (ITINERANT)’ through The Alan Turing Institute.
Declaration of conflicting interests
The author(s) declared no potential conflicts of interest with respect to the research, authorship, and/or publication of this article.
Funding
The author(s) disclosed receipt of the following financial support for the research, authorship, and/or publication of this article: This work was supported by the Engineering and Physical Sciences Research Council.
Supplemental Material
Supplemental material for this article is available online.
Notes
References
Supplementary Material
Please find the following supplemental material available below.
For Open Access articles published under a Creative Commons License, all supplemental material carries the same license as the article it is associated with.
For non-Open Access articles published, all supplemental material carries a non-exclusive license, and permission requests for re-use of supplemental material or any part of supplemental material shall be sent directly to the copyright owner as specified in the copyright notice associated with the article.