
Abstract
In land use analyses, procedural utility is the sense of well-being achieved by an actor while participating in a land market. Such utility has not been explored as an indicator of market preferences beyond applying exploratory Agent Based Models (ABMs) and hypothetical scenarios. This paper presents an empirical approach to procedural utility and applies it in the context of Greater Cairo (GC) – a context with different formal/informal markets that lead to different market preferences for buyers. We integrate the observed market preferences in GC in an ABM incorporating procedural utility. We explore the contribution of such utility on formal/informal urban segregation and urban expansion in GC. Our findings indicate that market preferences contribute to (1) the formulation of urban enclaves and lower socio-economic diversity and (2) making the urban system in GC more attractive, leading to higher urban growth. These findings validate the relevance of procedural utility in contexts where market regulations are distinct enough to trigger buyer market preferences – specifically formal/informal contexts of the Global South.
Highlights
• A procedural utility function is proposed to describe land market preferences • Procedural utility increases individual satisfaction upon residential relocation • Land prices and procedural utility lead to socio-economic clustering in Cairo • Procedural utility makes Cairo’s urban system more attractive to immigrants
Introduction
Land exchange between a landowner/development agent and a buyer agent includes the transaction of physical land plots (outputs) through a markets as set of exchange mechanisms (procedures) (Jackson, 2019). Land is a non-homogenous commodity due to the unique geographical nature of each land plot (Wallace and& Williamson, 2006). Markets can also vary in terms of regulations and how such regulations are interpreted (Gurran and& Bramley, 2017). Of particular interest to this research is how economic theories conceptualise the co-existence of multiple land market mechanisms in one context, and how preferences of land buyers towards such mechanisms are represented.
Procedural preferences are mostly represented through risk and information cost (Pratt & Grabowski, 2014). This approach conveniently merges procedural preferences with material preferences that are commonly represented in monetary terms. This is sufficient where market procedures are typically legalised, leading to similarities between land markets in terms of price agreement procedures (e.g. Buitelaar, 2007). Then, risk and information are the fundamental differentiators between market procedures. However, this is not the case in contexts characterised by informality, here defined as a set of implicit rules that are not embedded in regulated institutions (Goodfellow, 2020). The differences between markets extend to different forms of socio-economic networks between formal-informal actors that shape different market experiences. This leads to different psychological effects on the market actors that extend beyond risk and information cost.
Procedural utility considers those psychological factors; it focuses on the psychological satisfaction during the process of reaching an economic goal (Frey et al., 2004). It is associated with a sense of well-being achieved due to being involved in a preferred process. The aim of this paper is to demonstrate the feasibility of considering procedural utility as a relevant component of decision for land buyers. Using the case of Greater Cairo (GC), Egypt, a context rich with informality within market procedures, we conducted a survey of stated preferences towards buying land plots in informal and formal markets and observed the relevance of procedural utility. We apply a procedural utility land use Agent Based Model (ABM) to assess the role of procedural utility in that market’s dynamics – this model has been specifically developed for deployment in Global South contexts. We show that procedural utility can be incorporated using quantitative methods that are traditionally based on material utility.
In the following sections, first, we introduce procedural utility and propose a quantitative observational approach. Second, we introduce Greater Cairo, Egypt, as the case study, and we discuss empirical precautions when observing procedural utility. We highlight a set of interviews and surveys deployed in Cairo to specifically support this study. Third, we briefly introduce the procedural utility ABM and the implementation of Greater Cairo’s inputs into the model. We also discuss a set of experiments to identify the effect of procedural utility in Cairo. Fourth, we present the results of the ABM experiments. Finally, we provide some concluding remarks.
An overview of economic theories and market procedures
Neo-classical economics is based on the assumption that decision makers are completely rational and operate in a perfectly competitive market. This strict definition was criticised as it limits markets to one form which can only exist hypothetically (Jackson, 2019). Some neo-classical economics concepts were extended to consider risk and information availability in different markets. Although these costs add a procedural depth to markets in the decision-making process, they ignore the psychological factors that can form the underlying reasons for using a specific economic procedure. This is due to the formulation of these costs in monetary terms so that they can be applied within a neo-classical economics framework.
It is important to reflect on the relevance of psychological factors for markets. In contexts where market regulations are similar and mostly legalised, such as the Global North, psychological factors may not be relevant (Gurran and Bramley, 2017). Here, differences between markets are covered through valuation of risks and information cost. However, in contexts where market regulations are not completely legalised, with informality sweeping into the daily life, the market becomes an experience that depends on a complex socio-economic network (Goodfellow, 2020). This experience can vary across co-existing markets with different degrees of informality and legalisation, leading to different psychological experiences by market buyers. We argue that the aforementioned costs are not sufficient to express procedural preferences in less formal markets. Instead, procedural utility – a concept from behavioural economics – can be added to express the psychological motivations for specific economic procedures.
The concept of procedural utility
Procedural utility is a conceptual attempt to assess the value of the process of reaching an end goal rather than the end goal in itself (Frey et al., 2004). Frey (2008), expanding on Ryan and Deci (2004), claimed that three psychological innate needs are tied to procedural utility: (1) autonomy (being causal); (2) relatedness (belonging to a larger group); and (3) competence (being effective compared to others). The achievement of those needs lead to a sense of well-being which theoretically satisfies procedural utility.
Procedural utility has not been incorporated in land market contexts. However, it extends to fairness of markets mechanisms (Frey, 2008). Market mechanisms include the process of setting prices and selecting buyers. Prices can be: (1) fixed or capped by an organisation (e.g., government); (2) based on supply and demand; or (3) based on bargaining (Frey and Pommerehne, 1993). Buyers can be selected (1) randomly; (2) through first come first served; or (3) based on organisational rules (e.g. government committees). Frey and Pommerehne (1993) show that buyers have different preferences towards specific mechanisms on the basis of their fairness. In land markets, this translates to the fairness of the process of allocating land plots and pricing them.
Engaging in fair procedures leads to a sense of well-being has been used as a quantitative indicator of procedural utility (Frey and Stutzer, 2005). However, when collecting data to assess procedural utility, this approach requires that individuals share similar conditions with the exception of the process under consideration. This limits the applicability of using well-being to indicate procedural utility in contexts with different land markets since samples may fall into different socio-economic groups with different life conditions. To tackle these limitations, we propose a different quantitative approach to express the satisfaction of the psychological innate needs based on motivations.
Reasons for observing procedural utility
The three innate needs referred to by Frey (2008) were originally introduced by Deci (1980) as part of their Self-Determination Theory (SDT) and its multiple substantive theories. Most relevant to the discussion here is the Organismic Integration Theory (OIT). OIT hypothesises that external environments can be internalised by satisfying an individual’s three innate needs (Ryan and Connell, 1989). To identify such satisfaction, the OIT proposed motivations as observational indicators.
It describes four motivational categories over a continuum scale: (1) external motivation (avoiding punishment or achieving material gain); (2) introjected motivation (avoiding a sense of guilt); (3) identified motivation (the alignment of the process with one’s own values); and (4) integrated motivation (enjoying the action or activity in itself) (Deci and Ryan, 1985; Ryan and Connell, 1989). To observe these motivations, the OIT questions why an individual would undergo a process and provides potential answers that correlate to one motivational category (Ryan and Connell, 1989). Participants rate each answer over a scale from 1 to 4, attaching a quantitative value to each motivational category (Ryan and Connell, 1989). Hence, the overall motivation can be described as an aggregate value which subsequently indicates the satisfaction of the innate needs.
These motivations link back to procedural utility. According to (Frey et al., 2004, 2008), the satisfaction of innate needs leads to well-being and procedural utility. Hence, observing such satisfaction through motivations – as per the OIT’s approach (Ryan and Connell, 1989) – intrinsically indicates procedural utility. This entails that procedures are the external environment that affects the satisfaction of the innate needs and the internalisation of motivations. Markets can also be considered as a set of external procedures and mechanisms that affect individual buyers (Frey and Pommerehne, 1993; Jackson, 2019). Hence, it becomes plausible to observe motivations to buy in a market as an indicator of procedural utility.
The framing of procedural utility as strictly linked to psychological needs does not detach it from the factors neo-classical economics consider. In fact, procedural utility implicitly considers risk and information through fairness. It explicitly highlights market fairness and transparency as factors contributing to higher procedural preference (Frey, 2008) and interprets them as integrated motivations (Ryan and Connell, 1989). The more publicly disclosed information is available, the more a market is perceived as transparent and fair (Frey and Pommerehne, 1993) and less risky (Diamond and Verrecchia, 1991), thus increasing the integrated motivation for its users. Thereby, integrated motivation intrinsically describes the availability of information and risk.
Caution must be taken when incorporating procedural utility with the neo-classical economics concepts as duplications of risk and information cost may arise. For instance, traditional utility is a concept that is used in numerous land use analyses (e.g. Filatova et al., 2009) – from now on referred to in this paper as Output Utility. Output utility commonly represents the material benefit gained from land through its physical attributes, such as distance to a service (e.g. N. Magliocca et al., 2012). This sometimes is also embedded in bid-rent cases that consider risk premium costs and information cost (e.g. N. R. Magliocca and Walls, 2018). Thereby, in considering procedural utility in land use analyses, output utility should only represent the benefit from the attributes regardless of any procedural risk or information factors.
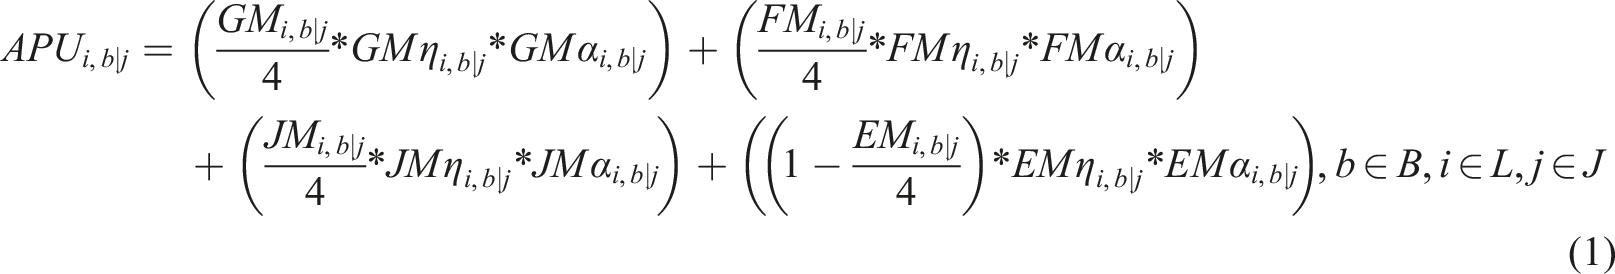
The mathematical formulation of procedural utility
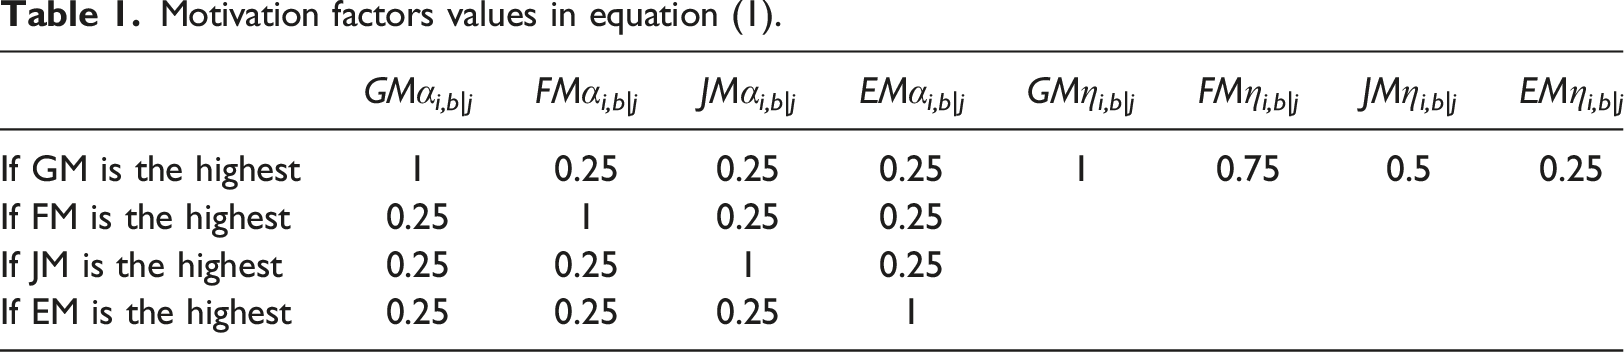
Procedural utility is calculated as described in equation (1) as a function of motivations. Motivations can quantify procedural utility with two precautions: (1) the procedural utility scale must be subdivided into four equivalent intervals each corresponding to a motivational category and (2) the effect of the highest motivational category must be exaggerated numerically. This follows the OIT’s proposals that: (1) the motivational categories fall on a continuum scale with equal intervals and (2) the highest motivational category qualitatively overshadows the rest (Ryan and Connell, 1989). • APU
i,b|j
is the aggregate procedural utility, • GM
i,b|j
is the integrated motivation, • FM
i,b|j
is the identified motivation, • JM
i,b|j
is the introjected motivation, • EM
i,b|j
is the external motivation, • GMη
i,b|j
, FMη
i,b|j
, JMη
i,b|j
and EMη
i,b|j
are factors corresponding to the highest APU value if the highest motivation value is the integrated motivation, identified motivation, introjected motivation and external motivation, respectively, • GMα
i,b|j
, FMα
i,b|j
, JMα
i,b|j
and EMα
i,b|j
are factors corresponding to the effective weight of the integrated motivation, identified motivation, introjected motivation and external motivation, respectively, on the APU numeric value (for the factors’ values, see Table 1). Motivation factors values in equation (1).
To assure that procedural utility is calculated in the scale of the output utility, buyers’ final choices between land plots in different land markets should be observed (as stated choices). The observations can be made through a revealed preference procedure. Alternatively, they can be made through stated preferences when it is challenging to directly observe market decisions, especially in informal contexts. In these cases, a buyer can decide to opt for a land plot with lower material value in favour of buying in their preferred market. The procedural utility of this preferred market must be equivalent to the differential of output utility to buy in that market. By comparing the maximum threshold output utility (defined as the maximum value of output utility the buyer is willing to lose so that they can buy in their preferred market) and the aggregate procedural utility (see equation (1)), a transformation factor can be calculated (see equations (2) and (3)).

This quantitative representation of motivations and procedural utility is not relevant in cases with relatively similar market procedures. These cases do not generate sufficiently different motivations that shows the role of the process in economic decisions. It is appropriate when market procedures are different enough to show relevant variations in integrated and identified motivations. This excludes contexts where regulations are legalised to the extent that all markets can be labelled as formal with minor procedural differences (Gurran and Bramley, 2017). It is more relevant to contexts where informality is part of the exchange procedures and social networks lead to the formulation of different market experiences. These experiences lead to different underlying motivations that extend beyond risk and information costs.
The case of Greater Cairo
Greater Cairo (GC) is Egypt’s largest urban and economic agglomeration with a population of around 21 million inhabitants (World Population Review, 2020). Around 70% of that population live in informal settlements (Sheuya, 2010). GC consists of a set of central areas that encompass historic Cairo and 19th and 20th century regulated, formal developments; many informal settlements extending to the north on desert land and to the west on agricultural land (Sheuya, 2010); and new satellite cities built with formal developments to attract inhabitants from the busy central areas (GOPP, 2012).
This clear division between formal and informal settlements is linked to the definition of ‘informality’ in this context. In 1982, informal housing was first defined in Egypt as ‘illegal housing, generally built in contravention of either zoning laws or building codes and hence unregistered’ (Abt Associates et al., 1982: vi). This made it easy for governmental institutions to create spatial boundaries for informal settlements, defined as ‘unplanned’ areas resulting from the illegal transformation of agricultural land into residential use (Elgendy, 2016). It must be noted that this formal-informal abstraction ignores how informality blends with formality in many social, economic and political aspects of daily life (Roy, 2004).
To account for the formal-informal spectrum in land markets, we categorise market procedures in GC in four categories: (1) the governmental market; (2) the lottery market; (3) the real estate market; and (4) the informal or social market. For an extended narrative on Cairo’s urban fabric and markets, see David Sims (2010).
The definitions of each category have been validated through unstructured interviews with GC inhabitants (Gamal, 2022) – these interviews have been conducted for developing surveys that specifically support an ABM. The government market includes plots or residential units provided by governmental institutions with fixed prices and a first come first served policy. This market is also active in new cities. The lottery market is based on random allocation of buyers to land plots or residential units with fixed prices. This is only applied in governmental low- and middle-income housing projects. The real estate market includes companies that base their prices on supply and demand. This market is mostly active in new cities and gated communities, both part of the formal market. Finally, the informal or social market is based on a bargaining process between the buyer and the seller. This market is mostly available in informal settlements due to its detachment from legal procedures.
Spatially, in GC, it is challenging to distinguish between the three types of formal markets. They are dispersed across the formal areas depicted in Figure S5 in supplementary material. Further, the prices set in the government controlled market usually follow the supply/demand prices set in the private real estate market. In contrast, the informal market is spatially less challenging to identify due to the unique physical characteristics of informal settlements in GC.
The survey
We designed a questionnaire specifically for this study to observe two aspects related to procedural utility in land markets (Gamal, 2022): (1) the motivation for involvement in land markets and (2) the relative weight of procedural utility in comparison to output utility. We observe these motivations through a direct question inquiring why an individual opts for a transaction of a land plot in a specific land market. Each answer represents one of the four motivational categories defined in the “Reasons for observing procedural utility” section and is scaled from 0 (least aligning with one’s reason to opt into a market) to 4 (most aligning).
The procedural utility weight includes multiple observational layers. First, the land plot attribute preferences are estimated via land plot comparison. These preferences are captured by presenting comparative cases of two land plots having different attribute values. We limit the attributes under consideration to the (1) area of the plot, (2) distance of the plot to services and (3) the number of streets bounding the plot. This keeps the number of comparisons low so that the questionnaire does not become overwhelming (Gamal, 2022).
Second, the threshold output utility a buyer is willing to sacrifice to remain in his/her most preferred land market is assessed. This is applicable by providing cases with two land plots falling in two different land market types. The land plot with lower attributes is always placed in the less preferred land market and vice versa. The point at which a buyer shifts to the less preferred market is where the output utility should have the same value as the procedural utility.
We sampled the population of GC based on the type of occupancy and focused on inhabitants of formal settlements who constitute 30% of the population. We limited the sample to inhabitants of formal settlements for two reasons. First, upon deploying semi-structured interviews, we identified that these inhabitants have access to different markets including informal (i.e. social bargaining) markets (Gamal, 2022). Hence, preferences towards informal markets are not ignored despite selecting a sample of formal settlements inhabitants. Second, piloting the surveys for inhabitants of formal and informal settlements indicated the former are more likely to provide reliable answers without direct supervision (Gamal, 2022). Including informal dwellers requires supporting surveys with semi-structured interviews which risks biasing preferences.
We recruited 96 random participants to reach a 95% confidence rate and a 10% margin of error. Our aim is to validate the presence of an effect of procedural utility and use the data to apply the ABM model. We do not aim to form a completely representative sample of GC.
Survey results
The most and least preferred attributes are distance from services and street exposure, respectively (see Figure 1(a)), whereas the most and least preferred markets are the real estate market and the government market respectively (see Figure 1(b)). The majority (65.4%) of participants have a procedural utility weight (β
i,b|j
) ranging from 0 to 0.4, whereas for 21%, it ranges from 0.8 to 1 (see Figure 1(c)). Results for Greater Cairo’s sample of buyers in the formal market.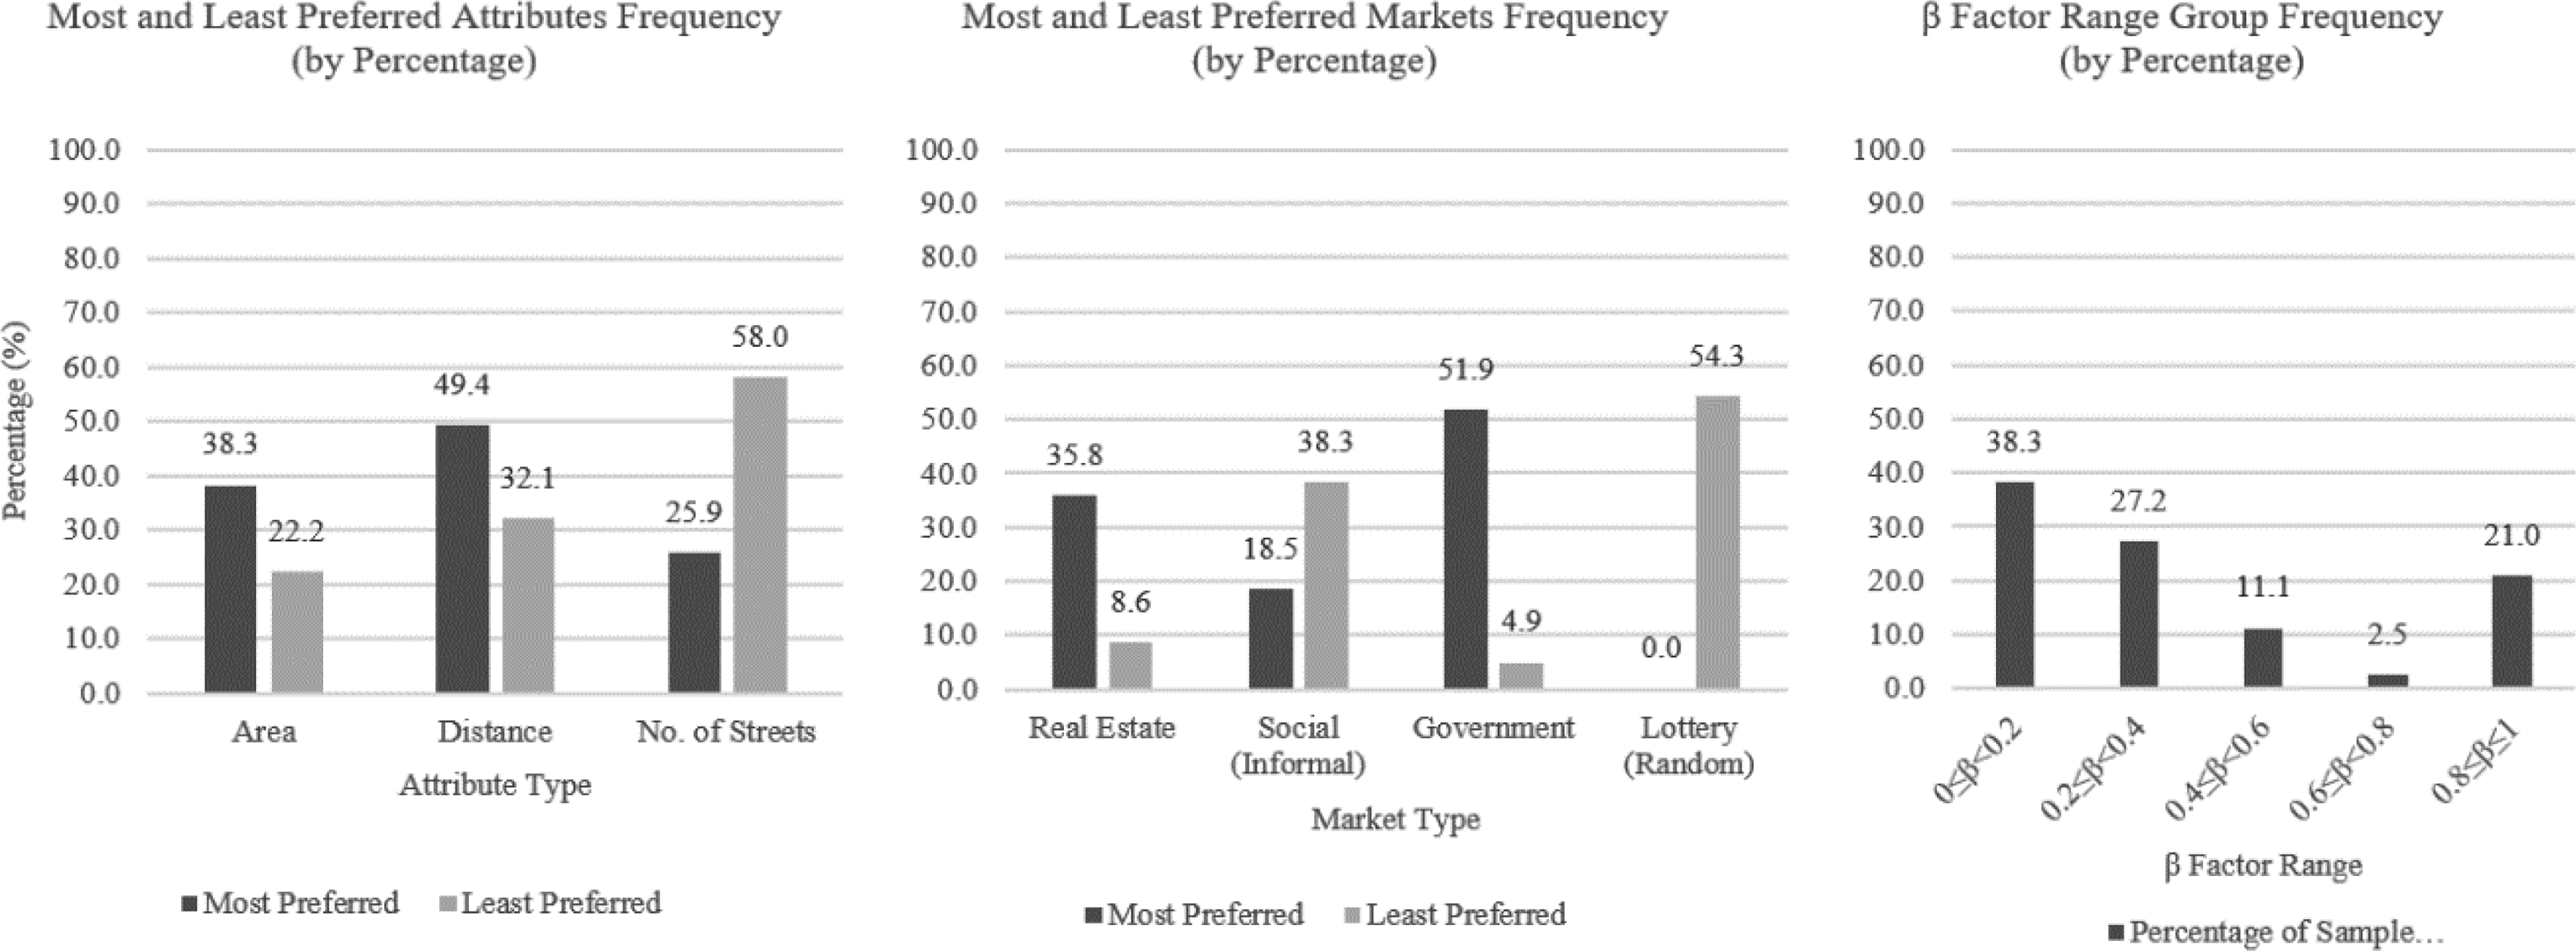
The Greater Cairo agent based models
We use an ABM due to its capacity to simulate individual economic decisions during land choice (Crooks et al., 2017). This aligns with the focus of utility theories on individual choices. The model simulates land plots as pixels and buyers as agents with the capacity to decide in which market and where to buy a plot. Agents behave based on their age, and they age 1 year for every modelling step. At relocation age, agents search their neighbourhood for a land plot to relocate – this simulates the occurrence of a lifetime event such as marriage. Agents explore a neighbourhood within their bounded rationality to identify a utility threshold that they want to exceed. They then try to make a relocation to a set of land plots. They identify the output utility, procedural utility and willingness to pay for the plots. They make a relocation to a plot if (1) its overall utility exceeds their utility threshold and (2) its price is lower that their willingness to pay. At breed age, agents generate a child agent with similar preferences. At death agent, agents leave the system. For a more detailed description, see the supplementary material.
The GC spatial configuration needs to be conceptualised to apply the ABM model. Each agent represents six land plot buyers, and each land plot is assumed to house 50 households. This minimises the simulation resources demand while allowing the ABM to reach the 21 million population of GC. The model uses a vector GIS map for GC’s neighbourhoods to allocate the market types, street networks and services. The model transforms the vector map to an approximately 80 m resolution pixel map (depicted in Figure S5 in supplementary material). Each pixel represents six land plots in formal settlements and 12 land plots in informal ones; the average size of formal plots is approximately double that of the informal ones (David Sims, 2010). The aggregation of more than one plot into one pixel is required for simulation run time efficiency. Each area is assigned a market category: market 1 for formal areas (the government, the lottery and the real estate markets) and market 2 for informal areas.
The Greater Cairo dataset
ABM’s buyer agents input based on Greater Cairo case study.
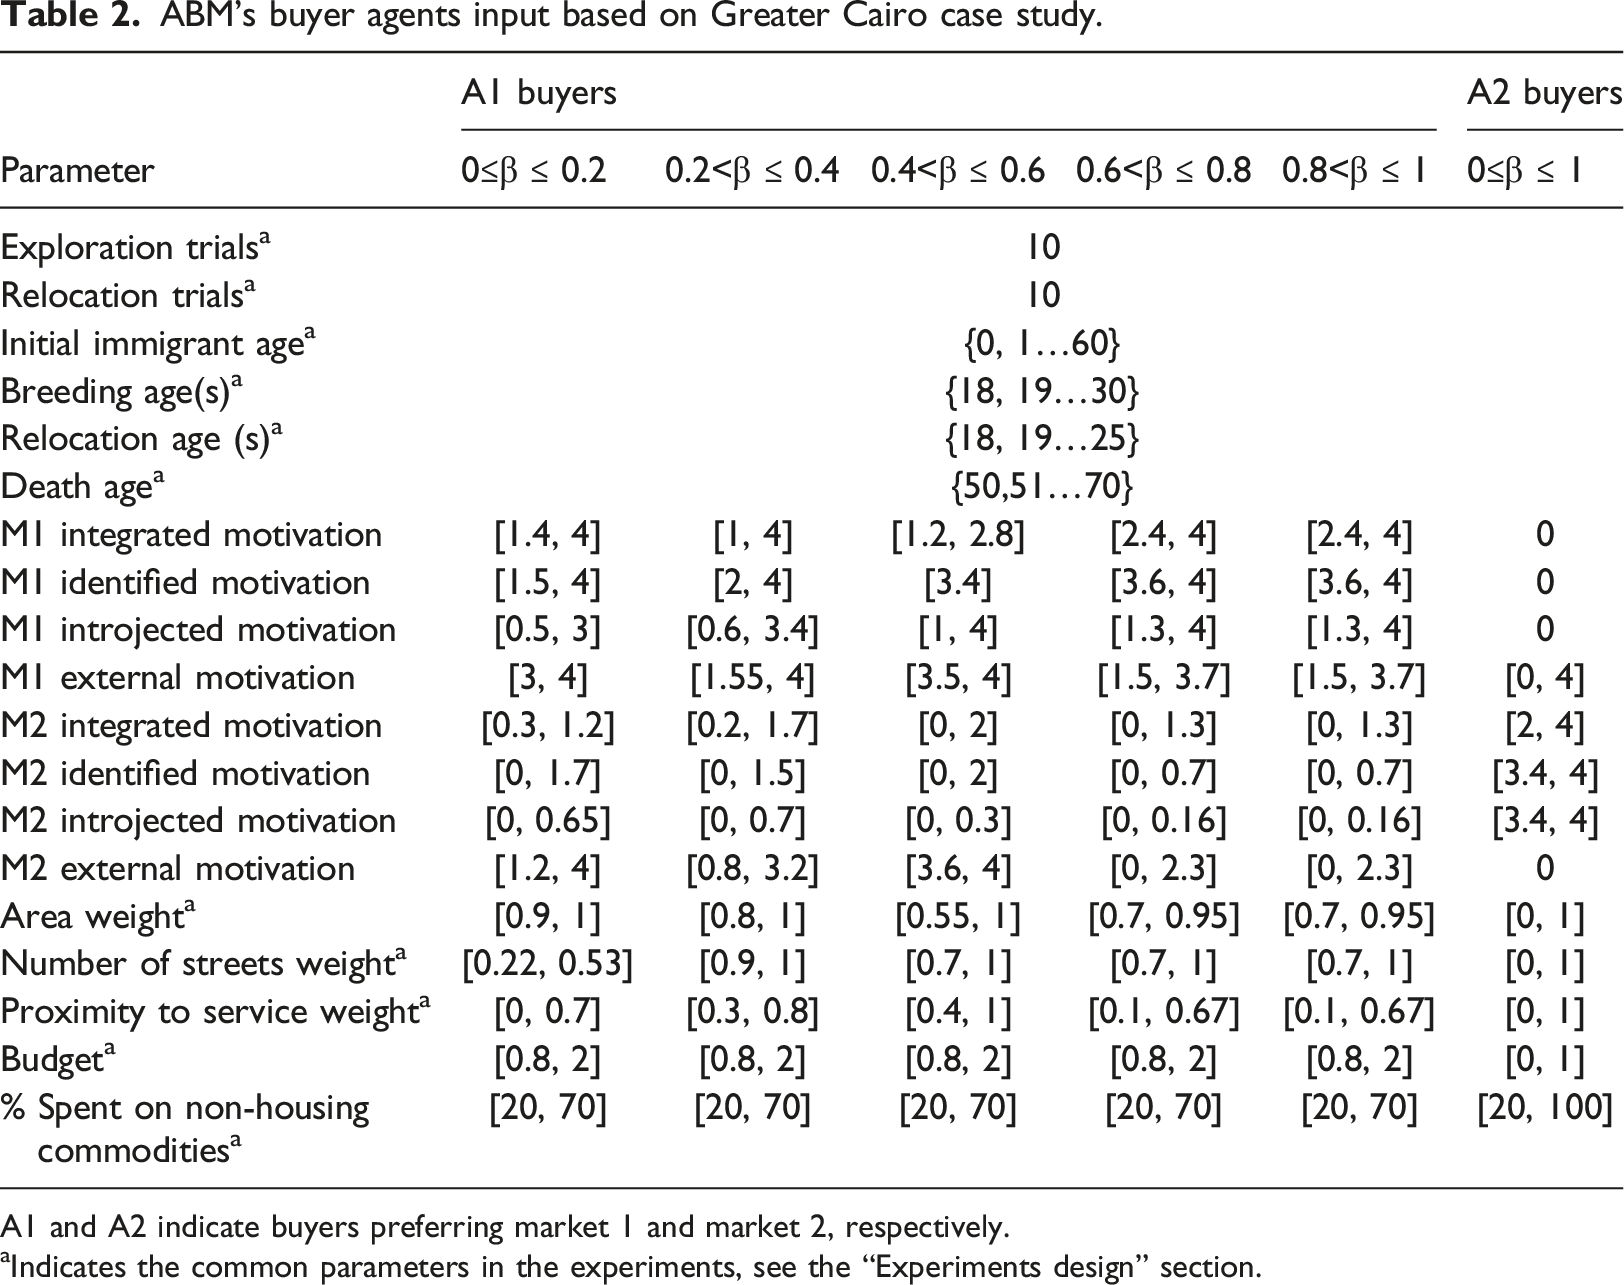
A1 and A2 indicate buyers preferring market 1 and market 2, respectively.
aIndicates the common parameters in the experiments, see the “Experiments design” section.
ABM’s land plots input based on Greater Cairo’s context.
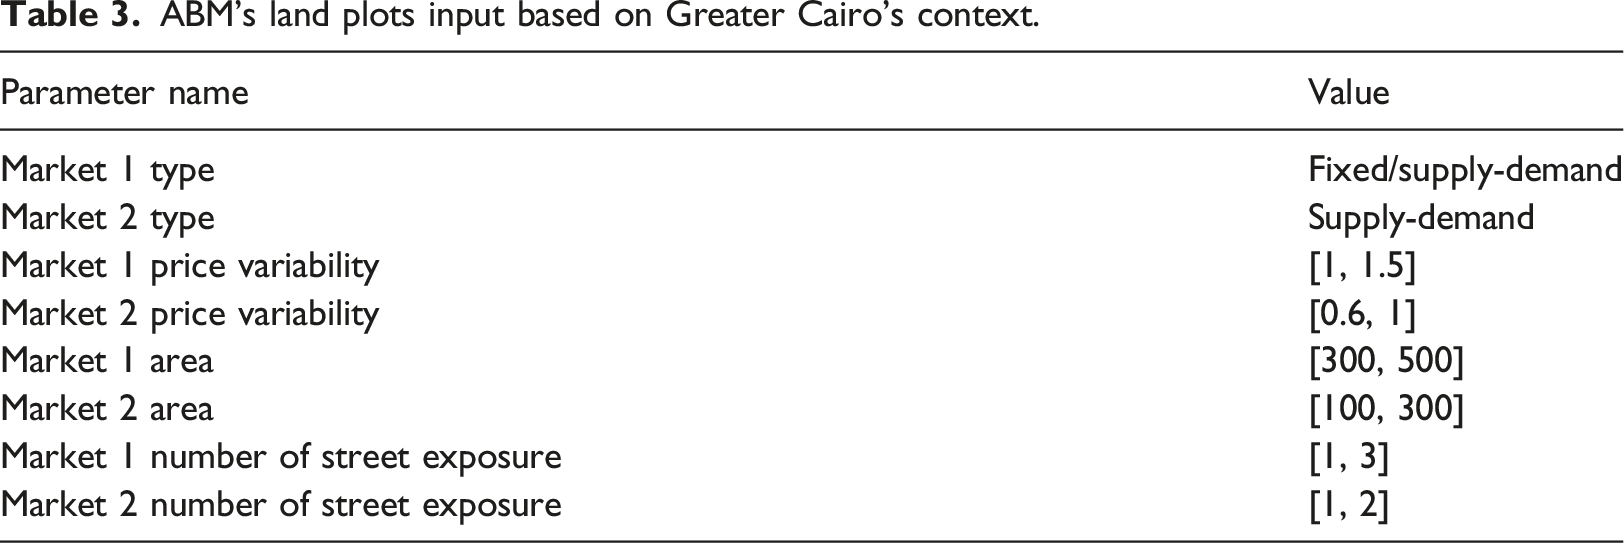
Experiments design
Three experiments (‘No Budget’, ‘Fixed Prices’ and ‘Supply and Demand’) are designed to explore the role of procedural utility considering different market and buying context. We select those experiments to explore the relation between market preferences (procedural utility) and buyers’ budgets. Comparing between experiments with and without budget bound buyers can contribute to discussions around the validity of defining submarkets based on buyers’ budgets in GC (Jones and Watkins, 2009).
The three experiments have two sets of runs: once with a procedural utility weight of 0 (β i,b|j = 0); and another with the procedural utility weights observed for GC (β i,b|j = GC). All experiments use the same ABM initialisation with 3000 agents, representing the spatial distribution of plots and buyer agents in 1975 as depicted in Figure S5. Simulations run for 30 years from 1975 till 2005.
To deal with the built-in stochasticity that the ABM model manifests, all model runs are repeated 10 times per β i,b|j value and results are averaged. 1 All the runs have a set of input parameters in common to maximise comparability (see ‘a’ in Table 2).
For all three experiments, market 2 operates a supply and demand price formation mechanism.
Experiment 1 ‘no budget’
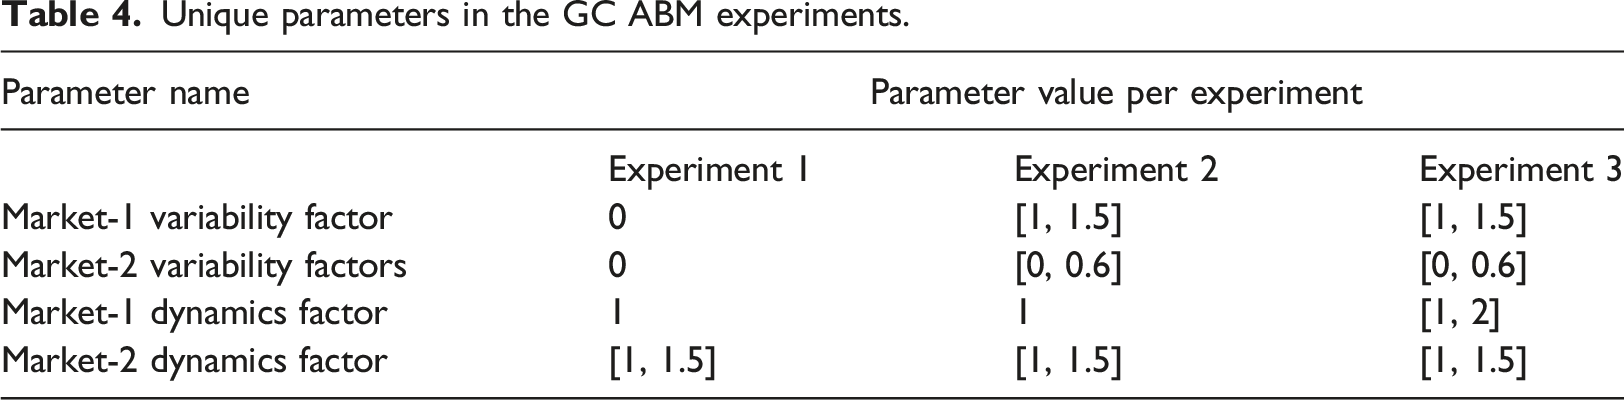
Experiment 1 ‘No Budget’ isolates the effect of utility from price formation by ignoring the buyers’ budget as a decision variable, focussing only on the buyer’s utility (both output and procedural). Buyers have no budget constraints. The experiment sets the price variability factor to 0 for both markets 1 and 2 (Table 4). Accordingly, all land plot prices are set to 0 and all land plots become affordable to all buyers. Hence, buyers only need to find a plot with a higher overall utility than the threshold utility they need to exceed. The threshold utility is defined as the average utility of a set of random plots in the buyer’s neighbourhood. That is, buyers explore a set of plots in their neighbourhood and define a threshold utility they need to exceed. This experiment aims to assess the effect of procedural utility in isolation from all price allocation mechanisms and budgets. This is achieved by comparing the β i,b|j = GC (E1-βGC) and β i,b|j = 0 (E1-β0) results.
Experiment 2: ‘fixed prices’
Experiment 2 ‘Fixed Prices’ (E2-β0 and E2-βGC) explores the variations in the role of procedural utility in a configuration of market 1 that only considers fixed prices, i.e., the real estate market operates under the same rules as the government and lottery markets. The variability factors are allocated according to GC’s dataset values (Table 4). This experiment aims to identify the effect of prices on land use change in the ABM. In this case, comparing the results with experiment 1 can provide insights into how buyers differentiate procedural utility and prices.
Experiment 3: ‘supply and demand’
Unique parameters in the GC ABM experiments.
Discussion: model results
The performance of the ABM is measured by three indicators (demographic change, buyer satisfaction and diversity) that represent how the land market choices influence buyer satisfaction and the spatial structure of GC. We also discuss a fourth indicator (isolation) in the supplementary material.
The demographic change is the mean change in the number of buyer agents from the beginning to the end of the simulation. Positive numbers indicate more buyers per year have successfully relocated in GC, whereas negative numbers indicate more buyers per year failing to find a suitable new location. The satisfaction is an indication of the effect of procedural utility on buyers’ decisions in terms of market choice, stating whether a buyer is occupying a land plot in their preferred market or not. In that sense, a buyer agent preferring market 1 (A1) or market 2 (A2) is satisfied if it occupies a market 1 (M1) or market 2 (M2) plot, respectively. Diversity is used as an indicator of segregation. Segregation is a phenomenon where homogeneous neighbourhoods emerge based on socio-economic aspects (Park and Burgess, 1925). It can be measured through non-spatial and spatial indices. Non-spatial indices compare a portion of the population in a spatial unit to the population in the whole study area (Wong, 1998). Some of the commonly used indices are the diversity index (how diverse the population in a spatial unit is compared to the total population) (White, 1986) and the dissimilarity index (how a portion of the population in a spatial unit is dissimilar to the total population) (Massey and White, 1996). These measures do not account for the spatial clustering of populations across neighbouring spatial units. To make them spatial and account for spatial clustering, the population in each spatial unit and its immediate neighbours must be considered (Wong, 1998). For this study, we use the spatial diversity index; we consider the population of buyers preferring each market in each plot and its Moore neighbourhood (see equation (4)).
Effects of procedural utility
All three experiments show similar trends within the two sets of at β i,b|j runs, β i,b|j = 0 and β i,b|j = GC. For the sake of brevity, this discussion exemplifies with the results of experiment 1, that is, E1-β0 and E1-βGC.
Demographic change
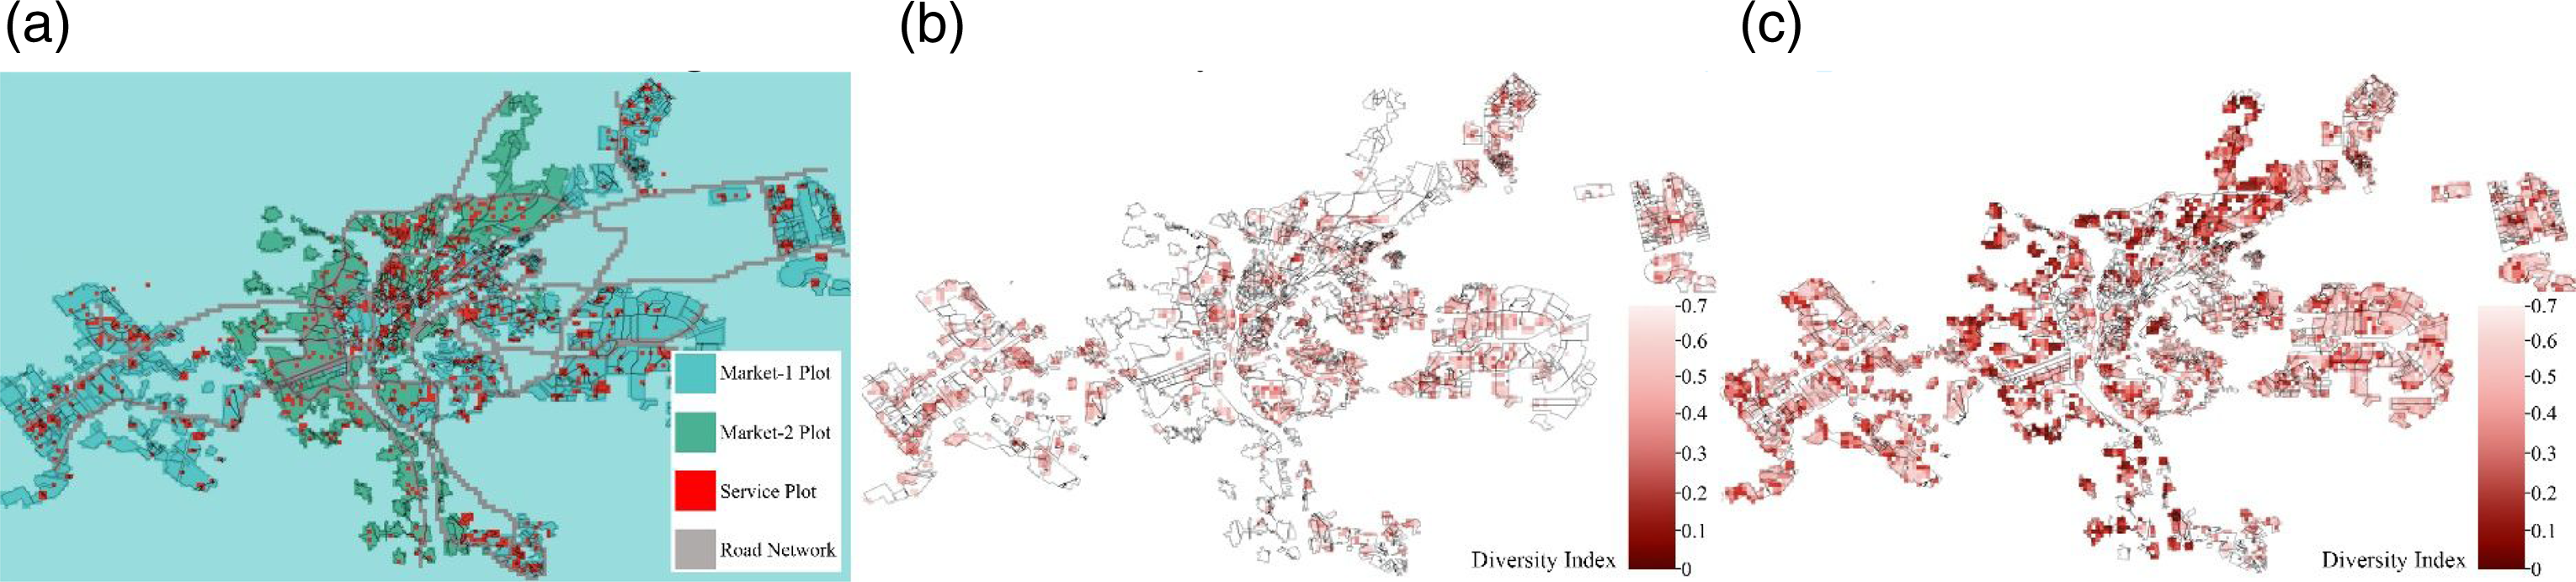
All experiments experience positive net number of buyers per year (positive slopes in the number of buyers graph in Figure 2 indicate urban growth). E1-β0 runs with have a substantially lower net buyers per year compared to E1-βGC. The net number of buyers per year reaches a mean of 29.6 for E1-β0 and 119.8 for E1-βGC. This is because the lack of procedural utility generally decreases the overall utilities of all land plots. This decrease is relatively higher for M2 plots due to their lower attribute values and low output utilities because in M2 the plot material value tends to be lower. Hence, M2 plots become undesirable in relation to their M1 counterparts. Overall, this leads to substantially higher relocation failure rates due to the large number of available M2 plots in GC, leading to lower urban growth (see Figure 3(a)). Net number of buyers, satisfaction and diversity index. (a) ABM at initialisation and (b) diversity index map for E1-β0 and (c) E1-βGC.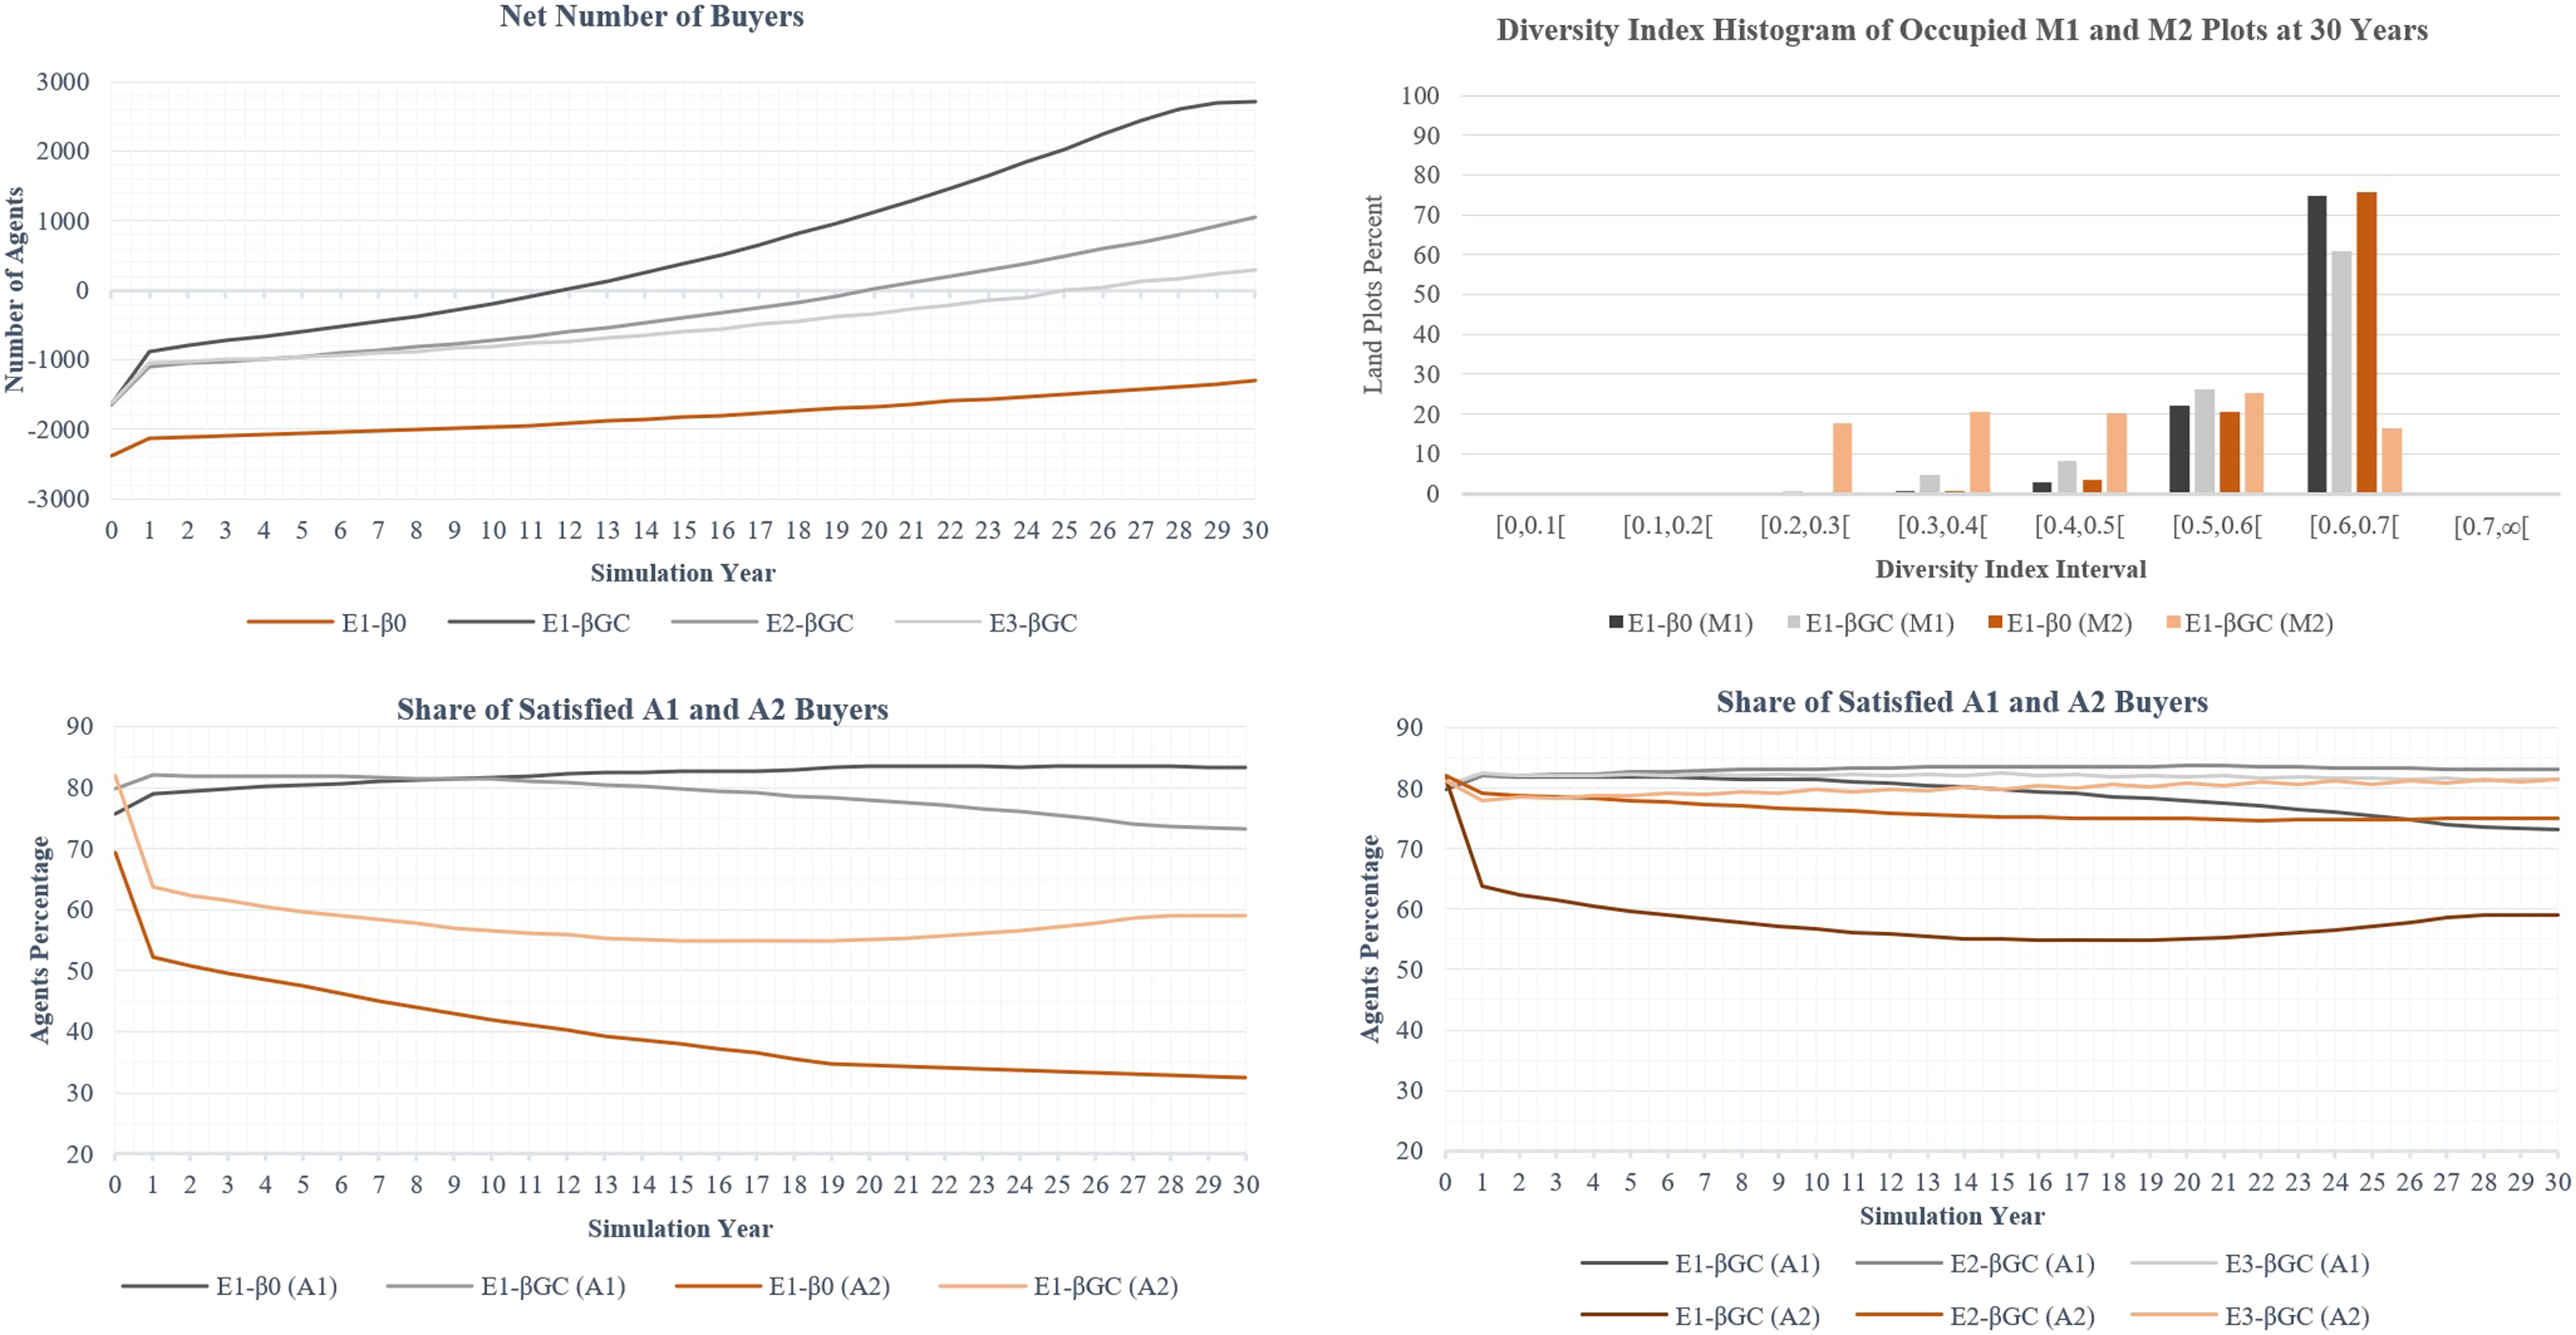
Satisfaction
Out of all A1 buyers, the percentage satisfied is higher at a procedural utility weight β i,b|j = 0. For instance, at 30 years, the percentage of A1 satisfied buyers has a mean of 83.2% for E1-β0 and 73.1% for E1-βGC β i,b|j = GC. In contrast, out of all A2 buyers, the percentage of satisfied buyers is higher at E1-βGC. The mean values for A2 satisfaction reach 32.6% and 59.1% after 30 years at E1-β0 and E1-βGC respectively. The reasons behind such contradiction lie in the relatively high M1 land plot attributes (which lead to higher land plot cost) and the high net number of buyers. At E1-βGC, the high net number of buyers generally leads to fewer available land plots to occupy. With fewer M1 than M2 plots in GC, A1 buyers experience a shortage in unoccupied M1 plots at later simulation years. Subsequently, A1 buyers end up being displaced to M2 plots, decreasing A1 buyers’ overall satisfaction rates. In contrast, E1-β0 has much fewer buyers and an abundance in high output utility M1 plots. This makes A1 buyers more likely to be attracted to their more preferred M1 plots due to their high output utility. The lack of procedural utility leads to the same effect on A2 buyers – they are attracted to M1 plots. This explains why A2 buyers have lower satisfaction at E1-β0 in comparison to E1-βGC.
Diversity
Diversity for M1 plots and M2 plots is higher in E1-β0 compared to E1-βGC (see Figure 2). In E1-β0, 74.9% of occupied M1 plots have a diversity index higher than 0.6, compared to 60.9% in E1-βGC. The difference is more significant for M2 where 75.7 of occupied M2 plots have a diversity index higher than 0.6 in E1-β0, compared to only 16.3% in E1-βGC. Only 0.3% of occupied M1 plots have a diversity index lower than 0.4 in E1-β0, whereas in E1-βGC it is 4.8%. For occupied M2 plots, only 0.5% have a diversity lower than 0.4 in E1-β0, while this is significantly higher at 38.2% in E1-βGC. These findings indicate that considering market preferences makes buyers more likely to cluster in the markets they prefer, leading to lower diversity (see diversity maps in Figure 3).
In summary, procedural utility leads to a higher net number of buyers, higher relocation success rates and the clustering of buyers according to their market preferences.
Procedural utility and budgets
Comparing the three experiments provides insights on how market prices and procedural utility interact. Since both sets of β i,b|j runs show similar trends, only β i,b|j =GC results are shown in this section unless stated otherwise, that is, results of E1-βGC, E2-βGC and E3-βGC.
Demographic change
E1-βGC has the highest urban growth, followed by E2-βGC and E3-βGC (see Figure 2). This is because buyers have no budget constraints in E1-βGC, i.e., they can always afford a land plot. This leads to high relocation success rates with a mean net number of buyers per year of 119.8. The addition of fixed markets in E2-βGC adds a probability that buyers fail to relocate due to unaffordable plot prices. Hence, it reaches a mean net number of buyers per year of 71.6. It follows that modifying M1 to a supply–demand market in E3-βGC leads to higher prices and lower relocation success rates. Hence, the mean net number of buyers per year in such case reaches the lowest value of 44.6.
Satisfaction
It is relevant to analyse the satisfaction of A1 buyers separately from that of A2 buyers. For A1 buyers, E1-βGC has the lowest percentage of satisfied buyers with a mean of 73.2%. Otherwise, E2-βGC and E3-βGC have relatively similar satisfaction shares at a mean of 81.5% and 83.1%, respectively. The lower satisfaction rate of E1-βGC may be due to the high net number of buyers in that experiment. In such case, most M1 plots become occupied (see Figure S6 in supplementary material) and A1 buyers can only relocate to the more abundant M2 plots.
For A2 buyers, E1-βGC, E2-βGC and E3-βGC rank from lowest to highest for the percentage of satisfied A2 buyers with a mean of 59.1%, 75.1% and 81.6% after 3 years, respectively (see Figure 2). The low satisfaction rate in E1-βGC may be due to neglecting prices along with the higher attributes and output utility of M1 plots. These high output utility values overshadow the high procedural utility of M2 plots for A2 buyers. However, when introducing prices in E2-βGC and E3-βGC, the high attribute values of M1 plots translate into high plot prices, acting as a barrier that displaces A2 buyers to more affordable M2 plots.
Diversity
Diversity is slightly higher for occupied M1 and M2 plots in E3-βGC compared to E1-βGC and E2-βGC (see Figure S8 in supplementary material). For occupied M1 plots, 70.8% have a diversity index higher than 0.6, compared to 60.9% and 62.8% in E1-βGC and E2-βGC, respectively. This aligns with observed high difference in the percentage of unsatisfied A2 buyers between E1-βGC (40.9%) and both E2-βGC (24.9%) and E3-βGC (18.4%). This high percentage in E1-βGC indicates that a higher number of A2 buyers occupy M1 plots, compared to E2-βGC and E3-βGC. A2 buyers are then more likely to cluster in M1 plots in E1-βGC which contributes to lower percentage of high diversity plots in occupied M1.
For M2 plots, diversity is relatively similar except across the intervals between 0.2 and 0.3. The percentage of M2 plots with diversity between 0.2 and 0.3 rank from highest to lowest in E1-βGC, E2-βGC, E3-βGC with the values of 17.8%, 15.1% and 13.1%, respectively. Similar to M1 plots, these observations align with the slight differences in the percentage of unsatisfied A1 agents in E1-βGC (26.8 percent), E2-βGC (18.5 percent) and E3-βGC (16.9 percent). The higher percentage of unsatisfied A1 buyers in M2 plots makes them more likely to cluster in such plots, and this leads to higher percentages of low diversity plots.
Conclusions
We proposed the concept of procedural utility as a theoretical apparatus to quantitatively consider the psychological aspects that lead buyers of land plots to explicitly consider procedural preferences in their decisions. We hypothesised that contexts with informal market experiences and different market regulations create significant difference in the decision-making process of buyers by differentiating material from procedural utilities. This can make the psychological factors more apparent and relevant when comparing such markets. These factors are neglected in traditional approaches that consider market procedures through risk premium and information cost values.
To test our hypothesis, we conducted a field survey on procedural utility in GC. Our findings indicate that market procedures can influence economic decisions. While this can be due to risk and information cost, we observed high integrated and identified motivation rates. This entails that the gratification of the process and the fairness of a given market are some of the underlying reasons for preferring this market – clearly beyond what cost-based factors can express.
We incorporated the survey results in an ABM and explored the relation between market preferences, urban growth and diversity as an indicator of segregation. The ABM results show that market preferences play a significant role in urban growth and spatial diversity. First, urban growth is higher in cases where buyers highly value markets. Second, the diversity index is broadly lower with higher consideration of market preferences as buyers tend to cluster in their preferred market – leading to observed spatial segregation. This is apparent in GC where informal markets are attractive to a category of buyers with specific market preferences and budget constraints. This leads to more successful relocations, high mean buyers per year and clustering in informal markets. This partly explains the formulation of informal urban enclaves in the north and north-west of GC.
However, the ABM results must be approached with caution. First, the structure of the model can be leading to the observed trends. This is true for satisfaction where agents are expected to use their preferred market. Yet, there are emergent patterns in experiments with budget considerations – A1 agents are more satisfied despite being at a higher risk of being forced into M2 market due to budgets. This implies that there is a complex relation between budgets and market preferences that is not a direct result of the model structure. Second, the model is based on surveys of stated preferences from a limited sample in GC. This limits the ABM predictions due to the statistical limitations of its input. However, we do not aim to make exact predictions of the urban future. We aim to show comparative trends in segregation and urban growth with and without considering market preferences. This allows us to highlight the relevance of considering procedural utility in the Global South context with limited observations. We expand on the validity of the results and the conclusion in the supplementary material. Third, the model does not simulate multi-step negotiations and bidding. This does not limit this study as buyers are aware of the details of the market procedures through motivations. It also does not bias the results related to the effect of these motivations on market choices (see supplementary material).
The proposed analysis can be applied in contexts beyond GC as long as they satisfy two criteria: (1) the context includes price setting mechanisms that trigger various motivations – this is expected in the Global South where formal-informal markets coexist and (2) buyers can clearly separate between different price setting mechanisms.
This research can be expanded to inform policies. We argue that ABMs can be developed as a decision support tool. Policies in GC include the imposition of specific market mechanisms in new developments targeted to attract informal dwellers. We will develop an interactive user interface for the presented ABM to support policy makers in identifying the potential effect of proposed market mechanisms on the attractiveness of new developments to formal or informal dwellers. For instance, in GC, social housing projects can be more attractive to the target demography if they are acquired through social bargaining. The research can also be expanded by simulating detailed buyer–seller interactions (e.g. bidding and multi-step bargaining). This can enhance the predictive capacity of the ABM; however, it increases complexity and adds challenges to interpreting outcomes.
Supplemental Material
Supplemental Material - The role of procedural utility in land market dynamics in Greater Cairo: An agent based model application
Supplemental Material for The role of procedural utility in land market dynamics in Greater Cairo: An agent based model application by Yahya Gamal, Nuno Pinto and Deljana Iossifova in Environment and Planning B: Urban Analytics and City Science.
Footnotes
Acknowledgements
We recognise that this research is part of a PhD project funded through Newton-Mosharafa [NMM13/18] – a joint fund between the British Council in Cairo and the Missions Sector in Egypt.
Declaration of conflicting interests
The author(s) declared no potential conflicts of interest with respect to the research, authorship, and/or publication of this article.
Funding
The author(s) disclosed receipt of the following financial support for the research, authorship, and/or publication of this article: This work was supported by the Newton Mosharafa; NMM13/18.
Supplemental Material
Supplemental material for this article is available online.
Note
References
Supplementary Material
Please find the following supplemental material available below.
For Open Access articles published under a Creative Commons License, all supplemental material carries the same license as the article it is associated with.
For non-Open Access articles published, all supplemental material carries a non-exclusive license, and permission requests for re-use of supplemental material or any part of supplemental material shall be sent directly to the copyright owner as specified in the copyright notice associated with the article.