
Abstract
Social frontiers arise when there are sharp differences in the demographic composition of adjacent communities. This paper provides the first quantitative study of their impact on household mobility. We hypothesise that conflicting forces of white flight and territorial allegiance lead to asymmetrical effects, impacting residents on one side of the frontier more than the other due to differences in the range of housing options available to different groups, and different symbolic interpretations of the frontier. Using Dutch registry data for the city of Rotterdam we identify ethnic social frontier locations using a Bayesian spatial model (Dean et al., 2019), exploiting the data’s one hundred metre resolution to estimate frontiers at a very small spatial scale. Regression analysis of moving decisions finds that the ethnic asymmetry of the frontier matters more than ethnicity of individual households. On the ethnic minority side of the frontier, households of all ethnicities in the 28–37 age range have reduced probability of moving compared to non-frontier parts of the city. The opposite is true on the Dutch native side of the frontier. We supplement this analysis with flow models which again find strong frontier effects. Our findings illustrate how the study of social frontiers can shed light on local population dynamics and neighbourhood change.
Introduction
Turner’s (1893) frontier thesis has shaped the etymology and symbolic potency of the ‘frontier’. As a result, frontiers evoke a wider set of meanings than merely bureaucratic delineation. They denote zones of contested space that drive, and are driven by, the aspirations and movements of people. Frontiers are to be advanced, defended, valorised and feared. They engender a sense of ingroup purpose and solidarity. And whilst it is true that frontiers represent the meeting of two contrasting communities, the term is not usually suggestive of integration, mixing or conviviality. Rather, frontiers carry overtones of contrast, separation and latent tension (Iyer and Pryce, 2023).
Mindful of these historical and etymological connotations, researchers have recently adopted the term ‘social frontier’ to describe a particular form of residential segregation where ‘steep differences in the racial, ethnic, religious, cultural or social characteristics’ (Dean et al., 2019: p. 271) occur at the border between adjacent communities. However, as with the broader use of the word, social frontiers are potentially more than purely geographical phenomena. They can take on symbolic meanings that influence attitudes, behaviour and wellbeing (Iyer and Pryce, 2023; Piekut and Pryce, 2022).
The emerging interest in social frontiers as a new focal point for segregation research is, in part, a response to longstanding concerns that the literature ‘does not address what happens at places where groups border’ (Legewie and Schaeffer, 2016: p. 131). Sack (1983, p. 55), for example, lamented the tendency of ‘conventional spatial analysis’ to overlook territoriality. As a result, ‘many of the forces moulding human spatial organisation’ remain unexamined (ibid). Similar criticisms have been made by Spielman and Logan (2013), Kramer (2017) and Dean et al. (2019). Whilst there have been inroads into the quantitative investigation of social frontier impacts on crime and anti-social behaviour (e.g. Legewie and Schaeffer 2016; Dean et al., 2019), the wide spectrum of other potential effects – such as psychological, health, demographic, economic and social impacts – remain largely unexplored.
The contribution of the current paper is to provide the first exploration of the relationship between social frontiers and residential mobility. We start by providing the first estimates of social frontier location in Rotterdam (and indeed the Netherlands) using the empirical approach developed by Dean et al. (2019). This adopts Lee and Mitchell’s (2013) locally adaptive spatial conditional autoregressive Bayesian estimation method to identify step changes across adjacent neighbourhoods in the proportion of nonwestern migrants. We then link these social frontier estimates (see map in Supplementary Material) to household moving behaviour to explore two key questions: (i) the specific question of how household moving decisions vary by proximity to social frontiers; and (ii) the broader question of whether social frontiers are associated with asymmetric impacts. With respect to the first, whilst there are powerful reasons to expect social frontiers to have significant impacts on geographical mobility (as we discuss below), to our knowledge there have been no attempts to quantify them. Indeed, the role of social frontiers seems to have been comprehensively overlooked which is surprising given the voluminous literature on household mobility (see review by Dieleman 2001). The second question has wider implications in the sense that the many and varied theoretical impacts of social frontiers (Iyer and Pryce, 2023) could radically differ depending on which side of the frontier one is on. Again, to our knowledge, none of the existing papers on social frontiers, including those looking at crime impacts (e.g. Dean et al., 2019), have considered the possibility of asymmetric effects.
We conceptualise social frontiers as the embodiment of contradictory geographies: where conflicting forces collide and yield asymmetric impacts. Forces that encourage some households to stay are counterbalanced by factors that motivate others to leave. We do not attempt to disentangle these causal processes. Rather, we present a detailed description of their net effect on the moving decisions of native-born households versus nonwestern migrants.
The remainder of this paper is structured as follows. First, we review the literature on geographical mobility and social frontiers. Having highlighted the relevant gaps, we set out our main hypotheses. These form the basis of our empirical model. We describe our methods, data and socio-geographic context. This is followed with a summary of our key results followed by a discussion of our findings. We conclude with a brief summary and suggestions for further research.
Literature
Social frontiers arise when there is a noticeable lack of residential mixing at the border between two adjacent but markedly different communities (Dean et al., 2019). The attribute of difference could be country of birth (as in the present study), or it could be ethnicity, religion or some other social, cultural or economic characteristic. Although social frontiers may sometimes form around pre-existing physical barriers such as roads and railway tracks (Noonan 2005), this is not an essential feature. The social frontiers between Catholics and Protestants in Belfast, for example, predated the erection of peace walls.
Early ‘border area’ theoretical literature focused on how social frontiers emerge as the product of individual preferences and the free movement of households (Yinger 1976). Recent theoretical work (Dean et al., 2019; Iyer and Pryce, 2023) has focused on potential impacts of frontiers on community cohesion and crime. Compared with more granular borders, frontiers reduce the potential for positive contact between groups, leading to worsening intergroup relations (Allport 1954). Social frontiers may also take on territorial meaning (Sack 1983), evoking defensive and hostile behaviour (Dean et al., 2019; Iyer and Pryce, 2023).
Work on the impact of social frontiers has explored the effect on mental health (MaGuire et al., 2016), anti-social behaviour (Legewie and Schaeffer 2016), and crime (Dean et al., 2019). MaGuire et al. (2016) found that proximity to peace walls in Belfast were associated with substantially higher rates of take-up of anti-anxiety and antidepressant drugs. Dean et al. (2019) found higher rates of crime near social frontiers in Sheffield. Legewie and Schaeffer (2016) reported higher rates of anti-social behaviour near social frontiers, though the effect was lower for the most pronounced frontiers.
As far as we are aware, however, there have been no empirical studies quantifying the relationship between social frontiers and geographical mobility. Iyer and Pryce, 2023 provide theoretical reasons for expecting lower rates of geographical mobility near the frontier but do not attempt empirical verification. There is, however, an established finding in the literature that rates of out-migration are often lower for households from a specific ethnic group if they are surrounded by other households of the same ethnicity. The higher the proportion of own-ethnicity, the lower the propensity to move (e.g. Clark, 1989: p. 171). This effect may arise from the various benefits to migrant households of living near those from a similar background; such as protection from racial harassment, preservation of cultural and religious identity, greater dependence on local social networks for employment opportunities, and the need for social support and advice, especially where there are language barriers. The fewer the number of alternative neighbourhoods offering such benefits, the less likely a resident will be tempted to move away once housed there. In the Netherlands, for example, the closer immigrant groups are to native Dutch culture, the more likely they are to move there in the first place, and the lower the probability that they will move away (Zorlu and Mulder, 2008: p. 248).
As noted in the Introduction, social frontiers may represent zones of contradictory geographies where potent pull-factors that persuade households to stay, operate alongside push-factors encouraging them to move. Residential mobility on frontiers is determined by the balance of these forces and how their strength changes over geographical distance (cf. the concept of ‘homophily horizons’ proposed by Bakens and Pryce, 2019) and group characteristics. Social frontiers may also introduce their own unique dynamics, created by the type of encounter they form between particular socio-ethnic groups. For example, social frontiers may evoke territorial behaviour, enhancing neighbourhood allegiance and a sense of obligation to ‘defend’ the frontier. This may reduce geographical mobility and restrict educational and labour market progression (Iyer and Pryce, 2023).
‘Cliff-edge’ social frontiers are, in one sense, the strongest separation of ethnic groups it is possible to create; two ethnicities divided as if by a wall, whether or not there actually is one. Relative to neighbourhoods where residential mix at the border creates a more gradual transition between communities, social frontiers offer far fewer opportunities for positive contact (Allport, 1954). On the other hand, compared to living at the core of mono-ethnic areas, social frontiers represent an interface zone with the potential to facilitate inter-ethnic contact, depending on the physical structure of the frontier itself and flows across it (for example, retail, commuting or school flows).
So when considering the ‘housing bundle’ – all the factors affecting the household’s decision to move – social frontiers may constitute an additional dimension that has the potential to transform existing elements of the bundle, especially for particular stages of the life-cycle (Dieleman, 2001 p. 250, 254). It is also important to note that migrant households, particularly younger ones, may have markedly different decision sets (Zorlu and Mulder, p. 250). As our contradictory geographies hypothesis suggests, we must consider how the social frontier-specific bundle could vary in polarity and intensity across the frontier. There are two key aspects to consider. First, preferences are heterogeneous across different ethnic groups and – perhaps more importantly – within them (Clark, 1991: p. 2). Second, when considering hypotheses of social frontier effects, it is vital to consider that ‘revealed preference’ of location choice may not capture actual preference (Ibraimovic and Hess, 2017).
Considering the first point, suppose all household ethnic neighbour preferences can be placed into three possible categories: homophily, indifference and heterophily (diversity-seeking). The first preference category, homophily, denotes a preference to locate near households of the same group. This is the assumed outlook of households in the celebrated Schelling (1978) model which shows how even relatively weak homophily tendencies can lead to extreme segregation. An often overlooked aspect of this model is how it leads not only to the separation of communities but also to abrupt rather than gradual residential transitions between them. Perhaps one of the most important yet unexplored questions raised by the Schelling model, therefore, is not why social frontiers sometimes arise, but why they are not ubiquitous (Piekut and Pryce, 2022).
One answer is that households may fall into the indifference category: they are ambivalent to the ethnic composition of neighbourhoods when making location choices. If all households were indifferent, social frontiers would not arise, but neither would segregation (other things being equal) because households would have no aversion to being in the minority. The same would be true for our third category of preference types: if households are heterophilous (i.e. have a preference for diversity), they will actively seek residential mix, ruling out both segregation and social frontiers.
So why, then, might we observe segregation without social frontiers – adjacent communities with blurred rather than abrupt borders? One answer is that other drivers of location choice (e.g. the desire to live close to employment and amenities such as schools, transport and leisure) mask ‘pure’ preferences with regard to social mix. Another explanation is that preferences are not uniform. If we relax the assumption of homogeneous preferences then we would expect those who prefer (or are indifferent to) diversity to be sorted by the market to live at the interface between the two communities, creating blurred boundaries. Thus, the degree to which we see residential mixing at the border as opposed to social frontiers may reflect the heterogeneity of preferences within each community (Piekut and Pryce, 2022). The prevalence of social frontiers, therefore, may indicate relatively homogenous preferences within each group; social frontiers are more likely to emerge when there is a shortage of residents who are ambivalent or heterophilous with respect to ingroup versus outgroup residential mix.
Constrained choice
Frontiers might also arise because unconstrained households, who do not wish to be there, decide to move away, leaving behind others with more constrained moving options (e.g. those reliant on social housing). Ibraimovic and Hess (2017), for example, using a ‘stated preference’ approach, found that preferences were not uniform. While we cannot access stated preference with our Dutch registry data, it is possible to use proxies to inform discussion on what role constraints could be playing – in particular, whether there are differences in household wealth and tenure on frontiers that, all other things equal, would indicate more constrained options. We do this in the discussion of the results.
White flight
Social frontiers may elicit responses from native incumbents similar to those described in the ‘white flight’ literature. Easton and Pryce (2019), for example, note that the motivation of the majority-group out-movers may not be homophily (the tendency to connect with those most like oneself) but heterophobia (the fear or dislike of people socially ‘other’ to oneself). Territorial attitudes may be heightened if social frontiers emerge as the majority group ‘retreat’ from areas they have long occupied. A common weakness of research on ‘white flight’ is the tendency to rely on aggregate data available at aerial unit levels that are unhelpfully large for studying this phenomenon. Aerial unit size is crucial because awareness of ethnic minority in-movers will likely decay rapidly with distance (Easton and Pryce 2019). Analysis at census tract level, for example, potentially misses important variation at smaller spatial scales and so more attention needs to be paid to moving behaviour at the micro-level, particularly the dynamics of micro-neighbourhoods surrounding social frontiers. To our knowledge, there has been no such study to date.
Hypotheses
Our review of the literature leads to three testable hypotheses:
Because social frontiers inevitably entail high proportions of a particular ethnic/social group either side of the frontier, there will always be the potential for an ethnic density effect near social frontiers. This is likely to be especially true of ethnic groups most dependent on local own-group social networks. Cultural and socio-economic vulnerability will likely heighten this effect.
This raises the possibility of asymmetric mobility effects if a community on one side of the frontier has less constrained choice sets. Whilst this may be less true in Rotterdam, where the native/non-native split is so close to 50 percent, limited financial resources among nonwestern migrants may nevertheless constrain their relocation options.
A social frontier may represent a zone of threatened identity where residents become preoccupied with countering the psychological threat. In this context, clearly demarcated boundaries can take on symbolic meaning (Piekut and Pryce 2022) and elicit territorial behaviour such as a stronger sense of allegiance to the neighbourhood. One way of viewing this hypothesis is in terms of it heightening the ethnic density effect. In other words, we would expect the impacts of ethnic density to be higher close to social frontiers.
These three hypotheses will likely have different impacts for different population groups depending on their life-stage, financial resources, overall numerical prevalence in the city/country and perceived sense of socio-economic and cultural vulnerability. The corollary is that when social frontiers divide groups with different combinations of these attributes, the frontier will generate asymmetrical impacts on household mobility.
Methods and data
Frontier detection and stable frontiers
We estimated frontiers between native Dutch households and nonwestern migrant households using a spatial Bayesian model which returns a probability distribution describing the likelihood that two geographical zones have a frontier between them (Dean et al., 2019). These probability values are then normalised (we label these Φ). The frontiers used in the mobility model are stable frontiers that meet the following double-hurdle criteria: (a) they are statistically significant in the Bayesian frontier detection algorithm for the 5-year period in which we measure mobility (2012–17); and they are also (b) substantively significant, defined as having a value of Φ above threshold of one standard deviation from the mean. Extensive sensitivity testing (see Supplementary Material) suggests that our results are generally robust to the Φ threshold chosen.
In this paper we focus on the relationship between mover dynamics and stable frontiers. We focus on stable frontiers because it makes it more likely that we are observing a genuine social frontier, rather than a temporary spatial discontinuity arising from random population churn, especially prevalent when using such fine-grained data (both spatially and temporally). We also think that the effects of a spatial discontinuity are likely to be more pronounced if the frontier is persistent rather than fleeting. For example, the territorial symbolism of frontiers is likely to be something that emerges as frontiers become embedded. Stable frontiers will also restrict opportunities for intergroup contact over a prolonged duration, increasing the likelihood of distrust and prejudice emerging between groups (cf Allport’s 1954 ‘contact hypothesis’).
Context, data and variables
Geographical context
The city of Rotterdam is the second largest city of the Netherlands with more than 600,000 inhabitants within the city boundaries. Due to the presence of the port – one of the largest in the world – and related (heavy) industry, the city has a reputation of being a working class city. However, in the recent decade, the service sector has become increasingly important (Binnenlands, 2020).
The Netherlands has a relatively recent history of large-scale migration compared to other European countries like the United Kingdom. Large-scale immigration started in the 1960s and 1970s when the Netherlands welcomed large groups of guest workers from mostly Morocco and Turkey. Many of these guest workers stayed in the country and through family reunification the immigrant groups grew rapidly. The city of Rotterdam now has the highest proportion of people with a migration background of any city in the Netherlands. In 2021 the proportion of people with a migration background exceeded that of the native Dutch population; 53% of the population now has an immigration background, against just over 24% for the country as a whole (Onderzoek 2022).
Geographically the city of Rotterdam is divided in two by the river, which also forms an important socio-economic and ethnic divide. The area north of the city is considerably wealthier than the area south of the river. And the poorer southern part of the city is also characterised by a stronger presence of people with a migration background. (See further background information in Supplementary Material).
Data
Our analysis employs Dutch registry data from Statistics Netherlands. This is a very rich dataset containing details of every Dutch person and every household for every year from 1999 onwards including a unique identification code for each household and person and a link giving the list of individuals that make up every household. The city is divided up into 100 × 100 m grid squares within which we can identify the location of each person and household tracked over time and space. The very large size of the dataset allows the model to be disaggregated into quite small subgroups while still producing statistically robust results.
The outcome variable is a binary flag marking whether each household moved or not between 2012 and 2017. Whether or not a household stays is deduced by tracing whether a household’s ID was in the same 100 m grid square in both of those years. Mixed-ethnicity households can have a large range of different origins and make-ups; using just single-ethnicity households allows for better clarity when interpreting the results. In total, these choices provide the model with over 178,000 households from the Rotterdam urban region (see Supplementary Material for descriptive statistics and further information on the sample).
Ethnicity in Dutch microdata is defined objectively by the country of birth of a person’s parents (in contrast to, for example, UK Census data that uses self-reported ethnicity). Any individual born outside the Netherlands, or any individual with either parent born outside of the Netherlands is labelled ‘non-native’ (either ‘Western non-native’ or ‘nonwestern non-native’); consequently, a ‘native’ is at least third generation Dutch. ‘Western non-native’ individuals and households (generally from Indonesia or Japan) have characteristics closer to Dutch natives; in order to maximise the difference across frontiers, we use only ‘native’ and ‘nonwestern non-native’ categories.
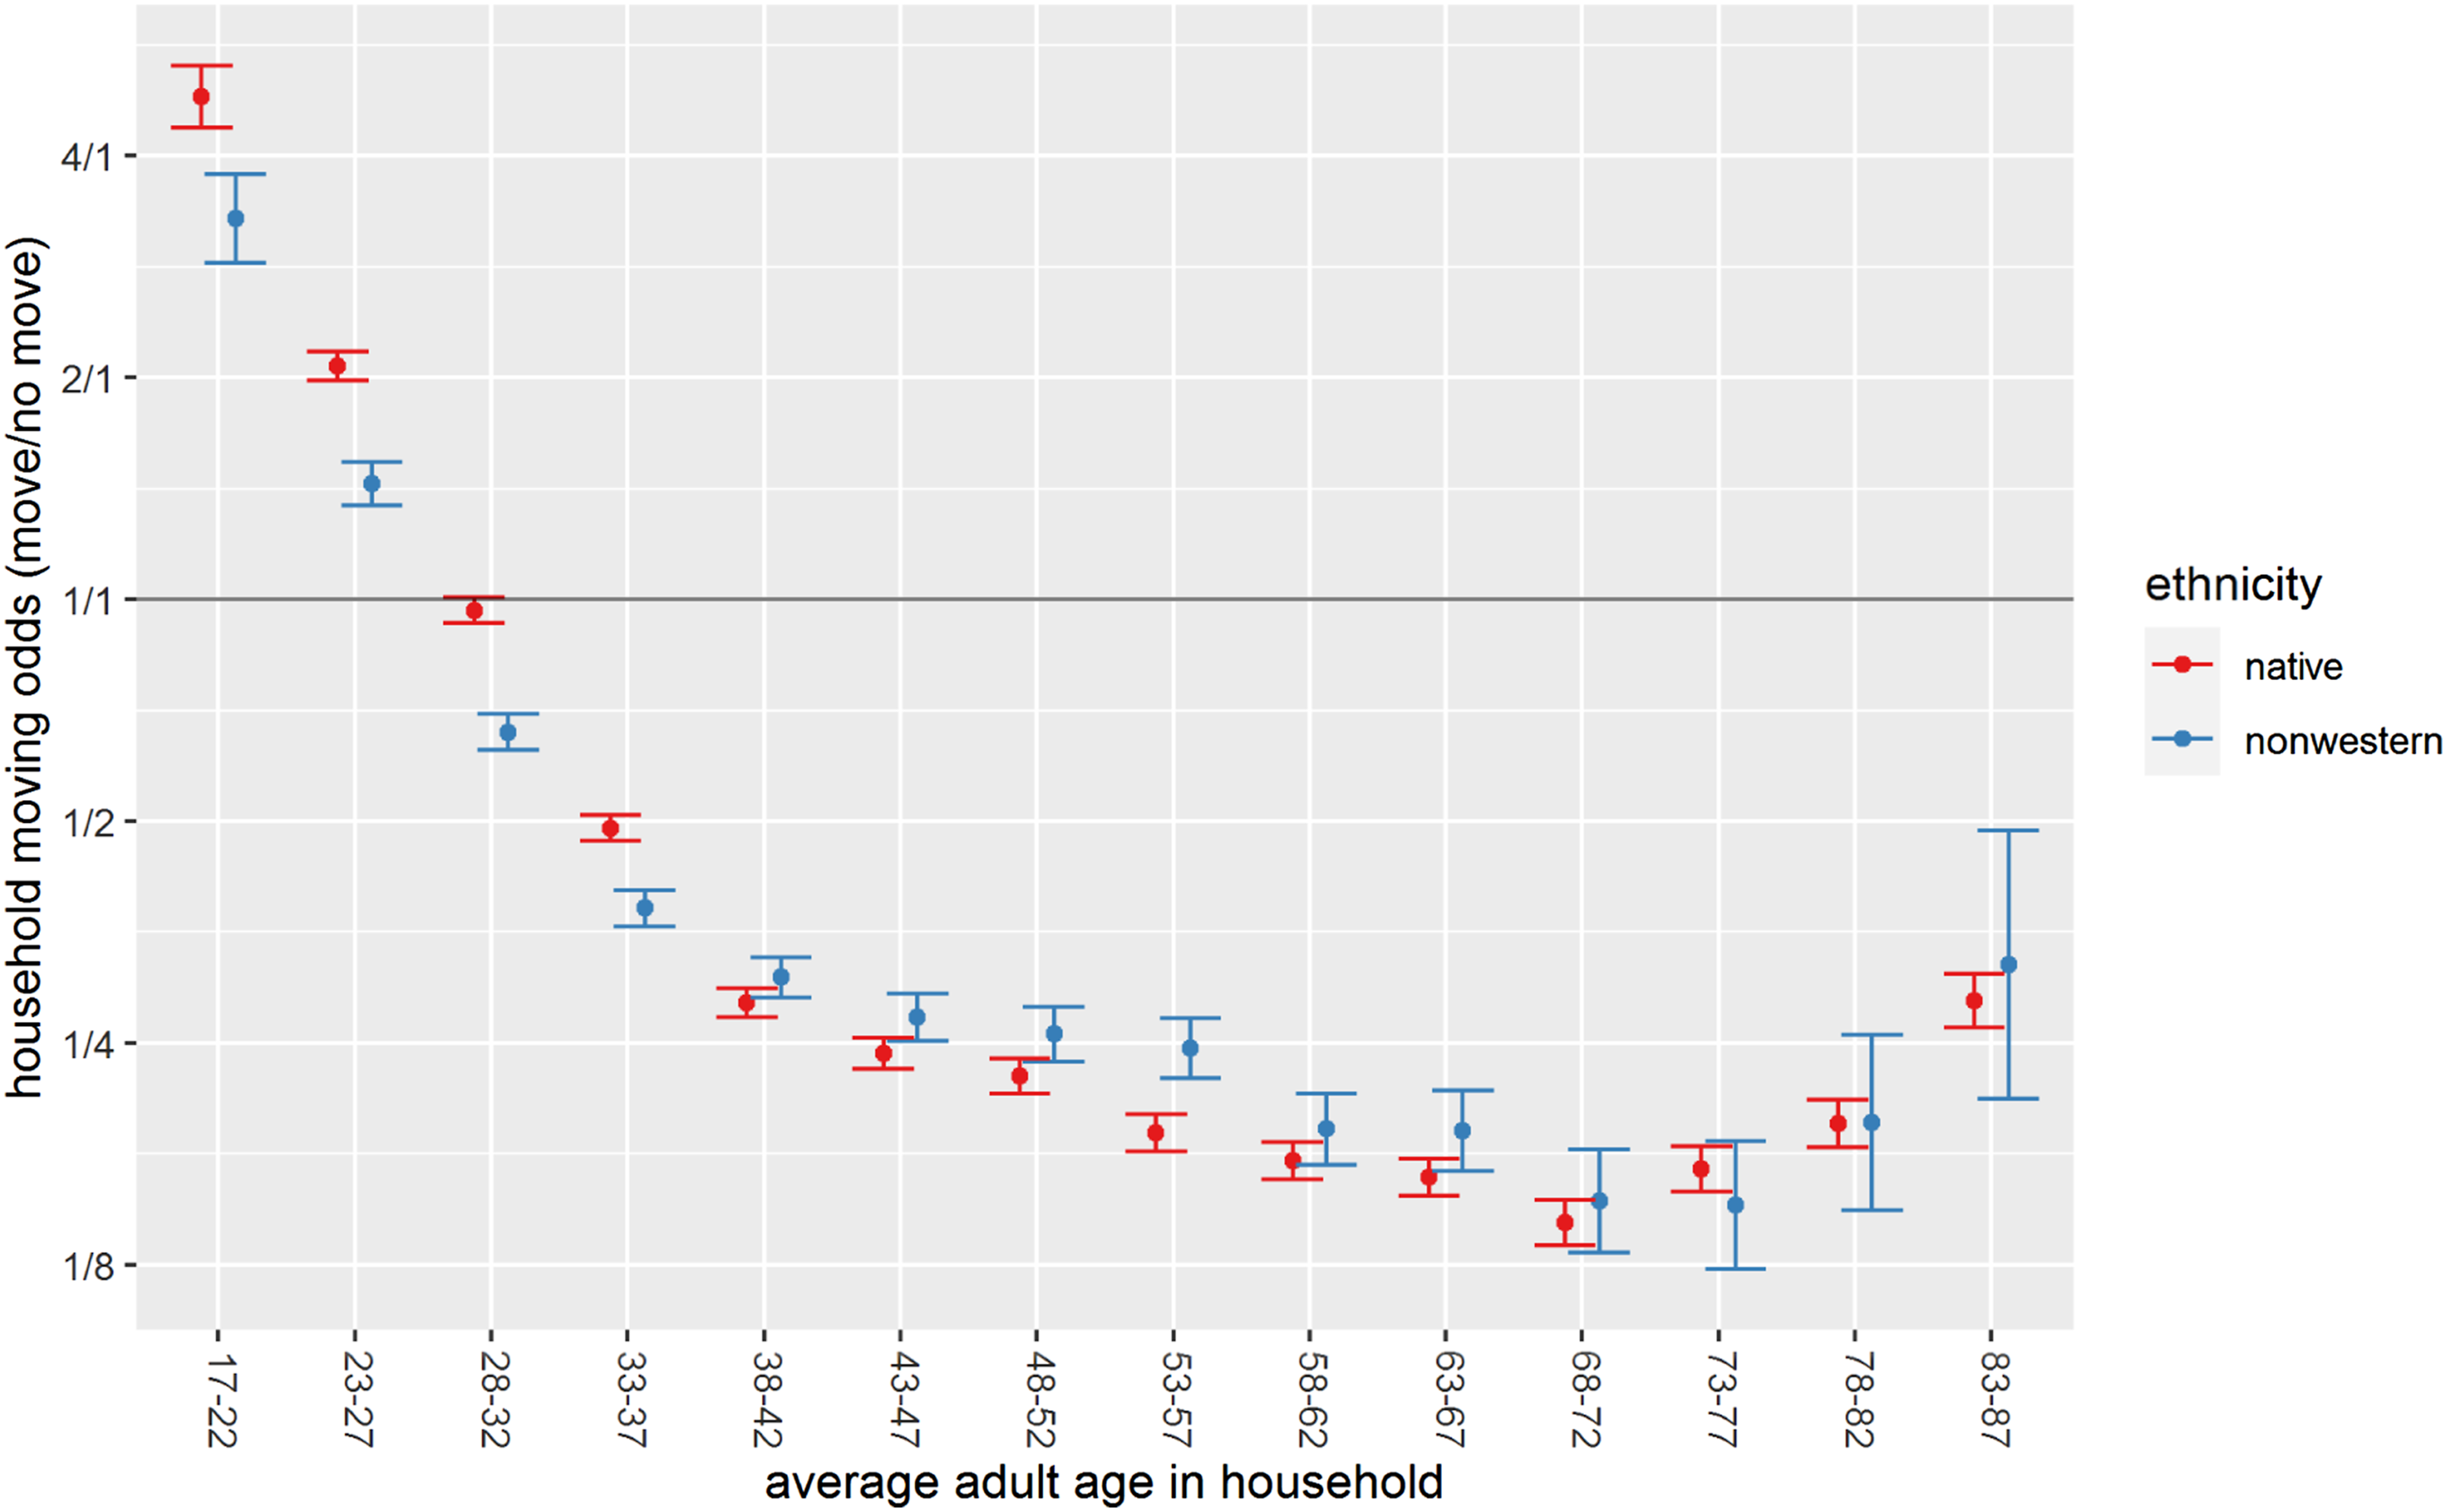
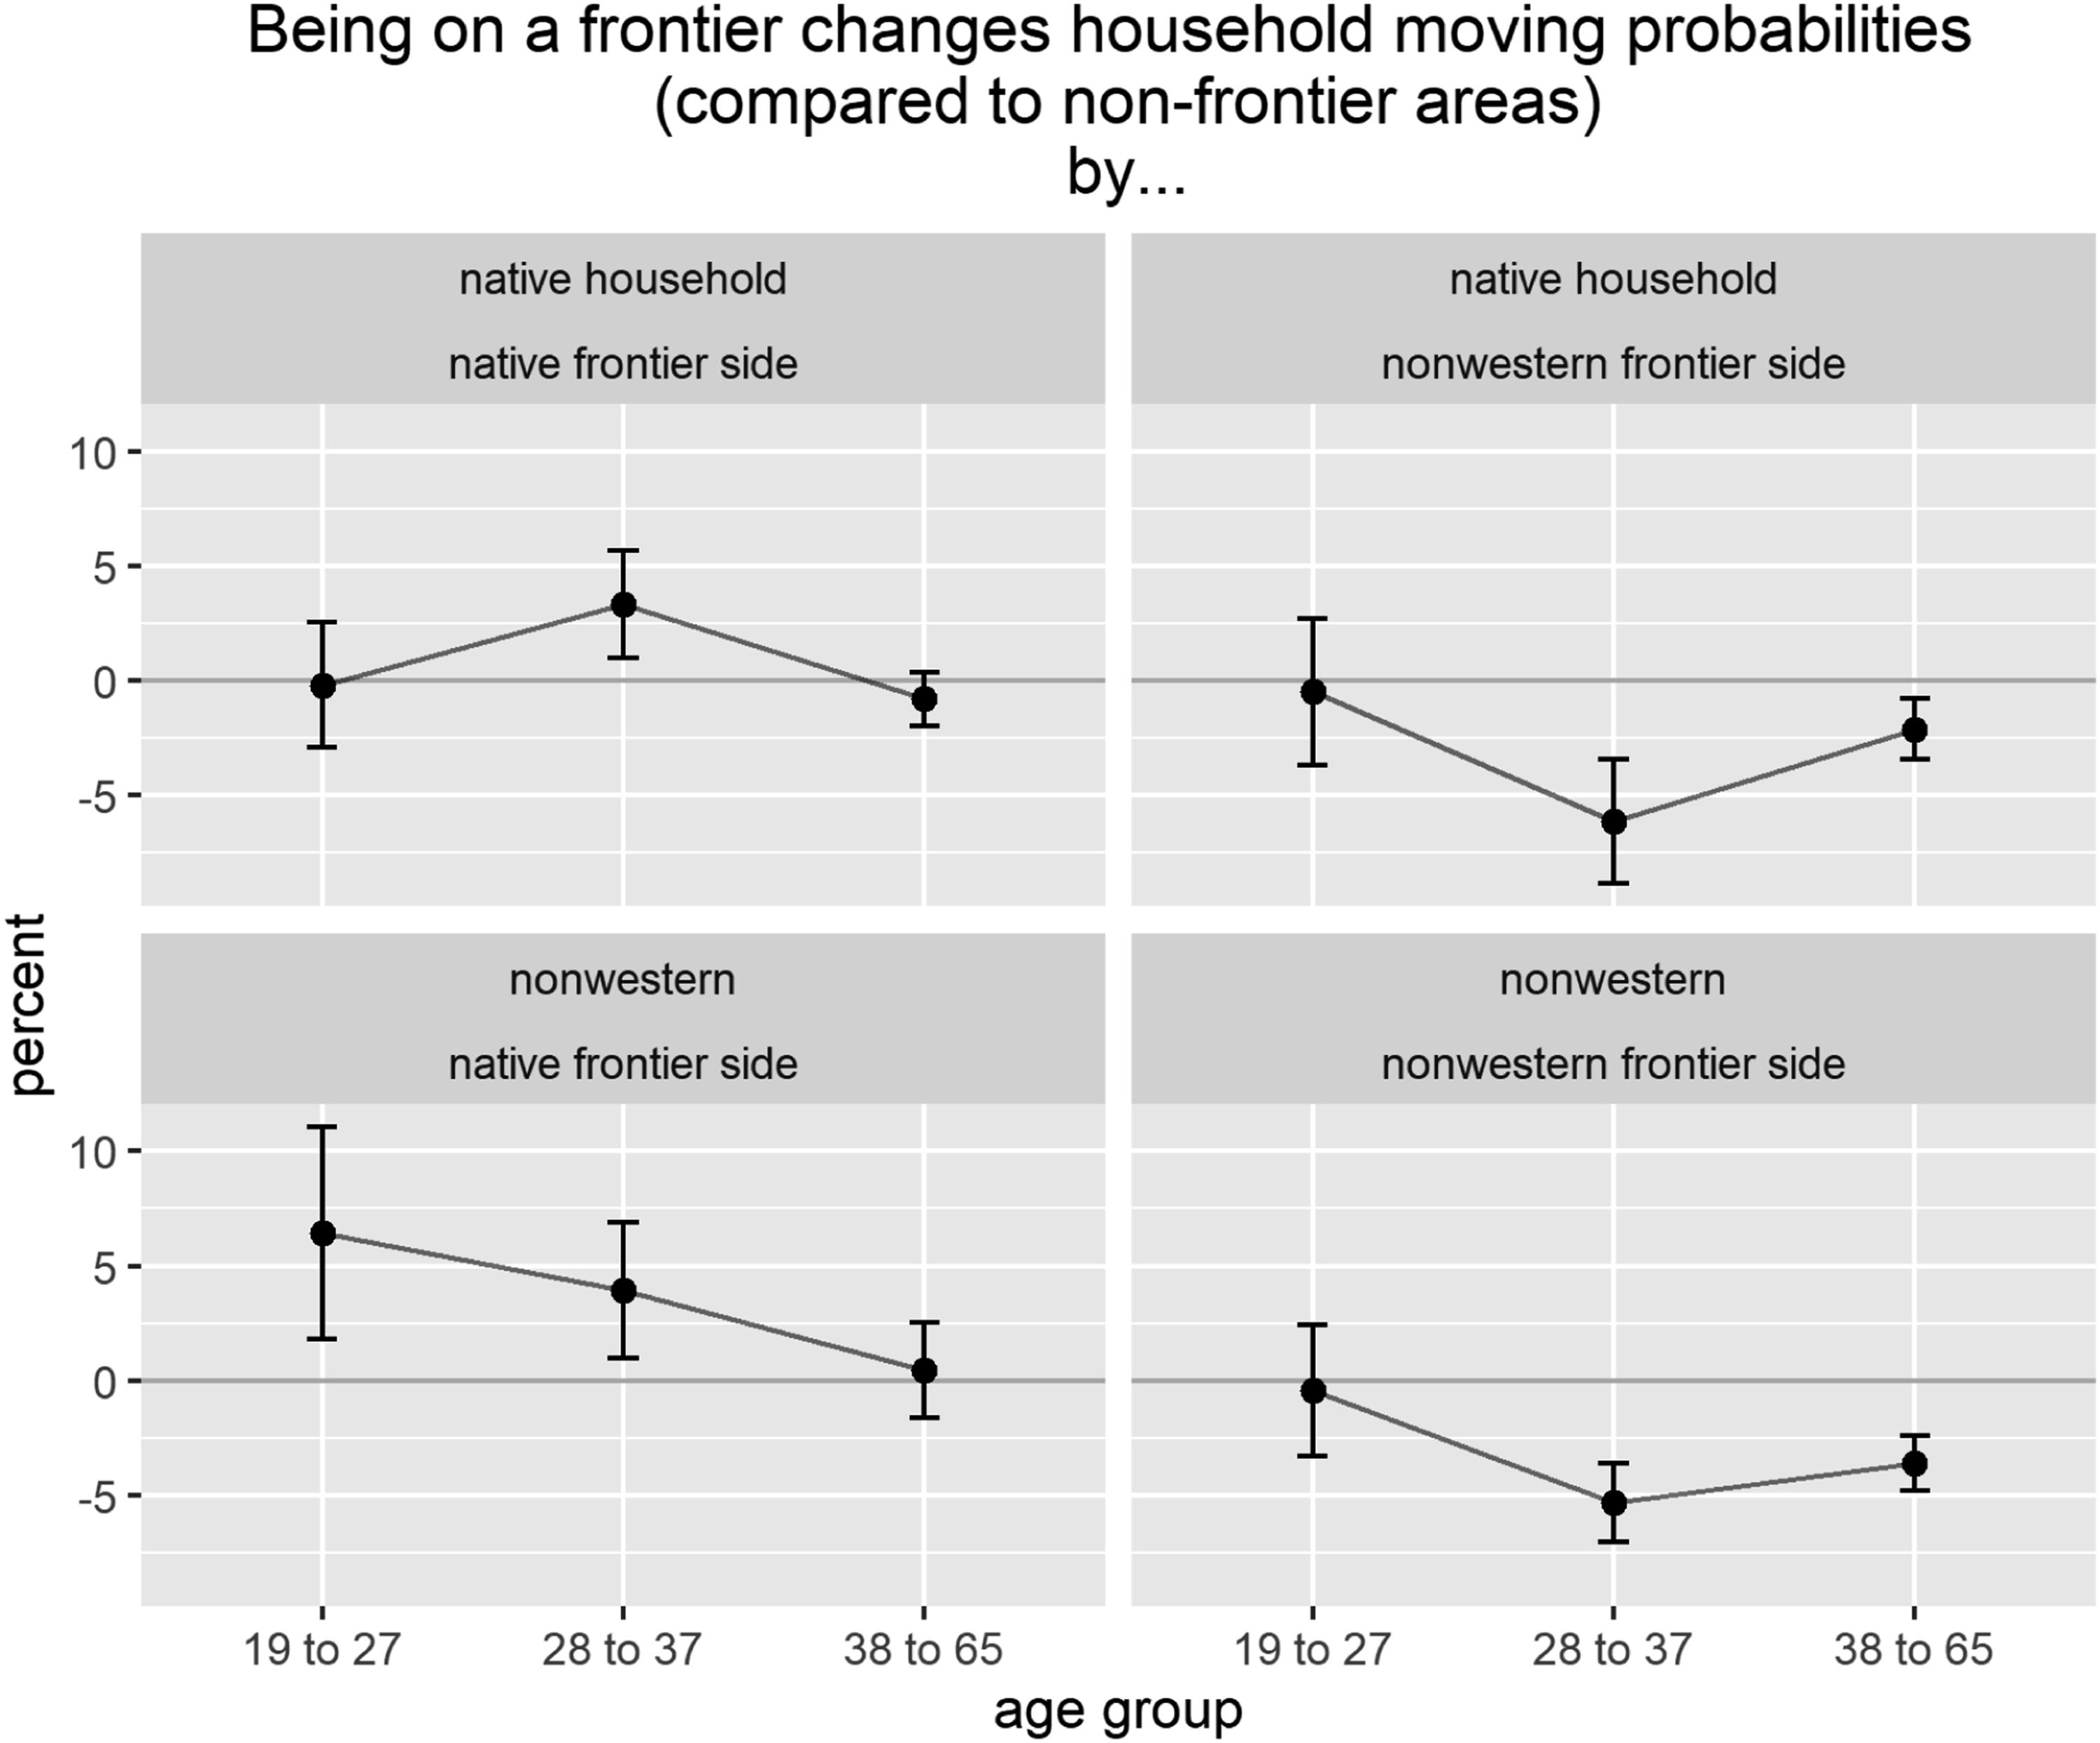
The age profile of households is a potentially important factor in moving decisions. Figure 1 shows the age profile specifically for Rotterdam broken down by ethnicity (using the average age of adults in each household). The age profile for nonwesterners skews earlier and has far fewer older and retired households. Movement behaviour varies greatly between age groups; Figure 2 shows this variation for a series of 5-year age bands for each ethnic group for the time period 2012–2017. For both ethnicities, the older the household, the more likely they are to have stayed in that 5-year period. But ethnic differences are striking. For households with an average adult age below the age of 37, native households are relatively less likely to have stayed. The opposite is true for households with an average adult age over 37. Because age effects interact with virtually all variables of interest in the model, we run separate models for three different age bands. Along with the ethnicity model breakdown, this gives six separate logit models (see Figure 3 for headline results and Supplementary Material for the regression tables). Counts of households in Rotterdam by average adult age (in 2-year bins) and ethnicity (native/nonwestern). Household moving odds by ethnicity and 5 years age band. Line is even odds (1–1) of staying. Above the line is higher odds of moving; below is lower. How do social frontiers affect household moving probabilities? Top row shows native households, bottom row nonwestern households. Left-hand column shows those households on the more-native frontier side, right-hand column the more-nonwestern frontier side. Three average adult-age groups are on the x axis. The y axis shows how much moving probabilities change on those frontier sides compared to non-frontier areas of the city.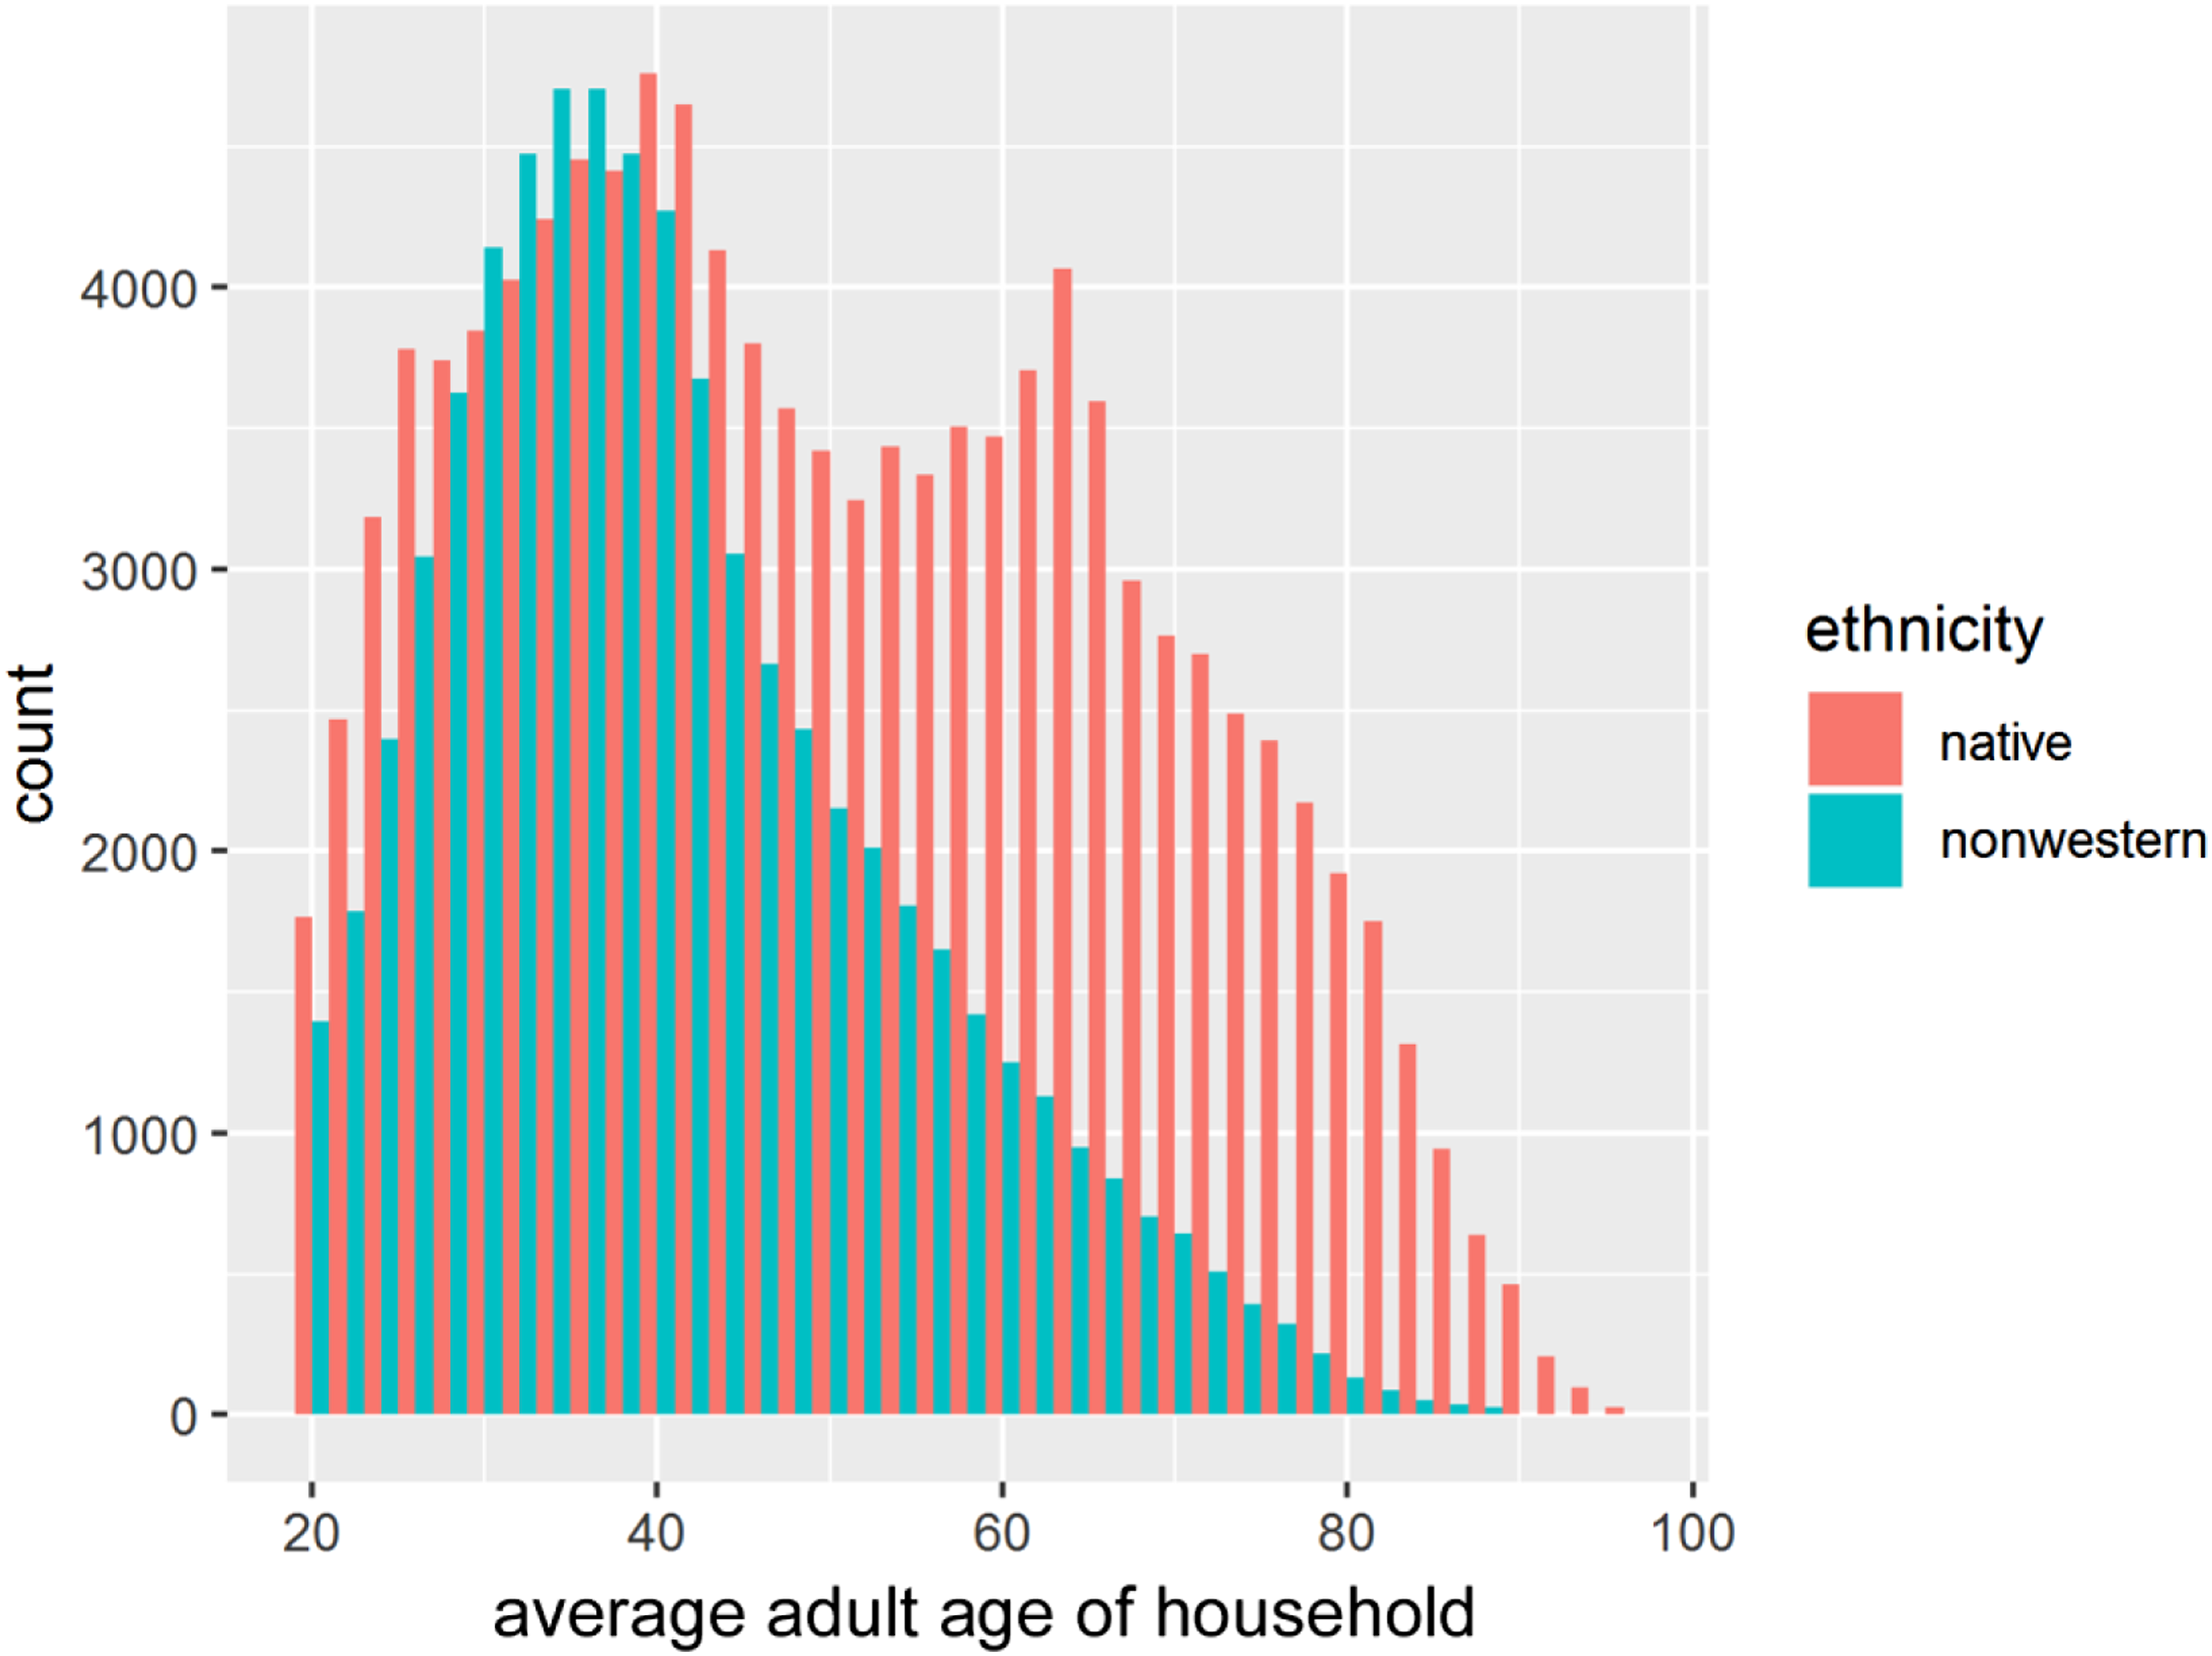
Model strategy
This section explains the two main model approaches used in the paper: first, a series of six regressions modelling the probability of households moving and how this differs on and off frontiers (logit versions of the models are presented in the Supplementary Material); and second, a pair of regressions examining person flow behaviour into and out of zones on the frontier. Both model types consider not just whether a household or person is on a frontier, but what side of the frontier they are on. For any given pair of zones on each frontier side, one will have a higher proportion of natives than the other. This side is labelled the ‘native side’ of the frontier; the other the ‘nonwestern side’.
Probability of households moving: frontier versus non-frontier areas
We estimate six linear probability ‘mover’ regressions where the dependent variable is coded one if the household moves, and 0 if it stays. We use these models to estimate the key determinants of households moving in the period 2012–2017. Using a dummy for whether a household resides on a frontier – that is, whether the 100 × 100 m grid square they reside in has a social frontier directly on one of its edges – and whether that frontier is native versus nonwestern, we ask: is the probability of households having moved significantly different in frontier locations compared to non-frontier parts of the city? And are there asymmetric effects – that is, do those moving probabilities differ depending on the side of the frontier the household is on?
We run six separate models, one for each of our three defined age groups per ethnicity where ethnicity of the household is defined as being of native or non-native nonwestern origin, and age bands are defined in terms of the average adult age in household (19–27; 28–37; 38–65). Other key explanatory variables include income, measured using a binary variable capturing whether or not a household is above median income in the city; and ethnic density, measured as the proportion of population in the household’s grid square that is of the same ethnic group.
Income is a central explanatory variable especially for capturing how constrained choice interacts with neighbourhood allegiance and any other social frontier effect. In the results discussion, we dig deeper into income on frontiers to help understand the dynamics taking place there. The own-group ethnic density variable helps us disentangle the well-known homophily effects from the impact of the frontier.
Control variables
In order to focus on the three hypotheses noted above, we include the following control variables: • Tenure: rented or owner-occupied; • Household structure: single person; couple without children; couple with children; other; • Number of children.
Flow models of individual movement behaviour: difference on frontiers compared to non-frontier areas of the city
The regression models only consider whether households moved away during the study period. But there is a marked difference in outcome if, for example, households of the same ethnicity are replacing those that move, or if households are moving in, but not out. To address this issue, we also model flow behaviour: the balance and scale of movement on frontiers. The unit of observation is grid squares within the city, for which we find a count of the flow of individuals into and out of those grid squares and two control variables: average standardised income and percent owner-occupied in each geographical zone.
We use two flow measures: migration efficiency and turnover (see e.g. Dennett and Stillwell, 2008). Migration efficiency measures the polarity of flows into and out of a zone. Minus 1 indicates all flows were out, none came in; +1 indicates all flows were in, none left. Zero indicates a balance of inward and outward flows. Migration efficiency provides a measure of polarity but not scale; so we use turnover for the latter: the sum of inward and outward flows divided by total zone population.
See Supplementary Material for further details on the method and results.
Results
Do social frontiers affect household moving propensities?
Figure 3 provides a summary of the separate model runs for each of the three average adult-age groups (x axis) and two ethnicities (separate graphs for each ethnicity, and whether that household is on the native or nonwestern frontier side). The estimates show how household moving probabilities differ on frontiers compared to non-frontier areas of the city (y axis).
There is a clear asymmetry: on the native frontier side (left-hand column of graphs), results are either non-significant (error bars cross zero) or moving probabilities are higher compared to similar non-frontier areas of the city. On the nonwestern frontier side (right-hand column), where results are significant, moving probabilities are lower compared to similar non-frontier city areas. The pattern is more consistent on this frontier side for both ethnicities, with both the older age groups showing significantly lower probabilities of moving.
It is worth focusing on how results for the 28–37-year-old age group on each side of frontiers differ, as these are all significant: for this age range, households of both ethnicities on the nonwestern side of the frontier have lower probabilities of moving – for both ethnicities, compared to non-frontier parts of the city. On the native side, the result is the opposite: households – again of both ethnicities – have higher chances of moving, relative to the rest of the city. This supports the idea that frontier side matters more than household ethnicity for moving behaviour.
The other age groups either confirm this pattern – lower moving probabilities on the nonwestern frontier side for both ethnicities, higher moving probabilities on the native side – or the results are not significant (confidence intervals cross zero).
Sensitivity analysis confirmed that our findings are robust to various changes in model specification (see Supplementary Material).
Impact of frontiers on population dynamics: flow model results
We find evidence for frontier effects on migration efficiency but they appear to depend more on age group than ethnicity. Nevertheless, we again find clear evidence of asymmetry. For 19–27-year-old nonwesterners on the nonwestern frontier side, more leave than come in, relative to the rest of the city (migration efficiency is lower on frontiers; difference of frontier versus non-frontier = −0.057 [95% CI −0.099, −0.014]). For 28–37 year olds, the opposite is true: natives on the nonwestern frontier side, more come in than leave, relatively (migration efficiency is higher on frontiers; difference of frontier versus non-frontier = 0.08 [95% CI 0.009, 0.15]).
Turnover models show similar outcomes: turnover on frontiers is lower than in other areas of the city; frontiers are more stable in terms of throughput of people. This is true for ethnicities aged 28–37 on the nonwestern frontier side (native turnover difference for frontiers vs non-frontiers = −0.085 [95% CI −0.144, −0.026]; nonwestern turnover difference = −0.105 [95% CI −0.145, −0.065]). It is also true for 38–65-year-old nonwesterners on the nonwestern frontier side (difference = −0.06 [95% CI −0.093, −0.028]). And when all ages are combined, the result is the same for nonwesterners on both sides of the frontier (difference on nonwesterners’ own side = −0.084 [95% CI −0.118, −0.05]; difference for nonwesterners on native side = −0.09 [95% CI −0.142, −0.036]).
Turnover is generally lower on the nonwestern frontier side, wherever there is a significant result. It is also lower for nonwesterners of all ages on the native side. But it is higher for the two younger native age groups, on the native frontier side. This highlights the turnover difference for native versus nonwestern people. More details of the flow model results are provided in Supplementary Material.
Discussion
We now interpret these results through the prism of our three hypotheses.
Ethnic density mobility effects
For household moving probabilities, the side of the social frontier has a stronger effect than the ethnicity match of the household and the grid square it resides in. Consider the nonwestern side of frontiers: both nonwestern and native households are less likely to move, compared to the rest of the city. If homophily forces brought about by the surrounding same-ethnicity density were paramount and people were able to exercise their preferences, native households would be more likely to move – including more likely, relative to nonwestern households on the same side.
Migration efficiency results suggest the difference between age groups is important: two of the significant results are on the nonwestern frontier side, but show opposite outcomes for 19–27-year-old nonwesterners (more leaving than coming in relative to the city) versus 28–37-year-old natives on that side (more coming in than leaving, relatively). This supports the idea that homophily forces are not the strongest factor affecting moving behaviour on frontiers.
Evidence in the opposite direction comes from the result for nonwesterners of all age groups on the native frontier side: more leave than come in, relatively. This goes with the grain of expectations – that the native frontier side would see nonwestern residents’ homophily preferences leading them to move away more.
But the overall picture for homophily seems to be one of variety across age groups – and especially across frontier sides. Each side has its own unique dynamic: not just opposite effects, but quite separate sets of effects. This reinforces the idea of frontiers as contradictory geographies: the array of homophily forces there are so varied, it is perhaps not surprising they balance in complex ways.
Some natives on the nonwestern side have lower turnover while some natives on the native frontier side have higher turnover. One possible explanation for this pattern is preference heterogeneity within ethnic groups leading to sorting – natives on the nonwestern side may be happy to be there, while natives on the native side may be less happy being right next to a nonwestern area.
In terms of homophily, then, this result again supports the idea of homophily heterogeneity and sorting taking place on frontiers. This leaves the question of whether frontiers are generally residentially non-desirable – the following two sections help shed some light on this aspect of homophily.
Constrained choice
Choice constraints and homophily are closely connected: the homophily preferences of less choice-constrained households can set the constraints for others less able to exercise their housing choices.
As mentioned, it is not possible to make firm conclusions about constrained choices on social frontiers just from movement data. What we can do is consider a range of possibilities and examine what the results tell us about them. Turnover is a particularly useful lens for thinking about this. Low turnover can mean two quite opposite things: relatively well-off, stable communities where sales do not happen often, or poorer communities facing tougher constraints, unable to move (Fotheringham et al., 2004: p. 1670). High turnover levels for 19–37-year-old native individuals on the native frontier side appears to suggest fewer constraints – they are able to move – but lack the desire to stay on that frontier. The different dynamic for older 38–65-year-old natives could either be due to higher constraints in that group, or because they are happier on the frontier.
An examination of differences in household wealth on frontiers could be informative here: analysis of Rotterdam data suggests that native households on frontiers with high-native proportions tend to be poorer than native households in similar native-mix zones not on frontiers (the same is not true for nonwestern households). This is suggestive of constrained options for households on more-native frontiers. Turnover numbers indicate younger native individuals may be leaving households – though perhaps the rest of the household remains behind. Note that the pattern is similar if broken down by ethnicity of household: native households on the frontier, if in higher-nonwestern-proportion zones, are not distinguishable in terms of wealth from others. This could suggest sorting behaviour: those households may have different preferences to those in more-native frontier areas. However, while this may suggest constrained choice – native households less able to move away from frontiers due to financial constraints – it is difficult to separate out wealth differences of the area frontiers are generally located. This suggests a fruitful area for further research, particularly if it was combined with a deeper look at choices on frontiers using survey data.
Neighbourhood allegiance
Turnover is, again, a good place to start for thinking about the neighbourhood allegiance hypothesis, or other ideas about the symbolic and cultural impact of frontiers on mobility. If people were staying on frontiers due to neighbourhood allegiance, turnover would be low – as indeed it is for the majority of results. But the different results for 19–37-year-old natives on the native frontier side (higher turnover relative to the non-frontier areas of the city) is instructive: if that result is correct, allegiance there would be weak for native households, suggesting – for those households staying – constraints are stronger than any symbolic pull to stay.
So, whilst it is difficult in this data to disentangle symbolic frontier effects from ethnic density homophily and constrained choice effects, it is clear that, if there are any symbolic effects, they are not symmetric, they vary by age group and are perhaps not as strong as the force of constrained choice. For the younger native age group where a symbolic effect might a priori be expected to be strong does not appear to be present.
Conclusion
Social frontiers clearly display unique mobility dynamics compared to non-frontier areas, with strong evidence of asymmetries. Our results are consistent with the idea of social frontiers generating ‘conflicting geographies’. More generally, our findings highlight social frontiers as an important area for future study and a potentially enlightening prism for thinking about mobility dynamics in the context of ethnicity and segregation more generally.
We might expect natives on the native side of the frontier – ‘own-side’ frontier dwellers – are likely to have both the motive and the opportunity to move away. They are likely to have larger choice sets than nonwesterners in terms of alternative locations to move to, and may be more likely to view frontiers as a threat (as per the ‘white flight’ narrative of segregation). We would therefore expect native own-side frontier dwellers to be more likely to move away, and this is what we find in our results.
For nonwestern own-side frontier dwellers, the opposite seems to be true. This may be because they view frontiers as an opportunity to live close to native households and yet remain within the safety of their own community. So for nonwesterners, own-side frontier zones may be viewed as desirable locations, making residents less likely to move, which again is what we find.
For natives who are ‘other side’ frontier dwellers, it is possible that they tend to be heterophilous (diversity loving) and this is why we find that they are less likely to move away. However, it is possible that nonwesterners on the native side may find it a hostile environment even if they are heterophilous. For example, they may be more likely to feel ostracised by their neighbours if they live on the native side of the frontier. If so, it would explain why we find they are more likely to relocate.
Clearly, this narrative interpretation of our findings is somewhat stylised and further research would be needed to verify these interpretations, perhaps drawing on qualitative and ethnographic methods. Developing causal inference strategies to disentangle the various factors that drive the net outcomes observed in our models would also be a valuable complement to our study. It would also be worth considering other types of social frontier, including ‘intersectional frontiers’ – frontiers that overlap in multiple dimensions such as ethnicity, income, housing tenure and wealth – and comparing how they affect a range of outcomes not just moving behaviour (e.g. wellbeing, educational achievement, household composition).
As yet, we do not know how context mediates the meaning that residents ascribe to frontiers, and so there is a wide field of inquiry to explore with respect to how contextual factors determine the variation of frontier impacts across cities, regions, countries and time periods. We have investigated the implications of social frontiers for a particular geography (100 m grid squares), but it’s possible that the impacts of social frontiers vary for different scales of areal units and for different areas. These variations could, for example, be explored using multilevel models and spatial varying regression models, respectively.
The effects of physical boundaries are also an interesting factor worthy of further exploration. Noonan (2005) suggests that natural and manmade barriers serve to reduce outgroup exposure and therefore mitigate the negative externalities associated with proximity to outgroups. This in turn might encourage frontiers to form and persist around such barriers. However, the reduced exposure offered by physical barriers may also mitigate frontier impacts (Iyer and Pryce, 2023). If so, then it is likely that our results provide a lower bound (i.e. an underestimate) of the impacts of social frontiers. Exploring how frontier impacts vary between stable and fleeting frontiers, and between frontiers with and without physical barriers, would be another useful avenue for future research.
Supplemental Material
Supplemental Material - The conflicting geographies of social frontiers: Exploring the asymmetric impacts of social frontiers on household mobility in Rotterdam
Supplemental Material for The conflicting geographies of social frontiers: Exploring the asymmetric impacts of social frontiers on household mobility in Rotterdam by Dan Olner, Gwilym Pryce, Maarten van Ham, Heleen Janssen in Environment and Planning B: Urban Analytics and City Science
Footnotes
Acknowledgements
We are very grateful to support and feedback from anonymous reviewers, and from the Economic and Social Research Council (ESRC) Understanding Inequalities and ESRC/Nordforsk Life at the Frontier research teams.
Declaration of conflicting interests
The author(s) declared no potential conflicts of interest with respect to the research, authorship, and/or publication of this article.
Funding
The author(s) disclosed receipt of the following financial support for the research, authorship, and/or publication of this article: This research was funded by the Economic and Social Research Council (ESRC) Understanding Inequalities project (Grant Reference: ES/P009301/1) and the ESRC/NordForsk Life at the Frontier (NordForsk Project Number: 95193) research projects.
Supplemental Material
Supplemental material for this article is available online.
References
Supplementary Material
Please find the following supplemental material available below.
For Open Access articles published under a Creative Commons License, all supplemental material carries the same license as the article it is associated with.
For non-Open Access articles published, all supplemental material carries a non-exclusive license, and permission requests for re-use of supplemental material or any part of supplemental material shall be sent directly to the copyright owner as specified in the copyright notice associated with the article.