
Abstract
The ability to proactively monitor the trajectory of post-disaster recovery is valuable for resource allocation prioritization. Existing knowledge, however, lacks models and insights for quantifying and proactively monitoring post-disaster community recovery. This study examines models that could predict population activity recovery at the scale of the census block group (CBG). Population activity recovery is measured by using location-based human mobility visitation patterns to essential points-of-interest (POIs) in the context of the 2017 Hurricane Harvey in Harris County, Texas. The study examined the association between the population activity recovery duration and 32 features split into four categories: (1) physical vulnerability and access, (2) hazard exposure and impact, (3) proactive actions and (4) population features. Several types of spatial regression models were evaluated to determine their ability to capture this relationship. The Spatial Durbin Model was identified as the best fit for assessing direct, spillover, and total effects of features on population activity recovery at the CBG level. The results show the extent of physical vulnerability, measured by road network density, prolongs the duration of population activity recovery by a combination of direct and spillover effects. Also, the extent of access to essential facilities, measured based on the number of POIs, shortens the duration of population activity recovery. Correspondingly, the extent of flooding is not a significant feature in explaining the population recovery duration in CBGs. The results show that better preparedness, measured by extent of POIs visitations prior to hurricane landing, is associated with faster population activity recovery. In terms of population attributes, the total number of people, the percentage of minorities, and the percentage of Black and Asian subpopulations are significant features in the model for predicting the duration of population activity recovery. The study outcome offers data-driven insights for understanding the determinants of population activity recovery and provides a new model tool for predictive recovery monitoring based on evaluating the direct, spillover, and total effects of features. These findings can identify areas with slower or more rapid recovery to inform emergency managers and public officials in ensuring equitable resource allocation prioritization.
Keywords
Introduction
The frequency of natural hazards in cities increased due to drivers such as climate change (Ruth and Coelho, 2007). In this context, timely population activity recovery is a key aspect of maintaining functionality of cities. Predictive recovery monitoring is an essential step to ensuring that the functioning of cities return to normal (Khatibi et al., 2022; Yuan et al., 2022a). The existing literature is missing data-driven models and insights to enable predictive urban recovery monitoring (Lee et al., 2022), as the current survey-based approaches are plagued with significant lags {Pinsonneault and Kraemer, 1993 #210}. In addition, spillover effects (effect of features over neighboring area’s recovery) in diffusion of recovery across neighborhoods and communities is another under-studied facet of community resilience. Our understanding of the extent to which physical vulnerability, hazard exposure, population protective actions, and population attributes affect the duration of population activity recovery at the neighborhood level is limited in the context of community recovery as a spatial process. In addition to enhancing the prioritization of resource allocation process, the data analytics findings of this study aim at supporting the urban planning process by identifying areas where population essential activity recovery is associated with scarcity in essential facilities and infrastructure.
Fluctuations in urban population activities capture the combined effect of disaster impacts on households, infrastructure (e.g., road inundations), and businesses (e.g., business closures) (Podesta et al., 2021). To effectively measure population activity recovery we can examine the fluctuations in time needed for population activities to return to steady state by utilizing location-intelligent data (Jiang et al., 2022). For this study, we focused on patterns of visitations to essential facilities to measure activity recovery durations at the census block group (CBG) level. Using the essential activity recovery as the dependent variable, we created and evaluated a spatial model to predict the effect various features, see Figure 1, related to population protective actions (i.e., preparedness and evacuation), hazard exposure (e.g., inundation extent), physical vulnerability and access (e.g., number of critical facilities and road network density), and population features (e.g., sociodemographic characteristics and social connectedness) have on it. The selection of these features was informed by the existing literature. Illustration of the variables and datasources together with the analytical framework.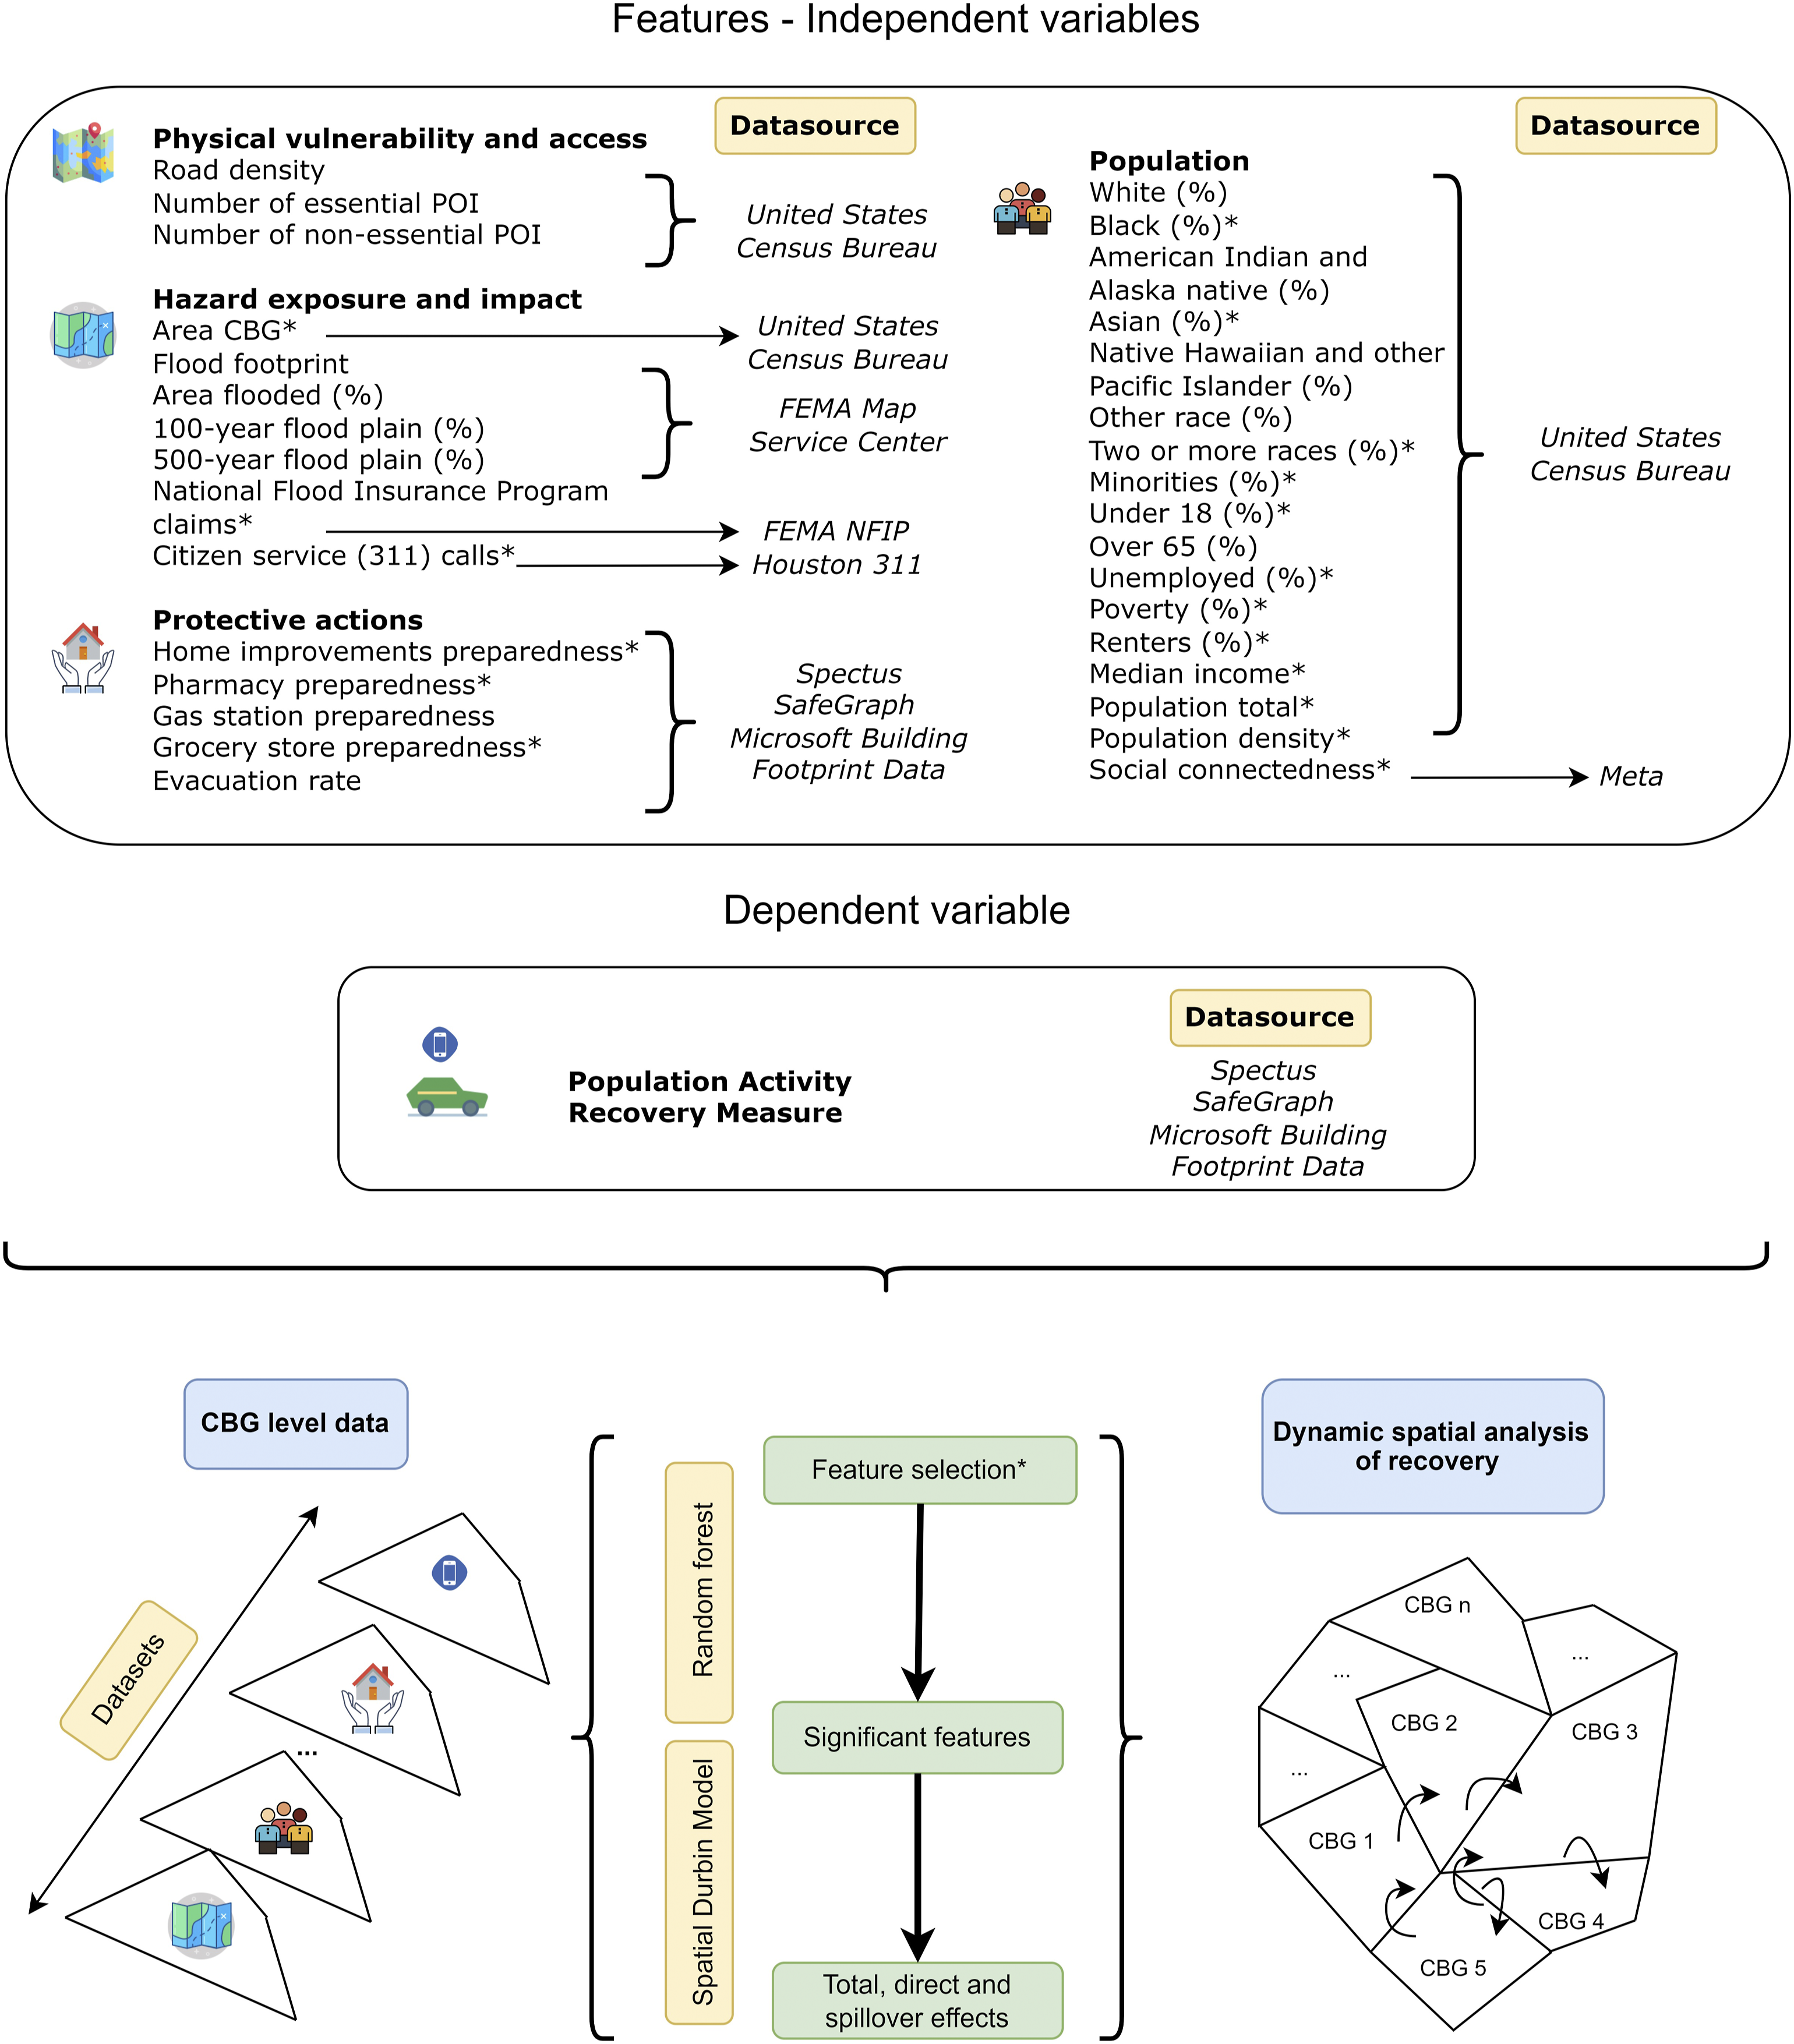
In the context of the 2017 Hurricane Harvey in Harris County, we sought to answer the following research questions: (1) What features of the spatial areas are associated with the duration of the population essential activity recovery?; (2) To what extent do the features of the neighboring spatial area influence the population essential activity recovery?; and (3) What is the extent of spatial effects in the population activity recovery in impacted regions? To answer these questions, first, we computed the population essential activity recovery. Second, we identified categories and factors which could be significant in short-term community activity recovery. Third, we selected features based on a randomization process. We tested several models to better represent the spatial autocorrelation by applying both forward and backward step-wise strategies. Finally, we analyzed the direct, spillover, and total effects of the features on the population essential activity.
The paper unfolds as follows: first, we present a background summary of the literature related to community recovery and human mobility data for disaster recovery assessment. Second, we introduce data and methods for calculating features. Third, we evaluate different spatial models in selecting the best fitted model. Finally, we describe the results and interpretation of features’ significance to uncover the determinant of population activity recovery.
Background
In this section, we summarize the literature related to community recovery, use of mobility data in disaster situational awareness, and spatial analysis methods to establish the point of departure for this study.
Data and features
This section looks at the features and the corresponding datasets. Figure 1 depicts an overview of the datasets and research steps taken in to answer to the research questions.
Study context
The study context is Harris County during the 2017 Hurricane Harvey, which caused catastrophic flooding in the area (Lindner and Fitzgerald, 2018). Harris County (see Figure 2), Texas, is the third largest county by population in the United States. The county includes Houston, the fourth largest city in the United States. Due to its location, increasing population, and flourishing urban development, Harris County is among the most flood-prone counties in the United States. Given the extent of Hurricane Harvey’s impacts in Houston and the diverse spatial characteristics of the area, it provides a suitable testbed for answering the research questions in this study. Harris County, Texas, United States of America.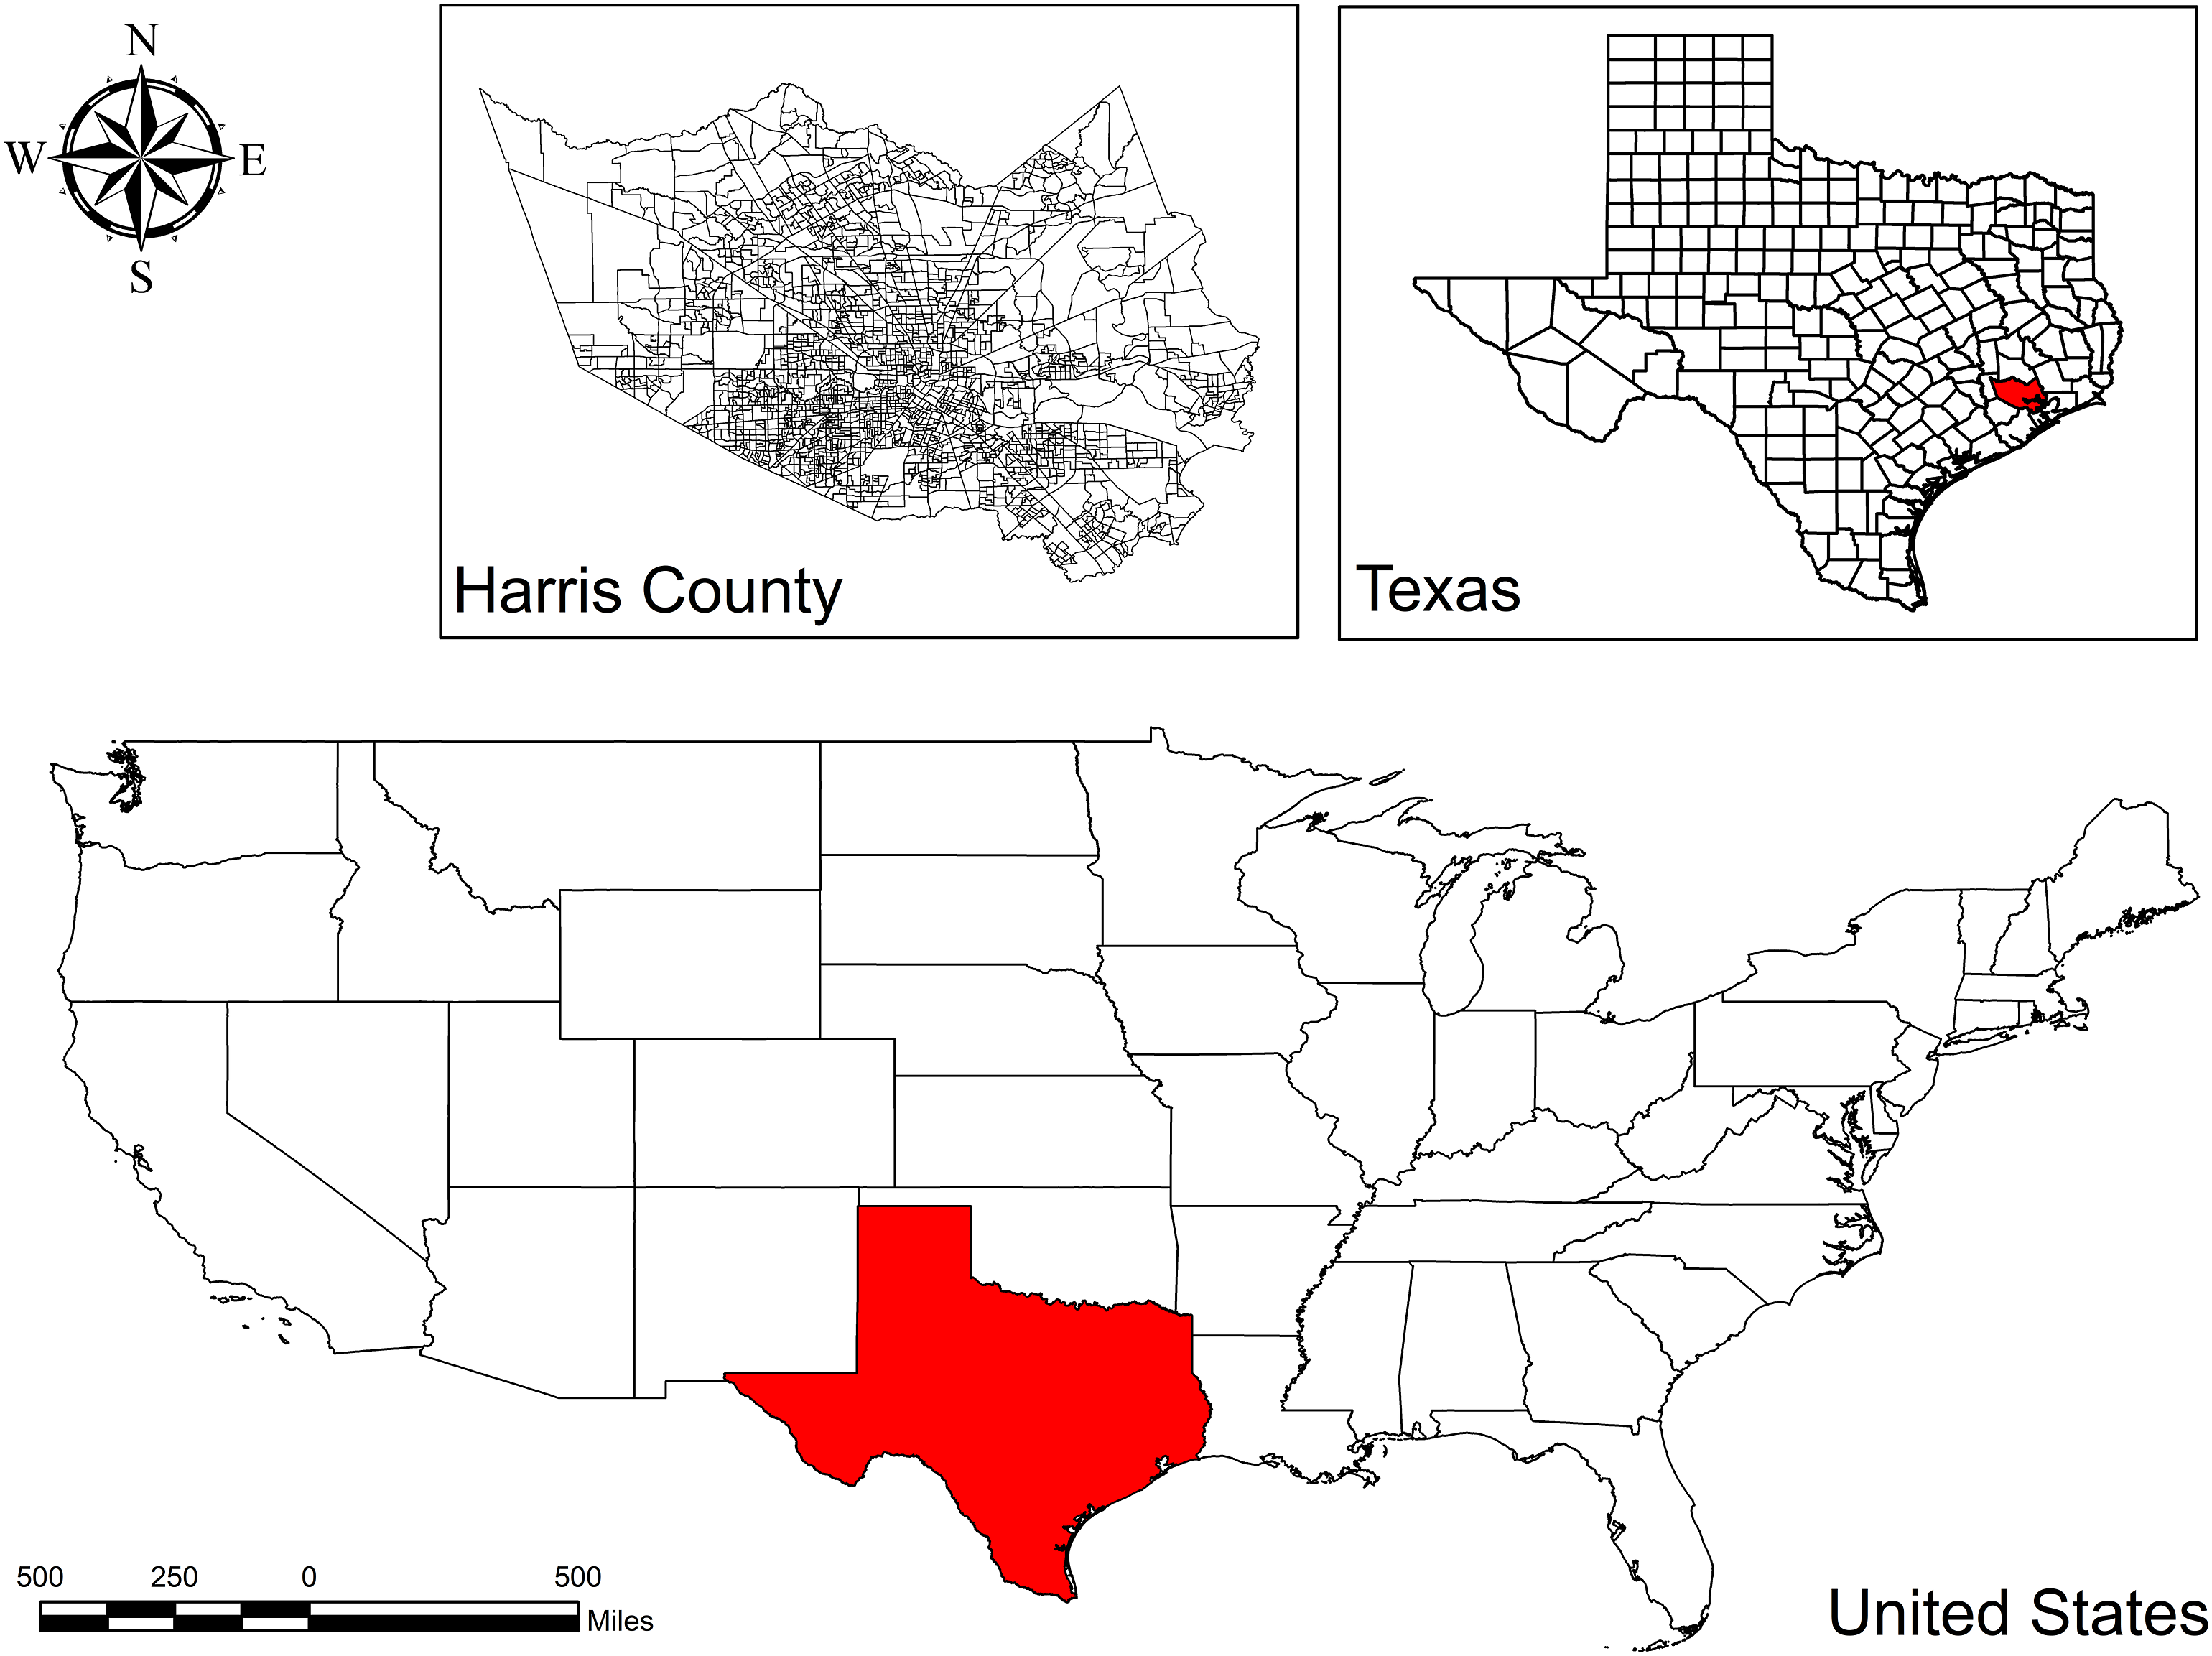
Data and measures
We extracted features of spatial areas from anonymized smartphone location intelligence data, points-of-interest information, road network topology, flood exposure, census demographics attributes, and social connectedness. Each feature and the process used are explained in the rest of this section.
Population activity recovery measure
The essential activity recovery measure of the population was computed based on a three-step approach as proposed by Jiang et al. (2022), study results represented in SM Figure S1. A number of recent studies have used a similar methodology to assess either visitations to POIs (Yuan et al., 2022a; Li et al., 2021) or CBG-to-POI (Li and Mostafavi, 2022; Coleman et al., 2022a) in a disaster setting.
First, we analyzed the daily visits from each CBG-to-POI based on privacy-enhanced anonymous mobility data provided by Spectus. By doing so, this measure captures the user/household perspective of population activity recovery. Using similar approach and by focusing on POI visit changes, the recovery of businesses can be examined as well.
Currently, in the United States, Spectus collects data from about 15 million users, ensuring that datasets are representative of population activities. From each user, Spectus gathers an average of around 100 data points daily, from third-party collaborator apps whose users agree to share their location information. Location intelligence data have precise GPS coordinates of trip destinations and is compliant with the General Data Protection Regulation and the California Consumer Privacy Act frameworks. To ensure the privacy and confidentiality of the third-party users, Spectus de-identifies and aggregates the home location of users at the CBG level.
Further, we used the North American Industry Classification System (NAICS) codes to specify essential POIs based on the SafeGraph dataset. SafeGraph’s database contains the spatial coordinates and identifying information, such as type of business, operating hours, and NAICS identifying code, for more than 30 million POIs. For this study, we considered essential POIs places to be drug stores, healthcare facilities, grocery stores, and utilities: electric, gas, water, and sanitation facilities. Essential services are POIs that, if access is disrupted, would cause hardship for the population. For instance, during extreme weather events, individuals should still have access to food, hospitals, and medicine. Additionally, during service disruptions such as electricity or water supply outages, people may need or prefer to speak with a customer service representative in person. We further used the Microsoft Building Footprint Data to determine the location of POIs to process the location data and specify CBG-to-POI visitation network.
Finally, the baseline population activity was computed based on the average trips from each CBG to essential POIs for the 3 weeks prior to Hurricane Harvey’s landfall. Population essential activity was considered recovered when the level of CBG-to-POI visits reached 90% of the baseline values for at least three consecutive days after the landfall. The most rapidly recovering CBGs were recorded after 1 week, while the most slowly recovering CBGs took more than 13 weeks to reach a level of movement to essential POIs similar to pre-disaster levels.
Physical vulnerability and access features
The next set of features capture physical vulnerability and access to facilities for each CBG, as these features could affect the trajectory of community recovery (Peacock et al., 2014).
Road density
Road density was computed as the length of the roads in a CBG dividend by the CBG’s total area. The source of the dataset was the TIGER/Line Shapefile of the US Census Bureau. A greater road density is an indicator of a greater physical vulnerability since more development is shown to be associated with more vulnerability (Ha et al., 2022).
Number of POIs
The number of POIs captures access to facilities. By applying NAICS codes within SafeGraph and the Microsoft footprint datasets, we determined essential and non-essential POIs in a CBG. Essential POIs were accounted based on assumptions applied to the population essential activity recovery. While POIs related to activities such as self-care facilities, retail, recreation, or restaurants were accounted as non-essential POIs in a CBG.
Hazard exposure and impact features
The extent of flood exposure and impact during Hurricane Harvey, which could have a relationship with the trajectory of community recovery, was captured using the following features.
Flood footprint and area flooded
The footprint of the area flooded after Hurricane Harvey was captured by the Federal Emergency Management Agency (FEMA, 2018). Using the flood footprint, we computed area flooded for each CBG. We also computed the percentage of area flooded by dividing the area flooded to area of the CBG. The CBG data comes from Census (U.S._Census_Bureau, 2020) data geometry.
100- and 500-year flood plain
The 100- and 500-year return period hazard maps originate from the Flood Map Service of FEMA (FEMA, 2017). To compute the percentage of 100- and 500-year floods, we divided the area of the hazard return period map by the total CBG area.
National flood insurance program claims
The number of National Flood Insurance Program claims was collected from the FEMA National Flood Insurance Program (NFIP) (FEMA, 2020) claims data set, for the time period starting with 25 August 2017, and lasting for 3 months for all the claims paid for building or/and contents. The number of such claims was counted for each census tract (CT) by overlapping the latitude-longitude with the CT location, as data were not available at the CBG level. To obtain the data at the CBG level, FEMA claims counts were distributed using equation (1) proportional to the population number of CBG

Citizen service (311) calls
Citizen service calls report incidents such as flooded streets. This data can complement other features related to the extent of flooding impacts (Esparza et al., 2022). The 311 calls were queried from the Houston 311 Help and Info webpage (Houston, 2022) between August 25 and 29 August 2017. The calls were selected according to the division which would handle response to flood-related disruptions: Evacuation, Disaster Recovery, Forestry, Preparedness, Public Utilities, Street and Drainage, and Collections with the subtype Storm Debris Collection. The calls were mapped latitude-longitude to the CBG location, and we further counted the total calls number.
Protective action features
Two features related to protective actions were examined: hurricane preparedness extent and evacuation rate, as literature points at the importance of protective actions in reducing disaster impacts and improving post-disaster recovery (Liddell et al., 2020; Terpstra and Lindell, 2013).
Preparedness extent
The preparedness features were computed by using a similar methodology proposed by Li and Mostafavi (2022). The extent and proactiveness was based on visits to home improvement stores, pharmacy, gas stations, and grocery stores. The population protective action baseline was computed for each of the four POIs categories individually by using CBG-to-POI mobility data. We used the average movements of each weekday for the first 2 weeks of August 2017 as the baseline. Further, we computed the percentage change to the four types of POIs for the period August 20 through 25 August 2017. The maximum value of the percentage change was used to account for the preparedness extent measure for each POI type. Equation (2) was used to compute the percentage change of preparedness extent

Evacuation rate
Using Spectus data, we calculated the evacuation rate from each CBG based upon the approach proposed by Lee et al. (2022). We considered evacuated those who left their home CBG to travel to another CBG for at least 24 h prior to landfall. We selected only users who had a record of at least 240 min of location information per day. We considered the baseline the average of each weekday of the evacuation rate between July 9 and 5 August 2017. Using the formula shown in equation (3), we computed the percentage change of evacuation rate as the number of evacuated users divided by the total number of users in a CBG. We recorded the fluctuations through the percentage change from the baseline

Population features
Features associated with social vulnerability and social capital could have a relationship with trajectory of community recovery. The sociodemographic features collected from the US Census Bureau (U.S._Census_Bureau, 2020), while the Social Connectedness Index features from Meta (Bailey et al., 2018).
Sociodemographic characteristics
For the sociodemographic features, we focused on population attributes such as income, race, age, and home ownership. The percentage of population under 18 years of age was computed by using the total number of households with members under age 18 divided by the total number of households. The percentage of population over 65 years old was computed similarly. The percentage of unemployed population represents the total number of unemployed persons divided to the total number of labor force. Poverty status signifies the family household income under the poverty level in the past 12 months divided by the total number of households. The percentage of the renters is the number of people renting divided by the total population. The population density represents the total population of the CBG divided to the total area of the CBG.
Social connectedness
The social connectedness measures the intensity of connectedness between locations. The index is computed between two locations, i and j, as for equation (4)

Using the dataset proposed by Bailey et al. (2018), we further queried it to show the connections among Harris County Zip codes only.
Analysis method
Feature selection
We first focused on identifying features that could explain variation in the population essential activity recovery. We used a classification method which outputs variable importance measure through a random forest algorithm whose results are available in SM Table S2.
Further, we performed a reliability analysis to check the correlation between the features, results presented in SM Figure S2 and Table S3. Removing features with high correlation avoids multicollinearity. Some sociodemographic features were removed to avoid such situation.
Model selection
For choosing the best model to fit the data, we first identified two strategies, going from non-spatial models to local spatial and global spatial models, and then inverse-wise. The difference between local and global spatial models is primarily due to the neighbor interactions. Non-spatial models disregard spatial effects; local spatial models assume direct neighbor spatial influence only, while global spatial models account for neighbor-to-neighbor interactions. The forward step-wise strategy starts with ordinary least square (OLS) regression and applies step-wise test to spatial models and spatial error models; while the backward step-wise strategy considers and compares all types of models to choose the most appropriate one (Figure 3). Approaches to choosing the best-fitting model.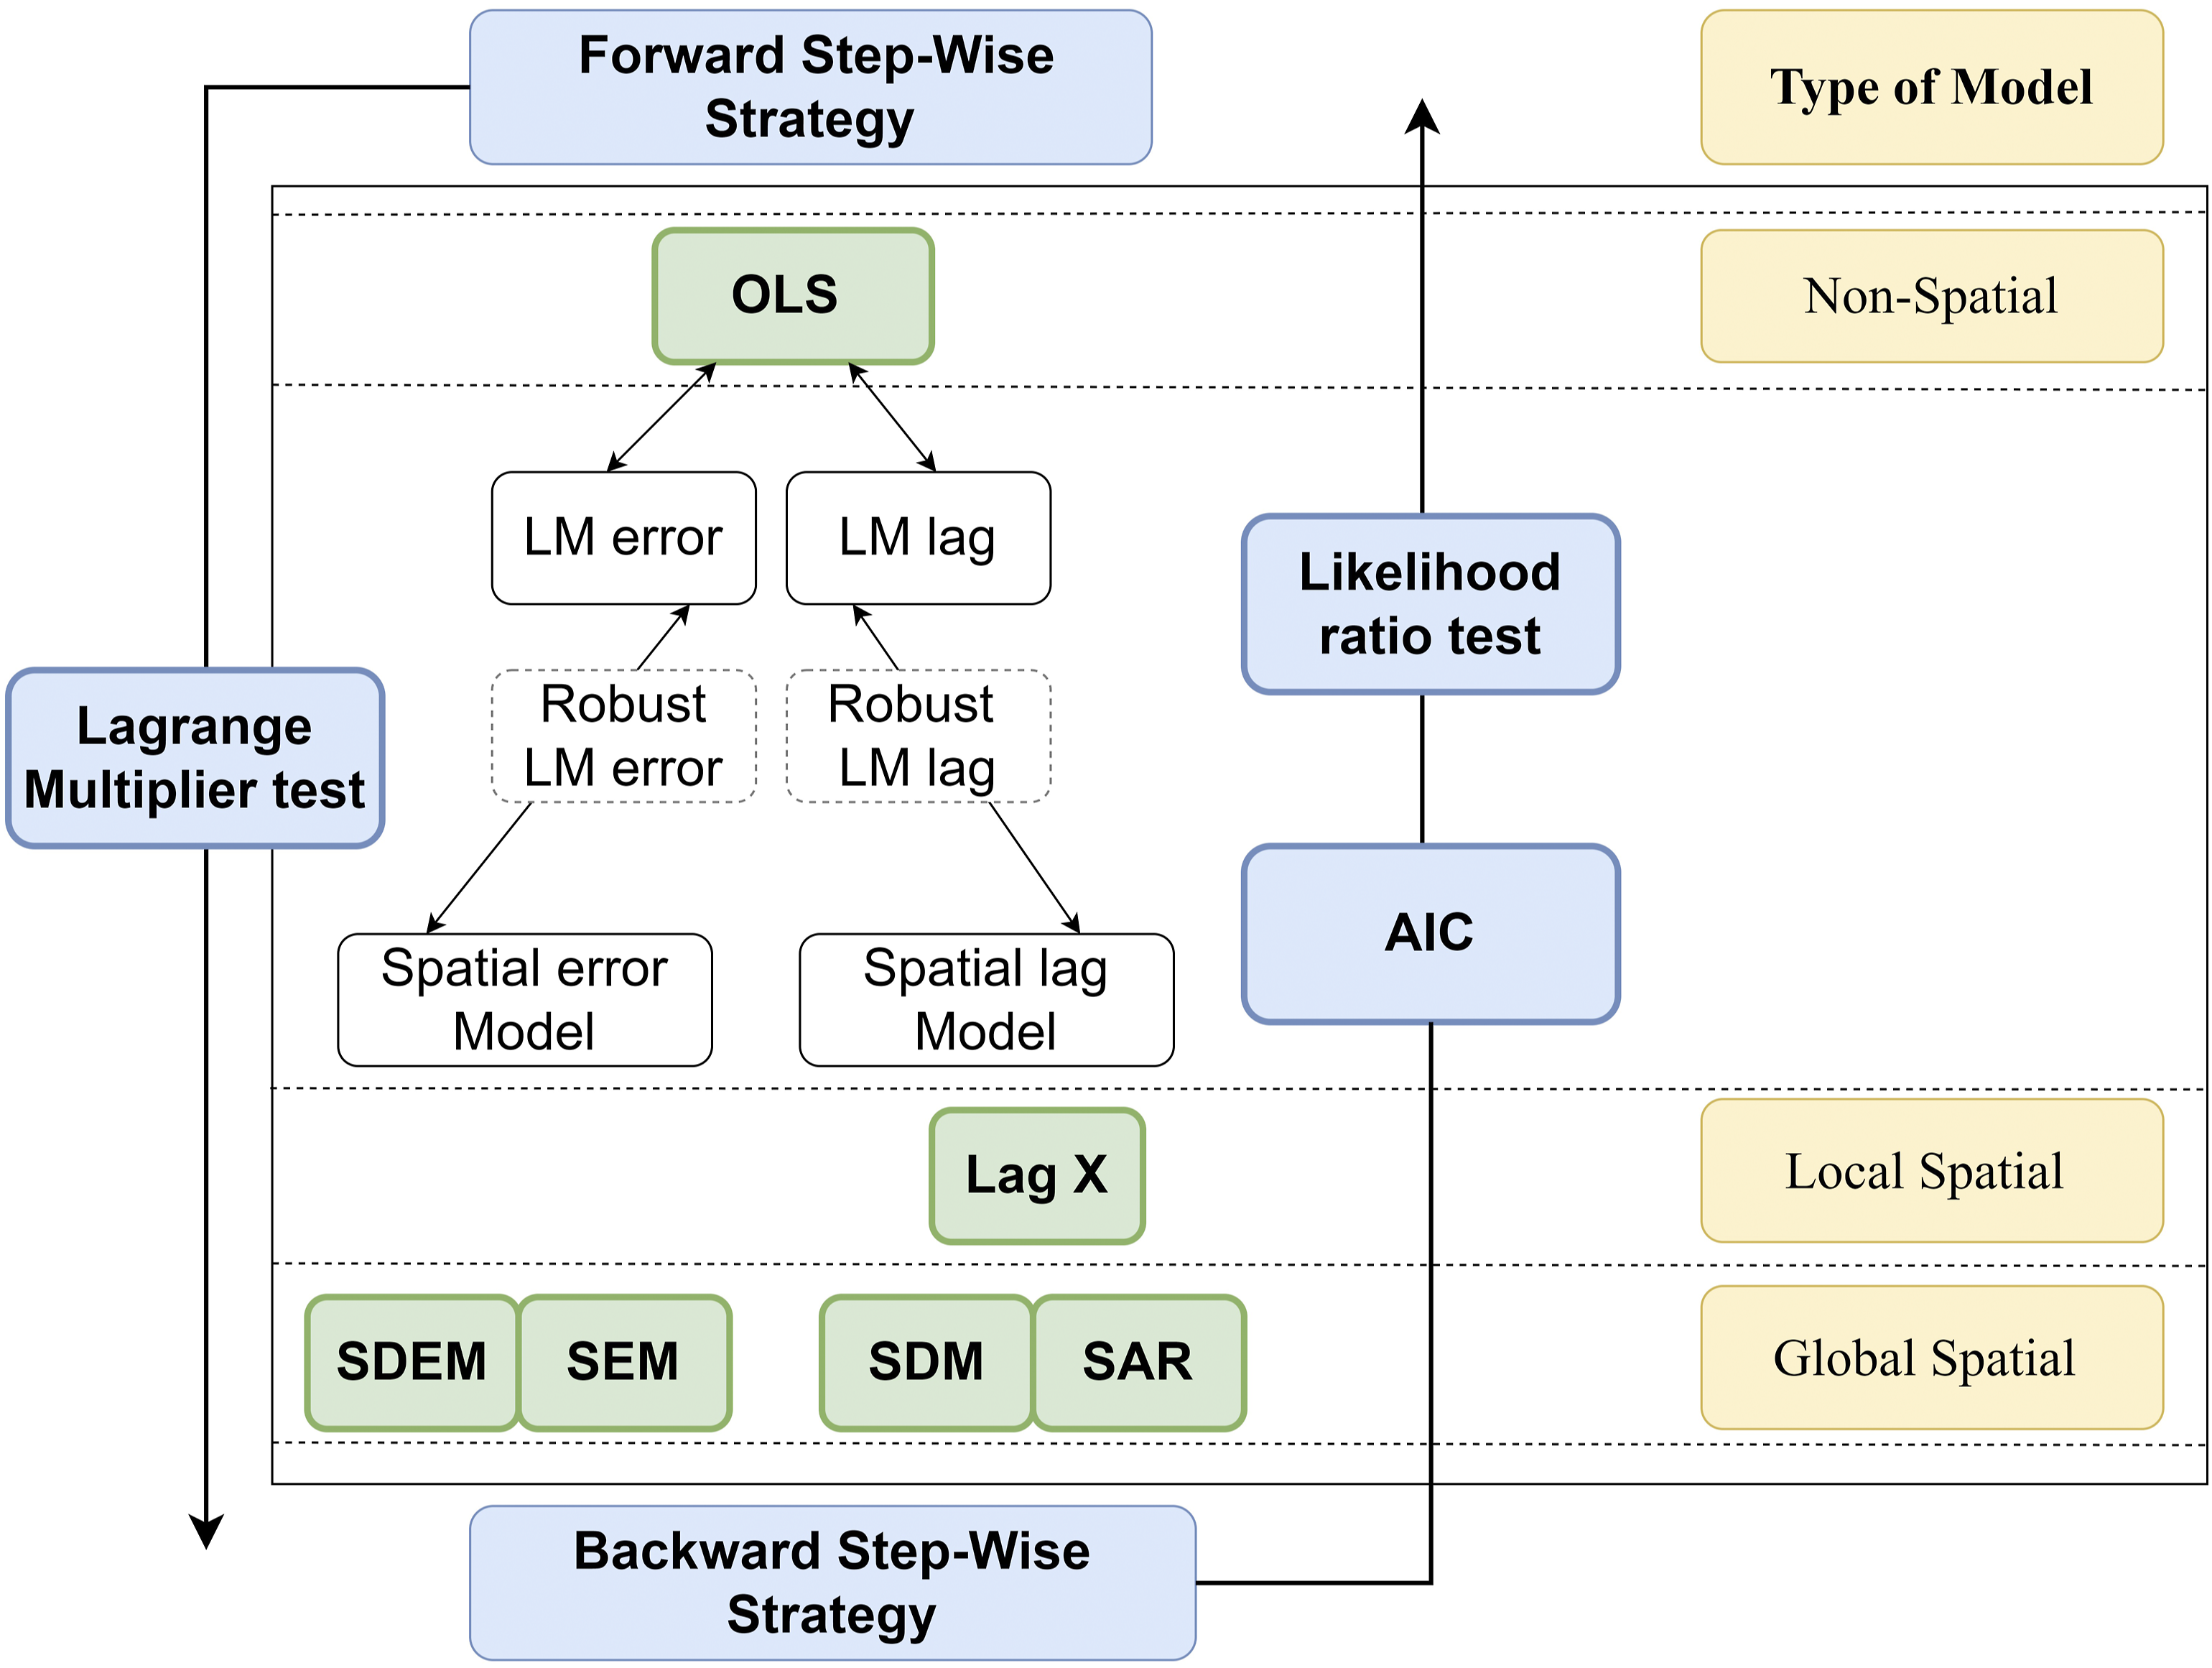
OLS regression model does not account for spatial relationship. The other models tested consider the spatial interdependence through a spatial weight matrix. To do so, we consider the CBGs as our spatial nodes by constructing queen contiguity weights assuming the binary value of 0 for CBGs not sharing a border or one for CBGs which share a border or an edge.
Prior to running spatial models, we evaluated the presence of spatial interdependence among CBGs. To do so, we computed the global spatial autocorrelation through the Moran’s I test for the population activity recovery to essential facilities. The test reveals if spatial dependence is a result of randomization or a spatial autocorrelation, which should be further analyzed. In SM Figure S3, the results show a high significance level (p-value <0.0001) suggesting there is indeed spatial autocorrelation. The Spatial Durbin Model was selected as the best-fitting model based on the evaluation of various models presented in SM.
Spatial Durbin model (SDM): Global spatial model
SDM is a spatial autoregressive model characterized by both spatially endogenous interactions—spatial interactions in the error term—as well as exogenous interactions. SDM is a Spatial Autoregressive Model with an added lag X. To estimate the dependent variable, we used equation (5)

Forward step-wise strategy
The forward step-wise strategy considers first the OLS model and tests if the spatially lag or error model would be more suitable (Elhorst, 2010).
Lagrange multiplier (LM) tests
Lagrange multiplier and robust test results testing the spatial dependence and spatial error autocorrelation.
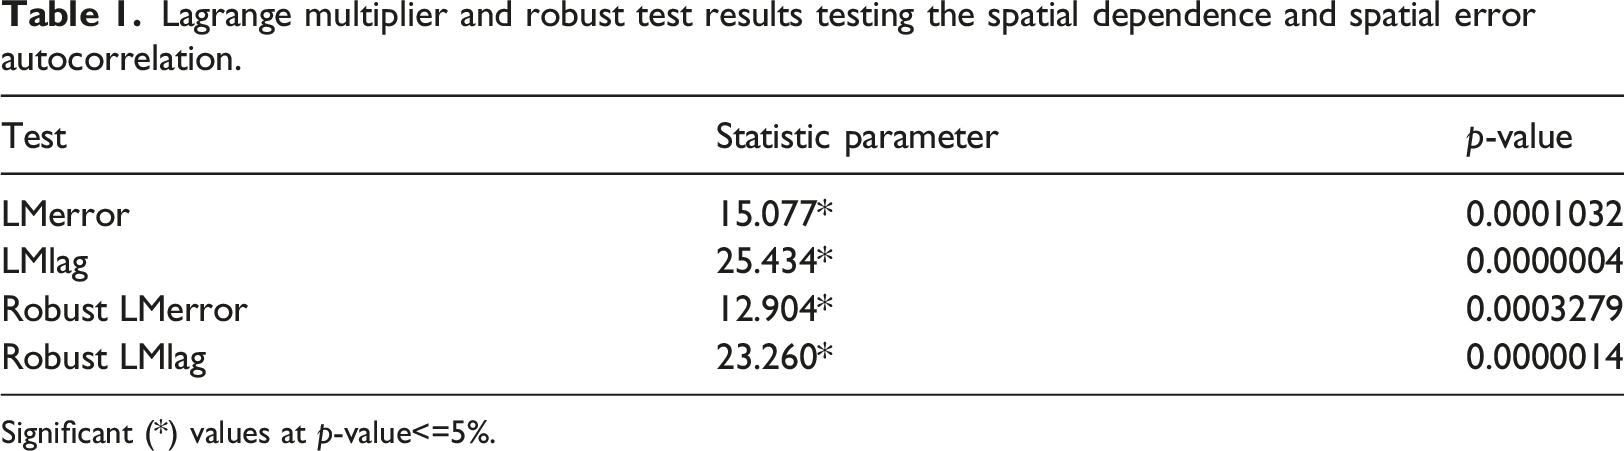
Significant (*) values at p-value<=5%.
Backward step-wise strategy
The backward step-wise strategy tests if global spatial models should be restricted to local spatial or non-spatial models. For this purpose, we examined two different methods: the likelihood ratio test and the Akaike information criterion.
Likelihood ratio test (LR)
Likelihood ratio test performed through parameter restrictions.
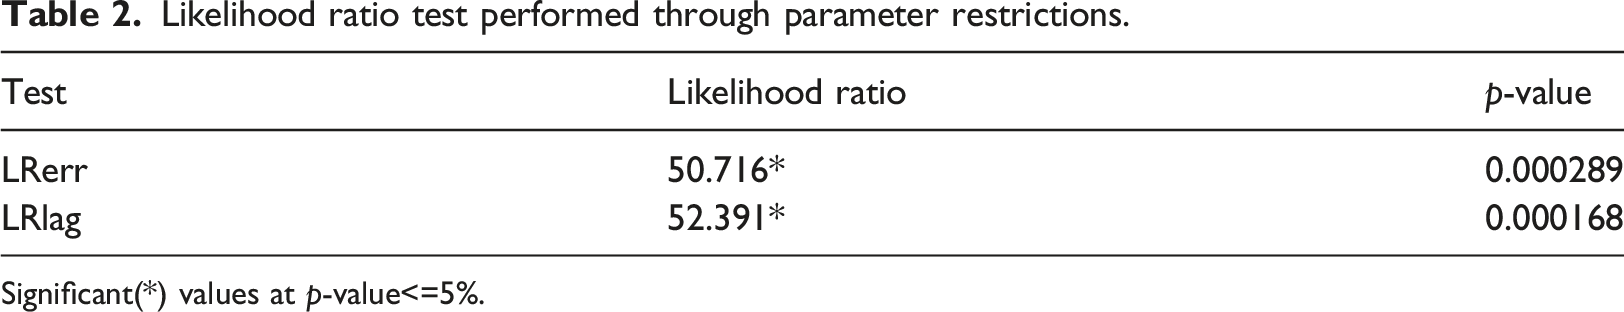
Significant(*) values at p-value<=5%.
Akaike information criterion (AIC)
AIC value is computed for all models based on the model’s maximum log-likelihood and number of free parameters (Akaike, 1974; Sakamoto et al., 1986). The most appropriate model is the one which minimizes the AIC value. Based on the results shown in SM Figure S4, the SDM model is a better choice as a lower value of AIC shows an improvement in the goodness-of-fit of the spatial representation specification in detriment to the non-spatial one.
Results and discussion
Results of the Spatial Durbin model for the population essential activity-based recovery.
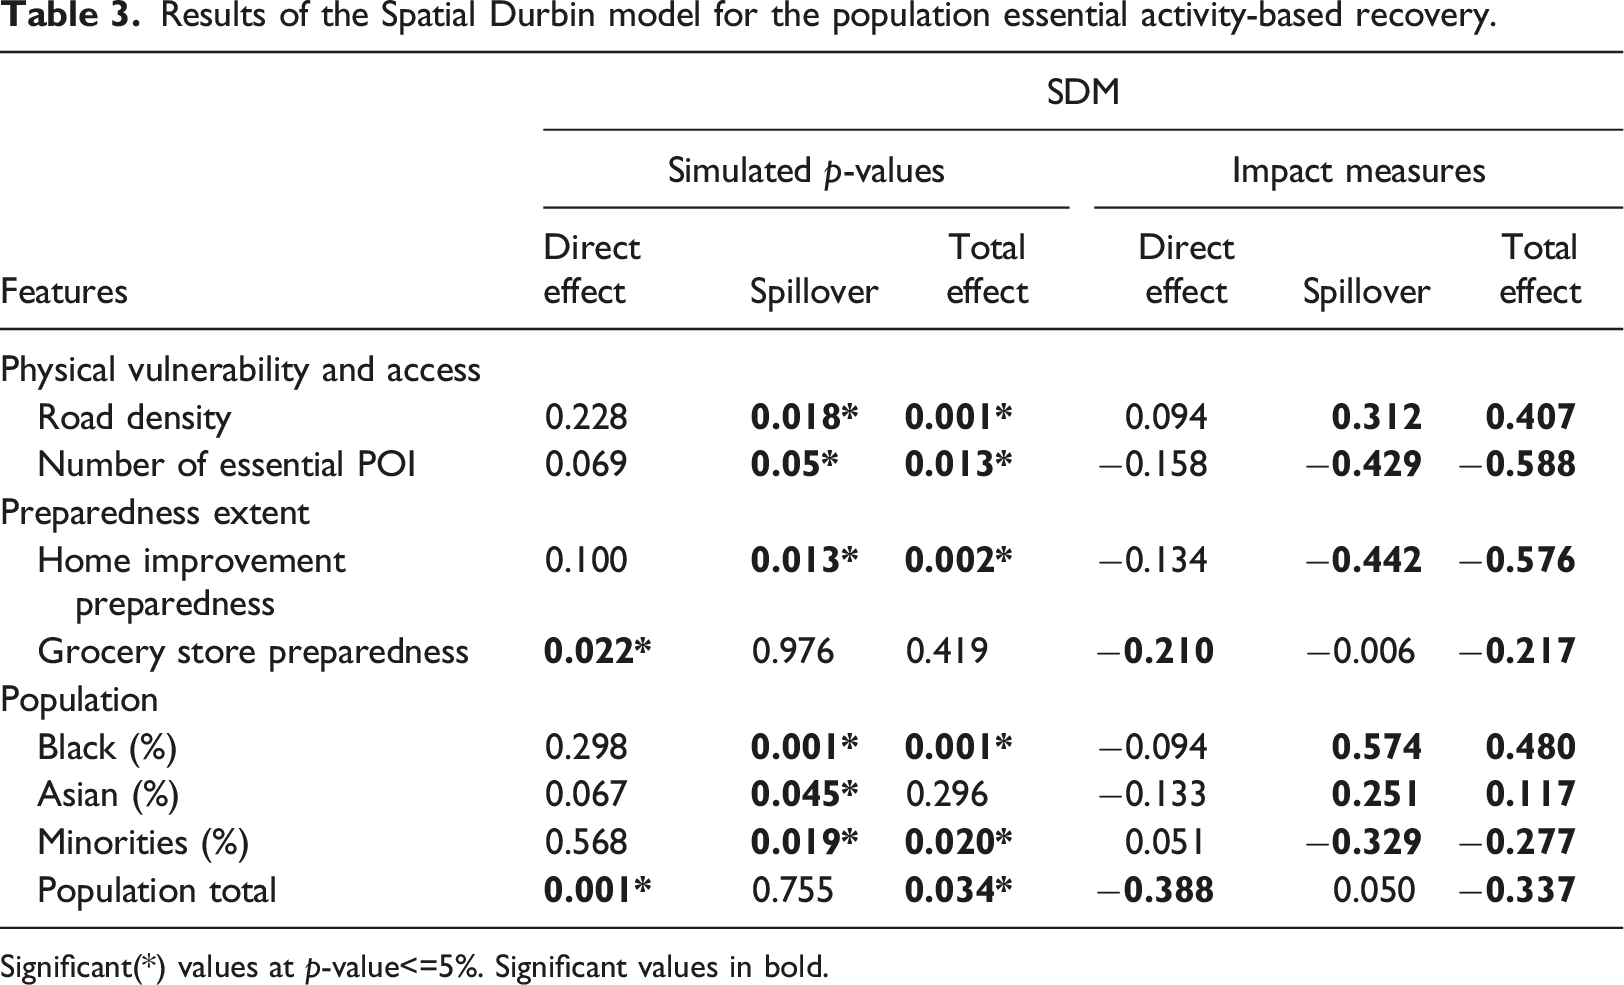
Significant(*) values at p-value<=5%. Significant values in bold.
Physical vulnerability and access features
The results show road density has a significant positive total effect on the population essential activity recovery in a CBG, and positive spillover effect caused by neighboring CBGs on the essential activity recovery. This suggests area surrounded by other areas with higher road density experiences a longer time to recover. This could mean areas with lower road density are overall associated with a faster recovery. Recent studies (Rajput et al., 2022; Dong et al., 2022) show flooding can cause compound failures in transportation networks, implying areas with greater road density would experience a greater disruption. This phenomenon could be explained as after flood retreats, dirt and debris is left behind, and areas with larger number of roads needs more resources to restore usability of roads which could lead to an overall longer recovery time. Therefore, higher road density network, an indicator of higher development, is characterized by a greater physical vulnerability. Also, the results of our analysis show that physical vulnerability of the surrounding areas has a spillover effect on the duration of population activity recovery. This suggests higher urban development could exacerbate physical vulnerability through spillover effects on the surrounding areas, and thus result in a slower recovery at a larger spatial scale.
Regarding access to facilities, the results of our model show a significant negative total effect on the number of essential POIs and the population essential activity recovery. This implies areas with more essential POIs enjoy a shorter recovery period, compared with a longer recovery period for areas with fewer ones. Likewise, the results indicate significant negative spillover regarding the total number of essential POIs in the neighboring CBGs. This translates in areas surrounded by CBGs with more essential POIs having better access to facilities, and thus a faster population activity recovery. Inversely, locations neighboring areas of low-density essential POIs recover more slowly. A short recovery period for areas with a larger number of essential POIs can be explained by vicinity to households. An essential POI situated at a shorter distance is of a higher interest during and in the aftermath of a natural disaster. For example, to purchase basic supplies in a disaster setting, people would prefer a store closer to their homes. Our findings are consistent with literature, which reports people tend to do grocery shopping in the vicinity of their homes in the aftermath of a disaster (Wiśniewski et al., 2020). Hence, areas having or being surrounded by areas with high density of essential POIs recover more quickly than areas which have low density or are neighboring low-density essential POIs. Therefore, facility distribution and access are vital in the recovery process. However, the effects of facility access are not only local, but rather have a spillover effect by influencing population activity recovery in surrounding areas. Emergency managers and decision makes could therefore proactively support the allocation of resources for the areas with higher physical vulnerability and less access to essential services to expedite population activity recovery in those areas. Also, the results have implications for urban development and design plans in terms of improving community resilience by reducing physical vulnerability and improving access by confining road development outside flood-prone areas, as well as more equitable facility distribution to improve access during both normal times and emergency situations (Patrascu et al., 2022).
Hazard exposure and impact features
A counterintuitive result is that none of the proposed hazard exposure features are significant for the population essential activity recovery. In other words, the impacts of flooding on population activities and their recovery are not confined to the flooded areas but rather spread through the entire region. This finding is consistent with literature (Coleman et al., 2022b) and suggests non-flooded areas also experience significant population activity disruptions. This implies spatial effects in the spread of flood impacts on recovery overall, beyond inundated areas only.
Preparedness
Home improvement preparedness has a significant negative total and spillover effect over population activity recovery. The significant negative total effect indicates areas with better home improvement preparedness recover faster while areas less prepared recover slower. The significant negative spillover effect suggests areas having neighboring areas with better home improvement preparedness have a faster recovery and vice-versa. Further, the results show a significant negative direct effect for grocery store preparedness. With a similar interpretation as for the home improvement feature, CBGs with higher grocery store preparedness has a faster population activity recovery. The results reveal a novel relationship between pre-disaster preparedness and post-disaster recovery which connects a better household-level preparedness with a faster essential activity recovery and implicitly a faster community recovery. Based on these findings, emergency managers and public officials can proactively monitor the preparedness actions across different areas and identify areas with low home improvement and grocery preparedness and prioritize these areas for recovery resource allocation to expedite their population activity recovery.
Population features
In terms of social characteristics, the results show a significant positive total effect for the Black subpopulation, a significant positive spillover coefficient for Black and Asian subpopulations, and a negative total and spillover effect coefficient for minority subpopulations when associating race and ethnicity with the population essential activity recovery. The positive sign coefficient for the Black subpopulation total effect suggests an association between areas with a higher percentage of this subpopulation and a slower essential activity recovery of those areas. This could mean areas with higher percentage of these subpopulations need a longer period to recover after a weather-related event. Similarly, the positive spillover effect suggests areas neighboring areas of higher Black and Asian subpopulations are associated with a slower essential activity recovery as the percentage of these subpopulations increases. The findings could be explained through the phenomena called urban segregation. Urban segregation refers to subpopulations, especially very low-income ones, being localized in clusters (Charles, 2003; Logan and Zhang, 2010). Our findings are partially consistent with literature which shows that Black and Hispanic subpopulations continue to live among more disadvantaged neighborhoods, with infrastructure and access inequality issues (De la Roca et al., 2014; Thompson Dorsey, 2013). These inequalities would manifest themselves also in the trajectory of population activity recovery, as shown in the results. Hence, emergency managers and public officials should be aware of inequalities beyond the direct implications of underprivileged areas with higher percentages of Black and Asian populations, and also to account for spillover effect of urban segregation.
Finally, a significant negative total and direct effects between the population total and the essential activity recovery means that areas with larger population size are associated with a faster recovery. This result could be explained by areas with larger population being prioritized in infrastructure restoration and intervention, such as clearing of debris on the streets and restoration of electrical services. This finding highlights the need for a more equitable approach to infrastructure restoration and resource allocation.
Concluding remarks
In this study, we developed a novel spatial model connecting population essential activity recovery to features related to physical vulnerability and access, hazard exposure, protective actions, and population by accounting for the spatial interactions between different CBGs. First, we identified 33 potentially significant features to the population activity recovery to help in proactively anticipating areas expected to encounter slower recovery. Second, we applied a random forest algorithm for feature selection. Third, we evaluated spatial dependency and applied several approaches to identify best model to explain the observational data. The Spatial Durbin model was identified as best fitting. The model revealed total, direct, and spillover effects.
The outcome of this study advances the understanding of the determinants of population activity recovery in disasters. First, the study evaluates the determinants of population activity recovery as one of the critical milestones of community recovery. Second, understanding which features are associated with faster and slower population activity recovery could enable more proactive monitoring the trajectory of recovery across different neighborhoods. Further, the ability to predictively monitor population activity recovery can significantly enhance recovery resource allocation process. Despite recognition on recovery being a spatial process, limited empirical knowledge exists regarding spillover effects on post-disaster recovery. Fourth, the approach used in this study in specifying population activity recovery leveraged location intelligence data. Unlike the standard survey-based methods for monitoring recovery, the use of location intelligence data removes the burden of data collection from the impacted population and facilitates. Thus, this approach has the potential to create a more real-time monitoring of the trajectory of recovery in different neighborhoods to inform resource allocation.
In practice, this study’s findings provide urban planners, emergency managers and public officials a new model and empirical evidence for proactively monitoring the post-disaster recovery in terms of population activities. Emergency managers could use the spatial model to predictively identify areas with slower recovery and proactively allocate recovery resources to those areas. The findings related to direct and spillover effects of various features could inform urban planners of ways in which urban development patterns, such as road development in flood-prone areas, facility distribution, and racial segregation, can directly and indirectly affect urban resilience.
The study opens avenues for future studies to further characterize community recovery. The model could be further tested on future hazard events to evaluate whether the identified direct and spillover effects are present in other regional and hazard contexts. Also, future studies could further examine the spatial effects on community recovery to identify strategies and activate the spatial diffusion process to expedite post-disaster recovery.
Supplemental Material
Supplemental Material - Spatial model for predictive recovery monitoring based on hazard, built environment, and population features and their spillover effects
Supplemental Material for Spatial model for predictive recovery monitoring based on hazard, built environment, and population features and their spillover effects by Flavia Ioana Patrascu and Ali Mostafavi in Environment and Planning B: Urban Analytics and City Science.
Footnotes
Declaration of conflicting interests
The author(s) declared no potential conflicts of interest with respect to the research, authorship, and/or publication of this article.
Funding
The author(s) disclosed receipt of the following financial support for the research, authorship, and/or publication of this article: National Science Foundation (CMMI-1846069 (CAREER)).
Supplemental Material
Supplemental material for this article is available online.
References
Supplementary Material
Please find the following supplemental material available below.
For Open Access articles published under a Creative Commons License, all supplemental material carries the same license as the article it is associated with.
For non-Open Access articles published, all supplemental material carries a non-exclusive license, and permission requests for re-use of supplemental material or any part of supplemental material shall be sent directly to the copyright owner as specified in the copyright notice associated with the article.