
Abstract
Bikeability, the extent to which a route network enables cycling for everyday travel, is a frequently cited theme for increasing and diversifying cycling uptake and therefore one that attracts much research attention. Indexes designed to quantify bikeability typically generate a single bikeability value for a single locality. Important to transport planners making and evaluating infrastructure decisions, however, is how well-connected by bike are pairs of localities. For this, it is necessary to estimate the bikeability of plausible routes connecting different parts of a city. We approximate routes for all origin-destination trips cycled in the London Cycle Hire Scheme for 2018 and estimate the bikeability of each route, linking to the newly released London Cycle Infrastructure Database. We then divide the area of inner London covered by the bikeshare scheme into ‘villages’ and profile how bikeability varies for trips connecting those villages – we call this connected bikeability. Our bikeability scores vary geographically with certain localities in London better connected by bike than others. A key finding is that higher levels of connected bikeability are conferred to origin-destination village pairs of strategic importance, aligning with the stated ambition of recent cycling infrastructure interventions. The geography of connected bikeability maps to the commuting needs of London’s workers and we find some evidence that connected bikeability has a positive association with observed cycling activity, especially so when studying patterns of cycling to job-rich villages.
Introduction
Bikeability, broadly defined as how conducive cities and towns are to cycling, is an active area of transportation planning and cycling research. Its importance as a determinant of cycling uptake is evidenced in both stated preference studies based on survey data (Winters et al., 2013) and revealed preference studies analysing route and mode choice behaviours from observational data (Grigore et al., 2019). Bikeability is typically calculated from a combination of factors related to the provision of bikeable roads and paths (cycle facilities): their extent, coverage and ‘pleasantness’; safety, potential for conflict with other road users; and coherence, whether bikeable facilities are navigable and connect with places to which cyclists wish to travel. Taking these factors into account, there are numerous examples of multivariate indexes describing bikeability generated from data on road network infrastructure (Winters et al., 2013), road traffic and crashes (Grigore et al., 2019) and on the background physical and social environment (Porter et al., 2020). Bikeability indexes are then often expressed as a mapping layer – either a raster surface where bikeability is considered to vary continuously over space or aggregated over some relevant neighbourhood unit.
A difficulty when expressing bikeability in this way, with scores summarised over single areas, is that the results say little about connectivity: in some situations, a place may be rated as highly bikeable, whilst the overall route to that important destination is not. Even if indexes contain variables describing cohesion and quality of infrastructure, as the evidence advocates (Buehler and Dill 2016), interventions to improve a single location may be misplaced when considering the routes that people take. Transport planners evaluating bikeability, and therefore making decisions about the configuration of infrastructure, are likely interested in learning which routes, which parts of a city, are better connected with one another in terms of bikeability, and whether this matters to the city’s social and economic needs.
In this study, we focus on the bikeability of routes directly. We take all origin-destination trip pairs cycled via the London Cycle Hire Scheme (LCHS) in 2018 and collect plausible routes for each using the CycleStreets (CycleStreets 2022) routing engine. Route data are then linked with London’s newly released, and exhaustive, Cycle Infrastructure Database (Tait et al., 2022). Through this approach, detailed information on the nature of routes is collected – their directness, difficulty in terms of junctions and turns, extent of dedicated cycle infrastructure along the route, classes of road encountered and navigability. To analyse connected bikeability, we divide the area of central London covered by the London bikeshare scheme into 66 ‘villages’ and associate bikeshare trip origins and destinations, and therefore routed trips, with these villages to form a dataset capturing the bikeability of over 4000 routed origin-destination (OD) locality pairs. We then interrogate this complex pattern of connected bikeability by modelling how bikeability varies with observed cycling and visually using OD maps (Wood et al., 2010). The usefulness of this approach is demonstrated through an application exploring how connected bikeability matches the commuting patterns of London residents.
Background
There is a large set of literature that uses observational, network and GIS datasets to estimate bikeability. The aim is to identify parts of a geographic area, usually a city, that are more or less conducive to cycling, and therefore that might be prioritised by transport planners for new infrastructure and other interventions. When generating bikeability scores, candidate indicators are typically organised thematically. Four high-level components that relate to bikeability are:
Comfort
Is often represented with variables that describe the presence and quality of dedicated cycle infrastructure (Winters et al., 2013; Arellana et al., 2020; Porter et al., 2020), topography (Grigore et al., 2019; Winters et al., 2013) and other factors such as presence of challenging intersections or road features (Alexander et al., 2018; Gholamialam and Matisziw 2019; Krenn et al., 2015; Manum et al., 2017).
Attractiveness
May encompass infrastructure variables associated with comfort, as well as variables identifying the presence of greenspace, water or street furniture (Krenn et al., 2015; Grigore et al., 2019).
Safety
Introduces variables that describe the likelihood of conflict with other road users: background traffic and infrastructure such as ‘segregated’ bike lanes (Grigore et al., 2019; Lin and Wei 2018).
Coherence
Is represented by the nature and volume of intersections or connecting roads (Nielsen et al., 2013); the presence of signposting or wayfinding infrastructure; and by the extent to which notable destinations can be accessed via the bikeable road network (Lowry et al., 2012; Grigore et al., 2019). Where routes are collected, their directness is approximated by comparing route trajectory and straight-line distances (Desjardins et al., 2021).
Once an appropriate set of variables is selected, bikeability scores are usually expressed as additive indexes. These indexes are often communicated and distributed as a mapping layer, allowing analysis of the extent to which bikeability varies over a city and labelling parts of a city that are comparatively more or less favourable for cycling.
Representing bikeability in this way, where discrete sections of a city have single bikeability scores, enables straightforward interpretation of results. However, transport planners intuitively wish to know which parts of a city are better connected with one another from routes that can be cycled. This aspect has been addressed in a subset of the bikeability literature. Alexander et al. (2018) and Saghapour et al. (2017) use spatial interaction models, rather than estimated route trajectories, to quantify bikeability between locations. OD bikeability scores are then aggregated over destinations (Alexander et al., 2018) or origins (Saghapour et al., 2017) to arrive at single bikeability scores. Separately, Abad and Van der Meer (2018) generate bike network analysis scores that describe network connectivity. Instead of providing results aggregated over some administrative area, Abad and Van der Meer (2018) classify connectivity at route segment level to identify weak links that affect route viability. Whilst our work can be located within these approaches, a point of departure is that we move away from single, stationary scores to express bikeability at any location as multiple connected location pairs, maintaining this multiplicity even in presentation and analysis.
Data and methods
Whilst connected bikeability is conceptually straightforward, careful thinking is required around data collection and analysis. Decisions must be made about a representative set of OD pairs that might be cycled in a city; realistic routes need to be generated for these OD pairs; and from this, valid estimates of the bikeability of entire routes. OD pairs must also be spatially aggregated in ways that support meaningful analysis, enabling practitioners to make inferences about how well-connected by bike are locality pairs relevant to a city’s occupants. Our approach is to use the London Cycle Hire Scheme (LCHS) for generating representative OD pairs, the CycleStreets (CycleStreets 2022) routing engine to approximate routes, bikeshare ‘villages’ as a spatial unit of analysis for aggregating bikeability and OD maps (Wood et al., 2010) to characterise geographic variation in connected bikeability. In this section, we make transparent the analytic decisions required to construct our index. Replication materials are also available via the paper’s accompanying code repository.
Generating routes
The LCHS is one of the world’s largest and frequently used bikeshare schemes (Fishman 2016) with 10 million journeys made each year. It consists of c.800 docking stations located throughout central and inner London. Targeted expansions into residential areas of London have been designed alongside improvements in London’s cycle infrastructure in order to incentivise bike use for making everyday trips (Beecham 2015). Detailed data on the LCHS has been released by Transport for London (TfL) since the scheme’s launch in 2010. This consists of real-time docking station occupancy data on the number of bikes and spaces available at each docking station, along with timestamped OD trip data. In order to generate a ‘reference set’ of candidate OD trips, we selected all trip pairs made via the scheme in 2018. This time period overlaps with the survey date for the infrastructure dataset used in our bikeability index, the London Cycling Infrastructure Database (CID) (TfL 2022b).
Indicative routes for each cycled trip were generated via the CycleStreets (CycleStreets 2022) routing engine. CycleStreets aims to suggest practical routes taking into account the road and cycle infrastructure, route complexity or ‘legibility’ and physical characteristics such as hills and inclines. CycleStreets provides a web Application Programming Interface (API) to its routing engine. Spatial coordinates representing an OD pair are passed to the API and data on each route returned as json. Routing requests can be parameterised according to three classes of preference: fastest route, balanced (a mix between travel time and route quietness) and quietest route. We harvested routing data for all 671,576 unique OD pairs cycled in the London bikeshare scheme in 2018 by making batch requests to the API and using the fastest route setting. A map of the top 10,000 estimated routes cycled in LCHS in 2018 is in Figure 1. Top 10,000 routes cycled in LCHS in 2018, derived using CycleStreets.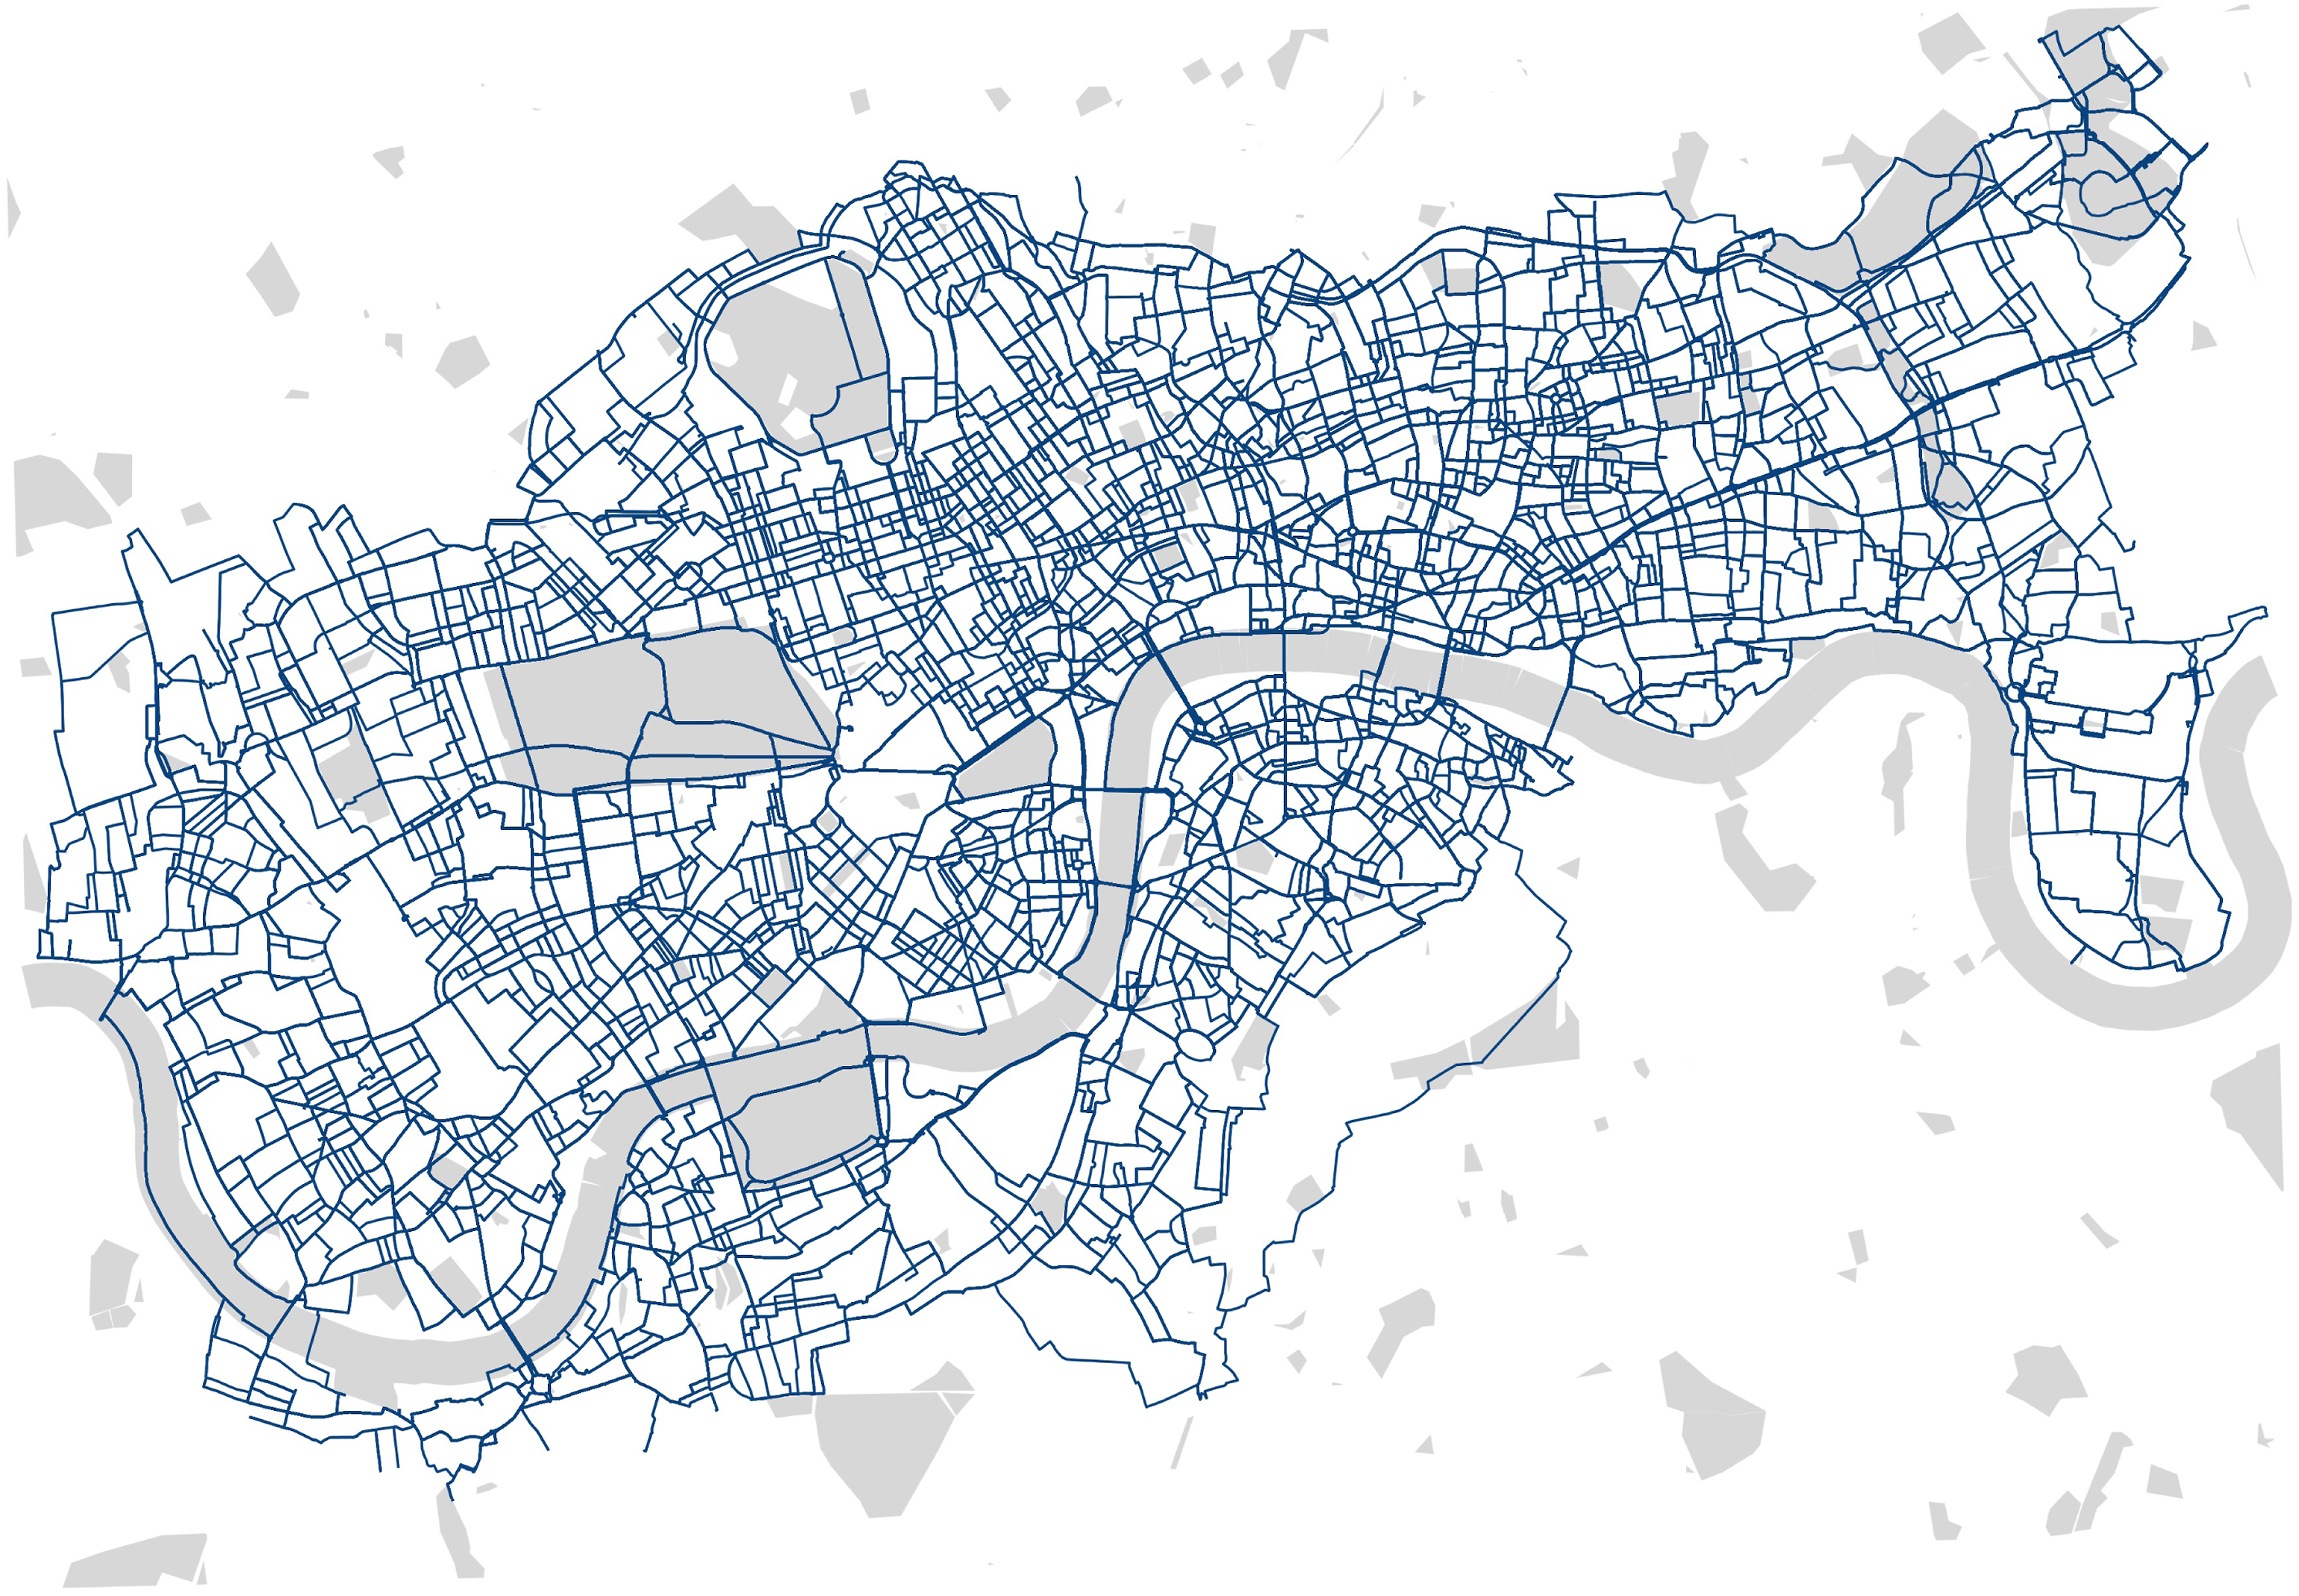
The LCHS was carefully designed in light of London’s social and economic geography, so the collected OD pairs and routes are likely to describe locations in London frequently connected via cycling (Beecham 2015). However, the scheme is constrained to central London and, due to the nature of its bikes (heavy, with limited gears) does not extend far north or south where hilliness is likely to be make cycling less viable. Bikeshare OD pairs will, therefore, not map directly to regular cycle trips in London. Another source of uncertainty is that routes approximated by CycleStreets may not be representative of actual route trajectories. To explore this, we collected open TfL manual counter data (TfL 2022b) measuring observed counts of LCHS bikes on key infrastructure, London’s bridges, at 15-minute intervals on specified dates. These frequencies were compared with those that would be expected given our CycleStreets-routed LCHS trip counts. We observed a very strong association between the two datasets (r. 0.77), suggesting overlap between actual routes and those suggested by CycleStreets at least at the point locations surveyed by TfL counters. Further detail of this analysis is presented in the accompanying code repository.
Generating bikeability ‘heuristics’
Variables used to represent bikeability. CS CycleStreets, OS Ordnance Survey open roads, CID London Cycle Infrastructure Database and OSM Open Street Map.
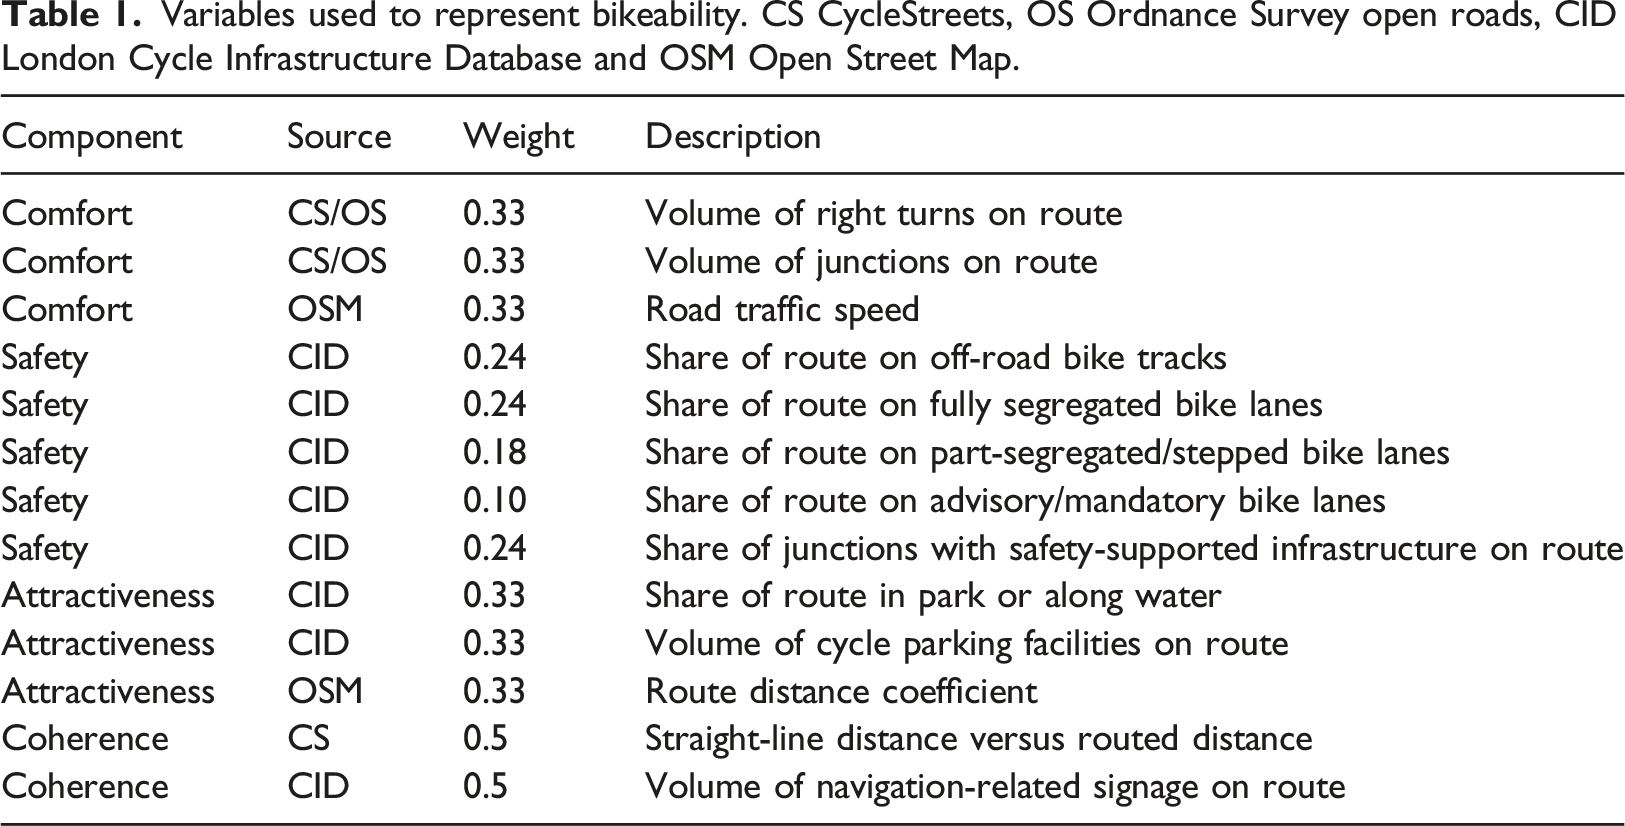
To represent
For Attractiveness, we quantified the extent to which routes take in physically attractive settings by identifying proximity to greenspace and water. Again, this is expressed at the route level – the share of the route that passes through parks or waterside. Clearly, not all parks or water in London are ‘attractive’ and not all attractive parts of the city are close to a park or river. A second variable to express attractiveness is the volume of cycle parking facilities encountered on routes, again using CID data. The rationale is that cycle parking facilities tend to be situated at locations of interest or significance in London – along routes known to be prominent for cycling, conferring some additional information around the bikeability of those locations. A third variable relating to attractiveness is distance. The relative impact of distance on bikeability varies with cycling context and user type. In urban contexts, cycling is often a feeder mode, with particular categories of distance preferred over others (Martens 2004); we therefore also evaluated relative attractiveness of routes using route-level distance. Based on evidence from Martens (2004), the distance penalty was applied in a non-linear way: trips between 2 − 6 km were deemed optimal with a distance decay progressively disadvantaging trips outside of this range.
Cleaning variables capturing bikeability ‘heuristics’
If each variable is to usefully discriminate OD pair trip context, heavy skew and uneven variation in variables is to be avoided. An initial problem was with shorter trips, which were associated with highly changeable bikeability scores. Manually inspecting these very short trips, it was clear that they were implausible or inappropriate for cycling. Analysis by TfL identifies a minimum straight-line distance of potentially cyclable trips as c.500 m (TfL 2010). Given the high variability of values for the short routed trips, we used this threshold for excluding all trips whose straight-line distances were
A more fundamental problem was in how bikeability indicators varied with trip distance. Taking the count-based variables as an example, the longer the route the more opportunity there is for right turns and junctions (Table 1) to accumulate – and so counts needed to be expressed as ‘rates’ relative to route distance. After performing various checks (visual and computational) on these distance-adjusted rates, however, we still observed a systematic bias in favour of longer trips; a pattern that was replicated across variables: the area-based variables quantifying route-level segregation (Table 1 – Safety), road class (Table 1 – Comfort) and provision of bike facilities and greenery (Table 1 – Attractiveness). This makes sense when remembering the intuition built into routing engines such as CycleStreets. Junctions, turns and non-dedicated cycling infrastructure all impose costs, which are difficult to avoid at the start and end of trips. As trip length increases, however, there is greater opportunity to avoid turns, junctions (route difficulty) and redirect to dedicated infrastructure. The attendant bias is problematic as we wish to compare and evaluate connected bikeability at a city-wide scale. For each of the input variables, distance-adjusted expectations were derived by modelling associations between each variable and trip distance. Input variables were then expressed as residuals from this modelling. For the route difficulty factor, our input variables therefore identify whether there are greater or fewer right turns and junctions on a route than would be expected net of the global association observed between junctions/turn frequency and distance.
Generating the additive index
Once appropriate cleaning operations were performed, we followed the convention in geographic literature on indexes (Cockings et al., 2015) and applied a Box-Cox transformation with range scale (0–1) normalisation to each variable. Variables and components were then combined additively and each component given an equal overall weight. Making decisions around how to weight individual variables within components is challenging. Certain components of bikeability have more variables attached to them than others. By default, we decided that each unique variable should contribute equally to a component. For the
Spatial unit of analysis
The starting point for our analysis was routes generated from 671,576 OD pairs cycled within the spatial bounds of LCHS. Identifying geographic patterns in such a detailed dataset is clearly challenging and it is useful, therefore, to aggregate trips in a meaningful way. In Wood et al. (2020), LCHS docking stations are aggregated to bikeshare villages – labelled neighbourhoods which, assuming some familiarity with central London, are reasonably coherent and discriminating. We borrowed the villages detailed in Wood et al. (2020) for our analysis to generate a dataset of village boundaries by constructing Voronoi regions around village centroids, with some manual adjustment to ensure the spatial extents of villages do not spill across the river Thames and to accommodate docking stations on the edge of the scheme. Each docking station was then assigned to the village it is contained within and our OD bikeability scores summarised at the bikeshare-village-level. The resulting dataset contains 4326 (662) OD village–village pairs.
Aggregating to bikeshare villages inevitably causes Modifiable Areal Unit (MAUP)-related zoning effects: docking stations towards the edge of a village Voronoi that might be allocated to a neighbouring village. Inspired by Fisher (1991), we adjust for the uncertainty introduced by these zoning effects by probabilistically reallocating edge docking stations to neighbouring villages based on distances to neighbouring boundaries. There is a stochastic element to this re-allocation, and so we calculated aggregated connected bikeability scores on each re-allocation to create an ensemble of scores for each OD village pair. Adjusted bikeability scores were then derived by taking the ensemble average for each OD pair. We additionally explored uncertainty due to zoning effects in aggregated bikeability via hypothetical outcome plots (Hullman et al., 2015), an approach also suggested by Fisher (1991). These animations are presented in the paper’s code repository.
Analysis
Connected bikeability and observed cycling
When analysing their bikeability index, Alexander et al. (2018) explore how closely bikeability maps to actual cycling activity. This is technically achievable as we have a precise record of observed cycling in London – bikeshare trip counts. There are, nevertheless, several difficulties with doing so. First, the amount of cycling between OD locations in the LCHS is heavily conflated with demand – where work and other activities are concentrated in London. Second, heavy competition for bikes and docking stations leads to service pressure, making certain parts of the scheme more viable than others. Third, related to demand, LCHS trip patterns are dominated by two distinct functions that are difficult to adjust for: a leisure-type function characterised by trips coinciding with London’s parks and tourist attractions and a commuter-type function where so-called last-mile trips connect major rail terminals and workplace centres (Beecham 2015). Finally, bikeshare schemes incentivise short trips, both in their physical design and pricing regimes; journeys connecting more remote OD village pairs therefore become quite impractical. For our model to make sense, it is necessary to account for at least some of this confounding context.
Taking peak-time trips that occur during the morning commute (weekdays 0600 − 1000), we model how trip counts between village OD pairs (y
od
) vary with the estimated bikeability of those OD pairs (β1x
od
). To adjust for demand (β2x
od
), we create a synthetic dataset of commuting derived from 2011 Census travel-to-work data approximated over village OD pairs. Service pressure (β3x
od
) is estimated using bikeshare docking station trip occupancy data, released at 10-minute observation periods (c.f. Yang et al., 2022). The impracticality of cycling between remote village pairs is straightforwardly represented, using average distance (β4x
od
) of routed trips between village OD pairs. Adjusting for LCHS’s idiosyncratic usage-functions is more challenging. As the model attempts to explain commuting behaviour during the morning peak, the strong leisure function is necessarily dampened, but the last-mile pattern related to transport hubs persists. To capture this, we add a fixed effect term (β5x
od
) which varies depending on whether the trip occurs between villages that contain hub stations. Finally, the pattern of trip frequencies will also vary systematically on the destination village (workplace) – each workplace will have its own distinctive geography of commuting. We therefore add a group-level intercept term (u
d
) on destination villages that allows for this between-destination heterogeneity. A fuller description of the modelling is in the paper’s code repository.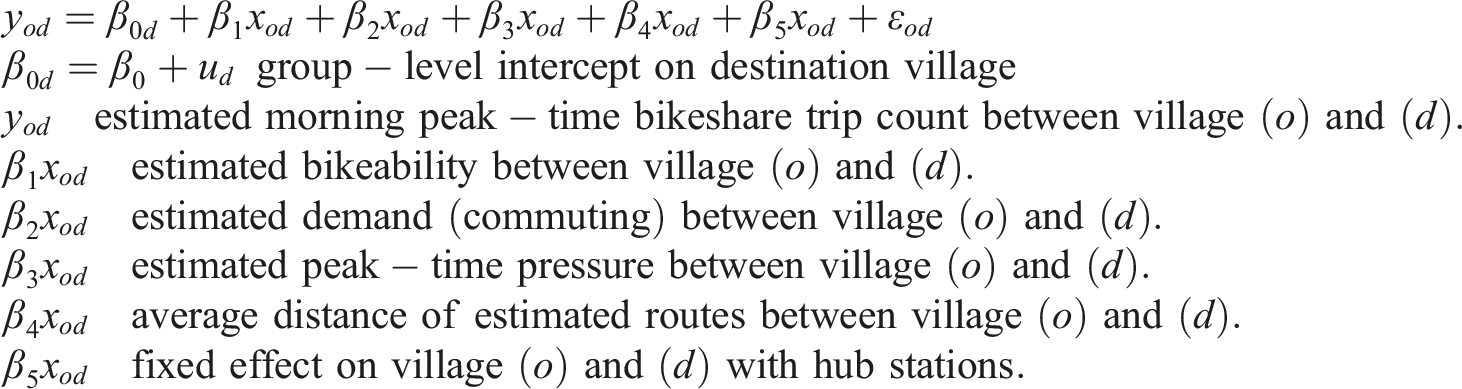
Regression coefficients from the model are presented in Figure 2. The model explains a reasonably large share of variation in OD village trip frequencies (marginal R2 85%; conditional R2 78%), with patterns in coefficients that align with expectation: routed distance and service pressure are associated with reduced trip counts, whereas Census commuting (estimate of demand), the presence of hub stations and our connected bikeability index are associated with increased trip counts. The effect size for the bikeability measure is nevertheless comparatively small. Updating the model to allow the slope of the bikeability variable to also vary on destination demonstrates that the effect of bikeability on observed trips is subject to variation; larger positive coefficient effects generally attach to bikeshare villages that are prominent ‘destinations’ for commuting and other activities (Figure 2). Outputs from modelling work validating bikeability against observed LCHS cycling.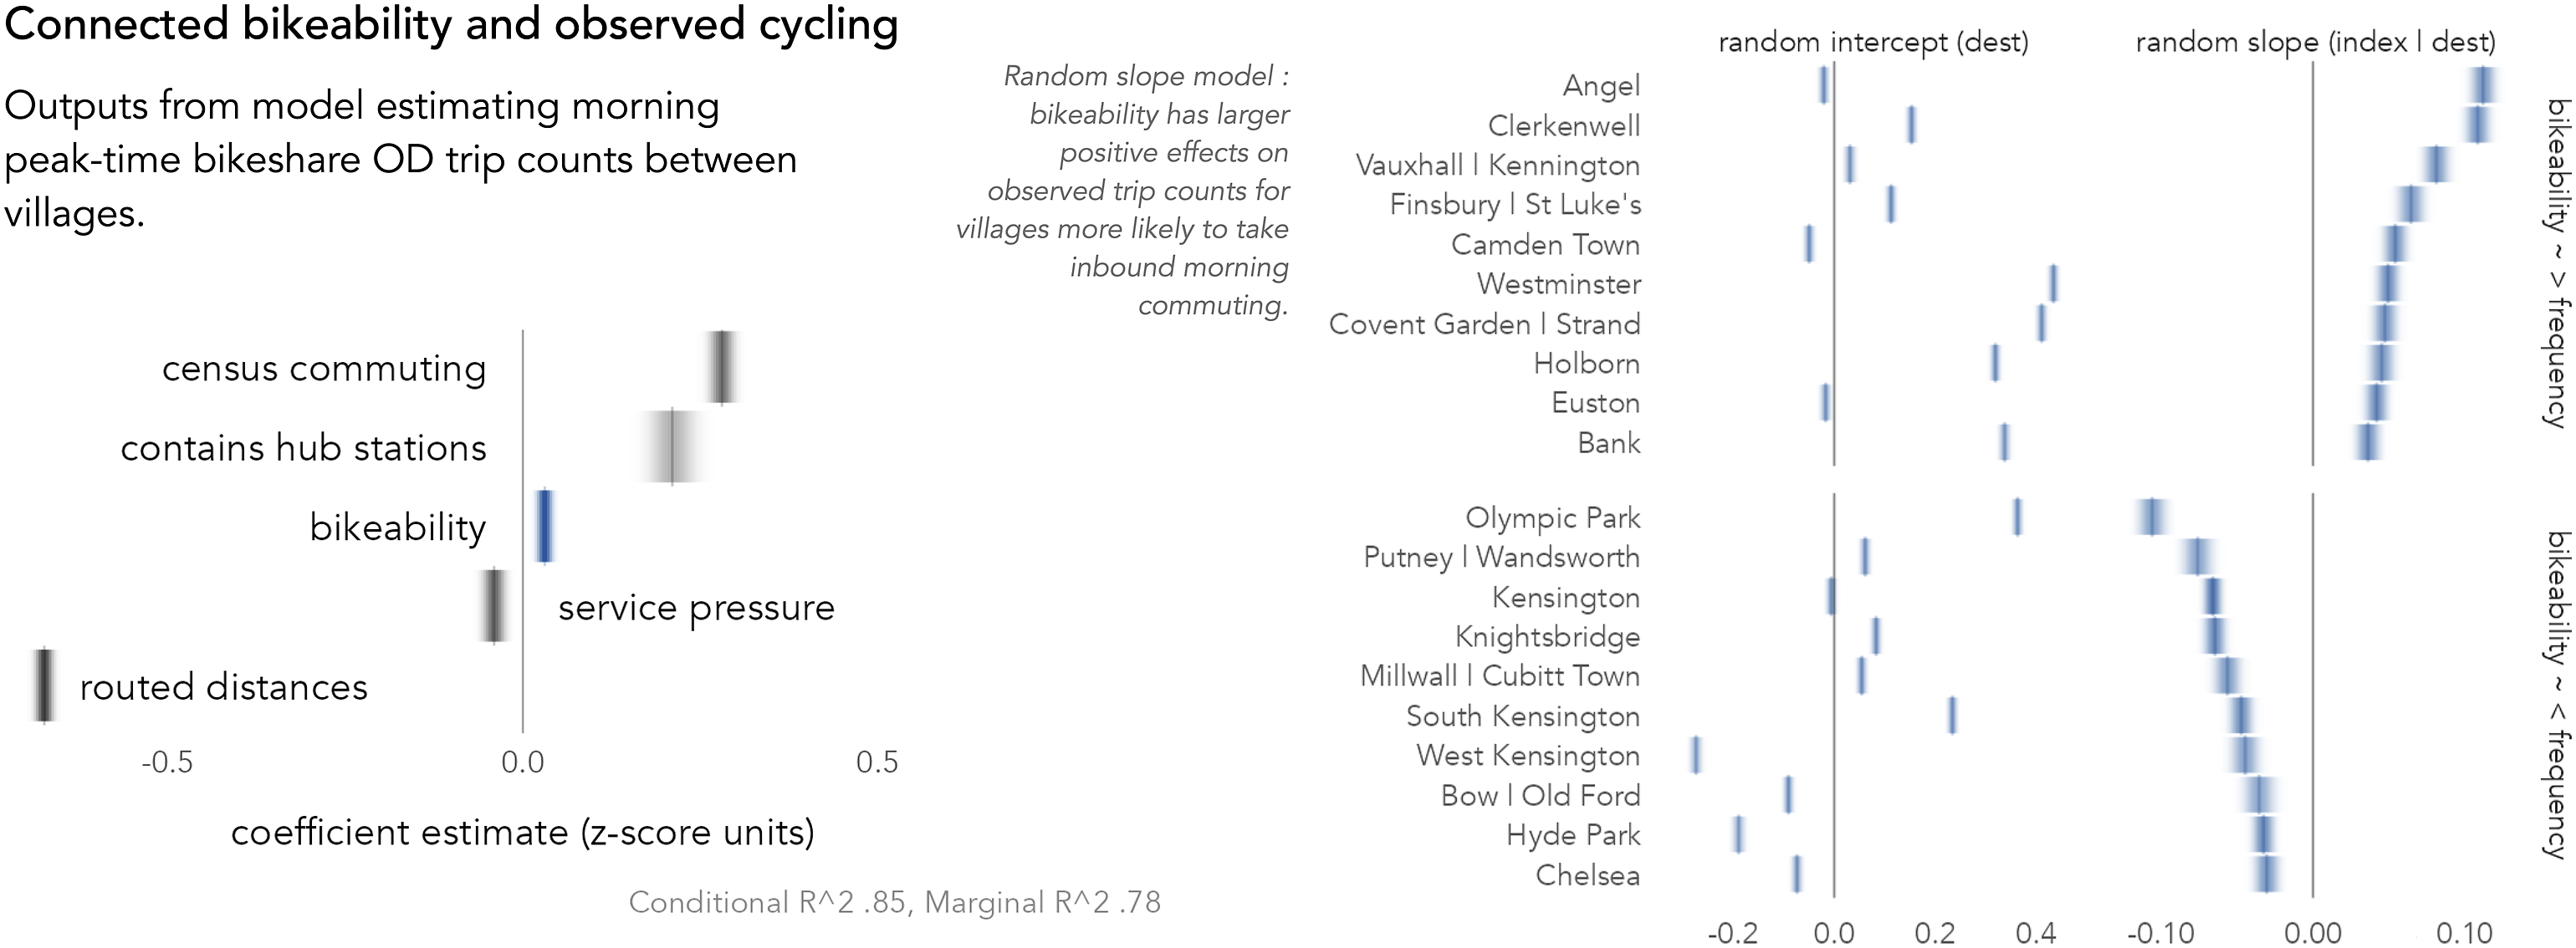
Spatial variation in connected bikeability
Visual analysis allows a more detailed interrogation of how patterns in connected bikeability relate to London’s geography – in this case, the bikeability of 4326 OD village–village pairs. Analysing this full set of bikeability scores within geographic context is challenging; when using de facto flow visualisations, problems of clutter and salience bias hinder meaningful analysis. Origin-Destination maps are one alternative (Wood et al., 2010). They are OD matrices in which cells are given a two-level geographic arrangement using a map-within-map layout. An explanation appears in Figure 3. The large grid squares are bikeshare villages with an approximate geographic arrangement; each represents a trip destination in our application. Embedded in every larger cell is a map of bikeshare origins. The origin maps are then shaded according to a quantity of interest – bikeability scores in this case. This means that each village–village OD pair is roughly equally visually salient, allowing detailed patterns in connected bikeability to be analysed concurrently. Alongside the OD map in Figure 3 is a context map displaying key dedicated cycling infrastructure in London, released by (TfL 2022a). OD map of connected bikeability index.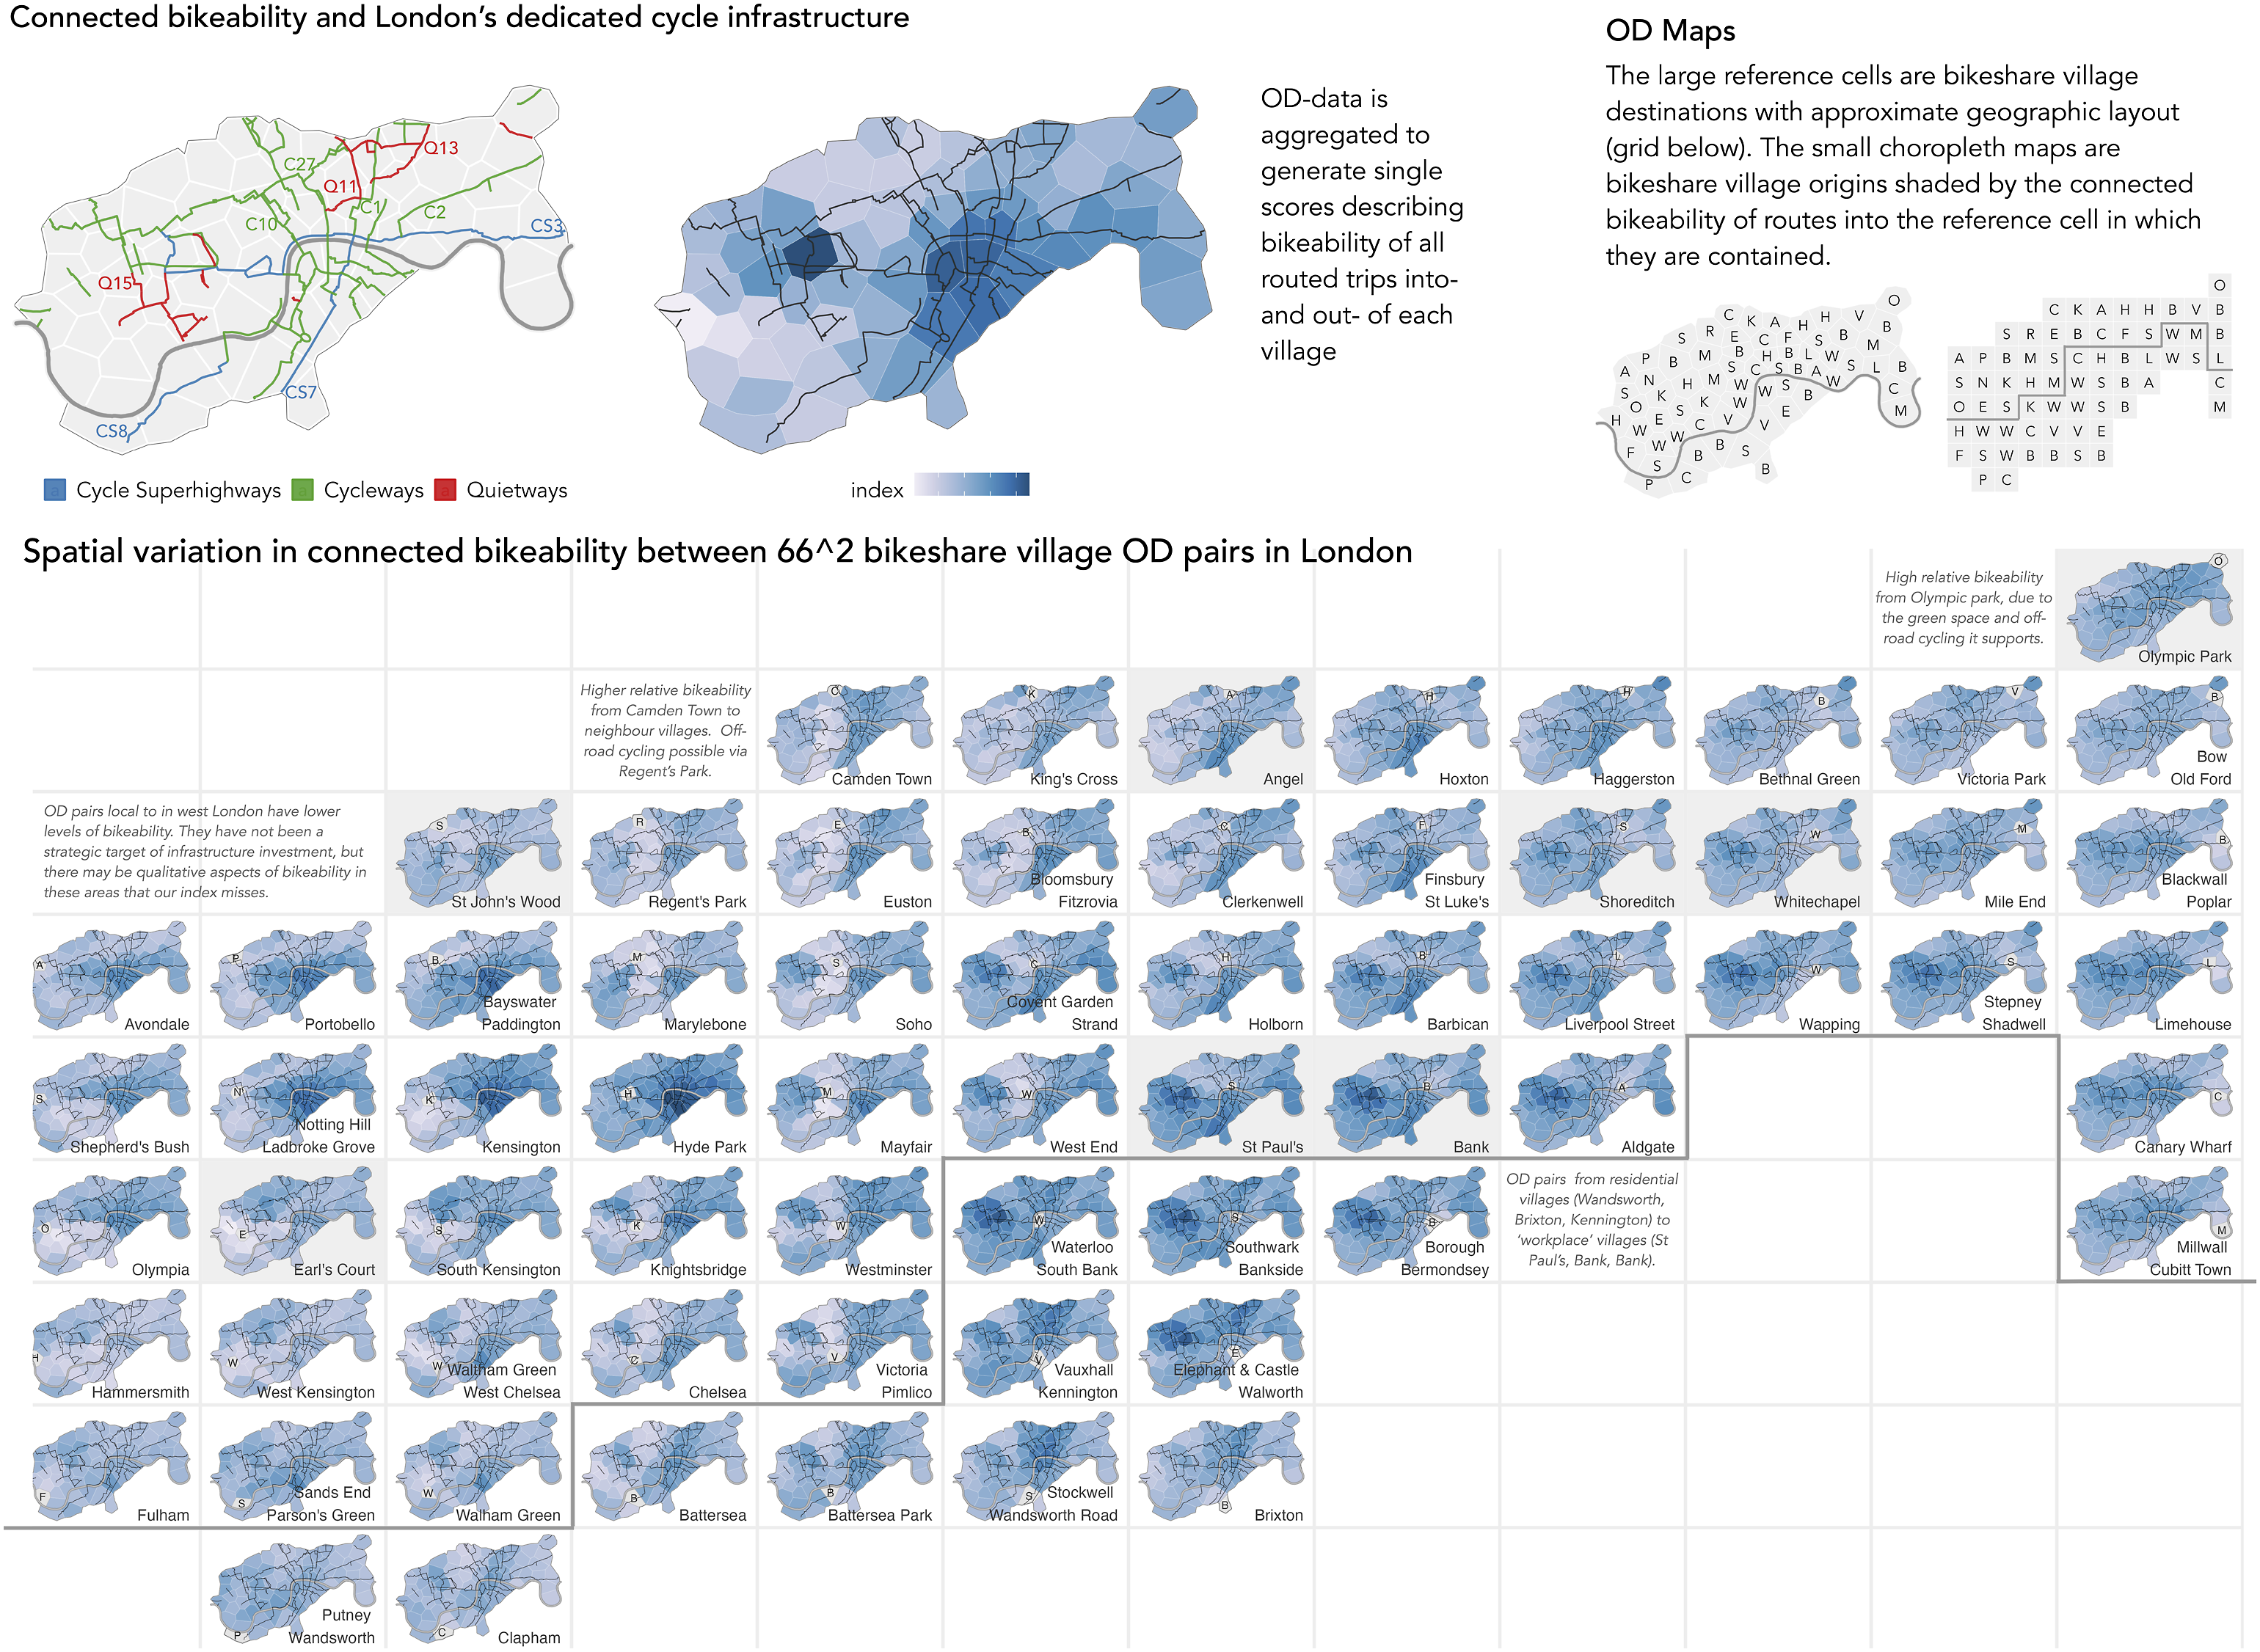
The maps confirm that there is, as expected, a geography to connected bikeability that aligns closely with London’s key cycle infrastructure. Destinations of strategic importance – bikeshare villages in the City of London (Bank, St. Paul’s, Barbican), major rail hubs (Waterloo, Southbank) and to a lesser extent central London (Westminster, Strand/Covent Garden) contain OD pairs with generally higher connected bikeability (darker blues). OD village pairs that involve travel east-to-west and west-to-east have high bikeability scores. The routes associated with these OD pairs likely involve substantive cycle infrastructure, for instance, the segregated east-west ‘Crossrail for Bike’ installed in 2017 and connecting Canary Wharf to west London (GLA 2015). OD pairs local to central, north west and south west of the scheme, and where infrastructure is less comprehensive, have lower connected bikeability scores. That the index penalises routes into these areas may be ecologically valid – bikeshare villages such as Earl’s Court, Olympia and Hammersmith, for example. For other villages, St John’s Wood for instance, this penalty may be more questionable; there may be extra features that make central-north London more conducive to cycling than our index suggests.
A strategic focus of cycling infrastructure investment in London is in connecting key workplace centres (GLA 2015). This was suggested by our model comparing observed cycling activity with bikeability and is reflected in the pattern of connected bikeability scores in Figure 3. Higher bikeability is recorded for journeys into villages in the City of London (Bank, St Paul’s) from more residential villages towards the south (Vauxhall/Kenington, Brixton, Wandsworth) and east (Mile End, Stepney/Shadwell), which are served by Cycle Superhighway 7 and 3, respectively. Another focus of attention has been in supporting journeys over bridges, since they involve negotiating relatively large, fast-moving roads, often with difficult junctions at either side (TfL 2017). Again, evidence of this is in the connected bikeability scores: the average bikeability of trips involving Blackfriars, a bridge supported with fully segregated cycle lanes, is substantially higher than that of neighbouring London Bridge (0.56 vs 0.46, Cohen’s d. 1.0), which in 2018 had no segregated infrastructure and was perceived as awkward for cycling (TfL 2017).
Application
Spatial variation in connected bikeability and London’s labour market
Our connected bikeability measure incorporates detailed information on substantial new cycling infrastructure in London. Since these interventions were designed deliberatively to support London residents’ everyday travel needs (GLA 2015), it may be instructive to evaluate bikeability given this stated purpose.
In this section, we explore how well geographic variation in bikeability matches different categories of commuting need by disaggregating OD commutes according to occupation type. Essentially we wish to identify bikeshare village OD pairs that are, in relative terms, important for supporting higher-wage professional occupations from those relatively more important to supporting lower-wage non-professional jobs. We again use OD maps and colour origin villages according to relative differences in the number of commutes by occupation, but in Figure 4 focus on a single destination, Strand/Covent Garden. According to 2011 Census data, this bikeshare village contains an estimated 11,300 jobs accessed by workers resident in bikeshare villages within the LCHS boundary. We compare frequencies of professional versus non-professional workers commuting in from neighbouring villages against what would be expected given the relative number of those jobs available. Contingency tables containing frequencies of bikeshare village–village commutes by occupation are constructed and signed chi-scores used to express these differences (c.f. Beecham and Slingsby 2019). Selected OD maps where Strand – Covent Garden is the destination. Origin maps are shaded according to connected bikeability, estimated commute counts and signed chi-scores of relative differences in professional versus non-professional workers commuting from origin villages.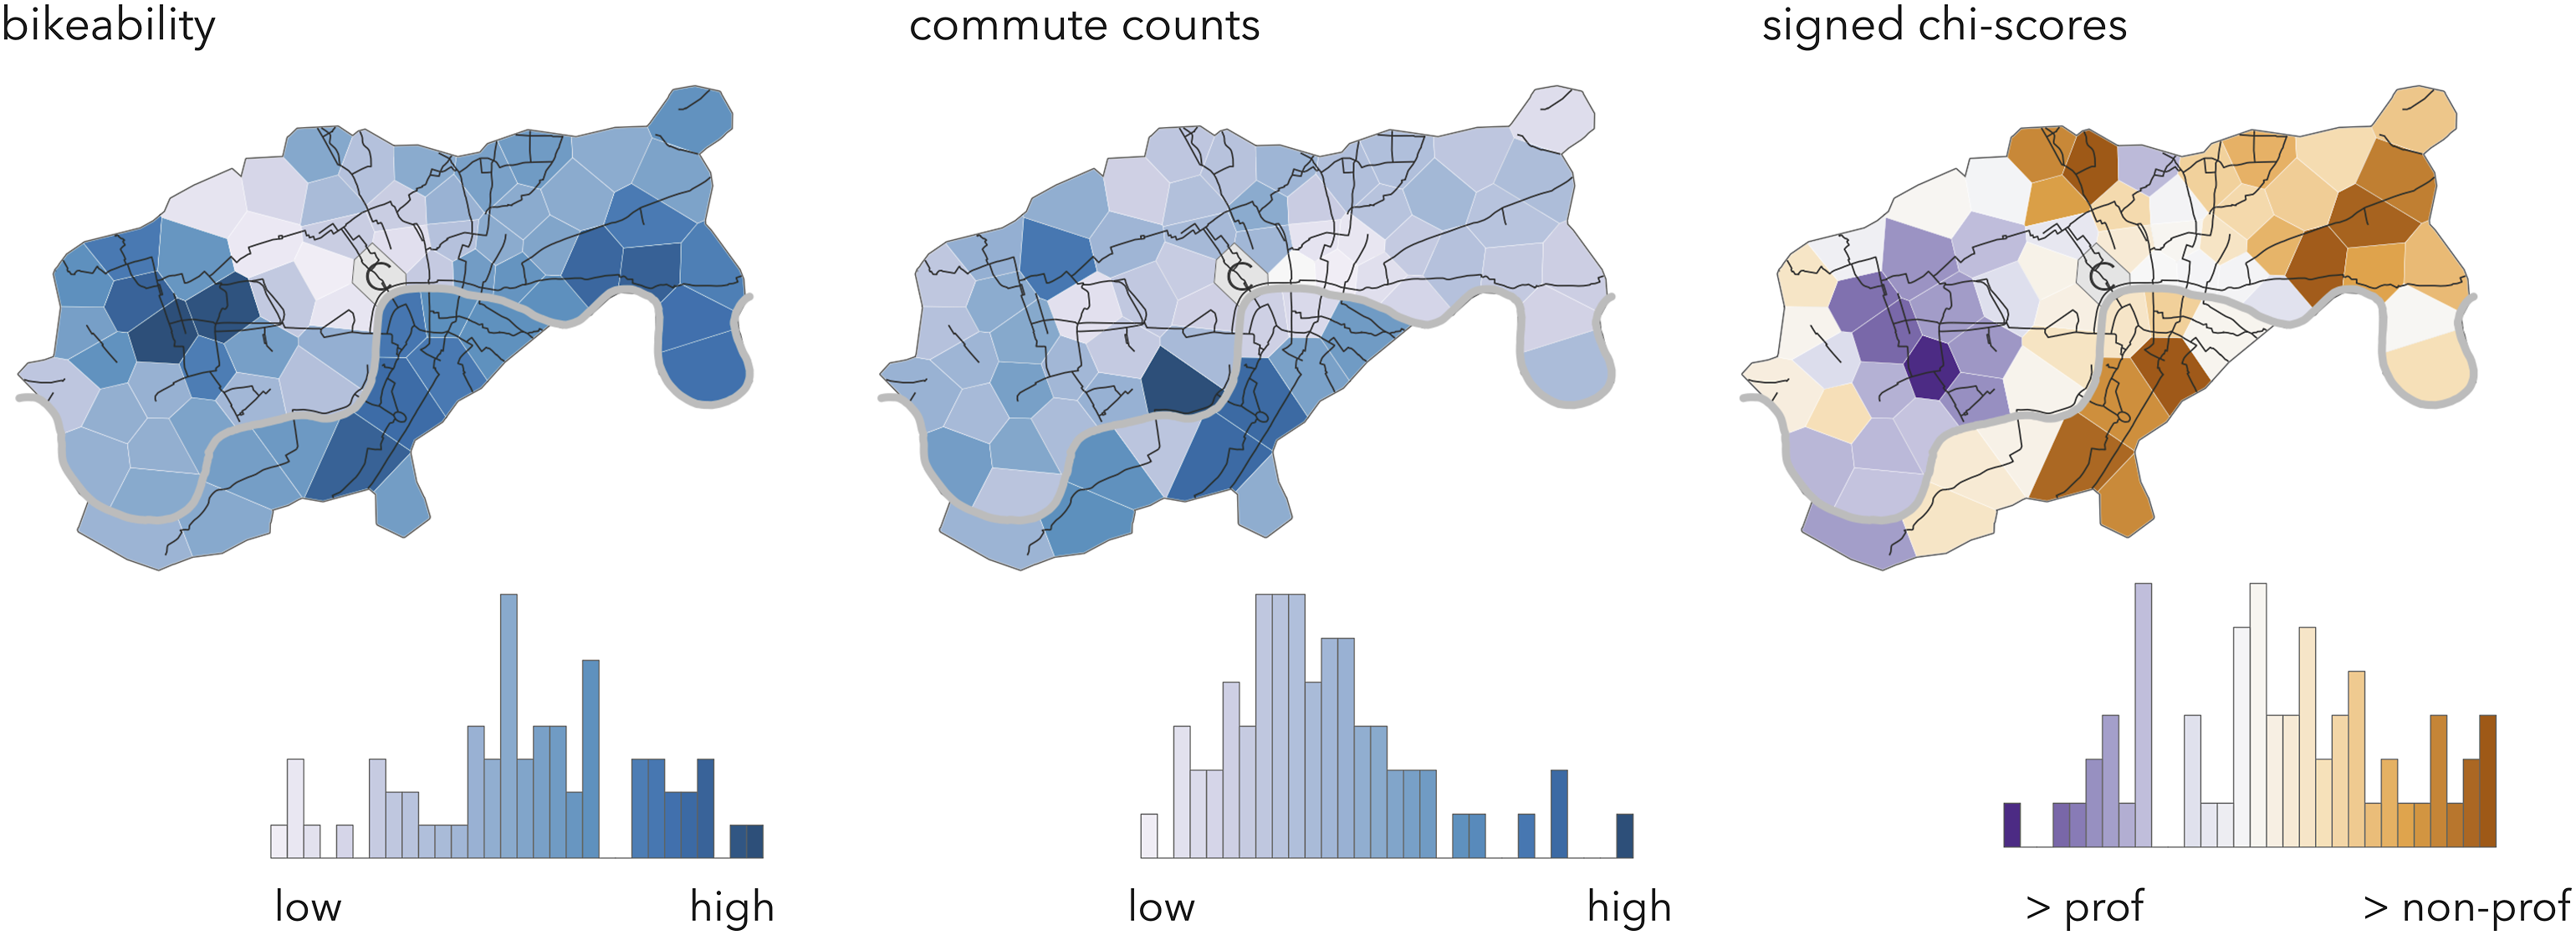
The maps of commute counts and signed chi-scores demonstrate a geography in the relative number of commutes into Strand/Covent Garden by occupation, with non-professional workers overrepresented amongst commutes from villages to the east (Mile End, Whitechapel, Wapping) and south (Kennington/Vauxhall, Brixton, Stockwell), whilst professional workers are overrepresented from certain villages in west London (Putney/Wandsworth, Fulham, Kensington, Marylebone). Eyeballing the three graphics, there does appear to be some association between OD bikeability and commute counts, with London’s strategic cycle infrastructure supporting routes from bikeshare villages containing relatively high numbers of commuters working in non-professional occupations. This is supported by linear associations between OD bikeability and OD commute counts for non-professional and professional workers (r.0.16 and r.0.07, respectively).
Discussion
The motivation behind connected bikeability was to ask whether different parts of London are better connected by bike than others. As with most measures of bikeability, our index can be used to evaluate infrastructure provision, identify gaps and prioritise locations for planning intervention. More uniquely, it emphasises the bikeability between places – paired locations – and in relation to meaningful trips that are made by London’s residents. A key finding is that, consistent with the stated ambition of recent infrastructure interventions (GLA 2015), higher levels of connected bikeability are conferred to OD pairs of strategic importance. The geography of connected bikeability appears to map to the commuting needs of London’s workers. That our measure of connected bikeability has a positive association with observed cycling also provides partial evidence of its ecological validity. Several features of our connected bikeability index and framework for analysis are worthy of discussion, offering both critique and new directions for bikeability research.
Consistent with the existing bikeability literature, the four components comprising the index – Comfort, Safety, Attractiveness, Coherence – make heavy use of variables measuring infrastructure provision. Context additional to this, for instance the more subjective ‘pleasantness’ of the urban environment, are not so easily captured. This might explain why parts of central and north London with dense road networks, and therefore which cannot easily accommodate dedicated cycle infrastructure, are given lower levels of connected bikeability. If roads in these areas are typically associated with lower average speeds of motorised traffic or other context that makes them pleasant for cycling, these lower bikeability scores might be questionable. A future activity may be to explore other less conventional datasets for capturing subjective context. An obvious additional dataset to include for estimating
When generating bikeability indexes, common practice is to make principled decisions around the inclusion of individual variables and relative weights by invoking existing literature. Where bikeability is estimated at the route level, we would also argue that detailed analysis of the structure and distribution of individual variables is necessary. Without careful attention to the geographic pattern (OD structure) of variables, for example, we might not have identified systematic biases that were introduced when normalising the count variables by linear route distance. Even when such biases are understood, there is rarely a non-problematic or canonical solution. When deploying bikeability indexes to answer specific transport planning problems, it may therefore be instructive to build flexibility into these sorts of indexes – implementing different component weights, weights within components and distance penalties depending on the analytical use case.
Finally, the spatial units and framework for analysis demonstrated in our work are useful contributions. Since the LCHS was designed deliberately alongside significant investments in London’s cycling infrastructure (GLA 2015), it provides a bounded geographic area for generating a representative set of routes for cycling. This, coupled with the ‘bikeshare villages’, which partition central London into meaningful locales (Soho, Chelsea, Clerkenwell, Southwark, Mile End), allow connected bikeability to be evaluated in detail and with respect to current infrastructure interventions.
Supplemental Material
Supplemental Material - Connected bikeability in London: Which localities are better connected by bike and does this matter?
Supplemental Material for Connected bikeability in London: Which localities are better connected by bike and does this matter? by Roger Beecham, Yuanxuan Yang. Caroline Tait, Robin Lovelace in Environment and Planning B: Urban Analytics and City Science
Footnotes
Declaration of conflicting interests
The author(s) declared no potential conflicts of interest with respect to the research, authorship, and/or publication of this article.
Funding
The author(s) disclosed receipt of the following financial support for the research, authorship, and/or publication of this article: Economic and Social Research Council; ES/P000401/1, ES/W004305/1.
Supplemental Material
Supplemental material for this article is available online.
Author biographies
References
Supplementary Material
Please find the following supplemental material available below.
For Open Access articles published under a Creative Commons License, all supplemental material carries the same license as the article it is associated with.
For non-Open Access articles published, all supplemental material carries a non-exclusive license, and permission requests for re-use of supplemental material or any part of supplemental material shall be sent directly to the copyright owner as specified in the copyright notice associated with the article.