
Abstract
To achieve a higher cycling uptake, it is essential for planners to know what kind of cycling infrastructure to plan and where, that is, through which types of urban environments. In this paper, we provide a deeper understanding of cycling demand and cycling route choices and infer insights into cyclists’ latent preferences and dispreferences concerning both infrastructure attributes and the spatial characteristics of route surroundings. Hereto, this study has collected, map-matched, geovisualized, and examined a unique GPS-based database with over 25,915 cycling trips in Oslo, Norway. Our findings reveal that cyclists substantially deviate from shortest paths, covering 59% more distance on average. Higher cycling frequencies, both in absolute terms and relative to shortest-path-expected-values, can be found on route sections that have some form of cycling infrastructure, especially those having segregated bicycle highways and bike roads. We also find higher demand and route choices for flatter and water-facing routes, as well as routes less disrupted by crossings and away from highway environments. In contrast, routes surrounded by green space or high population density, despite having high demand in absolute terms, are cycled less than expected based on shortest paths. The paper concludes by reflecting on the significance, limitations, and implications of our findings and novel methodological approaches for the bicycle route choice theory and practice moving forward.
Highlights
• Geovisualization and analysis of 25,915 GPS-tracked bicycle trips map-matched to a custom-built simplified bikeable road network. • Examination of cycling frequencies and route choices broken down into shortest path deviations at the route-section level. • Revealed bicycle routes are on average 59% longer than shortest paths. • Detours can be explained in terms of infrastructure and route surroundings qualities. • Detailed qualitative description of route choice principles on selected routes.
Introduction
To deliver more sustainable, accessible, inclusive, liveable, healthy, and space-efficient cities, policy-makers and urban planners around the world look increasingly at cycling as a critical solution to complement walking and public transport in an urban mobility transition that is less dependent on private automobility (e.g., Hagen and Rynning, 2021; Pucher and Buehler, 2017; Van Wee and Borjesson, 2015). Also, the city of Oslo, Norway, case study area in this paper, has set the ambitious goal of achieving a 25% mode share of cycling by 2025 up from today’s 6% level, as part of their municipal Climate Strategy (Oslo Municipality, 2020). To aid ambitious policymakers and planners in planning and adapting cities to facilitate the aspired mobility transitions, knowledge on how to most sensibly and effectively expand cycling infrastructures is urgently required. Cities that are investing in bicycle infrastructures are faced with multiple decisions not only on what type of cycling infrastructure facilities to build (e.g., bike lanes or segregated bike paths) but also on where to do so (e.g., which locations and which types of built environments) and where not.
Conventional transport studies and route choice modeling approaches are mainly based on economic theories and motorized transportation, where travelers seek to optimize economic utility and minimize individual travel times (Heinen et al., 2010; Van Duppen and Spierings, 2013; McLeod et al., 2020). Bicycling is different from motorized transport in many aspects. Not only is it a physical activity happening at lower speeds, commonly on two wheels and more vulnerable to any collision. It is also exposed to the surroundings in a more intimate way, where both the positive and the negative aspects are bodily experienced more intensely (Böcker et al., 2016; Stefansdottir, 2014; Spinney, 2009). Route choices of cyclists may therefore be expected to be influenced more by their surroundings and infrastructure qualities and less along the lines of time and cost efficiency than that of motorized mode users, requiring different logic and analytical approaches.
The current bicycle route choice literature faces several critical thematic shortcomings and methodological challenges. Thematically, the characteristics of cycling route choices in terms of infrastructure attributes and especially in terms of surrounding route environments are poorly understood. Methodologically, existing findings are largely based on stated preference surveys, small-sample qualitative studies, or heavily sample-biased GPS-based studies, as well as on statistical modeling approaches that inadequately address the details and complexity of bicycle route choices. To address the practitioners’ knowledge needs, thematic shortcomings, and methodological challenges stipulated above, this paper aims to provide a deeper understanding of cyclists’ route choices and to infer insights into their latent preferences and dispreferences with regard to infrastructure attributes and spatial characteristics of route surroundings. We do so by investigating cyclists’ revealed bicycle route frequencies, contrasting these to shortest paths, and characterizing chosen and avoided route sections in terms of (cycling) infrastructure attributes and spatial environments.
After describing the thematic shortcomings in the next literature review section, section 3 methodologically adopts and expands on a recent approach (McArthur and Hong, 2019), in which we compare and geovisualize deviations between revealed bicycle routes with that of shortest path alternatives at a route-section 1 instead of at a route-level, map-matched on a custom-built simplified street network. Hereto, we draw on 2017-data on 25,915 GPS-tracked bicycle trips by 873 participants in Oslo, Norway. In section 4, we provide the results of our multivariate analyses on the effects of infrastructure attributes (e.g., type or lack of cycling infrastructures, road traffic, and street designs) and spatial characteristics of route environments (e.g., topographies, land uses, and built densities) that explain these deviations. In addition, we contrast our approach with a statistical analysis of cycling route frequencies. We also qualitatively describe more- versus less-than-expectedly cycled routes and their principles. Finally, we reflect on this study’s limitations and shed light on its theoretical, methodological, and policy significance in the discussion and conclusion sections.
Literature review
Existing literature on this topic reveals that cyclists are willing to deliberately choose detour routes to optimize their safety and/or comfort provided by cycling facilities (e.g., Loftsgarden et al., 2015), even though it is generally understood that, at trip level, time and distance form important constraints for the choice of cycling as compared to motorized transport modes (Dill, 2009; Heinen et al., 2010). Revealed cycling route preference studies (e.g., Howard and Burns, 2001; Krizek et al., 2007; Winters et al., 2010a), including from Oslo, Norway (Hulleberg and Ævarsson, 2018), confirm that cyclists do take detours in the range of +8.3% to +67% of distances. Two categories of environmental attributes have been identified that could explain the preferences and dispreferences underlying such detours: (1) infrastructure attributes and (2) route surroundings.
Concerning road infrastructure attributes, 2 cyclists have been found to avoid arterial roads (Lu et al., 2018), avoid situations where they can get into conflict with other vehicles (Muhs and Clifton, 2016), and detour along local roads and/or routes with bicycle facilities (Hulleberg and Ævarsson, 2018). More specifically, studies find that cyclists prefer dedicated cycling facilities, especially those physically segregated from motorized traffic, or mixed traffic situations, but only in traffic-calmed streets with low vehicle-traffic volumes, lower speeds, and no car parking (Buehler and Dill, 2016; Muhs and Clifton, 2016; Stinson and Bhat, 2003, 2005; Winters and Teschke, 2010). Even though bike lanes offset some of the negative effects of adjacent traffic, calm streets with mixed traffic are preferred over bike lanes on major highly trafficked streets and roads with fewer lanes for motorized traffic (Dill, 2009). A range of studies highlights the importance of having to navigate fewer intersections and of network continuity, given that cyclists have negative perceptions of the sudden ending of facilities (Sener et al., 2009, Stinson and Bhat, 2003; Tilahun et al., 2007). Others find that flat routes and moderate hills were preferred over very steep hills (Menghini et al., 2010; Broach et al., 2012, Sener et al., 2009; Stinson and Bhat, 2003). One study also finds cyclist preferences for marked bikeways, regardless of whether they offer bicycle-specific infrastructure or not (Menghini et al., 2010). A good pavement condition is preferred for cycling route choices (Kang and Fricker, 2013, Stinson and Bhat, 2003). A forthcoming study highlights that the co-presence of public transport facilities along cycling routes negatively impacts cycling experiences (De Jong and Fyhri, 2023), but the potential effects of public transport facilities on revealed cycling route choices are currently understudied.
Concerning route surroundings, various qualitative cycling experience studies point out that factors such as greenness, and nearby traffic and noise levels affect the way cyclists feel and form an important part of the qualities or hindrances of travelling by bicycle (Gatersleben and Uzzell, 2007; Snizek et al., 2013; Skov-Petersen et al., 2018; Stefánsdóttir, 2014; Van Duppen and Spierings, 2013). Other studies show how route surroundings affect bicycle route choices and bicycle mode shares using stated preference techniques. A bike route preference survey finds that cyclists prefer green and aesthetically pleasing environments in inner urban areas and prefer to avoid environments with high levels of exhaust fumes and traffic congestion (Wahlgren and Schantz, 2011, 2012). A transport mode choice prediction study finds that route environmental factors such as hilliness, fewer highways and arterials, and a greater land-use mix increased cycling shares compared to other transport modes (Winters et al., 2010b). However, the effects of route environmental attributes such as population and workplace density, urban land uses, green/blue spaces, and highway surroundings on cyclists’ actual revealed route choices have been very little studied. Exceptions are the aforementioned findings on the effects of topography and arterial roads, and one notable study from Graz, which demonstrates a positive effect of land use diversity and a negative effect of the presence of shops and services on cycling route choice, drawing on recalled and measured route data of 278 cycling trips made by 113 unique cyclists (Krenn et al., 2014).
Research design
Methodological challenges in the bicycle route choice literature
Besides the thematic shortcomings of understudied explanatory factors described in the literature section, the current bicycle route choice literature faces two sets of methodological challenges. The first is related to data collection. Much of the current knowledge is based on travel surveys with stated preference techniques. Drawbacks of this data collection method are its limitations in giving spatial insights and the fact that it captures people’s reported intentions but not their actual choices. The qualitative studies mentioned in our literature review have given some useful insights into route navigating specificities but cannot be used in a generalizing way due to their limited scopes and sample sizes. Recently, quantitative studies have looked at the actual behavior and route choices of cyclists to capture origin, destination, route choice, and timing, initially with handheld GPS receivers (Fyhri et al., 2015; Pritchard, 2018; Sun and Mobasheri, 2017) and later with smartphone apps (Pritchard et al., 2019; Ton et al., 2018). Recent smartphone app developments have made it easier to expand such studies to larger groups of people, for example, through the use of exercising apps like Strava, but have also come with severe sample bias challenges (Pritchard, 2018).
Second, the statistical analyzing of bicycle route choices faces difficult methodological challenges and dilemmas. A common but a simplistic way to analyze the choice of bicycle routes is by examining the variation in bicycle frequencies across different routes (Griffin and Jiao, 2015; Hochmair et al., 2019). While giving useful insights into the variation in cycling demand at a city-regional level, the method is ill-suited to infer knowledge on cyclists’ latent preferences for routes and route environments, as it does not control for the differences in demand between origin–destination pairs. Routes with frequent use might be popular because of the many destinations available, not because of their network or built environmental characteristics. Another common approach taken by conventional discrete-choice based route choice modeling studies (Ben-Akiva et al., 1985) is that of comparing aggregated average values for certain spatial characteristics of facility types along chosen routes, with those of alternative, typically shortest or fastest routes (Larsen and El-Geneidy, 2011). However, important details on the spatial characteristics of specific street sections and urban environments that cyclists choose or avoid being lost in the aggregating process (e.g., by calculating the mean population density along a 5 km route). This aggregation from the segment/street level to the trip level raises the issue of “regression toward the mean.” (Chen et al., 2018) and suppresses insights into the spatial specificities of deviating sections. Moreover, studies often disregard that large parts of chosen and shortest routes overlap (Aultman-Hall et al., 1997).
Methodological approaches
To comply with these shortcomings, we adopt a new method proposed by McArthur and Hong (2019), which aggregates revealed GPS-tracked cycling frequencies on a route-section level 1 and subtracts from these expected cycling frequencies on the same route-sections based on shortest paths. 3 Earlier studies have compared observed versus shortest paths on aggregated bicycle trip levels (Broach et al., 2012). Our approach of aggregating on the route-section level instead of on the trip level gives more refined insights as to exactly where cyclists choose to diverge from the shortest paths. We expand on this approach by McArthur and Hong (2019), by not only geovisualizing shortest path deviations but also by multivariately analyzing the characteristics of infrastructures and route surrounding of the route-sections avoided or preferred. Hereto, we run various statistical models and sensitivity analyses (see §3.6) on a custom-built geospatial network, enriched with infrastructure and route surrounding attributes extracted from population, topographic, cadastral, and national road administration data (see Table S1 And S2 In The Supplementary Materials). Finally, we qualitatively describe in high detail three exemplary route deviations in our study area through the use of street-view imagery (See Figures 2, 3, and 4). The empirical analysis is based on a unique set of GPS-based data. To select bicycle trips, we make use of the app’s speed/motion-based mode detection algorithm, which according to the supplier has an accuracy of over 80%, with the cycling accuracy being higher, and has been found to have a higher accuracy than common travel diaries (Thomas et al., 2018).
Primary data were acquired from a survey amongst Norwegian residents in 2017 (N = 6185), focusing on cyclists’ route preferences, experiences, and background data.
Hereto, we collected and analyzed in total 25.915 chosen routes and contrast these with an equal amount of modeled shortest routes. The average trip length for bicycling trips is 4.39 km and in line with data from the National Travel Survey (NTS, 2019), which has an average of 4.1 km per trip. Yet for the same origin–destination pairs, the shortest routes would have been just 2.75 km on average, indicating that cyclists cycle on average an extra distance of 59%. For a more thorough description of this dataset, we refer to the Supplementary Materials.
Case study area
We choose the city of Oslo as our case study. Oslo is Norway’s capital city and has large ambitions and spent a significant effort in recent years to encourage more cycling. The city as a geographical unit had 1,000,500 inhabitants at the beginning of 2018, while the municipality of Oslo has about 675,000 inhabitants. For a further description, and a map of the urban region, we refer to the Supplementary Materials.
Multivariate statistical modeling techniques and qualitative descriptions of selected routes
To understand the environmental and infrastructure correlates of route sections with a higher likelihood of being chosen for cycling, we performed a linear regression analysis. After testing various types of models and model configurations,
4
the paper includes the following two final regression analyses: 1. An absolute cycling demand model, where the dependent variable is the number of observed bicycle trips per route section. 2. A cycling route choice relative to shortest-path model, where the dependent variable is the number of observed bicycle trips per route section relative to the number of expected bicycle trips if all had chosen shortest paths to reach their destinations from their origins.
The first model captures the spatial distribution of revealed demand for cycling across different parts of the study area. The second model shows something that approaches more cyclists’ route choice preferences. It normalizes the observed frequencies for the expected demand given people’s origins and destinations, basically showing where cyclists choose to cycle (even if it takes them a detour) and avoid cycling (even it could have saved them from covering extra distance). To calculate deviations, McArthur (McArthur and Hong, 2019) used an approach of subtracting observed route section bike counts from expected ones. A disadvantage of their approach is that similar outcomes can mean quite different things and vice versa, depending on cycling frequencies. For example, a route section with 0 observed bike trips compared to 25 expected yields a delta of −25. This is the same as for a route with an observed 1000 bike trips and an expected 1025 bike trips, even though the former route is categorically avoided by each cyclist in the vicinity, while the latter is relatively balanced in terms of being chosen or avoided. To deal with this issue, we have modified their approach by calculating an index of cycling route choice relative to shortest-path-demand (bikerel) as a function of approximately how many times higher the observed bicycle count (bikeobs) is, compared to the expected bicycle count (bikeexp), or vice versa (negative values), using the following formula:


For both models, we have used a filter where we excluded all street sections where no cyclist was observed or expected. To make sure that route sections weigh proportionally to the number cyclists that have chosen or avoided the routes, the bikerel regression is run with sampling weights (pweights in Stata) for bikeobs or bikeexp, whichever is highest. This also mitigates that low-frequency routes with potentially less accurate and more extreme bikerel values distort the model. Another measure to mitigate the latter is that we have capped and floored bikerel outliers that are more than 1.5 times above or below the interquartile range. In our final models, we have controlled for the spatial dependency of street segments that form part of continuous routes, by estimating robust clustered standard errors for all street segments that share identical street names (indicating that they are part of continuous routes), using Stata’s vce cluster command (Wooldridge, 2010).
To triangulate and complement our multivariate findings with real-world examples, we describe and illustrate qualitatively the route- and route-section-selection principles for three different types of typical route-deviations observed in the quantitative analyses. Hereby, we refer to the urban form and infrastructure variables in other parts of the paper (e.g., Supplementary Table S2), as well as to photos collected from Google Street View. We also discuss which spatial aspects may play roles that are not covered by our multivariate models, giving a complementary perspective on the complexity of bicycling route selection processes.
Results
Descriptive results
To understand the built environmental and infrastructure correlates of the demand and route choices for cycling, we created a map visualizing expected compared to chosen routes and a created linear regression model, followed by a qualitative description of individual routes. Hereto, we collected and analyzed in total 25.915 chosen routes, and contrast these with an equal amount of modeled shortest routes. The average trip length for bicycling trips is 4.39 km and in line with data from the National Travel Survey (NTS, 2019), which has an average of 4.1 km per trip. Yet for the same origin–destination pairs, the shortest routes would have been just 2.75 km on average, indicating that cyclists’ cycle on average an extra distance of 59%. This is in line with other studies, albeit being in the upper range (Howard and Burns, 2001, Hulleberg and Ævarsson, 2018; Krizek et al., 2007; Winters et al., 2010a). The fact that so many cyclists have the preference, or feel the need, to detour substantially from shortest paths affects the effectiveness, and possibly overall attractiveness, of cycling compared to other transport modes.
Figure S1 (Supplementary Materials) presents a map of the cycling route frequencies across the city of Oslo, giving valuable information on the spatial distribution of the bicycle demand. However, the map does not necessarily give us information on which routes, or parts of the city, cyclists avoid or are attracted to. Therefore, Figure 1 shows a map of the city with the cycling route frequencies relative to expected counts should all cycle the shortest paths. The thickness of the lines indicates the observed cycling volume (on preferred routes) or expected cycling volume (on avoided routes), while the colors indicate the relative cycling preferences. Routes that are cycled more often than expected compared to shortest routes (preferred routes) are shown with green lines, while the orange and red lines show routes with a dispreference (avoided routes). Spatial distribution of the latent preferences and dispreferences, relative to shortest-path-expected-values (line color) and absolute frequencies (line thickness).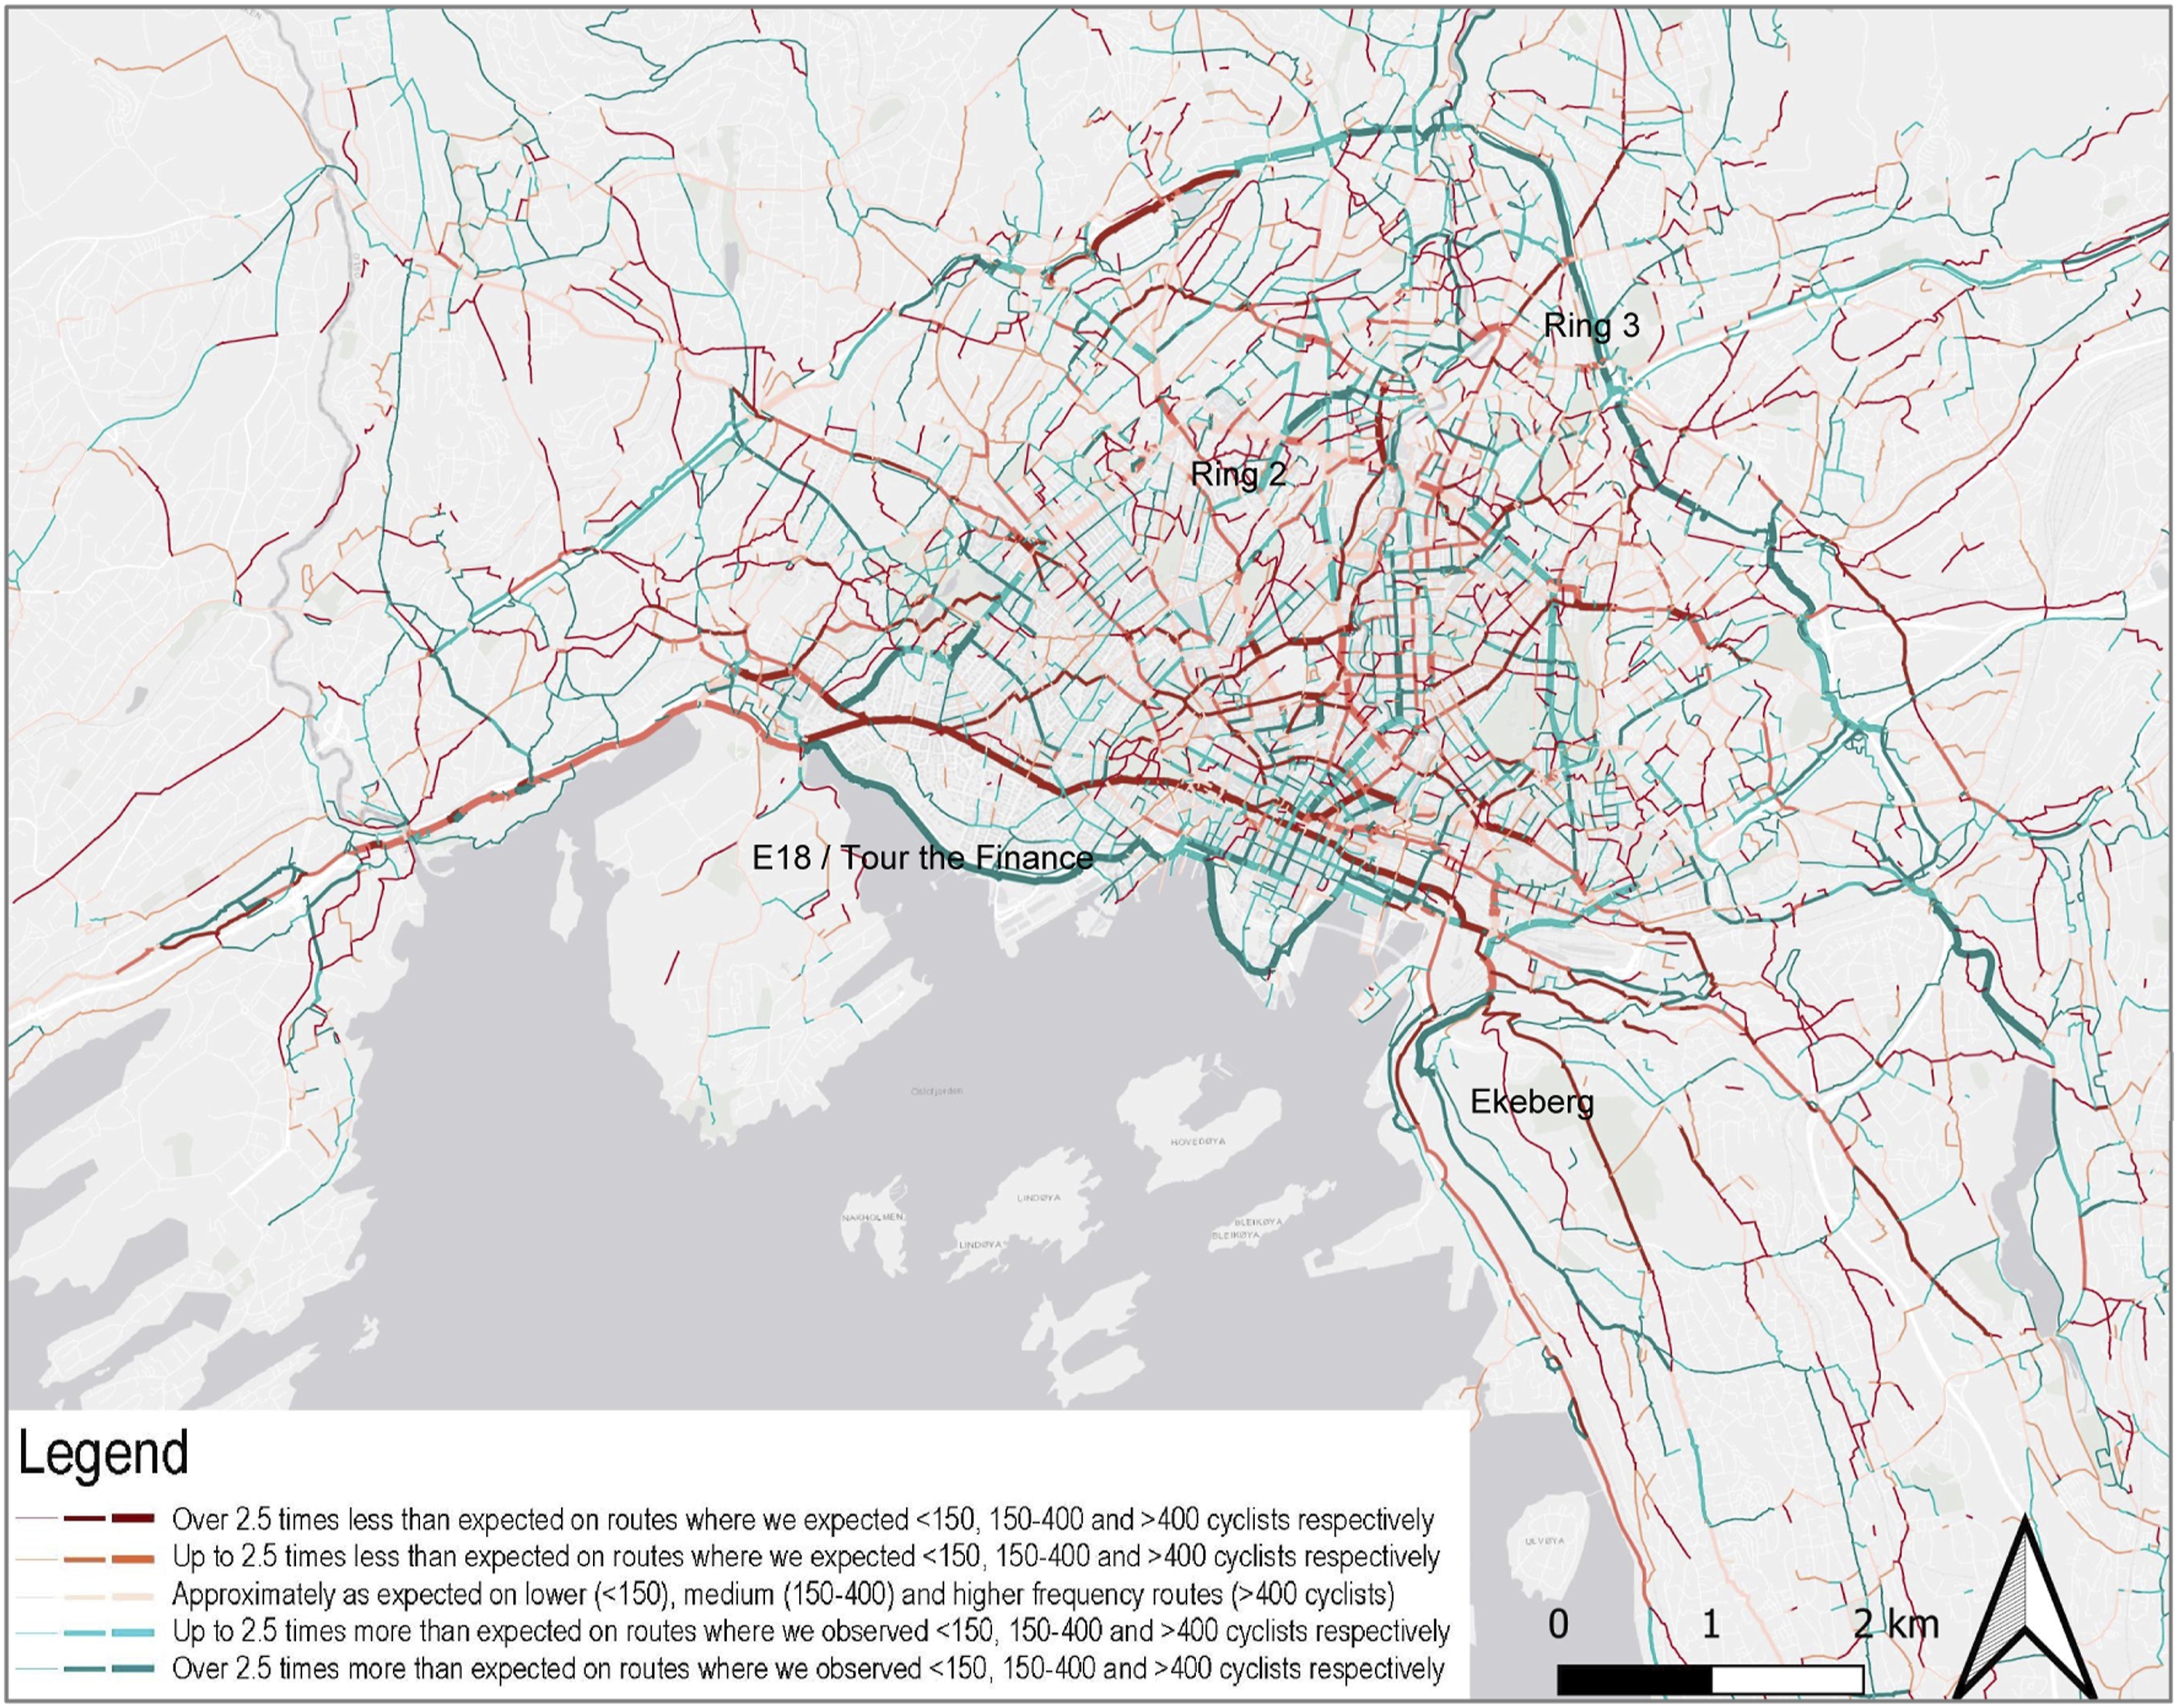
From Figure 1, we can see how green routes show a current level of cycling activity, in the form of actual route choices, above expected values. Prominent examples of routes with higher cycling volumes than expected can be seen along Oslo’s ring roads, in particular ring 3, which often comes as a detour, yet delivers important qualities such as segregated bicycle infrastructure, easy wayfinding, fewer disruptions like crossings, and a relatively flat topography compared to alternative shorter routes that track down into the city and back up again. Also, Oslo’s ring 2 offers higher than expected cycling counts on parts of its sections, by providing a relatively direct and easily navigable route, with bike lanes and clear signage now in place, on most of its sections. Other sections, typically with high annual average daily traffic (AADT), despite having similar advantages, are attracting no more cyclists than expected based on shortest paths. This finding aligns with earlier research showing how unsegregated bike lanes do not fully mitigate disadvantages like high speed and the high number of cars (Dill, 2009).
Another prominent example of a preferred route is the main road along the fjord, E18/tour the finance. While often being a substantial detour, this route delivers a scenic ride, segregated cycling infrastructure, a flat topography, easy wayfinding, and relatively few interruptions like crossings, as compared to alternative shorter routes crosscutting the inner city. In contrast, the shorter inland inner-city east–west alternative to this fjord-bound route is colored deep red, which can probably be attributed to heavy car traffic, the presence of the main shopping street with many pedestrians, a swath of disruptions from crossings to public transport nodes, and various sections without segregated, if any, cycling infrastructure. Other routes we see less used are steep routes, for example, from the city center straight up to Ekeberg, or poorly navigable and heavily disrupted urban routes with many changes of direction. A more detailed qualitative characterization of some of these and other exemplary chosen or avoided routes is provided in section 3.3.
Multivariate results
To understand the environmental and infrastructure correlates of the demand and route choices for cycling, we performed the following two linear regression models: - An absolute cycling demand model. - A cycling route choice relative to a shortest-path model.
Linear regression models: 1. Cycling demand model. 2. Relative cycling route choice model - explaining observed cyclist frequencies against those expected had all chosen to cycle shortest paths.
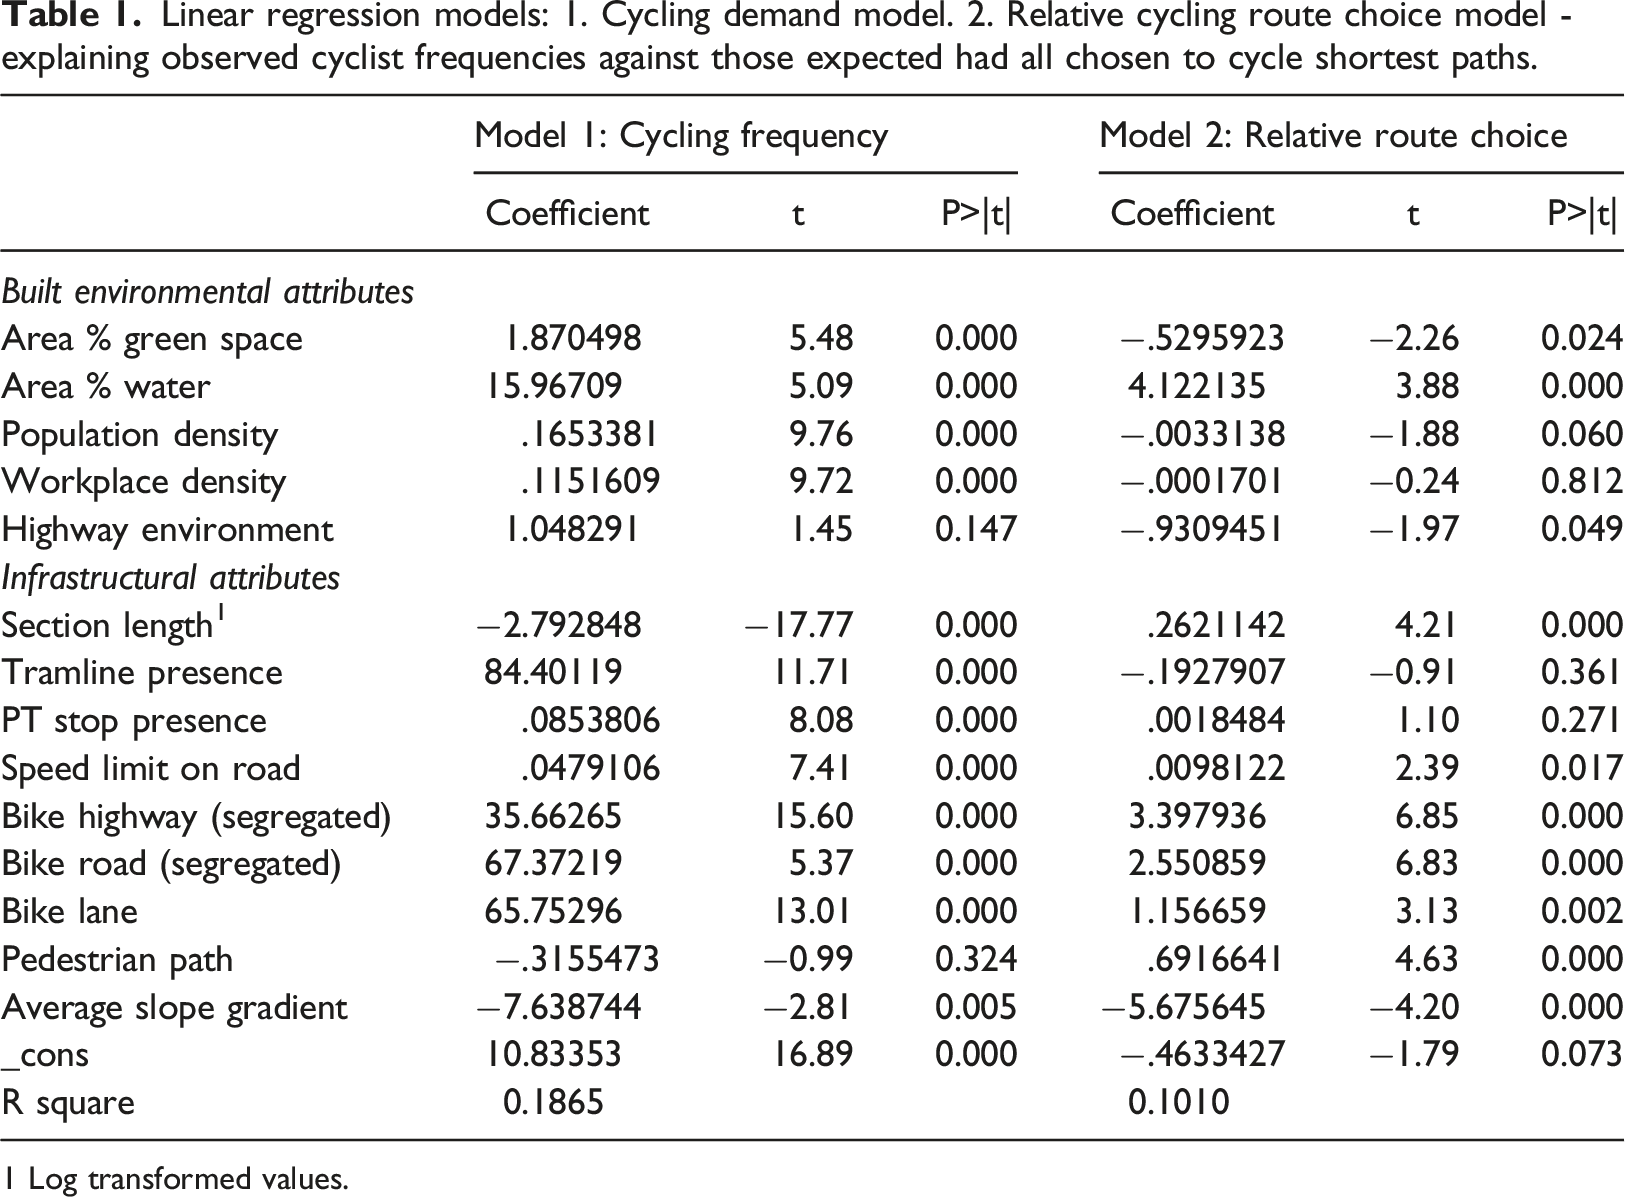
1 Log transformed values.
Model 1 demonstrates a strong relationship between built environmental attributes and cycling. Cycling demand is higher on routes in the most urbanized parts of the study region surrounded by higher population and workplace density, as well as on routes surrounded by green areas and water bodies. When it comes to infrastructure attributes, cycling demand appears to be highest on routes with bike highways, bike lanes or bike roads, along roads with higher speed limits (typically arterial or other important roads), on routes with a presence of tramlines and public transport stops, on routes with a flatter topography, and along routes with shorter contiguous sections (one of the most significant variables in the model), which in essence means more crossings. It is thus typically the busiest and densest of urban areas and route sections where cycling demand is highest, which raises the question to what extent this has to do with cycling attractiveness and preferences, or if it is more a reflection of the general cycling or mobility demand at the origins and destinations connected by such routes.
To answer this question, we estimate a second model of cycling route frequencies relative to expected counts should all cycle shortest paths. When looked at this model on relative route choices for cycling, the overall significance of built environmental variables has dropped compared to the cycling demand model. Moreover, the direction of effect of most variables has also reversed. It appears that relative cycling preferences are no longer for the busiest and most urbanized routes: workplace density no longer has a significant effect, whilst the presence of highway environments now has a negative effect. Somewhat surprisingly, the effect of green spaces has also turned negative, but this could possibly be explained by the poorer surface conditions and wayfinding difficulties on routes through vegetated areas and parks. In line with the previous cycling demand model, as well as our descriptive observations in Figure S4, water presence still exerts a positive effect on cycling route choices.
Of the infrastructure attributes, it is the cycling facilities that are most dominant in the model. Bicycle highways, bicycle roads, bike lanes, and combined pedestrian cycling paths, all have a positive influence on route choice and in that order of significance. However, cycle lanes that were one of the most influential factors in the cycling demand model (unsurprising given their presence on busy inner-city roads with limited space), while better than no cycling infrastructure, are actually preferred quite a bit less than the segregated bicycle infrastructures when looked at it in terms of relative route choices. Gradient slope (flatter routes are preferred) and section length also have a strong effect, but the direction of the latter is now reversed compared to the cycling demand model. Longer rather than shorter section lengths are thus preferred, indicative of less disrupted routes where it is easier to keep momentum while cycling. Routes with a presence of public transport stops and tram lines are neither preferred nor avoided. With regard to tram lines, its effect seems ambiguous where its presence can be useful for navigating the city, but also a safety concern when it comes to the possibility to get stuck and fall.
Qualitative description of individual routes
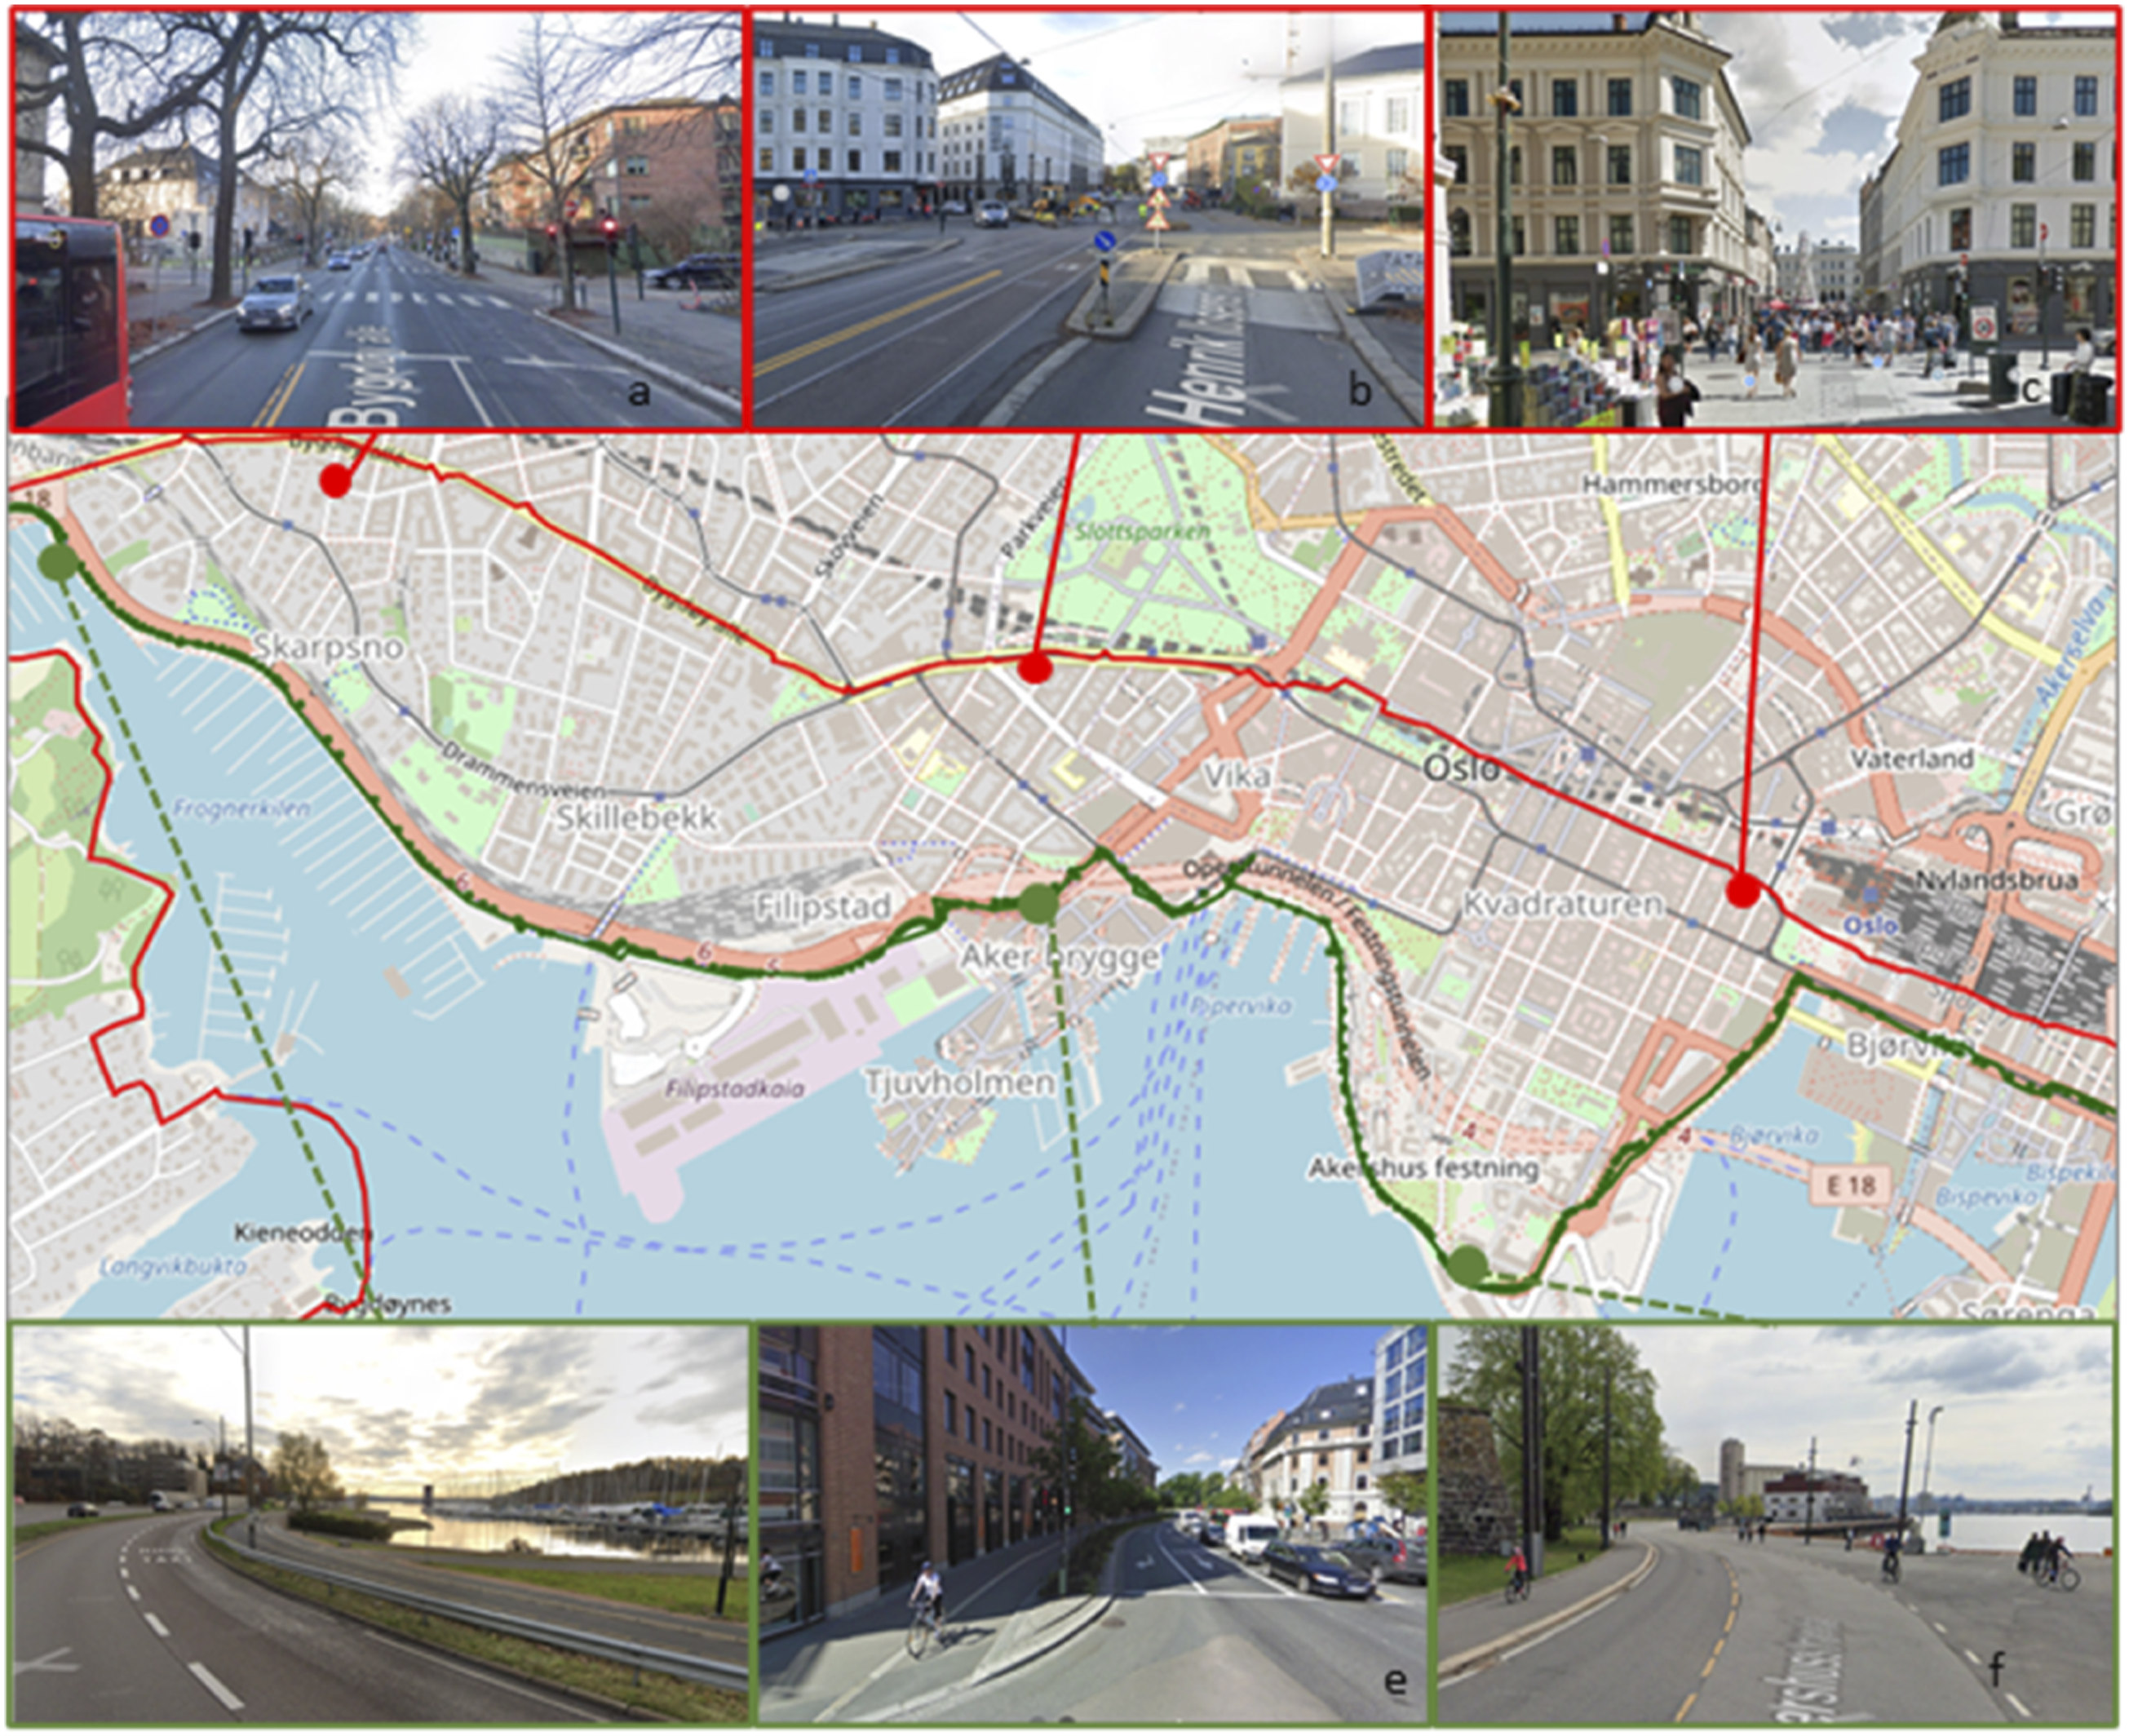
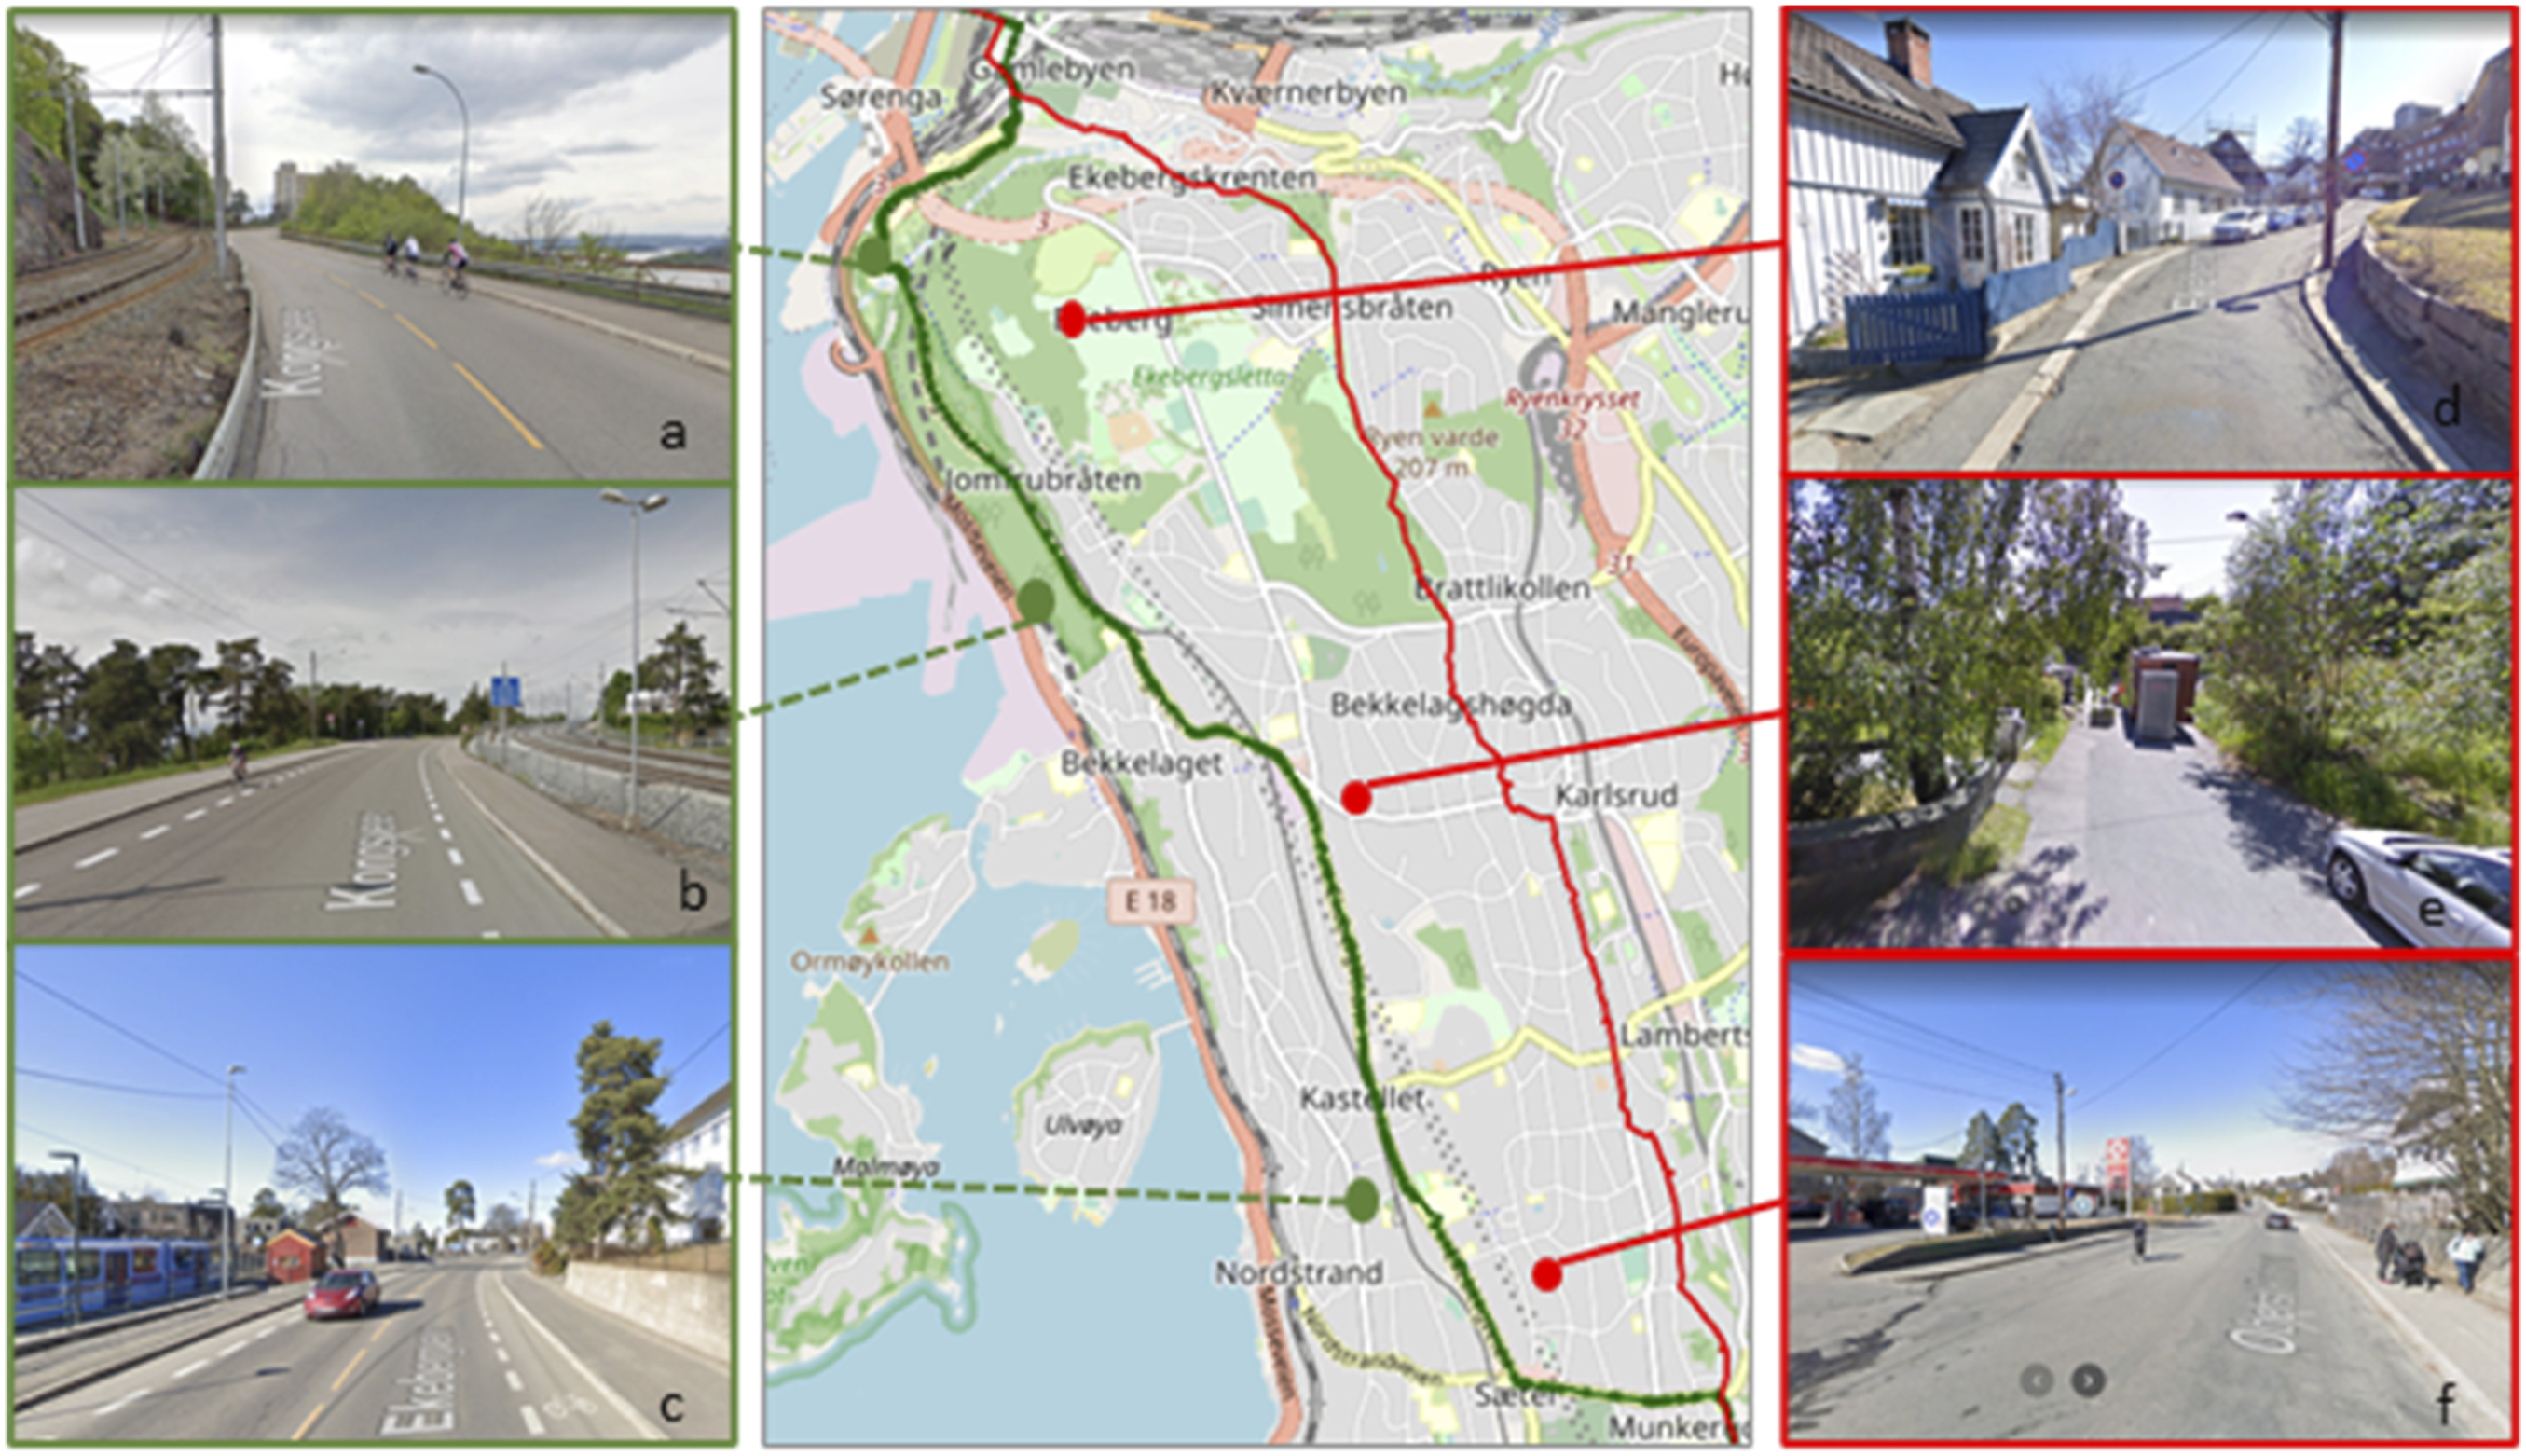
Three different route descriptions qualitatively explore route choices which are representative of our earlier results. The routes A, B, and C, (See Figures 2, 3, and 4) show individual cyclist’s examples of some of the (dis)preferences discussed in 3.1 and tested in 3.2, such as avoiding slopes, green areas, interrupted routes, and instead choosing easy-to-follow less disrupted routes with bicycling infrastructure and water structures in their proximity. The figures present routing and Google Street View imagery that detail the settings of chosen routes (marked by green lines) versus that of avoided shortest paths between the same origins and destinations (marked by red lines). We removed the start and the ending of routes for privacy reasons. Revealed versus shortest route A—avoidance of a park. Street View images from: (Google, 2022) Revealed versus shortest route B—a waterfront detour. Street View from: (Google, 2022) Revealed versus shortest route C—avoiding steep slopes and poorly navigable narrow streets. Street View from: (Google, 2022)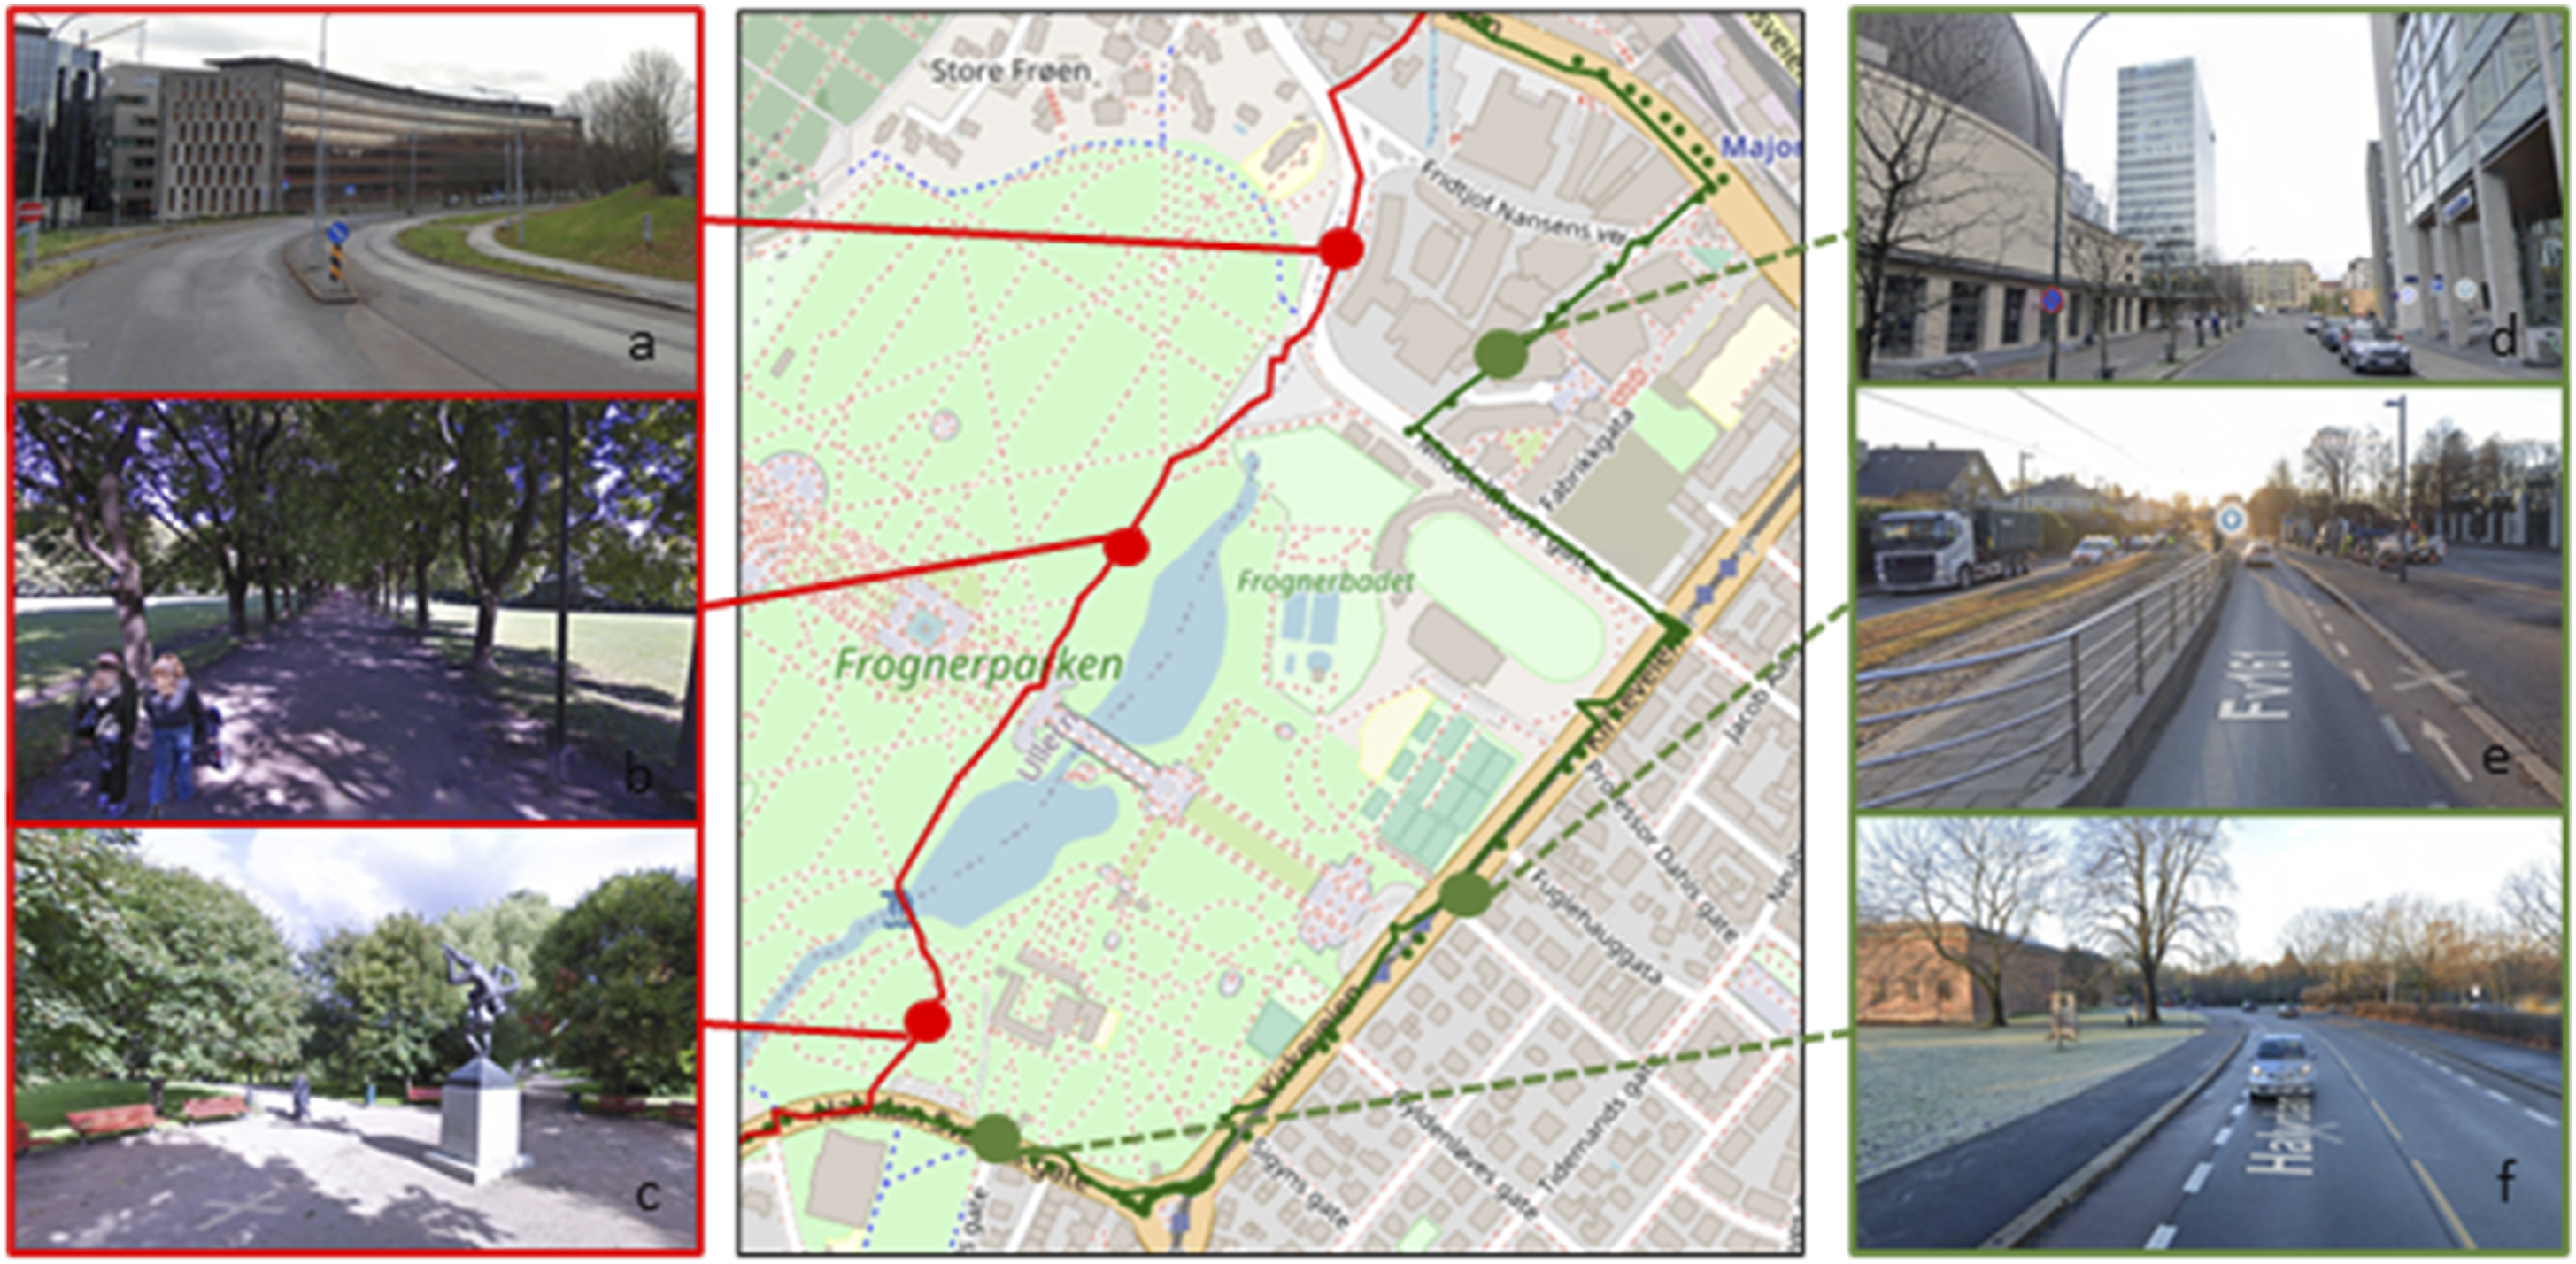
Route A (Figure 2) shows that the shortest path leads through a large public park area and offers green and blue surroundings, as well as non-asphalted roads and pedestrian areas (Figure 2(b) and (c)). The respondent chose instead for a longer route around the park, following asphalted roads, largely with bike lanes (Figure 2 (d) to (f)). A park could have offered visually attractive green and blue environments. On the other hand, uneven road surfaces like gravel roads can contribute to dirty clothes, and heavier and more uncomfortable cycling. Another deterring aspect is that it could be more difficult to orient oneself in green environments, especially when it is dark. Especially in interaction with darkness, the social safety aspect, the fear of becoming the victim of a crime, could also play a role. Moreover, in daytime the park is in addition very touristic and populated with people walking dogs, have a walk, or a having picnic, all of which could mean that the route could be the shortest, but not the fastest at all times of the day. The route chosen by the respondent instead provides, on the contrary, relative safety and comfort with a bike lane on an asphalted road. Wayfinding is easy since the main road along a park is followed.
Route B (Figure 3) illustrates an example where a shortest path would have led through a 19th-century urban neighborhood, following a radial road, toward the city center, with a busy shopping district and a variety of establishments along the route. The route has some bike lanes in place, but also many crossings, busy public transport facilities like bus stops and tramlines (Figure 3(a) and (b)), and Oslo’s busiest shopping street Karl Johans gate (Figure 3(c)), where cyclists have to constrain their speed or even walk to adapt to pedestrians during the daytime. The route chosen by the respondent instead leads to a route commonly called “Tour de Finance,” because of the many cyclists cycling from the westside of the city to the financial district in the center. The route leads along the fjord, is partly bundled with highway E18, and provides separated dedicated cycling infrastructure and few intersections (Figure 3(d)). It continues with separated infrastructure through a part of the city (Figure 3(e)), back to the fjord, along the harbor, with a sea view (Figure 3(f)), partly with a shared space solution or with a bike lane in place along Oslo’s opera house and through the recently built waterfront Bjørvika district. There can be several reasons for choosing the chosen route compared to the shortest route. In our multivariate analyses, we have seen that cyclists avoid intersections and prefer separate cycling infrastructure. These aspects make a route safer, more comfortable, and less physically demanding to bicycle. Moreover, the chosen route along the fjord is easy to find and follow, and the view of the water is seen as attractive by many. These positive aspects seem to weigh up against the disadvantage that parts of this route are bundled with the busy E18 highway, its noise, and air pollution.
Route C (Figure 4) shows an example where a respondent has chosen a route that follows a main urban road leading from the Oslo center up onto a hill called Ekeberg, offering a scenic view over the Oslo fjord along the way (Figure 4(a)). The route continues to follow the main road along a park area (Figure 4(b)), gradually gaining height up toward 100 m above sea level. Most of the route has a bike lane present and runs are parallel to a tramline (Figure 4(b) and (c)). The shortest route that this respondent avoided, in contrast, gains height even faster through an area called Ekeberg “skrenten,” or Ekeberg “cliff/slope,” when translated. This route would have followed a steep winding residential road, with a gradient of about 15 degrees, and continues through a residential area and along a park on the top of the plateau. These streets, whilst benefitting from not having a high amount of daily traffic, are on the downside also very narrow and difficult to navigate with street parking, a complete lack of bicycle-specific infrastructure, and hairpin-style changes of direction several times (Figure 4(a) to (c)). The shortest route contains a street section where it is likely that not all cyclists are physically able to cycle here. In the regression model, we see that the steepness of an intersection has a strong influence on the route choice. The chosen route seems therefore mainly based on choosing a route more gradually up than the alternative; a very steep winding road.
The three route examples illustrated in this section support our findings from the regression analysis, revealing that both infrastructure attributes and spatial built environmental surroundings matter. The examples also show the importance of spatial dependency. The choice for entire routes may hinge on the selection or avoidance of some specific segment or segments, as illustrated by the example of a section that is too steep or unsafe that the continuation of that route will be influenced. The route choices and their alternatives as visualized for trips A, B, and C show that wayfinding principles (Lynch, 1960) affect most likely how cyclists navigate through space, following paths and edges, and using landmarks to orient themselves. These principles can also coincide with existing marked bike routes, public transport routes, and ongoing main routes for motorized transport. These wayfinding aspects are not directly accounted for in the multivariate analyses but will be drawn upon in our interpretations and discussions.
Discussion
We find that the demand for cycling, with the cycling route frequencies, is higher in more urbanized parts of the city with high population-, employment-, intersection-, and public-transport-stop-densities; on flat terrain; along green and blue infrastructures; and on routes that offer bike highways, bike roads, and bike lanes. Whilst in alignment with existing research (e.g., (Broach et al., 2012)) and delivering useful insights into urban-regional variation in cycling demand, we argue that these findings are not that useful for understanding cyclists’ route choices and latent route or route-section (dis)preferences. The reason for people to cycle on these routes may largely be a reflection of the higher demand for cycling at the origins and destinations that these routes connect.
In contrast, when looking at cycling route frequencies relative to expected counts should all cycle shortest paths, it appears that routes with more urban traits are not necessarily the most attractive alternatives. Job and public transport densities have no significant effects on route choices, whilst highway environments have a negative effect. Routes through green spaces are also cycled less than expected, possibly due to poorer pavement qualities or way-finding difficulties. With these findings we shed new light on the relationship between built environments and cycling route choices, contrasting for example with Chen and others (Chen et al., 2018) who recommend cycling routes surrounded by parks, mixed-use, and denser urban development. These different outcomes could be due to methodological differences as we also have seen when contrasting relative cycling route choices with cycling frequencies. Another reason could be that the attractiveness of certain spaces does not always outweigh the possible negative effects related to these spaces, which the studies have not controlled for. For example, while the greenness of routes could be attractive in itself, there could also be reverse causal effects at play (Mumford and Anjum, 2010) like reduced social safety, worse road qualities, or way-finding difficulties that influence cycling route choice in the opposite direction.
On other areas, our findings are more in alignment with previous studies (e.g., (Broach et al., 2012; Chen et al., 2018). Congruent to these studies, we find higher than expected cycling frequencies on flatter routes, undisrupted routes, routes along water structures, and most importantly, routes that have dedicated cycling facilities. We find clear evidence that bike highways and bike roads (both being segregated from road traffic and pedestrians) are most preferred, whilst bike lanes and mixed bicycle-pedestrian paths are at least somewhat preferred over route sections that lack cycling facilities altogether. Unlike other studies, we have also studied the influence of public transport stops on route choices, inspired by results from a parallel study on route experiences that showed relationships between public transport presence and negative cycling experiences (De Jong and Fyhri, 2023). Whilst we observe a positive correlation between the presence of public transport facilities and cycling demand, we found no significant relationship with route choices. It might that such transport nodes are indeed negatively experienced, but simply impossible or difficult to avoid due to that origins or destinations are situated near transport nodes.
Our findings provide strong support for the continuous investment into dedicated cycling infrastructures, with clearly observed preferences for segregated bike highways and bike roads. Our research also underlines the importance of strategic cycle route planning, delivering insights not only into what infrastructures to build but also where to do so. Our finding that cyclists avoid steep slopes on cycling routes, as well as highway environments and routes through green areas, reveals that cyclists may face constraints concerning their physical capabilities (e.g., to cycle up steep slopes), health and sensory overload (e.g., noise and air pollution in highway environments), make assessments concerning their safety (a lack of eyes on the street, at least in evenings or at night in parks or highway areas), or well-being (discomfort of certain types of surfaces, stretches, and crossings). Cycling is an embodied experience where both route surroundings and infrastructures affect cyclists' experiences. Land uses, such as green, water, highway surroundings, but also the presence of cycling infrastructure or the steepness of a slope, are aspects that influence the experience of comfort, social safety and traffic safety.
This study draws on relatively novel data collection and methodological techniques, but as such also contains several limitations that need to be addressed in further research. First, the GPS data and map matching techniques in this study are subjected to measurement and network errors, which, while reasonably contained in this study, have room for improvement with technological advancements. Second, by contrasting revealed route choices against shortest-path analyses, we may not capture the full breadth of route alternatives that cyclists could have chosen. Future studies may want to also evaluate route choices concerning the fastest routes or routes with the least effort and classify the type of routes that are chosen, both at the level of route sections and the level of entire routes. Third, the influence of way-finding aspects, or how easily navigable spaces are, may be included in future research by controlling for way-finding aspects using, for example, space syntax. Fourth, the GPS data collected in this study represent mainly experienced cyclists’ choices and may not be representative of less regular cyclists, as well as non-cyclists. In part, we have accounted for this by running sensitivity analyses based on the number of unique users instead of trip frequencies (revealing that differences between both methods are limited), but further research may want to further explore these issues, for example, by providing segmented bike route choice analyses experienced, non-experienced, frequent,and non-frequent cyclists. A related fifth point of attention is that differences for other user groups like risk-averse cyclists, women, younger cyclists, or people cycling with kids are to be expected as well. Analysis of the route choices for different socioeconomic user groups is encouraged in future research. The role of trip purpose for bicycle route choice is another recommendation to include in further research.
Finally, the consequences of the cyclists taking detours routes are not known either. Both quantitative and qualitative studies are needed on cyclists’ subjective valuations of route choices and detours, as well as on the attractiveness of cycling route alternatives on the use of alternative transport modes and the significance this bears for the attractiveness and competitiveness of cycling as a whole.
Conclusion
Policy-makers and urban planners around the world look increasingly at cycling as a key element in sustainable mobility transitions, facing important questions as to what cycling infrastructure investments to pursue but also where to plan them. This paper contributes to a deeper understanding of cyclists’ route-section selection behaviors and makes three important contributions to bicycle route choice literature. First, we provide novel data collection, drawing on GPS-tracked Oslo cycling data (n = 25,915 trips by 873 cyclists) collected with a mode-detecting smartphone app (Sense.Dat), and map-matched on a custom-built simplified street network. This dataset includes all types of bicycle trips, while the network contains quality-controlled spatial data. Second, we advance an analytical framework to capture cyclists' route section selection and avoidance behaviors, which controls for and exposes the differences with analyses based on general cycling demand. Third, by doing so, we expand current insights on the role of infrastructure qualities on bicycle route choices and provide important new insights into the understudied significance of route environments. Our findings indicate revealed cycling route preferences for segregated cycling infrastructures and undisrupted, flat, water-facing but not necessarily green-facing routes. This is important for urban planning praxis, where the strategic planning of the location of bicycling routes gains importance, just as building the preferred bicycling infrastructure.
Supplemental Material
Supplemental Material—Road infrastructures, spatial surroundings, and the demand and route choices for cycling: Evidence from a GPS-based mode detection study from Oslo, Norway
Supplemental Material for Road infrastructures, spatial surroundings, and the demand and route choices for cycling: Evidence from a GPS-based mode detection study from Oslo, Norway, by Tineke de Jong, Lars Böcker and Christian Weber in Environment and Planning B: Urban Analytics and City Science.
Footnotes
Acknowledgments
The authors acknowledge the help for building the simplified and enriched road network in GIS by Elling Oftedal and the data support from Espen Johnsson, as well as Harpa Stefansdottir, Petter Næss, Aslak Fyhri, and Anne Grethe for their valuable comments during the writing process.
Declaration of conflicting interests
The author(s) declared no potential conflicts of interest with respect to the research, authorship, and/or publication of this article.
Funding
The author(s) disclosed receipt of the following financial support for the research, authorship, and/or publication of this article: Research for this work was funded by the Energi-X funding scheme of the Research Council of Norway (NFR) (No. 255628/E20).
Supplemental material
Supplement material for this article is available in online.
Notes
References
Supplementary Material
Please find the following supplemental material available below.
For Open Access articles published under a Creative Commons License, all supplemental material carries the same license as the article it is associated with.
For non-Open Access articles published, all supplemental material carries a non-exclusive license, and permission requests for re-use of supplemental material or any part of supplemental material shall be sent directly to the copyright owner as specified in the copyright notice associated with the article.