
Abstract
High-quality and consistent cycling infrastructure data are needed to advance research into equity and safety and for planning active transportation. With recent growth in cycling and investments in cycling infrastructure, there are concerns that these investments have not been equitable across communities. There is no consistent and complete national dataset for cycling infrastructure in Canada. Our goal is to develop a national cycling infrastructure dataset by (1) classifying OpenStreetMap (OSM) using the Canadian Bikeway Comfort and Safety Classification System (Can-BICS) as consistent criteria and categorisation for comfort class and infrastructure type; (2) performing a site-specific accuracy assessment by comparing the classification with more than 2000 reference points from a stratified random sample in 15 cities; and (3) presenting summary results from the national dataset. Based on reference data collected in 15 test cities, the classification had an estimated accuracy of 76 ± 3% for presence or absence of infrastructure, 71 ± 4% for comfort class and 69 ± 4% (by length) for infrastructure type. High comfort infrastructure was slightly underestimated (since bike paths were sometimes confused with multi-use paths) and low comfort infrastructure was slightly overestimated. Nationally, we identified 22,992 km of cycling infrastructure meeting Can-BICS standards and 48,953 km of non-conforming infrastructure. Multi-use paths are the most common infrastructure type by length (16.6%), followed by painted bike lanes (11.0%), and then high comfort infrastructure (cycle tracks, local street bikeways and bike paths) (4.3%). There was a wider range in access to cycling infrastructure in small cities than in medium and large cities. To reduce repeated effort assembling data and increase reproducible active transportation research, we encourage contribution to OSM.
Keywords
Introduction
As a low-cost, healthy and environmentally friendly mode of travel, cycling has the potential to help cities move towards being more sustainable, healthier and equitable places. For these reasons, cities across Canada are increasingly prioritising efforts to make cycling a safer, convenient and more enjoyable mode of travel for both utilitarian and recreational trips. Many cities are making multi-million-dollar investments in cycling infrastructure. At the same time, cycling is the fastest growing mode of transportation in Canada, with nearly 12% of people cycling as their primary mode of travel to work in some cities (Statistics Canada, 2017). However, this growth has not been equitable across communities and it is important to understand the spatial inequalities in cycling investments and infrastructure (Lam, 2022). In order to monitor progress, develop best practices and assess impacts of investments in cycling infrastructure across cities, it is vital to have consistent data across the country on cycling infrastructure. However, Canada lacks a national dataset of cycling infrastructure that is up-to-date and built with consistent, detailed and meaningful attributes. These data are essential to build capacity for healthy cities research (Tam, 2017). The time required to assemble and maintain a harmonised dataset hampers national surveillance efforts in the domains of active transportation and equity.
While cycling infrastructure data are available in many jurisdictions, inconsistent categorisation and level of investment in data varies widely between cities (Winters et al., 2020). Many cities make their cycling infrastructure data publicly available through open data initiatives; however, there are no standard naming conventions for cycling infrastructure and meta data on how data are collected and compiled is often unclear. In a review of open data from 45 Canadian municipalities, Winters et al. (2020) found more than 100 different terms used to describe cycling infrastructure and designed the Canadian Bikeway Comfort and Safety Classification System (Can-BICS) to align infrastructure labels in open data with engineering guides and cycling safety research. Further, there are wide differences in data quality, in terms of completeness, timeliness and consistency of attributes.
New methods using OpenStreetMap (OSM) provide an opportunity to create consistent national datasets on cycling infrastructure. OSM provides a common base map across boundaries, and the open-source licensing supports a wide range of both commercial- and research-related uses. Projects using OSM data often also contribute to the data, in particular commercial endeavours increasingly employ data editors (Anderson et al., 2019). An increasing number of influential active transportation studies make use of OSM data (Heesch and Langdon, 2016; Lovelace et al., 2017). Previous work by Ferster et al. (2020) showed concordance in the total length of cycling infrastructure was high between open data and OSM for six large- and mid-sized Canadian cities, indicating there is potential to further develop this approach to develop a national dataset.
Our goal with the work described in this manuscript is to develop a national cycling infrastructure dataset using open data sources and Can-BICS route definitions. This dataset will provide the necessary foundation for future spatial analyses such as examining the socio-spatial equity of existing cycling infrastructure in communities across Canada. Our objectives are to (1) classify OSM data to Can-BICS definitions using attributes and geographic relationships; (2) complete a site-specific accuracy assessment using street-level imagery in 15 cities across Canada; and (3) provide summary results for the national dataset. For the site-specific accuracy assessment, we collected a reference dataset using street-level imagery, aerial imagery, and other supporting data and estimated classification accuracy, measured and described bias, and discussed misclassifications and potential for improvement.
Background
National cycling datasets
National datasets are vital to provide generalisable research on active transportation. For example, Buehler and Pucher’s foundational study on active transportation research in North America (2012) analysed open data from 90 of the 100 largest American cities in 2008, classified as on-street lanes and off-street paths, and found that cities with more bikeways had significantly higher cycling commute rates. The dataset they analysed was assembled from multiple cities by the American League of Bicyclists, a public advocacy organisation, following a contributory model of public participation in scientific research. However, this type of data collection and analysis has not been repeated, despite rapid growth in North American commuter cycling rates (Pucher and Buehler, 2017) and an emergent emphasis on mobility, transportation or spatial justice (Soja, 2010; Martens, 2016).
In response to a growing concern that investments in cycling infrastructure have not been equally distributed (Braun et al., 2019), authors have assembled large datasets of cycling infrastructure to evaluate equity in access to cycling infrastructure, often sampling a subset of cities to represent wider areas. For example, Braun et al. (2019) evaluated 22 out of the 25 most populous cities in the United States (those that had open data available or provided data through correspondence) by recoding attributes to identify on-street cycling infrastructure (painted bike lanes, buffered lanes and protected lanes). The authors found that lower socio-economic status residents had less access to cycling infrastructure. In another recent equity study, Ferenchak and Marshall (2021) evaluated the 15 American cities with the highest cycling mode share matched with comparison cities with similar populations and geographies (but lower cycling commute rates) and focused their analysis outside of the downtown core areas. The authors estimated installation dates through correspondence with city engineers and by referencing historic maps and imagery. They mapped sharrows (i.e. shared lanes on major roads indicated by paint markers), painted bike lanes, painted bike lanes with buffers, cycle tracks and off-street paths (shared and bike only) and found no significant association between infrastructure installations and changes in income or racial composition. Both of these studies highlighted the labour-intensive data assembly, and each used different cycling infrastructure definitions. To evaluate the spatial equity of bike share stations, Desjardins et al. (2022) used a routing tool supported by OSM data to evaluate walking distances to bike share stations and found that access for low-income populations can be improved. Including geographically diverse samples in these analyses begins to address the ‘spatial concentration of investment’ that has often been associated with active transportation planning (Stehlin, 2014).
Mapping bike infrastructure using OpenStreetMap
OSM is a crowdsourced or volunteer generated map of the world, drawing inspiration from open source and wiki approaches (OpenStreetMap Contributors, 2021). OSM had nearly eight million accounts, contributing to more than seven billion points and 800 million line features in 2021 (OpenStreetMap Stats, 2021). Features are attributed with open-ended tags, consisting of a key and a value (e.g. highway = cycleway); standard tagging practices (i.e. combinations of keys and values to identify features) are published in a wiki (https://wiki.openstreetmap.org/wiki/). The data are shared free of cost under the Open Data Commons Open Database Licence (ODbL) which provide flexibility for a wide variety of uses (‘you can download and use for ANY purpose you like’), provided the data source is attributed, and any changes are shared alike (https://wiki.osmfoundation.org/wiki/Licence).
OSM is widely used as a basemap and geographic data source for many services on the Internet, and cycling infrastructure is well represented. Tagging conventions are documented on wiki pages (OpenStreetMap Contributors, 2021), and the most forward facing representations of cycling data are renderings of the data that are used as basemaps for apps and webpages, such as such as Strava (https://www.strava.com/) and Facebook (https://www.facebook.com/). Two renderings of the data that highlight features for cycling are OpenCycleMap (http://www.opencyclemap.org/) and CyclOSM (https://www.cyclosm.org). These rendered raster basemaps are not available for analysis and processing in research, and they have not been quantitatively evaluated for accuracy, yet the widespread use on the broader Internet demonstrates the strong potential for research use.
OSM is increasingly used to support active transportation research. Hochmair et al. (2015) compared the 2008 open data from Buehler and Pucher (2012) with OSM in 2013 in 78 urbanised areas and found that trails on OSM were generally more complete than on-street lanes when compared to the reference dataset, and that OSM was being updated over the elapsed time period. Ferster et al. (2020) compared the concordance in total length between OSM and open data in six large- and mid-sized Canadian cities and found reasonable agreement. The Propensity to Cycle Tool uses OSM data for routing to prioritise the locations of new infrastructure based on demand measured in an origin destination survey (Lovelace et al., 2017). Another broad scale project using OSM data is the People for Bikes Bikeability Network Analysis (BNA, https://bna.peopleforbikes.org/). The People for Bikes BNA assigns scores based on level of traffic stress and the connectivity of low stress routes. Many other studies use OSM data to provide data or use data that is derived from OSM, such as Strava Metro (Heesch et al., 2016). However, the details of data processing, cleaning and attribution impact research outcomes, and these decisions and details are sometimes not provided in a way that is accessible for future research. Work is needed to standardise data processing, for example, using common infrastructure definitions that align with active transportation research, providing a solid foundation for future studies.
Open data and Canadian Bikeway Comfort and Safety Classification System (Can-BICS)
Winters et al. (2020) developed a common nomenclature for cycling infrastructure in Canada to further public health surveillance of active transportation environments. They developed categories by aligning engineering guides, municipal open data, and bike safety and preference research. Can-BICS is a three-tiered comfort scheme that includes five types of cycling infrastructure. The high comfort categories are low stress routes and include three facility types: bike paths that are separate from other modes of travel (including pedestrians) and at least 10 m from roadways; cycle tracks, which are physically separated from other travel modes, but parallel to roadways; and local street bikeways, which are shared with motor vehicles. These local street bikeways are defined as being along local streets (no centre line) and having traffic calming and diversion elements to limit vehicle speeds and volumes. Medium comfort infrastructure is medium to low stress routes and include multi-use paths with paved surfaces. Low comfort infrastructure includes high stress routes including painted bike lanes on the sides of busy roads. Other types of cycling infrastructure that does not confer all-ages and abilities, cycling are not included in Can-BICS definitions. Specific examples are lanes on major roads (sharrows) which do not offer safety benefits and are not preferred by the majority of people (Ferenchak and Marshall, 2016; Teschke et al., 2012), as well as unpaved multi-use trails, which have accessibility challenges and do not meet current national guidance (TAC, 2020).
To facilitate the use of OSM infrastructure data in active transportation research, this paper extends the work by Ferster et al., (2020) by adding more detailed cycling infrastructure type categories from Can-BICS, using more detailed reference data, completing a site-specific accuracy assessment, and evaluating accuracy in small cities (which are important for a national dataset). OSM is a global map, so it provides a single data source and common coding scheme for cycling infrastructure across municipal boundaries, making regional, national or potentially even broader investigations possible. Additionally, this paper introduces the OSM Can-BICS national dataset that will enable socio-spatial analyses to better understand the equity implications of existing cycling infrastructure.
Methods
Test cities and street data acquisition
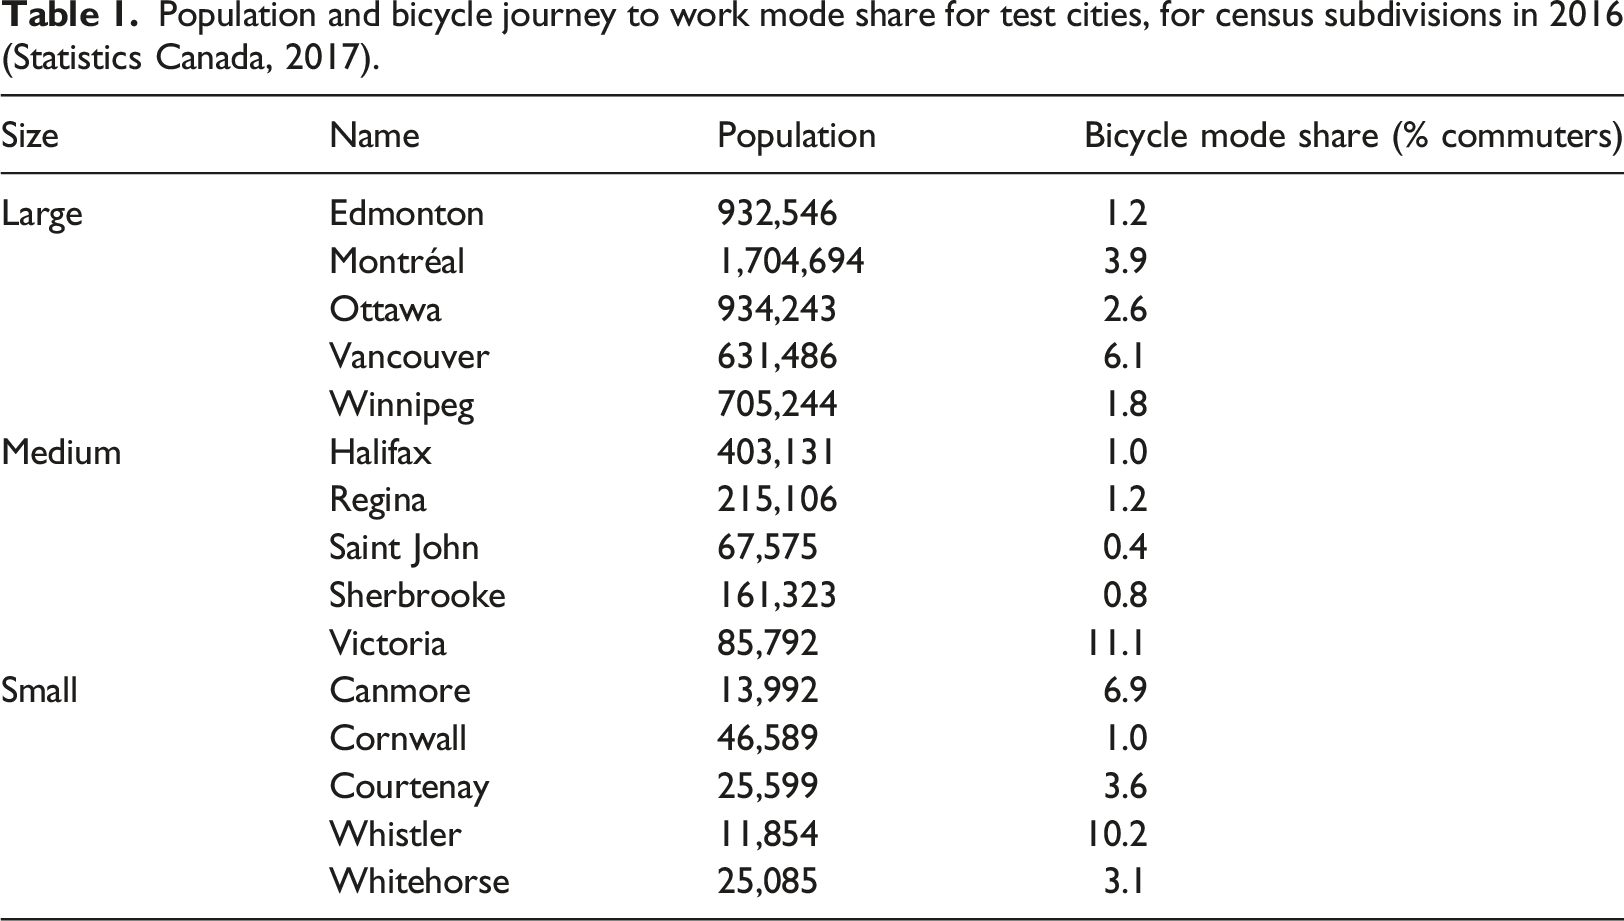
Population and bicycle journey to work mode share for test cities, for census subdivisions in 2016 (Statistics Canada, 2017).
Sample frame
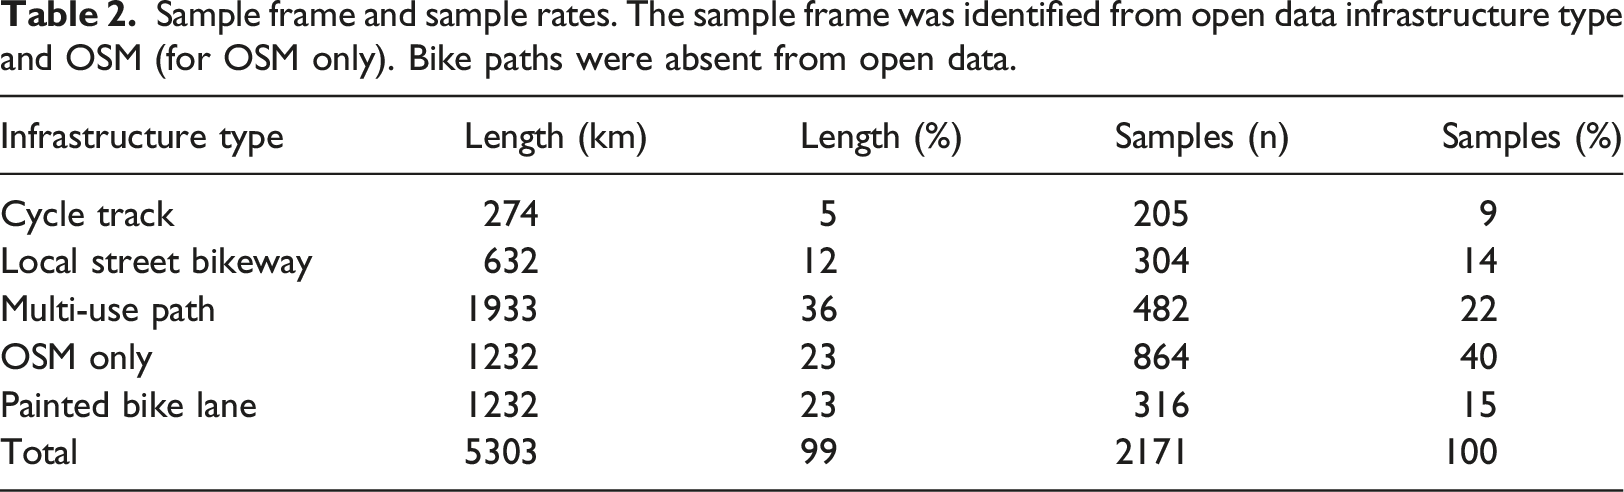
To develop queries to classify OSM data to Can-BICS definitions and evaluate the accuracy of our classification, we collected reference sample points. Since the vast majority of the streets and paths have no cycling infrastructure, we selected a sample frame where most cycling infrastructure is located to more efficiently allocate sampling effort. The sample frame covered 5303 km in the 15 test cities, consisting of all streets and paths where (a) a Can-BICS infrastructure was indicated in open data, or (b) where cycling was indicated on OSM (using the query OSM tag: cycleway = * OR OSM tag: highway = cycleway OR OSM tag: bicycle = (yes OR designated)). We selected this sample frame with the goal of measuring omission error (e.g. cycling infrastructure missing from OSM, but present in open data), commission error (e.g. cycling infrastructure mapped on OSM that does not meet Can-BICS standards), and to evaluate our classification of infrastructure type (e.g. our ability to assign the correct infrastructure type and comfort class).
Sample locations
Sample frame and sample rates. The sample frame was identified from open data infrastructure type and OSM (for OSM only). Bike paths were absent from open data.
Reference data for training and testing
Four raters collected reference data by visually interpreting ground-level imagery and aerial imagery from Google Maps. Where the infrastructure type was unclear or imagery was out-of-date, other corroborating data were used. For example, the raters referred to PDF maps provided by cities and cycling groups, city webpages and newspaper articles announcing new construction. We calculated the inter-rater reliability using 310 points (14% of the reference data) that were coded by all four raters. Raters had the option to mark sites for review, which were subsequently discussed as a group, and assigned revised values if needed (revisions were made after calculating the inter-rater reliability). These sample points were then assigned to the nearest OSM street segment for comparison with the reference data. The sample points were visually evaluated, and small manual adjustments in positioning were made where needed (e.g. where open data and OSM positioning differed, resulting in spatial joins to intersecting streets, for example).
Classification of OSM data to Can-BICS categories
We classified OSM data to Can-BICS categories using all populated tags (attributes) and data on the geographic context. In general, we used attributes as much as possible and geographic context as a proxy for missing tags. The attribute queries were based on Ferster et al. (2020), modified for Can-BICS definitions. We divided the queries into the smallest, independent logical statements without repetition for ease of editing and testing, and to make our assumptions and interpretation of OSM tags clear. Where tags were missing or ambiguous, we used ancillary data and geographic relationships. We applied this approach to improve our classification of multi-use paths, cycle tracks and local street bikeways. We describe the use of geographic context in the following paragraphs.
For multi-use paths, 35% of locations in the training sample data were missing OSM tag: surface, which indicates whether a path has a paved surface. Based on our observations collecting reference data, most paved multi-use paths were in areas with urban landcover, so we applied a 2015 landcover dataset from the Canadian Centre for Remote Sensing (Canada Centre for Remote Sensing, 2015; Latifovic et al., 2017) as a proxy for path surface. Within the reference training data that included OSM tag: surface, 95% of paved multi-use paths were within urban landcover. Intuitively, this makes sense from the perspective of a map reader, since a person might expect a path to be paved in the city (unless otherwise indicated), and a path in a natural area to be unpaved (unless otherwise indicated).
For cycle tracks and bike paths, we used a geometric operation to determine whether the path is next to a road. We considered a road adjacent if within a 15 m buffer of a path, there was more than 40 m or 50% of the segment length was a road. We tested every cycle track. If there is no road adjacent, we assigned it as a bike path. In OSM, there is no explicit way to tag if a path is next to road; it is indicated by geometry alone. Since many multi-use paths in small cities were tagged as cycle tracks (i.e. OSM tag highway:cycleway), we required that bike paths were explicitly tagged as separated from pedestrians, otherwise they were classified as multi-use paths.
For local street bikeways we identified traffic calming and diversion using attributes from OSM and geometric operations. Many bikeways consist of signs or paint only, and in general, speed limits, traffic calming and number of lanes attributes on OSM were incomplete and inconsistent. Our assignment was generous in that we would assign the local street bikeway label if there was any evidence of traffic calming or diversion. Our assignment was first based on attributes: (1) officially designated bikeway (part of a cycle network or OSM tag: bicycle = designated), and (2) local street with no centre line indicated by (a) the presence of confirmatory evidence of speed limits at or below 30 km/h, or traffic calming (OSM tag: traffic_calming = *), and (b) the lack of exclusionary evidence of speed limits greater than 30 km/h, two or more lanes, or OSM tag: highway = tertiary or higher. Where there was no evidence for (or against) the second condition (e.g. many residential roads lack detailed tags), we used geometric operations to identify traffic circles or traffic diversion. The algorithm to find traffic diversion searched for breaks in continuity for cars and trucks but not bicycles (i.e. a three-way or two-way intersection for motor vehicles that is a four-way intersection for cyclists).
We added an additional category for infrastructure that was indicated on OSM but does not meet Can-BICS standards, and label these here as ‘non-conforming’ infrastructure. We included these facilities because they may provide connectivity, provide recreation or indicate desire lines. We mapped three types of non-conforming infrastructure. Non-conforming trails are multi-use trails that do not meet Can-BICS paved surface requirements, are too narrow, or are pedestrian primary locations. Non-conforming major roads are bikeways without traffic calming or diversion. Finally, non-conforming ‘other’ types are places where cycling is indicated, but there is no sufficient evidence to assign it to one of the other categories (e.g. local streets with OSM tag:bicycle = yes).
Accuracy assessment
For the 15 test cities, we used the reference data to estimate accuracy for the Can-BICS predictions. We calculated accuracy statistics using an error matrix of the estimated percentage of total length of bike infrastructure classified in the correct Can-BICS category (e.g. presence/absence, comfort class and infrastructure type) using an approach adapted from Olofsson et al. (2014) and Olofsson et al. (2013). We estimated accuracy statistics overall and for the individual classes.
The estimated overall accuracy is the proportion of the network (by length) classified in the correct category. In the classification error matrix, it is the sum of proportions of lengths where the observed and predicted values match. We also calculated confidence intervals for the overall accuracy based on variability within the reference data. For comparison, we estimated overall accuracy for both the OSM classification and open data (the usual data source for active transportation studies).
For individual class accuracy, we calculated confidence intervals for the length estimates by category, sensitivity, specificity and estimated bias. These accuracy statistics are widely used in remote sensing classification and predictive modelling (Foody, 2009; Steyerberg et al., 2010). Confidence intervals quantify uncertainty based on variability in the reference data. The sensitivity is the estimated true positive rate, describing the ability of the classification to detect the presence of a class, which relates to omission errors in a class. The specificity is the estimated true negative rate, describing the ability of the classification to distinguish the correct category from other categories, which relates to commission errors in a class. Bias is systematic error where the predicted values differ from the reference values in a consistent direction and magnitude. We estimated bias using the ratio of mapped length to error-adjusted estimate (EAE) of lengths. The EAE adjusts the mapped proportions using measured bias in the frequency of misclassification in the randomly sampled reference data (Olofsson et al., 2013, 2014). Because the OSM classification was the focus of this manuscript, we only present the individual class accuracy statistics for OSM data (not open data).
To evaluate the face validity of the OSM Can-BICS dataset, we met with city planners and GIS staff in four of the test cities (Canmore, Victoria, Whitehorse and Winnipeg) and two additional cities (Calgary and Guelph). We introduced the project, viewed and discussed maps of the classified data, and compared with official data.
National dataset
To make estimates of the amount, comfort level and type of cycling infrastructure at the national level, we applied the classification to a national OSM dataset. For the national classification, OSM data were acquired from Geofabrik by province (http://download.geofabrik.de/north-america/canada.html) and combined to form a national dataset that can be updated over time (the results are presented here are from 16 August 2021). Similar to the 15 test cities, we reported summary statistics from within the 2016 Statistics Canada Census subdivision (CSD) digital boundary files in this paper (https://www12.statcan.gc.ca/census-recensement/2011/geo/bound-limit/bound-limit-2016-eng.cfm).
Results
Classification
The queries to classify OSM data to identify and measure cycling infrastructure in Canada using Can-BICS definitions are available on GitHub (https://doi.org/10.5281/zenodo.7465094). The full national cycling infrastructure dataset is available online (https://doi.org/10.5281/zenodo.7444398).
Accuracy assessment
Within the reference data collected in the 15 test cities, we calculated an overall inter-rater reliability of 84%. The raters flagged 397 low confidence sites and met to discuss these sites as a group and make final designations (the inter-rater reliability was calculated before making any changes). High confidence sites (not marked for review) had an inter-rater reliability of 92%. There were differences in inter-reliability across cycling infrastructure type: painted bike lanes had the highest inter-rater reliability at 96%, followed by multi-use paths at 83%, cycle tracks at 81%, OSM only at 79% and local street bikeways at 79%.
We used reference data in 15 test cities to evaluate the overall accuracy of the OSM classification. The estimated accuracy for presence or absence was 76 ± 3%. The estimated accuracy by comfort class (i.e. high, medium and low comfort) was 71 ± 4%. The estimated overall accuracy for cycling infrastructure type was 69 ± 4%. For comparison, we calculated the overall accuracy for open data because it is the usual standard in active transportation studies. For open data, the estimated accuracy for presence absence was 72 ± 4%, 66 ± 4% for comfort class and 64 ± 4% for infrastructure type. For all categories, the confidence intervals for accuracy assessment overlapped between OSM Can-BICS and Can-BICS classified from open data.
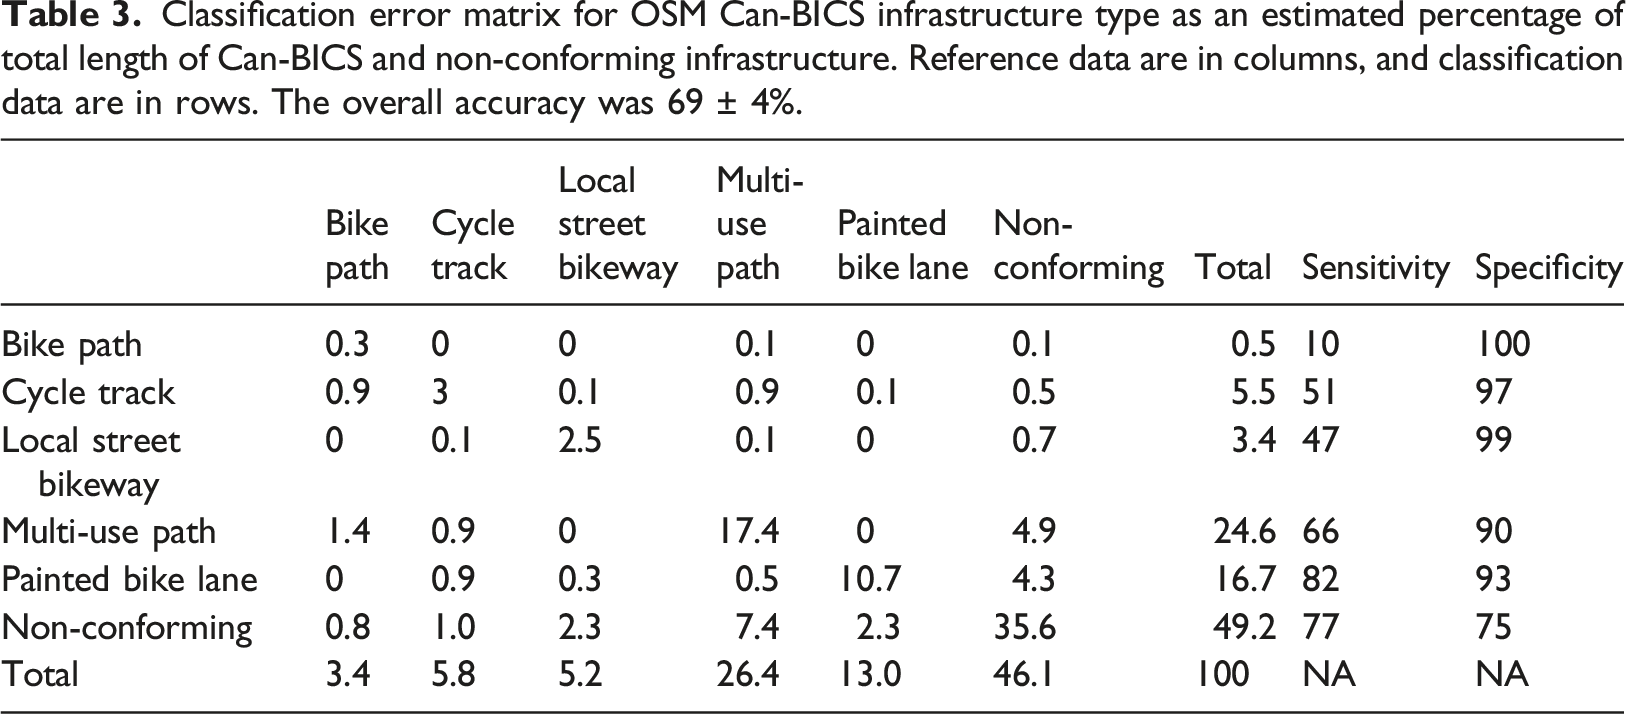
Classification error matrix for OSM Can-BICS infrastructure type as an estimated percentage of total length of Can-BICS and non-conforming infrastructure. Reference data are in columns, and classification data are in rows. The overall accuracy was 69 ± 4%.
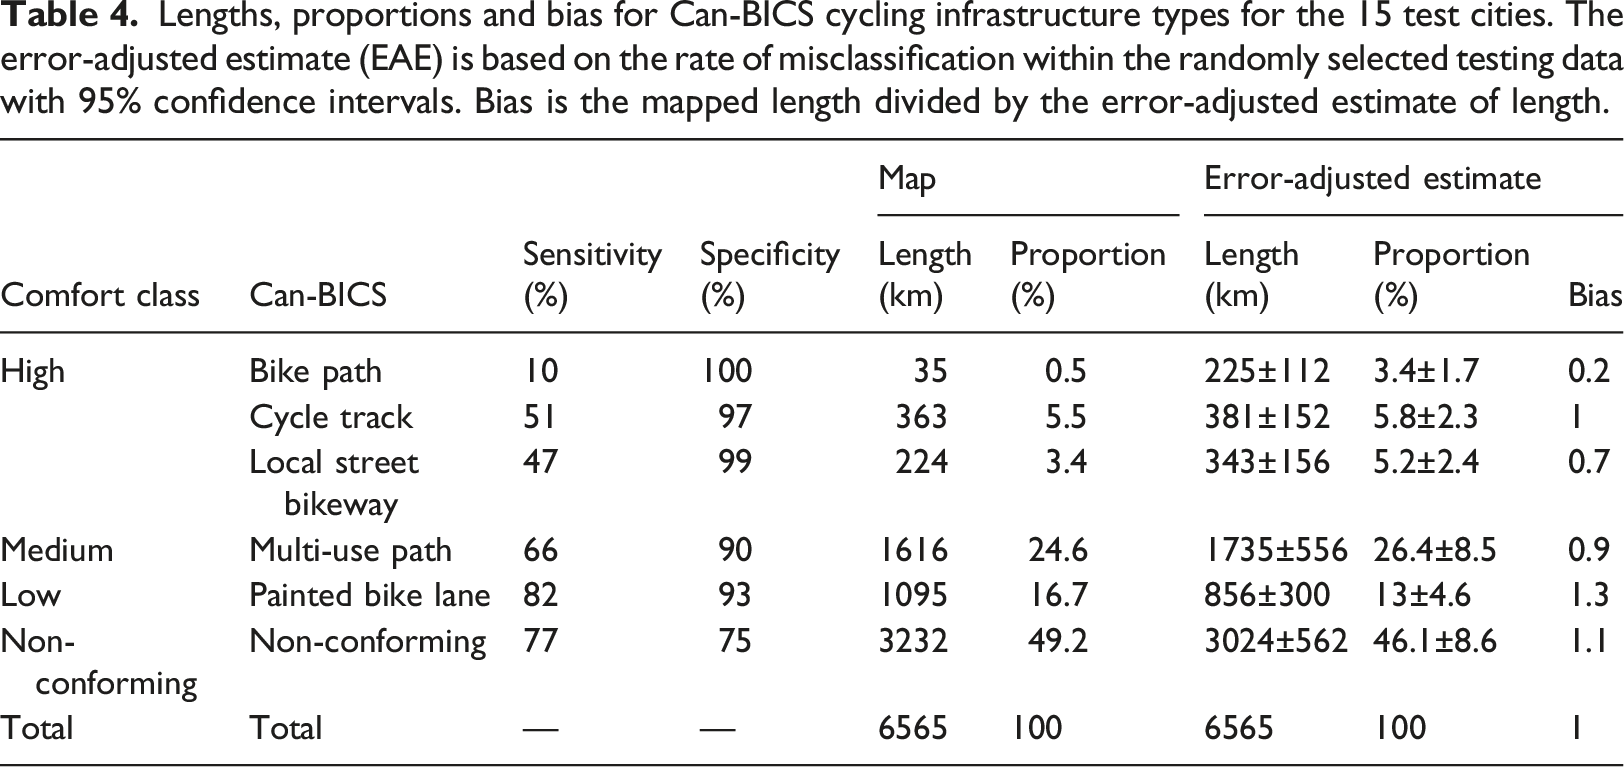
Lengths, proportions and bias for Can-BICS cycling infrastructure types for the 15 test cities. The error-adjusted estimate (EAE) is based on the rate of misclassification within the randomly selected testing data with 95% confidence intervals. Bias is the mapped length divided by the error-adjusted estimate of length.
Summary results for the national dataset
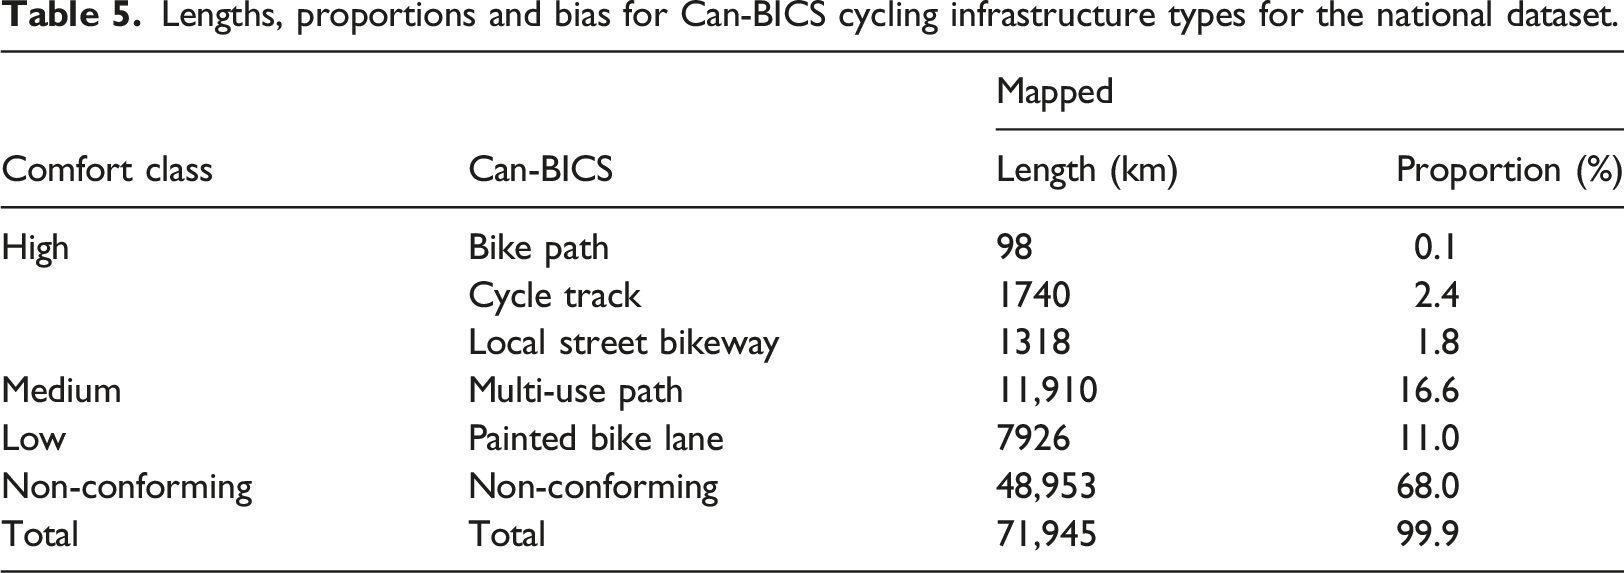
Lengths, proportions and bias for Can-BICS cycling infrastructure types for the national dataset.
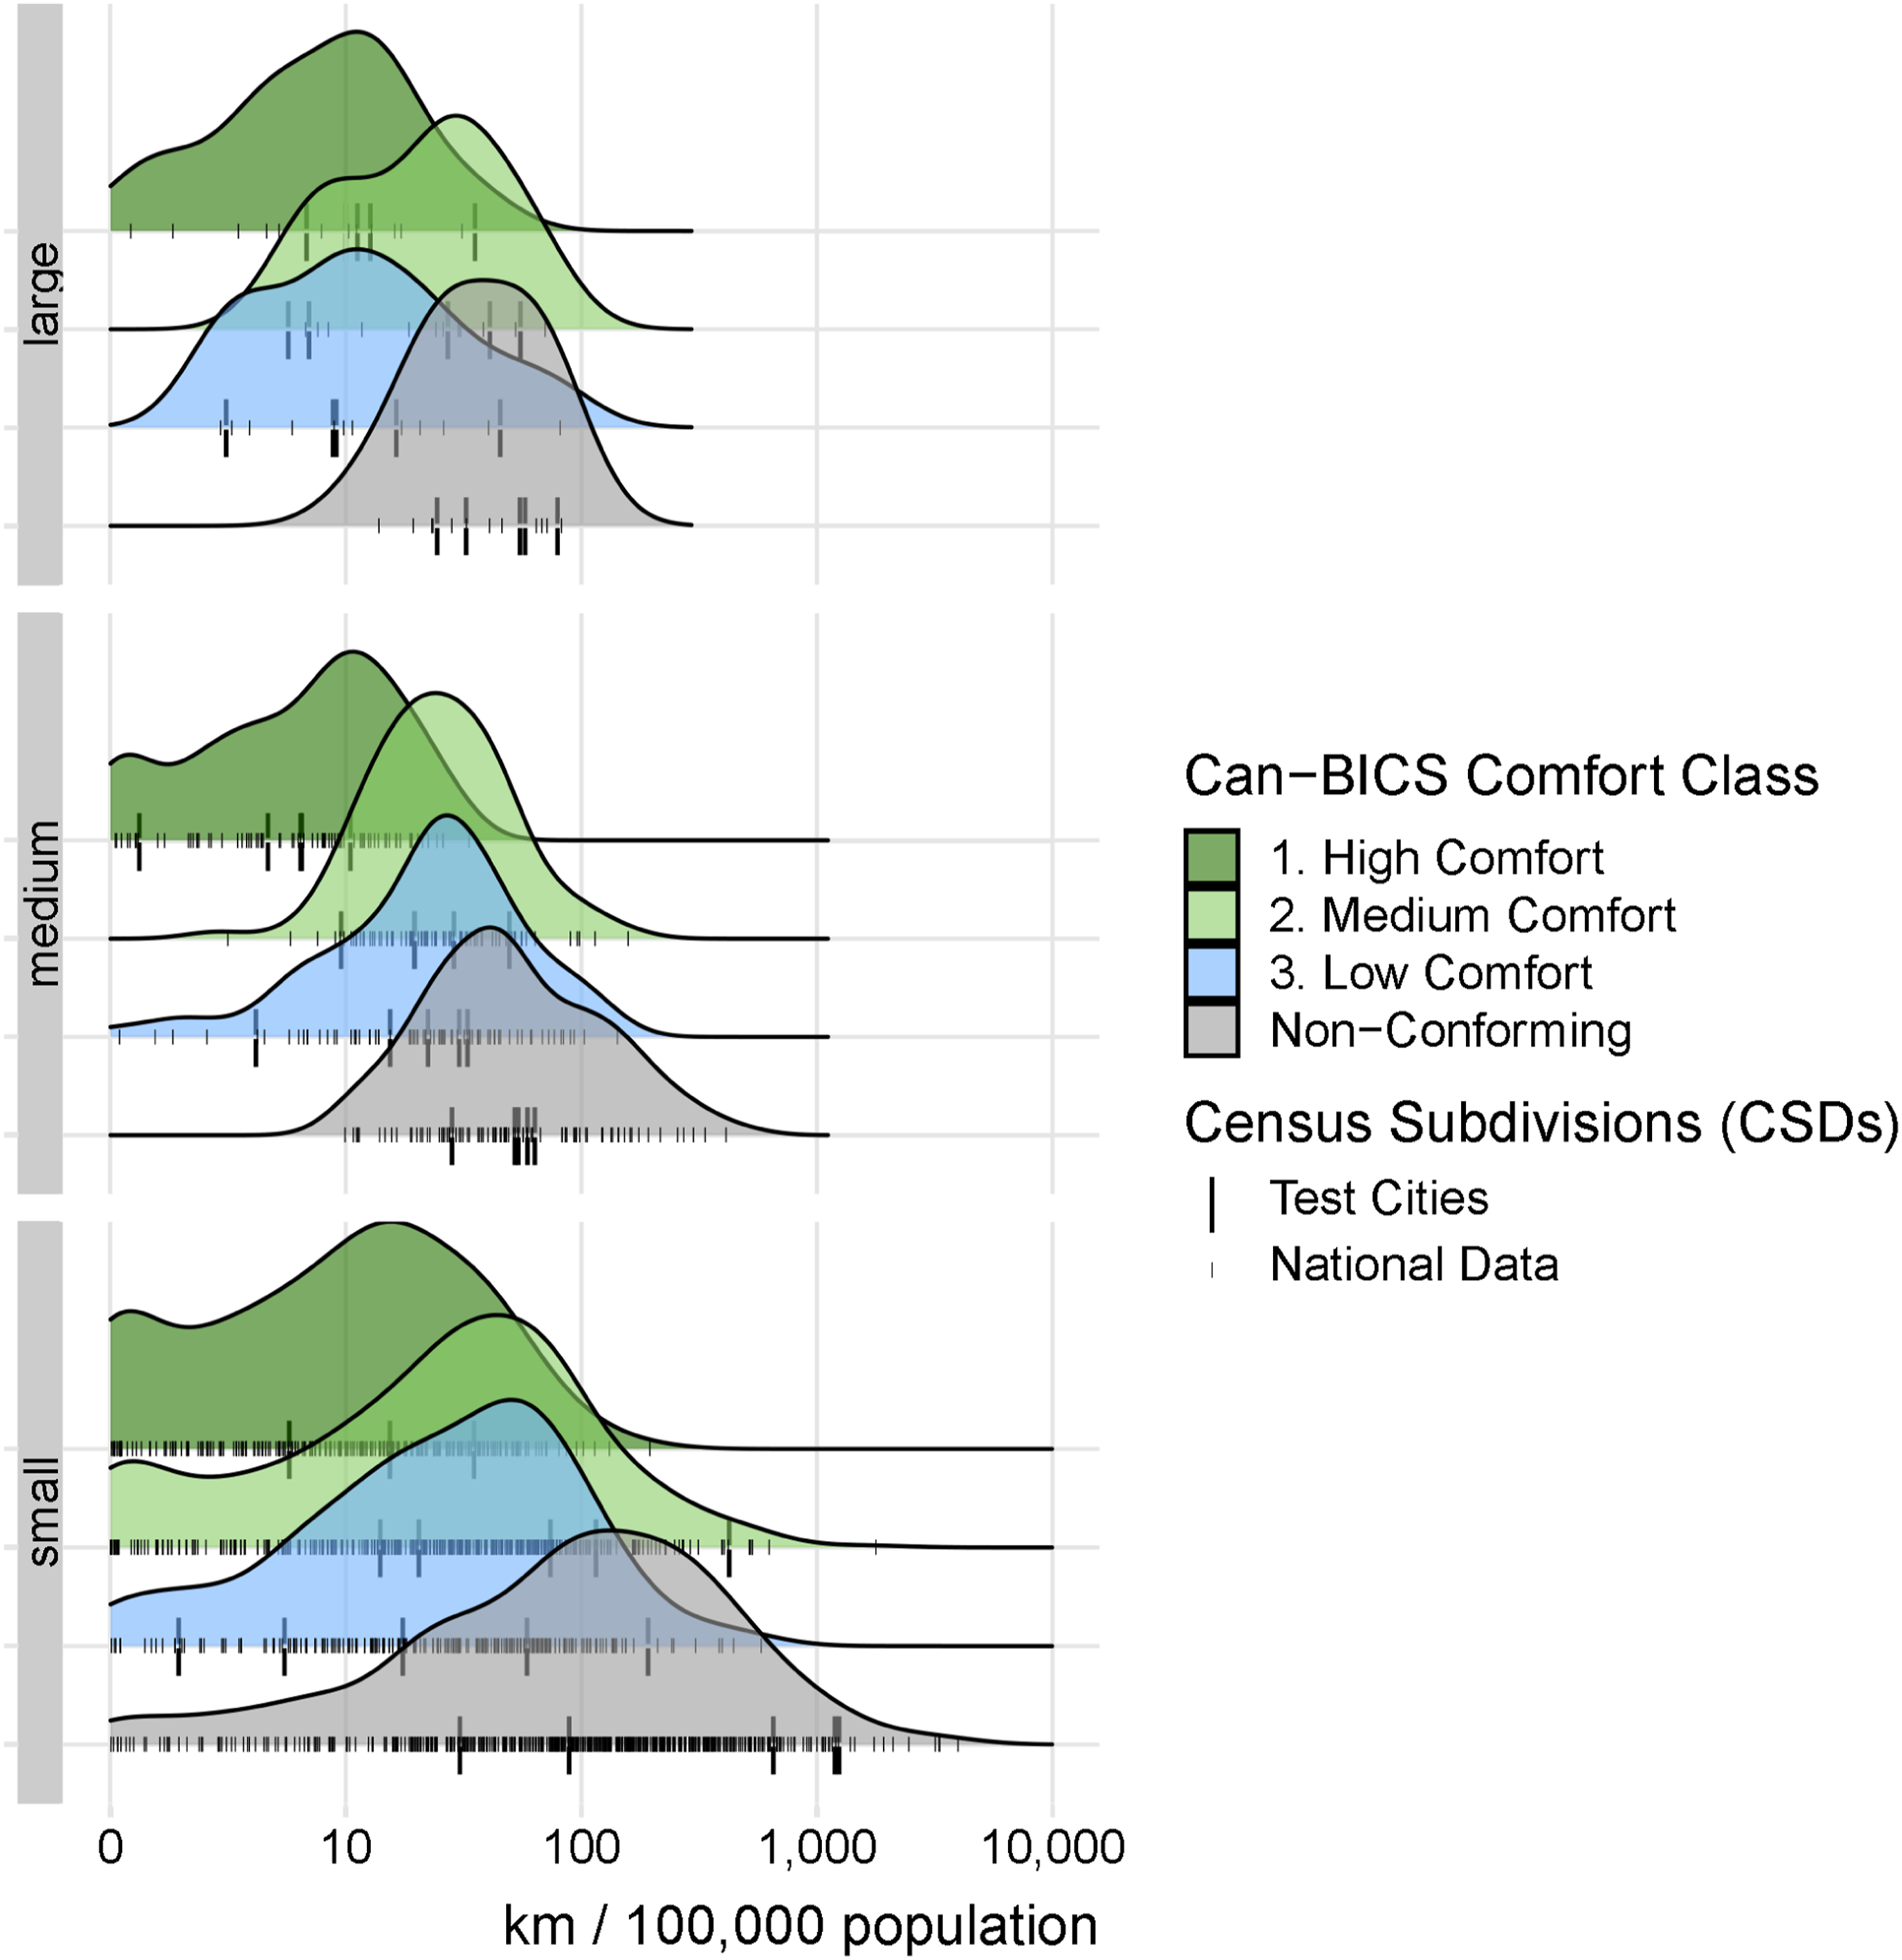
The distribution of cycling infrastructure by city size and comfort class for CSDs with population greater than 5000 people (n = 657). Markers show the value for each CSD and the 15 test cities are indicated with larger markers. Note the log scale.
Discussion
In this paper we present an approach to creating a national dataset for cycling infrastructure in Canada, developed from OSM. Our national dataset, classified consistently using the Can-BICS definitions, can be used widely for active transportation research in Canada. The data are especially useful for regional, national or multi-city studies looking to assess access to cycling infrastructure as part of population health, safety or equity studies. Our approach offers several advantages compared to previous national datasets assembled from open data provided by cities. Most importantly, it provides consistent and continuous coverage, the queries can be run in the future for change analysis, and the accuracy assessment can be applied in future change detection studies by collecting an appropriately sized reference sample (Olofsson et al., 2014). Additionally, we used Can-BICS cycling infrastructure definitions that align with both engineering practices and active transportation research priorities, with three categories of comfort. Finally, our methodology is useful for other researchers who are interested in creating large scale cycling infrastructure datasets given that OSM is a global platform.
We identified 22,992 km of cycling infrastructure meeting Can-BICS standards, which are a critical part of the national transportation infrastructure and are important for meeting active transportation goals. Nationally, multi-use paths are the most common type of cycling infrastructure (16.6%), followed by painted bike lanes (11.0%). Multi-use paths are often perceived as being high comfort, yet there are safety concerns due to falls and collisions (with motor vehicles at intersections and other modes of travel on the trail) (Jestico et al., 2017; TAC, 2020; Winters et al., 2012). Since multi-use paths are already perceived as safe, increasing separation from other modes of travel on the path (e.g. people walking, but also using e-scooters or other micromobility) may not impact cycling mode share, but it may improve safety. With increasing volumes of people cycling, separation from other modes of travel on multi-use paths may become a priority in more cities as conflicts between users arise. Small cities had a wider range in the availability of high comfort cycling infrastructure, with some small cities being very well served, and others providing no infrastructure. Most of the cycling infrastructure in Canada (68.0%) does not conform to Can-BICS standards, although it may serve an important role for local connections or for recreation, and our conversations with planners in the test cities confirmed this.
Our results indicate that a very large portion of the Canadian population is without access to safe and comfortable options for cycling; this may be hampering widespread uptake with associated public health and equity outcomes. A core tenet of transport justice is accessibility (Martens, 2016). Our national dataset will allow policy makers to understand where investments in cycling infrastructure have or have not been made within their jurisdictions. Often investments in cycling infrastructure are made in ways that avoid any interference with the level-of-service for vehicle traffic (Henderson and Gulsrud, 2019; Koglin, 2017) thus reflecting a persistent marginalisation of cycling in transport planning (Cox, 2020). Many cities are experiencing rapid growth and making major investments in sustainable transportation infrastructure to address climate goals or congestion challenges. Access to a national dataset of cycling infrastructure, such as what we developed here, is one way to monitor which modes are prioritised in planning and which areas are receiving greater investments.
Our results show that OSM has, on average, the same or slightly higher accuracy compared to open data for identifying Can-BICS infrastructure types. Improving the ability to distinguish cycling infrastructure using categories that are meaningful for cyclist safety and preference should be a priority for both open data and OSM alike. OSM provides automated tools to track data lineage, including who edited, when and comments about the reason. Future research could use these intrinsic indicators of data quality, such as editing history, and information about the contributors, to understand how they relate to active transportation data quality. Providing open-source code and accessible tools to understand and modify algorithms can advance research outcomes (Lindsay, 2016). In this work, we have demonstrated a model using OSM data and custom queries using open-source code, and given that both data and code are available this approach contributes to reproducible research standards The OSM Can-BICS dataset is similar to how basemap renderings of OSM data are used to highlight features for different purposes. OSM Can-BICS was classified to meet the objective of measuring cycling infrastructure in Canada. For our research-based objectives, versioned yearly classifications of the dataset are practical. Through its use for critical analyses of cycling infrastructure, we have facilitated OSM editing (adding or removing infrastructure with new developments, adding detail and correcting errors) in association with advocacy groups, city staff and researchers. These edits are contributed to OSM so that they are available to all OSM users.
There is a massive opportunity for the transportation research and planning community to rally around OSM for mapping active transportation infrastructure. OSM is a global map, and the classification algorithm shared in our work could be used to develop national datasets in other countries, or even a global dataset on cycling infrastructure. OSM provides a central repository and standard data structure under a share and share alike licensing scheme that allows flexible use and encourages sharing improved and derived data. Building a community of active transportation research OSM users and contributors will reduce overall data management efforts, increase research reproducibility, and allow better comparisons across space and time. In addition to reducing time and labour assembling data, community use and contribution to OSM will create more consistent data quality for infrastructure data. Open-source communities are the intersection of many independent interests, including individuals, researchers and commercial efforts, and we encourage researchers to share data to advance both their own interests and the state of research. Contributions to OSM by researchers, such as paid research assistant time spent editing OSM, including OSM-specific training (e.g. Solis et al., 2021), can advance multiple studies, and also benefit in kind from continued community editing, and on-the-ground lived-experience that may be missing from official open data provided by cities. More eyes on the data (for example, app users with OSM basemaps for navigating) can lead to more people who can find and fix errors (Miller and Goodchild, 2014). Commercial interests, such as social fitness applications contributing to trail mapping because they use OSM basemaps or delivery companies mapping traffic diversion on local street bikeways also contribute to cycling data quality (Anderson et al., 2019). Researchers should consider OSM as a data source and contribute to the underlying data.
The main challenge for active transportation studies centred on using OSM data is that the data depends on the community to keep data up-to-date, rather than a single authority with a mandate and funding to complete the task. The variable editing effort might be frustrating for city officials who maintain high-quality open data in some communities. However, open data quality is seldom evaluated in studies, and while OSM data is often critiqued, the process can lead to improvement (Mahabir et al., 2017). Additionally, some types of high comfort cycling infrastructure – namely, local street bikeways and bike paths – did not (at the time of writing) have explicit tagging conventions. We applied geometric operations to improve classifications, but these features could be more easily identified if specific tags were used.
We identified several common sources of error and bias in OSM data. High comfort bike paths were under-represented as they were sometimes misclassified as multi-use paths. Bike paths are the safest and most preferred type of cycling infrastructure, yet they are rare and are a relatively new type of infrastructure in Canada (TAC, 2020). Adding tags for separation (either OSM tag: segregated = yes if shared geometry, or OSM tag: foot = no for separate geometry) would improve classification accuracy and reduce bias. Surface is an important accessibility concern for multi-use paths, but many features are missing surface tags on OSM. Unpaved multi-use trails are very common in Canada and important to distinguish from higher quality paved multi-use paths. Painted bike lanes were over-represented in OSM. Some places mapped as painted bike lanes did not meet Can-BICS standards in the reference data (e.g. narrow shoulders on the sides of busy roads without markings, sometimes covered in gravel). Consistently identifying high comfort local bikeways is challenging, since the definition is subjective in terms of whether infrastructure meet design standards. Finally, we found lower accuracy in general in cities in Quebec compared to cities in other provinces, and this may be related to language (OSM tagging is in English, which might discourage participation for French speakers).
We expect OSM data quality to improve over time because recent renderings of the data, such as CyclOSM (https://CycleOSM.org), give higher visual priority to low traffic and separated infrastructure, which aligns with cycling safety and research priorities. These renderings also visually highlight areas where editing is needed for high comfort infrastructure. In cities where we engaged with city officials, we later performed OSM editing (not included in this analysis) to improve data quality as a community contribution. Further, we published guidelines for editing to improve data quality for active transportation research (https://bikemaps.org/blog/post/improving-bicycling-data-on-openstreetmap) and engaged with active editors through social media. The accuracy assessment method presented here can be used for future change detection studies, and account for changing accuracy and bias, by collecting a similar reference dataset in the future and comparing error-adjusted estimates of length (Olofsson et al., 2014).
OSM is a powerful global data source; however, editing effort is not even across space, or even within cities. Our sample of 15 cities aimed to represent a range of city sizes and geographic locations, and each city has its own cycling and data history leading to unique data quality considerations. Future work may consider how data quality for cycling infrastructure relates to socio-economic indicators, which is important for equity studies (given that OSM variable editing may not be equitably distributed, e.g. Elwood et al. (2012)). Our analysis evaluated OSM at one point in time. Like all accuracy studies, reference data are subject to geolocation errors, interpreter errors and errors due to the timeliness of reference data. This classification does not consider intersections or crossings, which are important for safety and preference. Additionally, the geographic representation of this dataset sometimes varies between centrelines and lane km, depending on tagging and digitalisation practices, and this has caused challenge in other OSM network projects for bicycles (Carlino, 2021).
Conclusion
Cycling is the fastest growing mode of travel in Canada and understanding where supportive infrastructure exists nationally is important for monitoring access. For example, this dataset can help answer the question of if equity-deserving populations have fair access to public investments in cycling infrastructure (considering both the amount and quality), which is an important component of mobility justice and spatial justice. The time and effort required to assemble cycling infrastructure data from open data for a region or large area is a barrier to active transportation studies to promote active travel, measure equity and evaluate change over time. We created a national dataset for Canada and evaluated site-specific data quality. Nationally, multi-use paths and painted bike lanes are the most common types of cycling infrastructure. A priority for improving OSM data quality is improving consistency and completeness for high comfort infrastructure where cycling is separated from other modes of travel and on local street bikeways with traffic calming and diversion. The dataset is available immediately for research use, and our code is available to adapt and improve. With its use of OSM data, our methodology can be used by researchers globally to survey spatial access to cycling infrastructure over large scales and across jurisdictions.
Footnotes
Acknowledgements
Thank you to the OSM Contributors (2021). Jaimy Fischer and Moreno Zanotto generously provided valuable expertise throughout many stages of the project and assisted with reference data collection.
Declaration of conflicting interests
The author(s) declared no potential conflicts of interest with respect to the research, authorship, and/or publication of this article.
Funding
The author(s) disclosed receipt of the following financial support for the research, authorship, and/or publication of this article: This work was funded by grants from the Canadian Institutes of Health Research and the Public Health Agency of Canada [2021-HQ-000086]. Additional support for MW was provided by the Michael Smith Foundation for Health Research.
Author biographies
C Ferster (PhD) is a research assistant in the Cities, Health, and Active Transportation (CHATR) Lab at Simon Fraser University. He is a computational geographer who uses traditional and emerging data sources to understand people and their environments.
T Nelson (PhD) is the Jack and Laura Dangermond Chair of Geography at the University of California Santa Barbara. Nelson’s research focuses on Geographic Information Science and spatial analysis with an emphasis on applications that support active transportation planning. Dr. Nelson has particular expertise in developing novel data sets to better represent bicycling safety/risk and volume/exposure. She led the development of BIkeMaps.org, a crowdsourced tool for mapping bicycling crashes and near misses globally.
K Manaugh is an Associate Professor jointly appointed in the Department of Geography and Bieler School of Environment at McGill University in Montreal, Quebec, Canada. His research focuses on the role of transportation systems on a variety of environmental, health, and social outcomes, with a particular focus on equity in transport planning.
J Beairsto is a former research assistant for the Cities Health and Active Transportation Lab at Simon Fraser University, and now works in Transportation Planning at the City of Vancouver. Jeneva has an M.Sc. in Urban Analytics from the University of Glasgow, and a Bachelor of Arts and Science from Quest University Canada. She has a background in mathematics, data analytics and GIS and has focused on a range of research topics related to sustainable transportation: including bike-sharing systems, transit, accessibility, and cycling.
K Laberee (MSc) is the Project Manager for Can-BICS. Laberee has experience leading public engagement and crowdsourced research projects involving active transportation including BikeMaps.org and WalkRollMap.org. Laberee is also the Victoria project coordinator for INTERACT, a pan-Canadian collaboration of scientists, urban planners, public health practitioners and community partners engaged in a longitudinal study of the impact of urban changes on health and equity.
M Winters Meghan Winters (PhD) is a Professor in the Faculty of Health Sciences, Simon Fraser University, and a CIHR Applied Public Health Chair, in Gender and Sex in Healthy Cities. Their research focuses on active transportation, healthy cities, equity, and population health intervention research.