
Abstract
The UK, particularly London, is a global hub for money laundering, a significant portion of which takes place through residential property. However, understanding the distribution and characteristics of offshore residential property in the UK is a challenge. This paper attempts to remedy that situation by enhancing a publicly available dataset of UK property owned by offshore companies. We create a data-processing pipeline which draws on several datasets and on machine learning techniques to create a parsed set of addresses classified into six use classes. The enhanced dataset contains 138,000 properties – 44,000 more than the original dataset. The majority are residential (95k), with a disproportionate number of those in London (42k). The average offshore residential property in London is worth 1.33 million GBP, and collectively this amounts to approximately 56 billion GBP. We perform an in-depth analysis of offshore residential property in London, comparing the price, distribution and entropy/concentration with Airbnb property, low-use/empty property and conventional residential property. We estimate that the total number of offshore, low-use and Airbnb properties in London is between 144,000 and 164,000, collectively worth between 145–174 billion GBP. Furthermore, offshore residential property is more expensive and has higher entropy/concentration than all other property types. In addition, we identify two different types of offshore property – nested and individual – which have different price and distribution characteristics. Finally, we release the enhanced offshore property dataset, the complete low-use London dataset and the pipeline for creating the enhanced dataset to encourage further research into this topic.
Introduction
The UK, and in particular London, is a hub for international money laundering through property (TIUK, 2022). The volumes of money laundered through the UK capital are believed to be so high, the city is sometimes referred to as ‘The London Laundromat’ 1 . A substantial part of the reason for this is the ease with which offshore shell companies can purchase property in the UK, which allows those with illicit incomes to buy property without being identified (Cowdock and Goodrich, 2018). In the ‘National risk assessment of money laundering and terrorist financing 2020’, the risk of money laundering using property purchases was rated as high (Treasury, 2020), with residential property being a particular focus due to the large amounts of money that can be moved in a single transaction and the lifestyle benefits such properties bring. In addition, Transparency International have found that 75% of money laundering cases involving property use offshore shell companies (De Simone et al., 2015).
For an in-depth discussion of money laundering and property, see Tiwari et al. (2020) and Unger and Ferwerda (2011).
In 2015, a list of offshore-owned properties in England and Wales was leaked to, and made public by, Private Eye, a British publication (Eye, 2015). Since then, the UK government has published a regularly-updated dataset of offshore owned properties called the ‘Overseas companies that own property in England and Wales dataset’ (OCOD) (Registry, 2022b). Since the release of the original OCOD dataset, there has been more focus on property-related money laundering by various government agencies and bodies (Tugendhat et al., 2018; Westminster-council, 2022; NCA, 2021; UK-Government, 2022). Earlier attempts to control money laundering had struggled for decades (Mitchell et al., 1998), but in 2022, the UK government passed a law creating a register of beneficial owners of offshore property, which is believed to be a key tool in reducing money laundering (UK-Government, 2022).
The OCOD dataset has the potential to be a great resource for those wishing to understand the distribution and characteristics of offshore-owned property in the UK. However, although the dataset has been used by researchers (McKenzie and Atkinson, 2020; Sá, 2016), it is challenging to use because addresses are recorded as free text. These addresses can be incomplete, contain nested properties, such as where multiple properties exist within a single row or title number: it also contains no information on whether the property is residential, business or something else. Such poor-quality data makes understanding the distribution and characteristics of offshore owned property in the UK difficult.
In addition to offshore-owned residential property, London has large amounts of short-term rental and low-use/empty property. In this paper, offshore residential property, Airbnb property and low-use property are grouped under the term ‘Unconventional Residential Property’ (URP). URPs have been criticised for financialising the housing market and increasing prices by inflating demand in specific areas (Guerrieri et al., 2013 Sá, 2016; Fernandez et al., 2016 Gallent et al., 2017). Offshore-owned, Airbnb and low-use properties are not mutually exclusive sets and a single URP can be any combination of the three. Short-term rentals of the sort facilitated by Airbnb, One Fine Stay and Vrbo have been researched quantitatively in both London and other major cities (Shabrina et al., 2022; Bao and Shah, 2020; Garcia-López et al., 2020). Low-use property, that is, property with no permanent resident, has also received coverage (Bourne, 2019; Noh et al., 2021; Baba and Hino, 2019), but less so than the short-term rental market due to difficulty obtaining data which is seldom publicly available due to privacy concerns. In the UK, data gathering is further complicated by distinct sub-national jurisdictions. For example, the register of property sales is public in England and Wales Registry (2022a) but not in Scotland or Northern Ireland. To counter some of the difficulties with property data, the UK government developed the Unique Property Reference Number (UPRN) (OS, 2021). The UPRN is a referencing system designed to increase the ease of linking property data across government datasets. However, whilst the use of the UPRN is mandated, almost no government department uses it, meaning linking the data requires advanced data processing skills (Chi et al., 2021; Comber and Arribas-Bel, 2019).
A partial solution to data issues with OCOD and other property datasets is the use of address parsers. Recently, open-source address parsers have been developed to convert free text addresses to a tabular and normalised format, which is much easier to analyse (Yassine et al., 2020; Barratine, 2017; Delil et al., 2020).
Address parsing is a form of Named Entity Recognition (NER), a subfield of Natural Language Processing (NLP) and itself a subfield of Machine Learning (ML). NER uses statistical techniques to identify certain words within a sentence or larger block of text which represent a predefined entity, and labels them with a given entity class. For address data, an example of a specific class could be ‘street name’ or ‘postcode’. The named entity is defined by its ‘Span’ which is the position number of the start and end characters as well as the label of the entity class.
Although very valuable, the existing address parsers are not without problems. Many of the parsers are trained using Open Street map data (OSM, 2004): this has the advantage of having many millions of stored addresses to use as training data, and algorithms can be trained to parse addresses from countries across the world using multiple languages and scripts. However, it also means that even though training data has noise induced to increase robustness, competing algorithms are all trained on the same dataset. This training dataset may be subtly different from the actual data the resulting algorithms are applied to, which can lead to weaknesses. For example, the most well-established parser ‘libpostal’ (Barratine, 2017) has been shown to have issues parsing incomplete addresses (Yassine et al., 2020), and it also struggles with addresses in formats it is not used to (Craig et al., 2019). A more fundamental issue may be that the algorithms are designed on the assumption that they are parsing a single address, but the OCOD dataset contains large numbers of nested addresses in which a single free text line may contain tens or even hundreds of properties. As such, a parser specifically designed to deal with the issues presented by this specific dataset must be created. Given that there is no real training data, creating such a parser needs to take advantage of recent developments in ML and NLP.
A major difficulty in any machine learning project is obtaining labelled data. This is because the majority of machine learning tasks use supervised learning. In supervised learning, the algorithm is instructed to learn a specific task such as classification or regression, for which the training data supplies the correct answer: the algorithm is considered trained when the error between the predictions and ground truth is minimised. The data used in supervised classification tasks typically has to be labelled by a human. This is time consuming, and can be impractical for small teams or those without funding to pay others recruited through ‘crowd sourcing’ (Sheng and Zhang, 2019; Zhang et al., 2016). A developing solution to this issue is ‘weak learning’ (Ratner et al., 2017), in which data is labelled using simple rules: this can produce a large number of labels which are often correct, but can also overlap and contradict one-another. A ‘de-noising’ process is then applied to the data using a statistical method such as a hidden Markov model (Lison et al., 2020) or matrix completion (Ratner et al., 2018). The de-noising process removes overlapping labels to minimise the error with the ground truth. An obvious critique of weak learning is that the true labels are not known, bringing prediction quality into question: on the other hand, one of the most powerful aspects of weak learning is that it can produce models that are almost equal in performance to hand-labelled data (Fries et al., 2021), indeed the quality of the model scales according to the size of the unlabelled dataset (Ratner et al., 2017). In addition, recent research has highlighted that most datasets have errors, even those used as benchmark machine learning datasets such as MNIST, ImageNet and Amazon reviews (Northcutt et al., 2021); this suggests that datasets created either through weak learning or hand-labelling are on an error scale but can both produce high quality models.
This paper proposes a new method of identifying and classifying offshore-owned property in England and Wales. We use this method to estimate the ‘market size’ of offshore property in London, as the city is known to be disproportionately affected by money laundering. We contextualise the findings related to offshore-owned property using two other unconventional but better understood residential property types, Airbnb and low-use-property, as well as conventional residential property. Finally, we explore whether offshore-owned residential property is homogeneous or whether it contains sub-groups.
The method does not identify properties involved with money laundering as such; however, it allows us for the first time to map and characterise offshore-owned property. This is valuable given the known problems London has with money laundering related to offshore-owned residential property (Cowdock and Goodrich, 2018; Treasury, 2020; TIUK, 2022). Our findings and the dataset produced can be used by those interested in the issue of money laundering as well as offshore property more broadly.
Method
The method is divided into three parts. The first part introduces the data; the second part details how the OCOD dataset is cleaned and transformed into the enhanced OCOD dataset (OCOD+); and the third part describes the steps followed in the analysis.
It should be noted that although address parsing is a major part of this project, the goal is not to create a universal address parser. Rather, the focus of the method is the process of creating OCOD+ and the resulting analysis.
In this project, geographical analysis is performed on discrete units. These units were created by the Office for National Statistics (ONS) for use in census geography (ONS, 2022a). We use three levels of census geography which are (from smallest to largest): the Output Area (OA); Lower Super Output Area (LSOA); and Middle Super Output Area (MSOA). In addition, we use the Local Authority District (LAD), which is the smallest level of local government. More information on the relationship between these hierarchical units is given in Supplementary Material Section 1. The use of the OA system provides a standard interface with government data and avoids data privacy issues.
Although OCOD+ covers the whole of England and Wales, the focus of the analysis is on London only, partly for simplicity and also the availability of Low-Use-Property data and Airbnb data for comparison.
Data and code
This work uses six publicly available datasets and two derived datasets, a diagram of how the datasets interact and the outputs of the project is provided in Section 2 of the Supplementary Material. The key data set is the ‘Overseas companies that own property in England and Wales dataset’ (OCOD) (Registry, 2022b). The data-cleaning process uses the Land Registry Price Paid dataset (Registry, 2022a), the VOA ratings listing dataset (VOA, 2017) and the Office of National Statistics Postcode Directory (ONSPD) (ONS, 2022b). The Airbnb data is from the website InsideAirbnb (Cox et al., 2022). The Airbnb properties in this dataset only include entire homes which are rented out to the extent it is not possible to have a permanent tenant. The low-use dataset uses data gathered using Freedom of Information (FOI) requests, the majority of which was collected for Bourne (2019), but the missing London boroughs have since been added using the same FOI process (see github repo lsoa foi template maker). The definition of low-use-property (sometimes called ‘empty property’) is difficult and variable (Paris, 2009; Wallace et al., 2005): this paper uses the same definition as Bourne (2019) which is broadly that the owner of the property has chosen that it should have no permanent resident. Two examples of this would be a second home, and a home that is empty due to the death of the owner. A second home is a low use property as the lack of permanent resident is a clear choice of the owner. In contrast, a property awaiting Probate due to the death of the owner would not count as low use. Price data used in the Inference and Analysis Section comes is from the Price Paid dataset. The London low-use dataset and OCOD+ are both available along with the code used at the GitHub repository for this project JonnoB empty homes london. The data description for OCOD+ can be found in Section 3 the Supplementary Material. The OCOD+ dataset, model and file required to create the model are available from the OSF repository (https://osf.io/khavm/)
It should be noted that the nested properties highlight another nuance with the OCOD dataset. Nested properties are part of a title that is owned by an offshore company, but that title may refer to the freehold as opposed to the lease hold. This means that the right to live in the property has been sold to an individual for some period of time (e.g. 100 years) although the property still belongs to the freeholder and leaseholders usually pay ‘ground rent’ to the freeholder. Leaseholds are typically the case with flats and apartments. We included both freehold and leasehold properties on the basis that in either case the benefit in terms of sale or ‘ground rent’ asset value belongs to the freeholding offshore company.
Creating the enhanced OCOD dataset (OCOD+)
OCOD+ is created by putting the original OCOD dataset through a process of cleaning, labelling, parsing and classification.
The end result is a dataset that can be easily analysed and follows tidy data principles (Wickham, 2014) in that each property is an observation/row in the data. The OCOD dataset is a CSV file containing several columns: however, for the purpose of this paper, two are of importance – the title number and the property address. The title number is the unique reference given to each ‘property’ although in reality a title can contain many properties or none. The property address contains the free text which will be parsed.
The data cleaning and preparation process is broken into five sections, Label, Parse, Expand, Classify and Contract, and in addition, quality testing of the labelling and classification is performed. A diagram of the process is shown in Figure 1. A diagram of the data cleaning process from loading the OCOD dataset to outputting OCOD+ ready for analysis.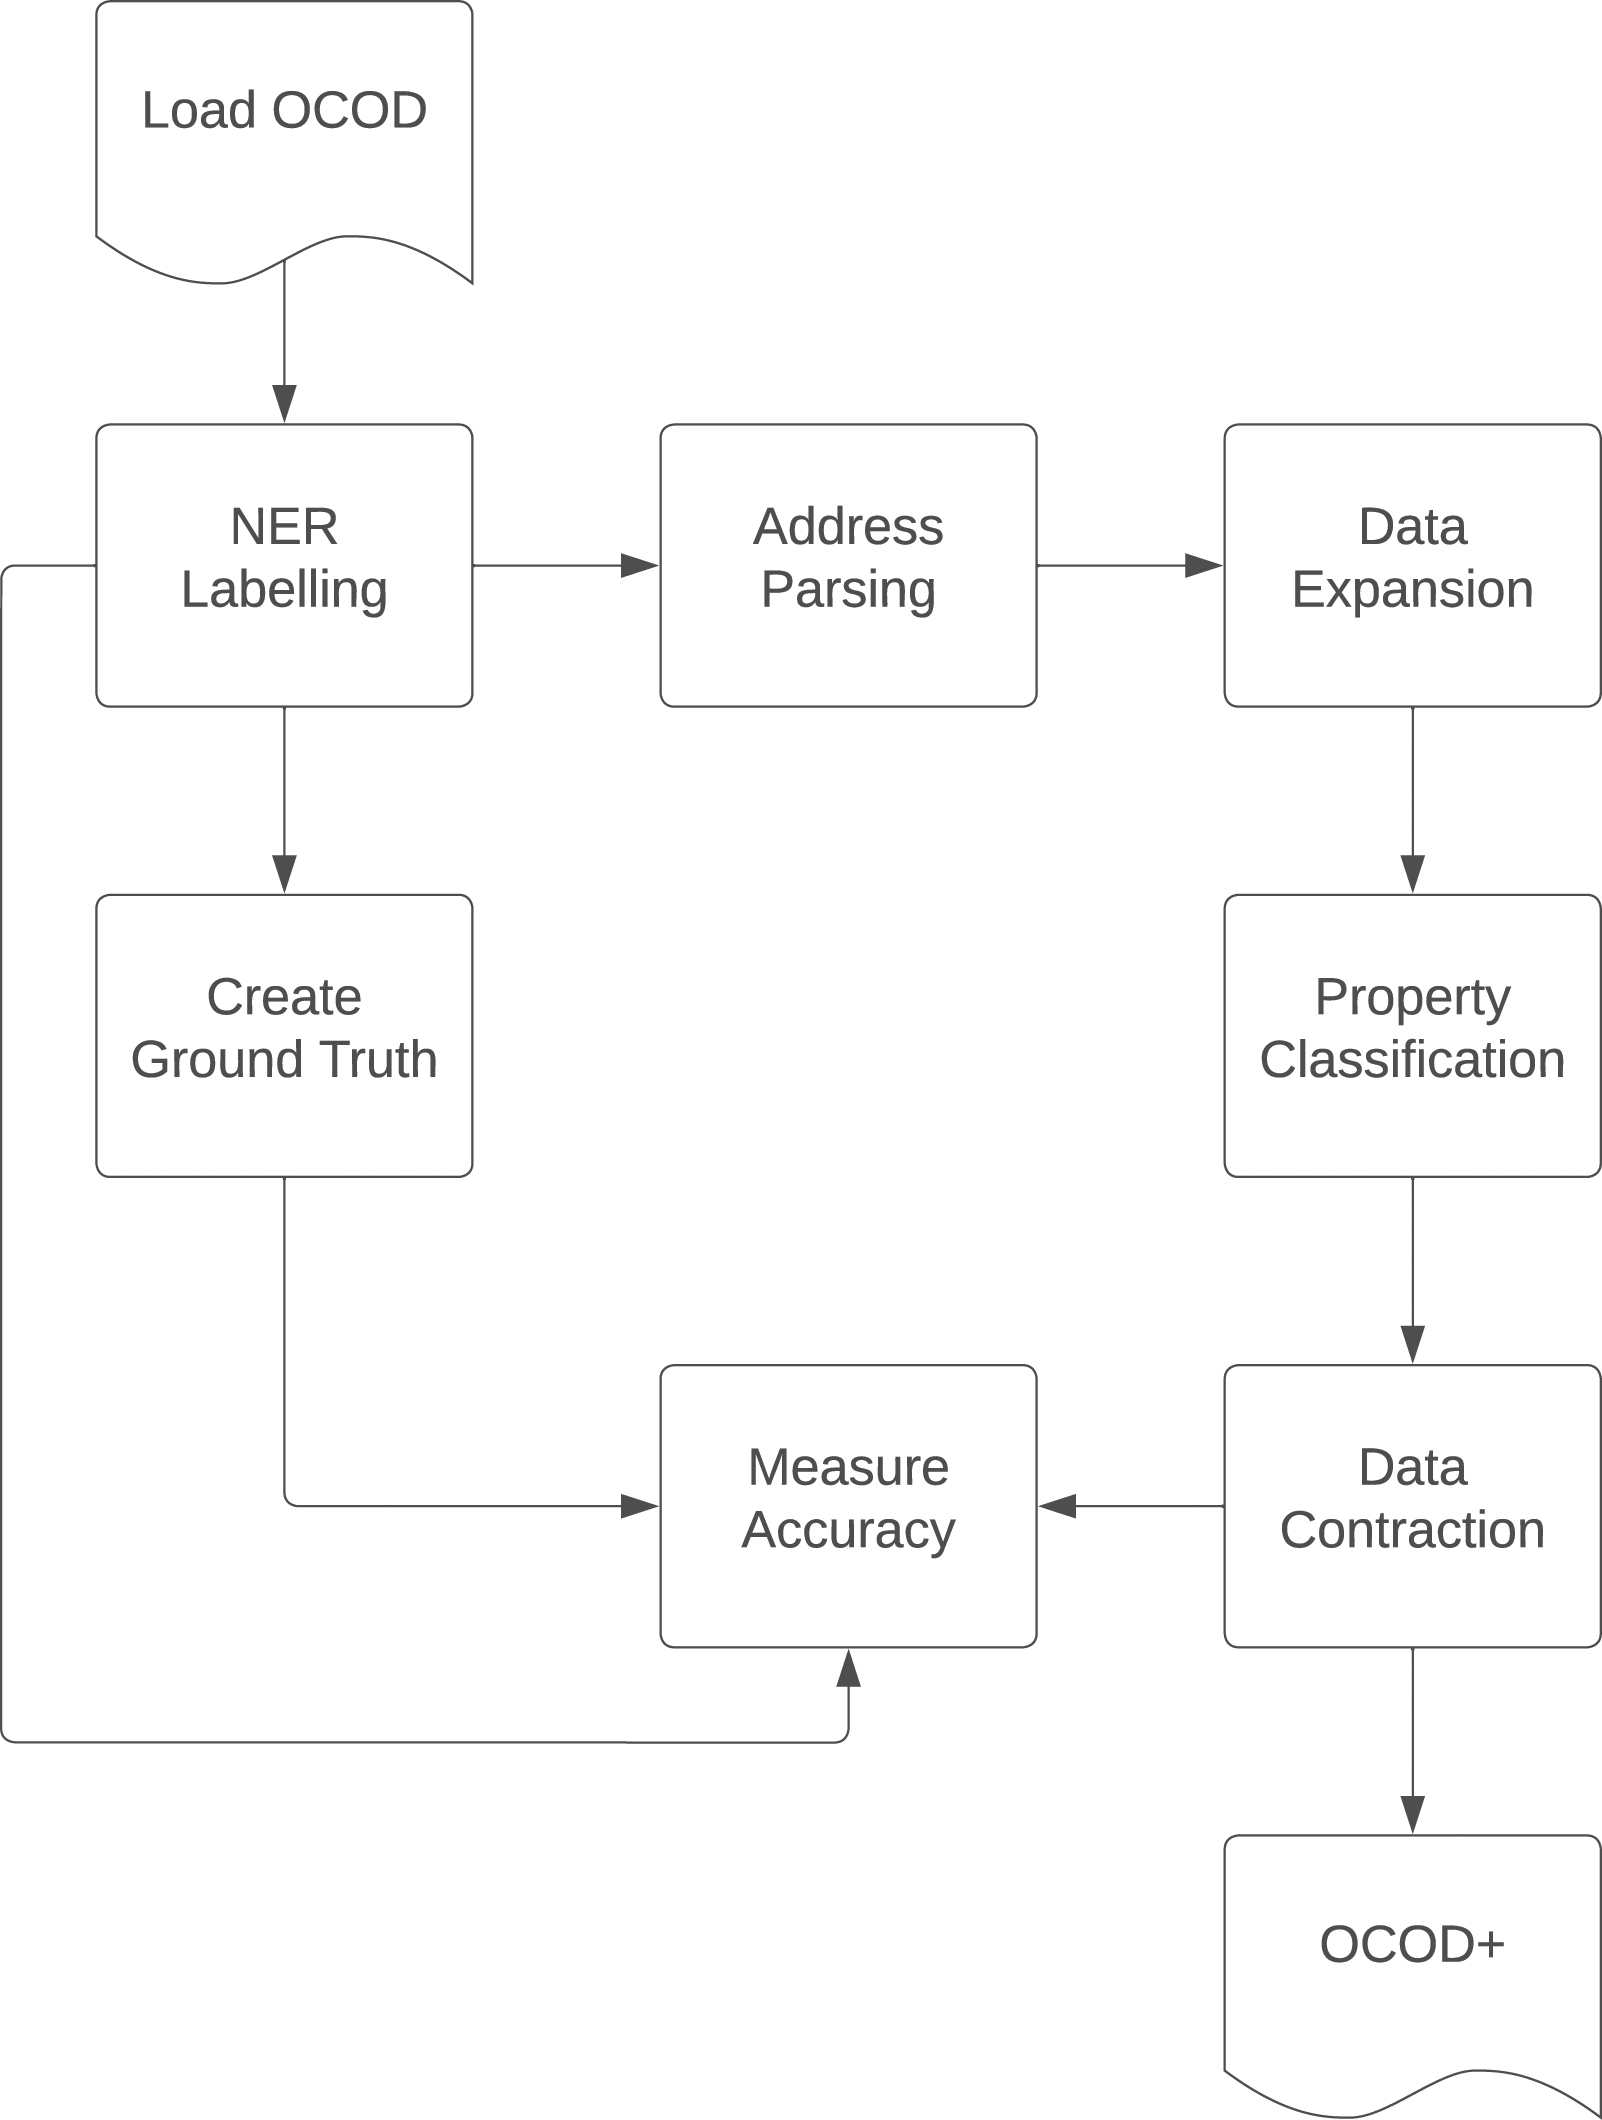
Example address formats.
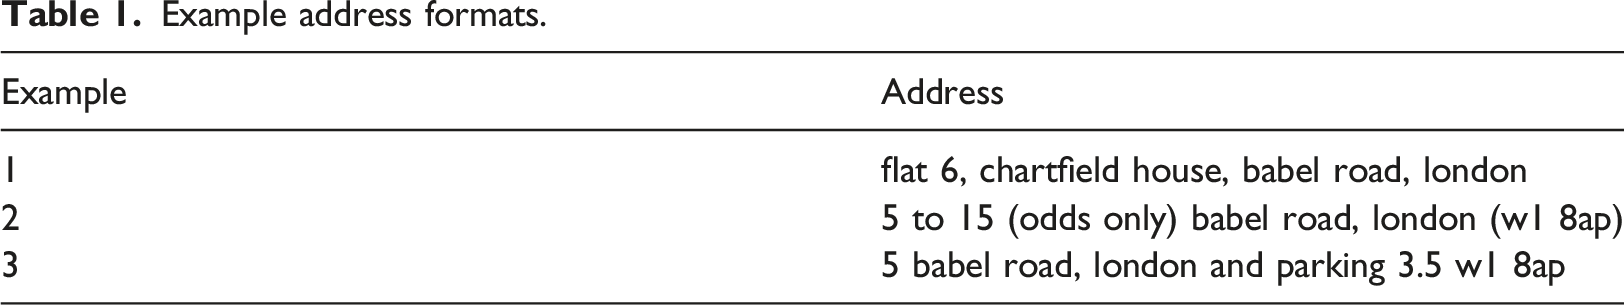
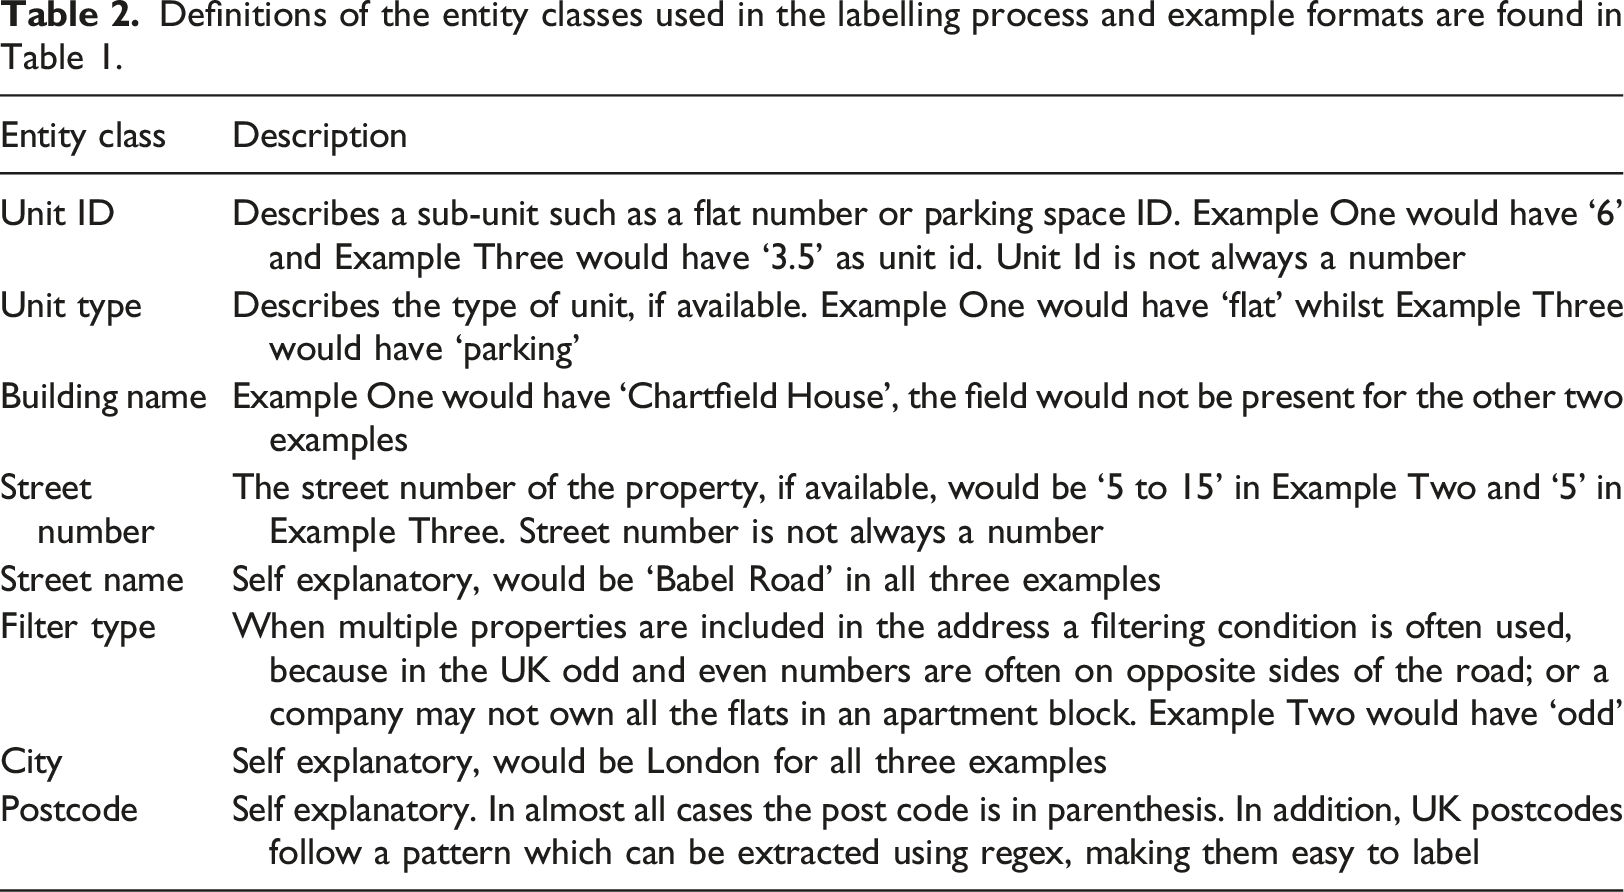
Definitions of the entity classes used in the labelling process and example formats are found in Table 1.
Once the labels have been added to the data, the whole dataset is extracted as a json file. In some cases, label spans overlap and these are removed either using a simple rule that keeps only the largest span, or a de-noising process that uses a hidden Markov model, following the principles of weak labelling. In addition, using the output of Programmatic, we create a predictive model using spaCy (Honnibal and Montani, 2017), with RoBERTa (Liu et al., 2019) as the underlying algorithm. RoBERTa is a type of transformer (Vaswani et al., 2017), and is currently one of the most successful approaches to solving problems in NLP.
Once the labels have been de-noised, a ground truth data set is hand-labelled using 1000 randomly-sampled observations. An additional dev set of 2000 examples is also labelled using the same process. This ground truth dataset is used to assess the quality of the NER labelling, using Programmatic and spaCy.
Address parsing
With a single address, the parsing process is effectively complete when the entities have been labelled. However, in the case when there are multiple properties, the parsing process is more involved and the label dependency becomes important. As an example, consider the nested address ‘Flat 5, Chartfield House and Flat 16, Zebra House, Babel Road, London (W1 8AP)’. In this example, there are two flats in two separate buildings on a single street and with a common postcode; that is, there are two distinct addresses with some shared labels. We parsed the addresses by assigning each character span its own row and each label class its own column. We then propagated the columns backwards to create complete address rows. Certain labels were classed as terminators. A terminator is the most specific point within the address and is commonly the first part of an address when it is written down (e.g. the street number). Once label propagation was completed, all non-terminator rows were removed from the data and all remaining rows were therefore complete addresses. Terminators were hierarchically structured such that if the highest priority label class was not available, the next label class in the hierarchy was used. The terminator list in hierarchical order is unit type, unit IDs, building name and street number. The presence of a span in a label column blocks the backfilling of data from later in the sentence, thus preventing situations where houses might be assigned the wrong road. When parsing was complete and address rows without terminators were removed, a tabular dataset of parsed addresses was returned.
As mentioned earlier and shown in Table 1, some title numbers contained multiple addresses using an abbreviated format. To have a single address per line required that the dataset be expanded.
Address expansion
Expanding the dataset so that each row represents a single property required machine reading of the unit ID label and the filter number label. A regex expression was used to identify unit IDs or street numbers that covered multiple addresses: the first and last numbers were then extracted and the numbers between them filled in making a contiguous list of numbers from i to j. If a filter number label was present, it was used to identify whether the numbers were odd or even and the list of numbers were filtered so that only the appropriate number type remained. With the data now parsed and expanded and a single property address was represented on a single line, the data could now be localised to a specific OA or LSOA and classified into a specific property type.
Address classification
The classification phase of the cleaning process included classifying the property types but also involved localising the properties within the UK government’s geographical area system. Initially, all postcodes were cross referenced with the Office of National Statistics’ Postcode Database (ONSPD). This links the postcode and the OA system used by the ONS for census and other demographic analysis. However, not all addresses have a postcode, and in these cases the parsed addresses were cross-referenced with the Land Registry Price Paid dataset and the VOA Company Ratings List dataset. If a match was found, the OA and LSOA were added to the OCOD address. For nested addresses, the same OA and LSOA was added to all addresses on the property title. The data was classified into one of six classes, in a sequential process (see Figure 2). The six classification groups are: airspace, business, residential, land, parking and ‘unknown’. There were two classification processes: Type 1 has twelve classification steps, where each step identifies some aspect of a single property class, (for details on the process see classifying_the_ocod_dataset.ipynb, section ‘Classify Property type’). In Type 1, any properties which cannot be identified are classed as ‘unknown’ and are almost entirely a mix of residential and business. Once the Type 1 classification process was completed, the Type 2 process was applied. As shown in Figure 2, the Type 2 process builds on the output of Type 1 and deduces whether a property is residential or business by finding which addresses can be identified. Type 2 has several sequential classification steps which filter for the level of completeness of an address. When class deduction is possible, the Type 2 process changes the ‘unknown’ class of the Type 1 process to ‘residential’ or ‘business’, as appropriate. However, addresses which did not contain enough information to accurately reclassify remain in the ‘unknown’ class. The outputs of the processes are provided separately in the dataset because the Type 1 process is more secure as it primarily relies on positively identifying classes, whereas Type 2 uses deduction to work out what the property is not. The analysis in this paper is based on Type 2 classifications. The classification process during the preparation of OCOD+.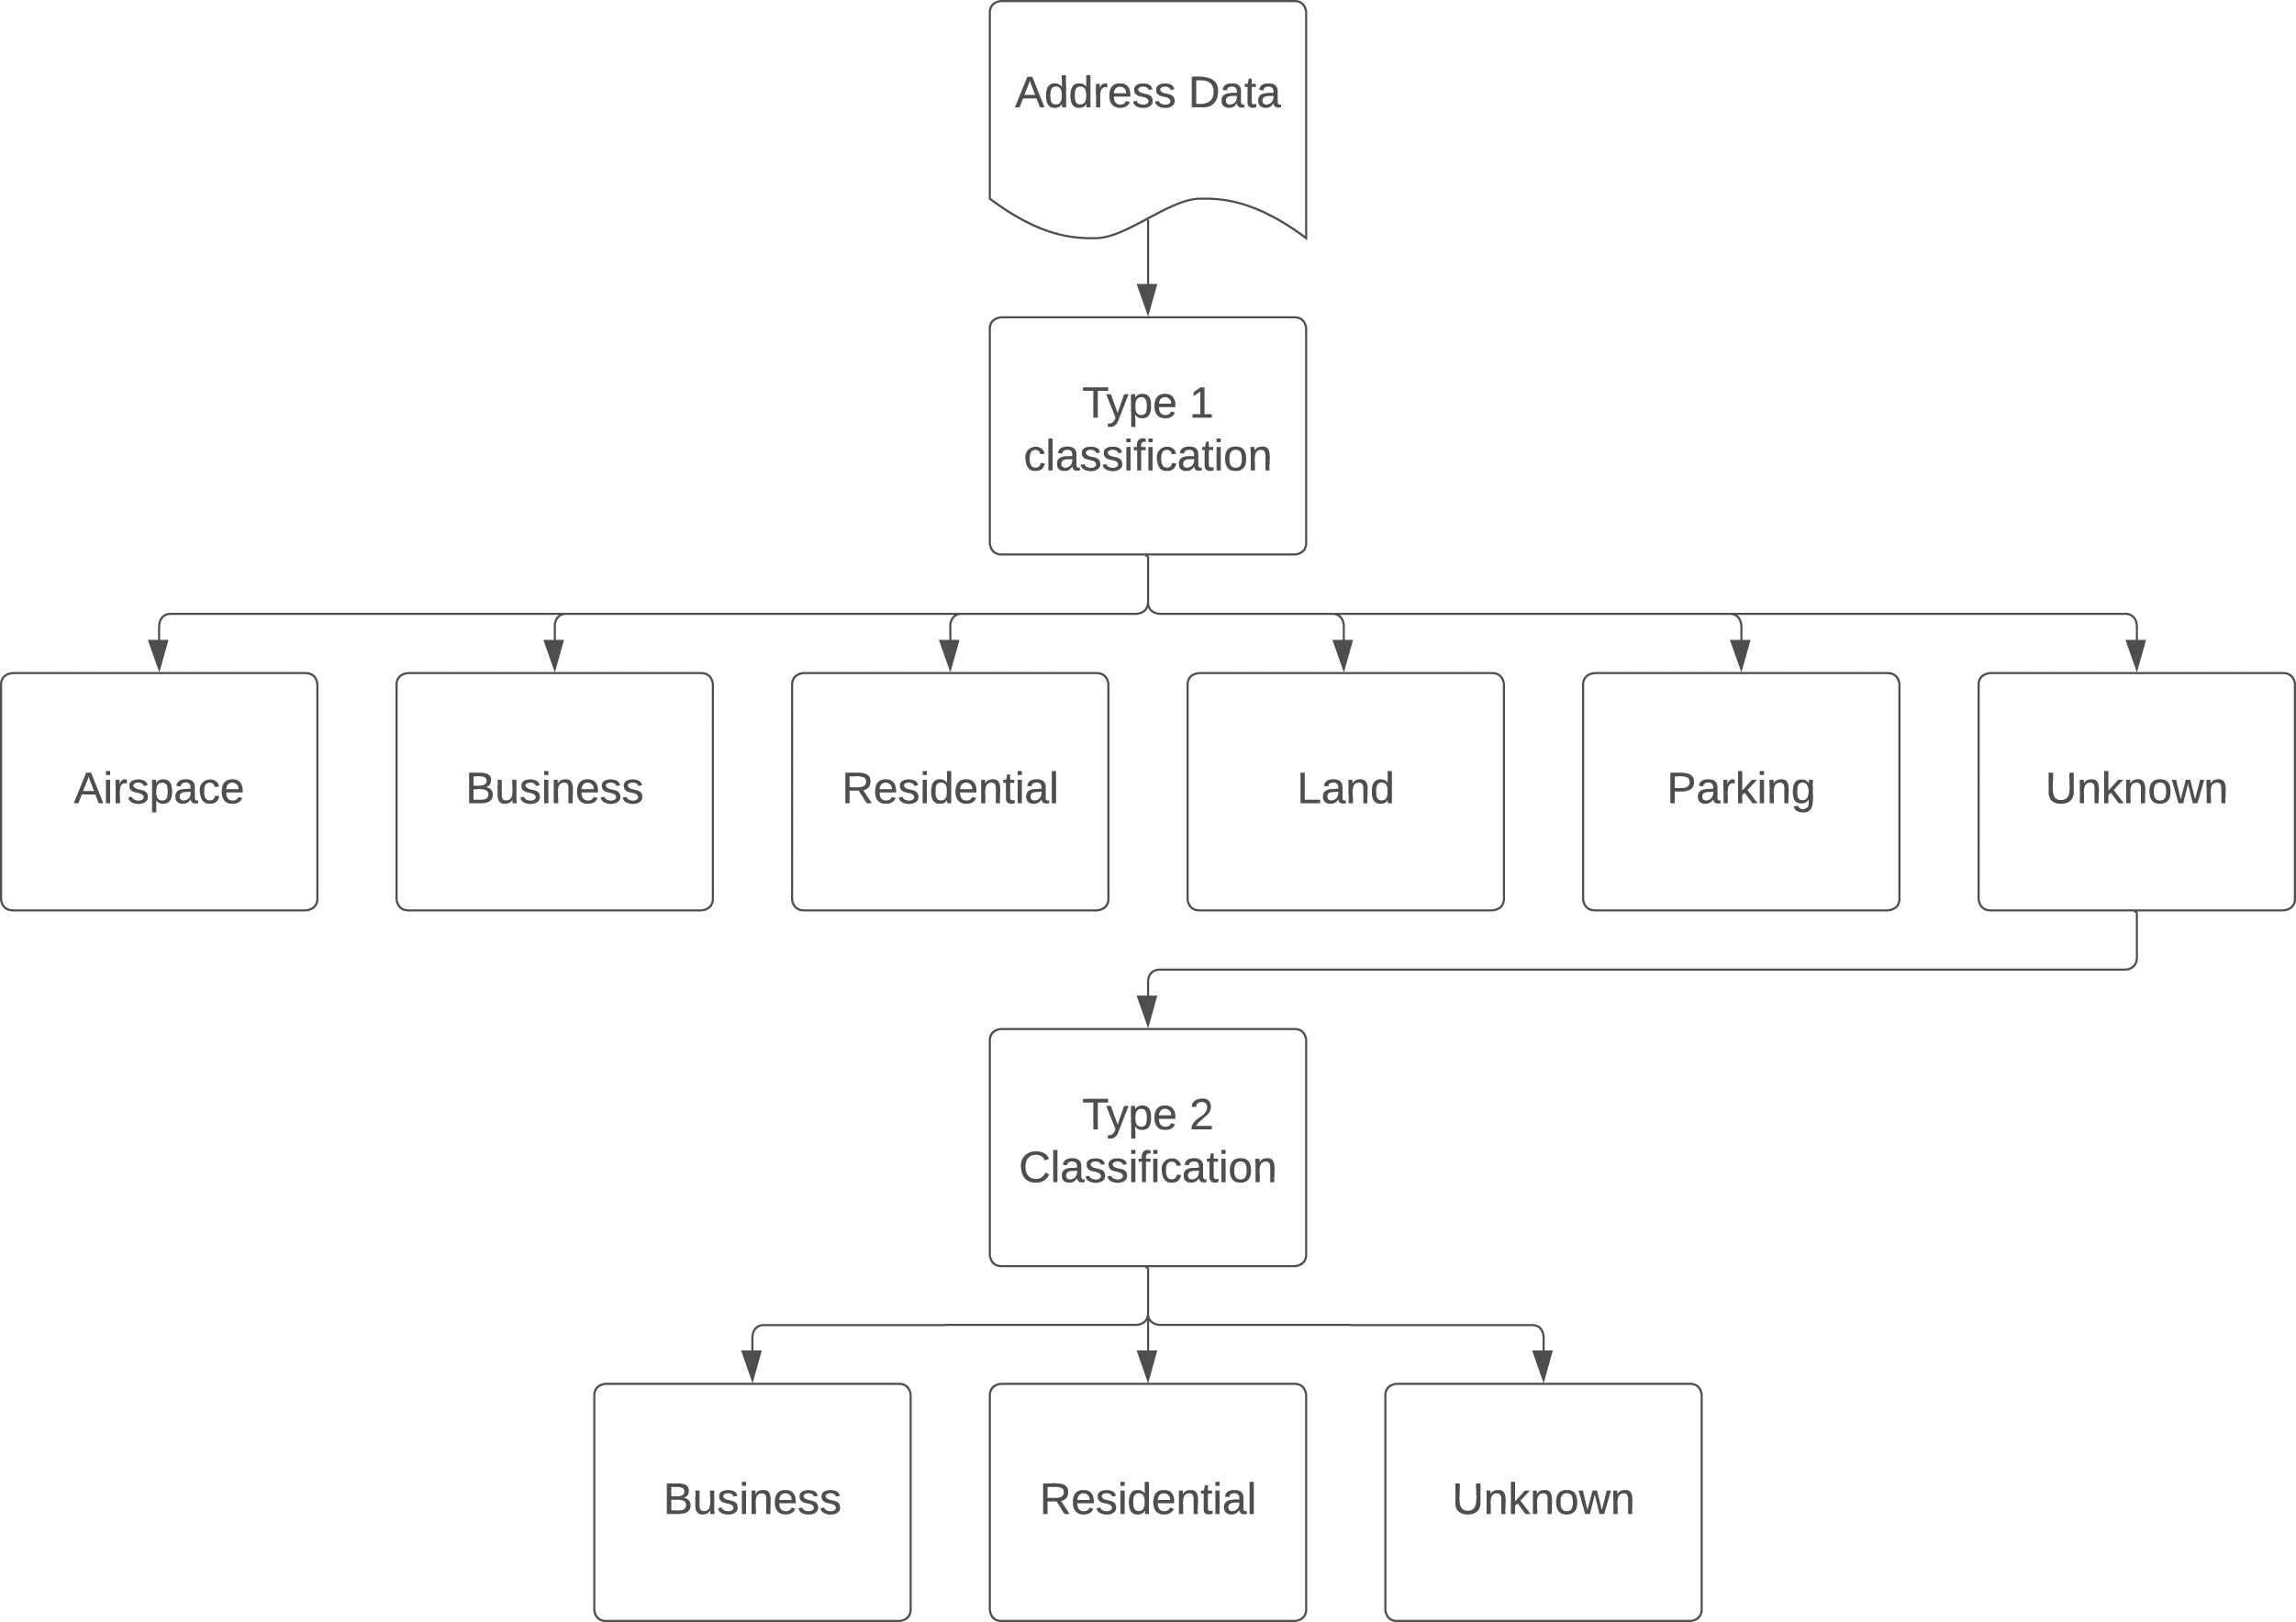
Address contraction
This was the final and most straight forward of the cleaning steps. As it is not unusual for commercial premises to occupy more than one ‘street address’, non-residential properties in a nested property group were reduced back to single address. As a result, only residential properties appear within a nested property title.
Test set and accuracy metrics
Whilst the previous sections have described the steps by which the data was prepared, they do not describe methods to measure the quality of the labelling or classification processes. This is essential because, for the final analysis to be considered reasonable, the data needs to be of high quality. The data was tested by randomly sampling 1000 addresses from the original dataset which were then hand-labelled and held out from any further analysis until the end of the cleaning process. Figure 1 shows that, for practical reasons, the ground truth was created after the initial labelling, in order to speed up the hand-labelling process, as many of the labels were already complete and correct. Finally, the classification quality was assessed. The validity of a class was checked manually by looking up the address using map software, viewing pictures of the property, and doing an internet search of the address to see if it was a residential or a commercial property. This process is certainly not infallible, but without the use of the UPRN system there was no other way to carry out an assessment within a reasonable time frame.
Once the ground truth had been created, performance was measured using the Precision, Recall and F1 metrics.
Precision is the probability of a span exactly matching the ground truth test set. In the binary class, case precision is defined as
Recall is the fraction of matched spans which are also given the correct class, it is defined by
The F1 score is
However, in order to adjust the measure for the multiclass data in this paper, we used the micro-averaged values. Micro-averaging takes the sum of tp, fp, fn across all classes, and uses those summed values to calculate the final Precision, Recall and F1 values. As an example, micro precision can be defined as
Once the final enhanced dataset was created the process of analysis could begin.
Analysing the offshore dataset
The analysis of this paper was performed on each residential property class, where the residential property classes are conventional homes, low-use homes, Airbnb properties and offshore homes. The purpose of the analysis is to understand the differences in behaviour between these property classes and the implications of these differences for the housing market. Three core analyses were performed for this paper: inferring property price, entropy of property and spatial autocorrelation.
The methods having been explained, the next section describes how the total number of URPs were calculated. Due to the low number of samples in certain areas, the LSOA counts will be aggregated to MSOA level for all spatial analysis apart from calculating the total number of unconventional residential properties.
Calculating the total number of unconventional residential properties
The three property types, Offshore-owned, Airbnb and low-use that make up URP are not mutually exclusive and so cannot simply be added together. Instead, the joint probability was found under two conditions: the first was that data are independent; the second was that offshore property is always low-use. The first case is the null hypothesis and acts as the upper boundary, whilst the second condition is based on the assumption that offshore properties are inherently luxury purchases and the owner has multiple homes. The second condition reduces the total number of classes because the offshore properties become a subset of the low-use properties. The probability of a URP in a given LSOA is defined as
Inferring the prices of properties in London
In Bourne (2019), the value of residential property and low-use property was inferred using a simple graphical model. The same technique has been used in this work to infer the value of the distinct URP types as well as for the total number of URPs.
The distribution of the mean price by property type is calculated as shown in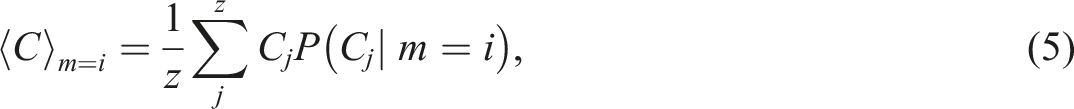
Analysing the entropy of residential property
In information theory, Shannon entropy (Shannon, 1948) is used to describe the amount of disorder within a system of a discrete fixed number of states and is measured in the number of bits of information required to store it. The higher the number of bits the more disorder there is in a system, and conversely, the lower the number of bits the more order there is in a system and the easier it is to describe. The equation for Shannon entropy is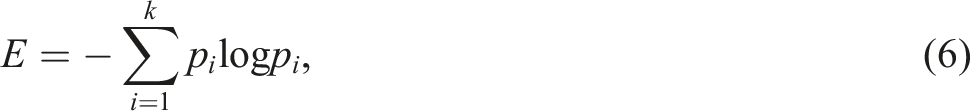
In the spatial analysis being performed here, the entropy describes how concentrated the offshore property types are. The k discrete states in this case are the 983 MSOA in London. The entropy would be minimised if all of a certain property class were found in a single MSOA, whilst entropy would be maximised if the properties were spread evenly across all MSOA. In this way, it can be said that entropy represents how concentrated the property classes are.
Although understanding the concentration of the property is very valuable, it lacks spatial information, and for this we needed to use a measure of spatial auto-correlation.
Analysing the spatial auto-correlation of residential property
Spatial auto-correlation measures the strength of the correlation between objects in physical space and a given variable. That is, if objects close together have very similar values and objects far away are very different, there will be a high auto-correlation value; whilst if objects that are close by have a very different value, there will be a very low auto-correlation value. In this paper, we use Moran’s I (Moran, 1950) as the measure of spatial auto-correlation. Moran’s I is described as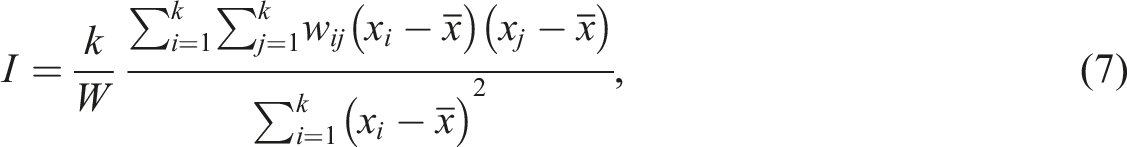
Having described both the data processing and the analysis methods, we now introduce the results.
Results
The Results section is in two parts, the first describing the data processing and the second, the analysis of OCOD+.
Labelling and parsing performance
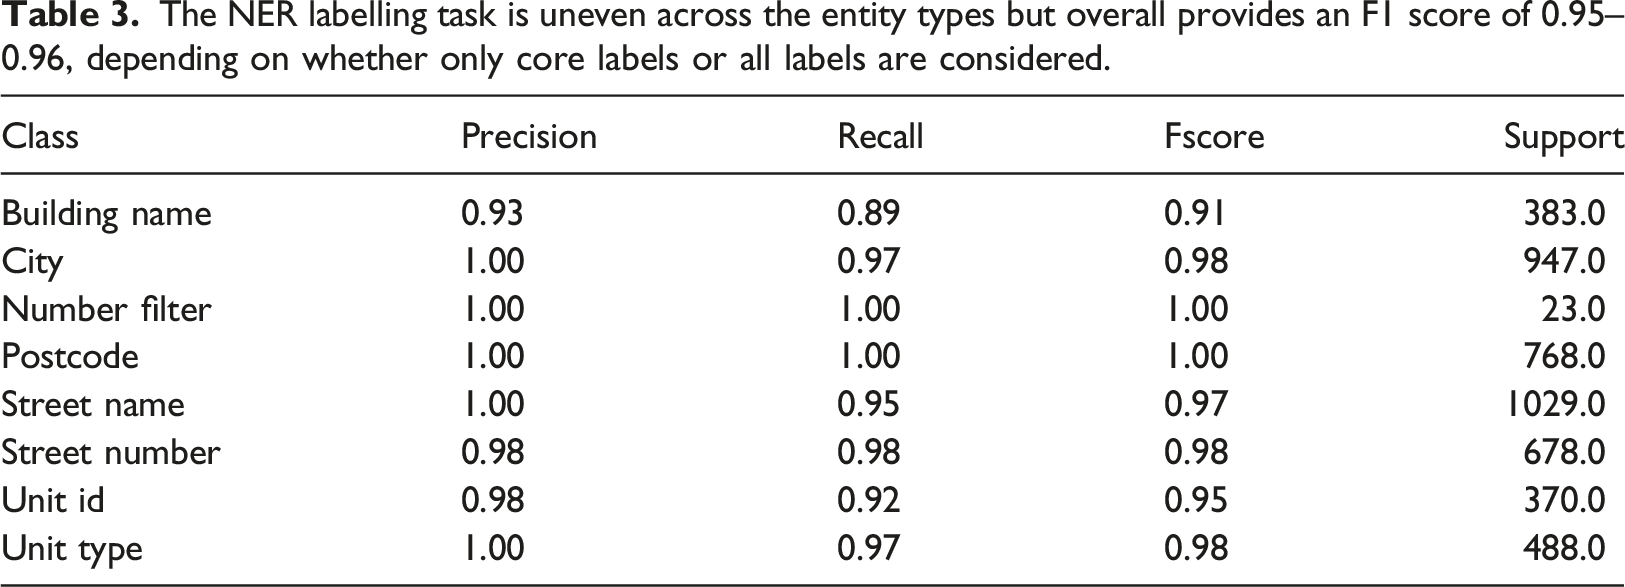
The NER labelling task is uneven across the entity types but overall provides an F1 score of 0.95–0.96, depending on whether only core labels or all labels are considered.
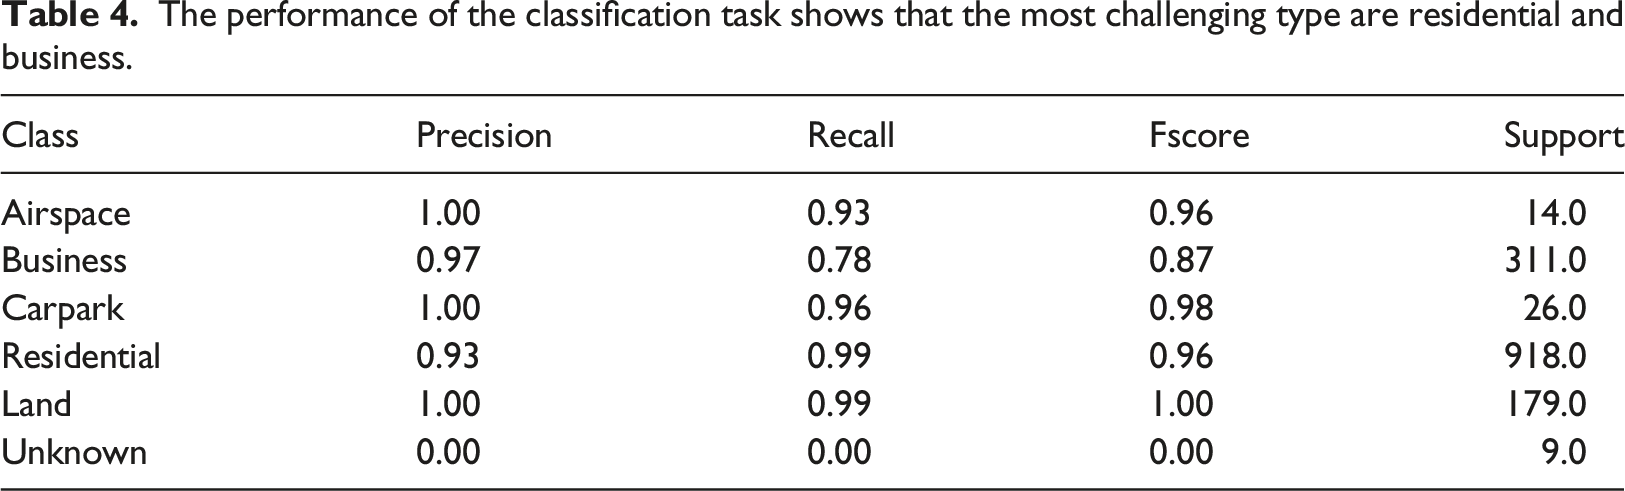
The performance of the classification task shows that the most challenging type are residential and business.
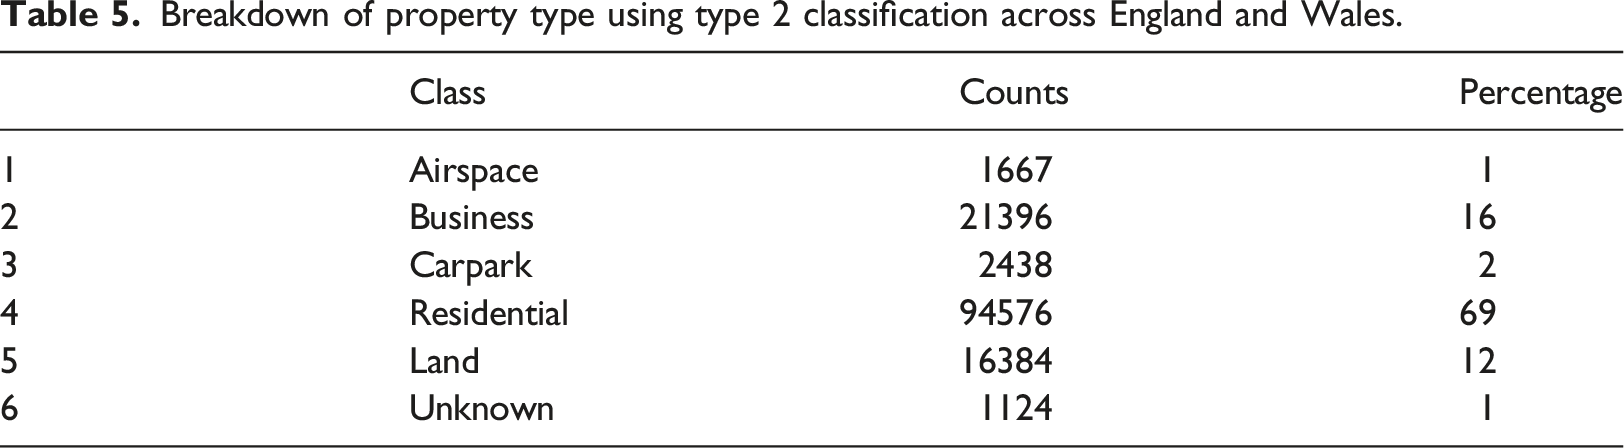
Breakdown of property type using type 2 classification across England and Wales.
Data analysis
The complete metrics list for the analysis of the main property types.
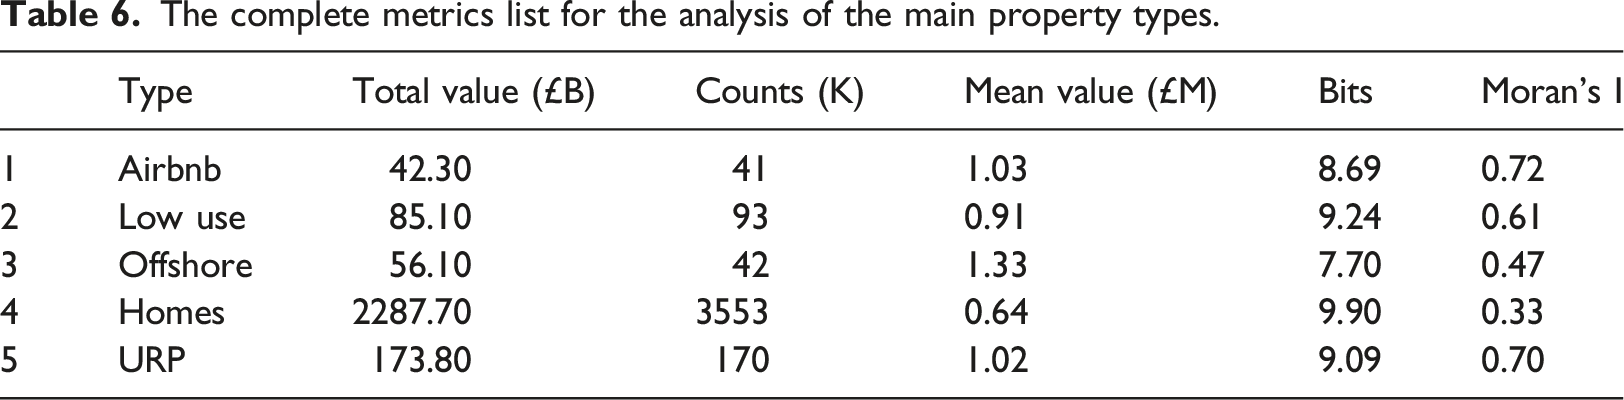
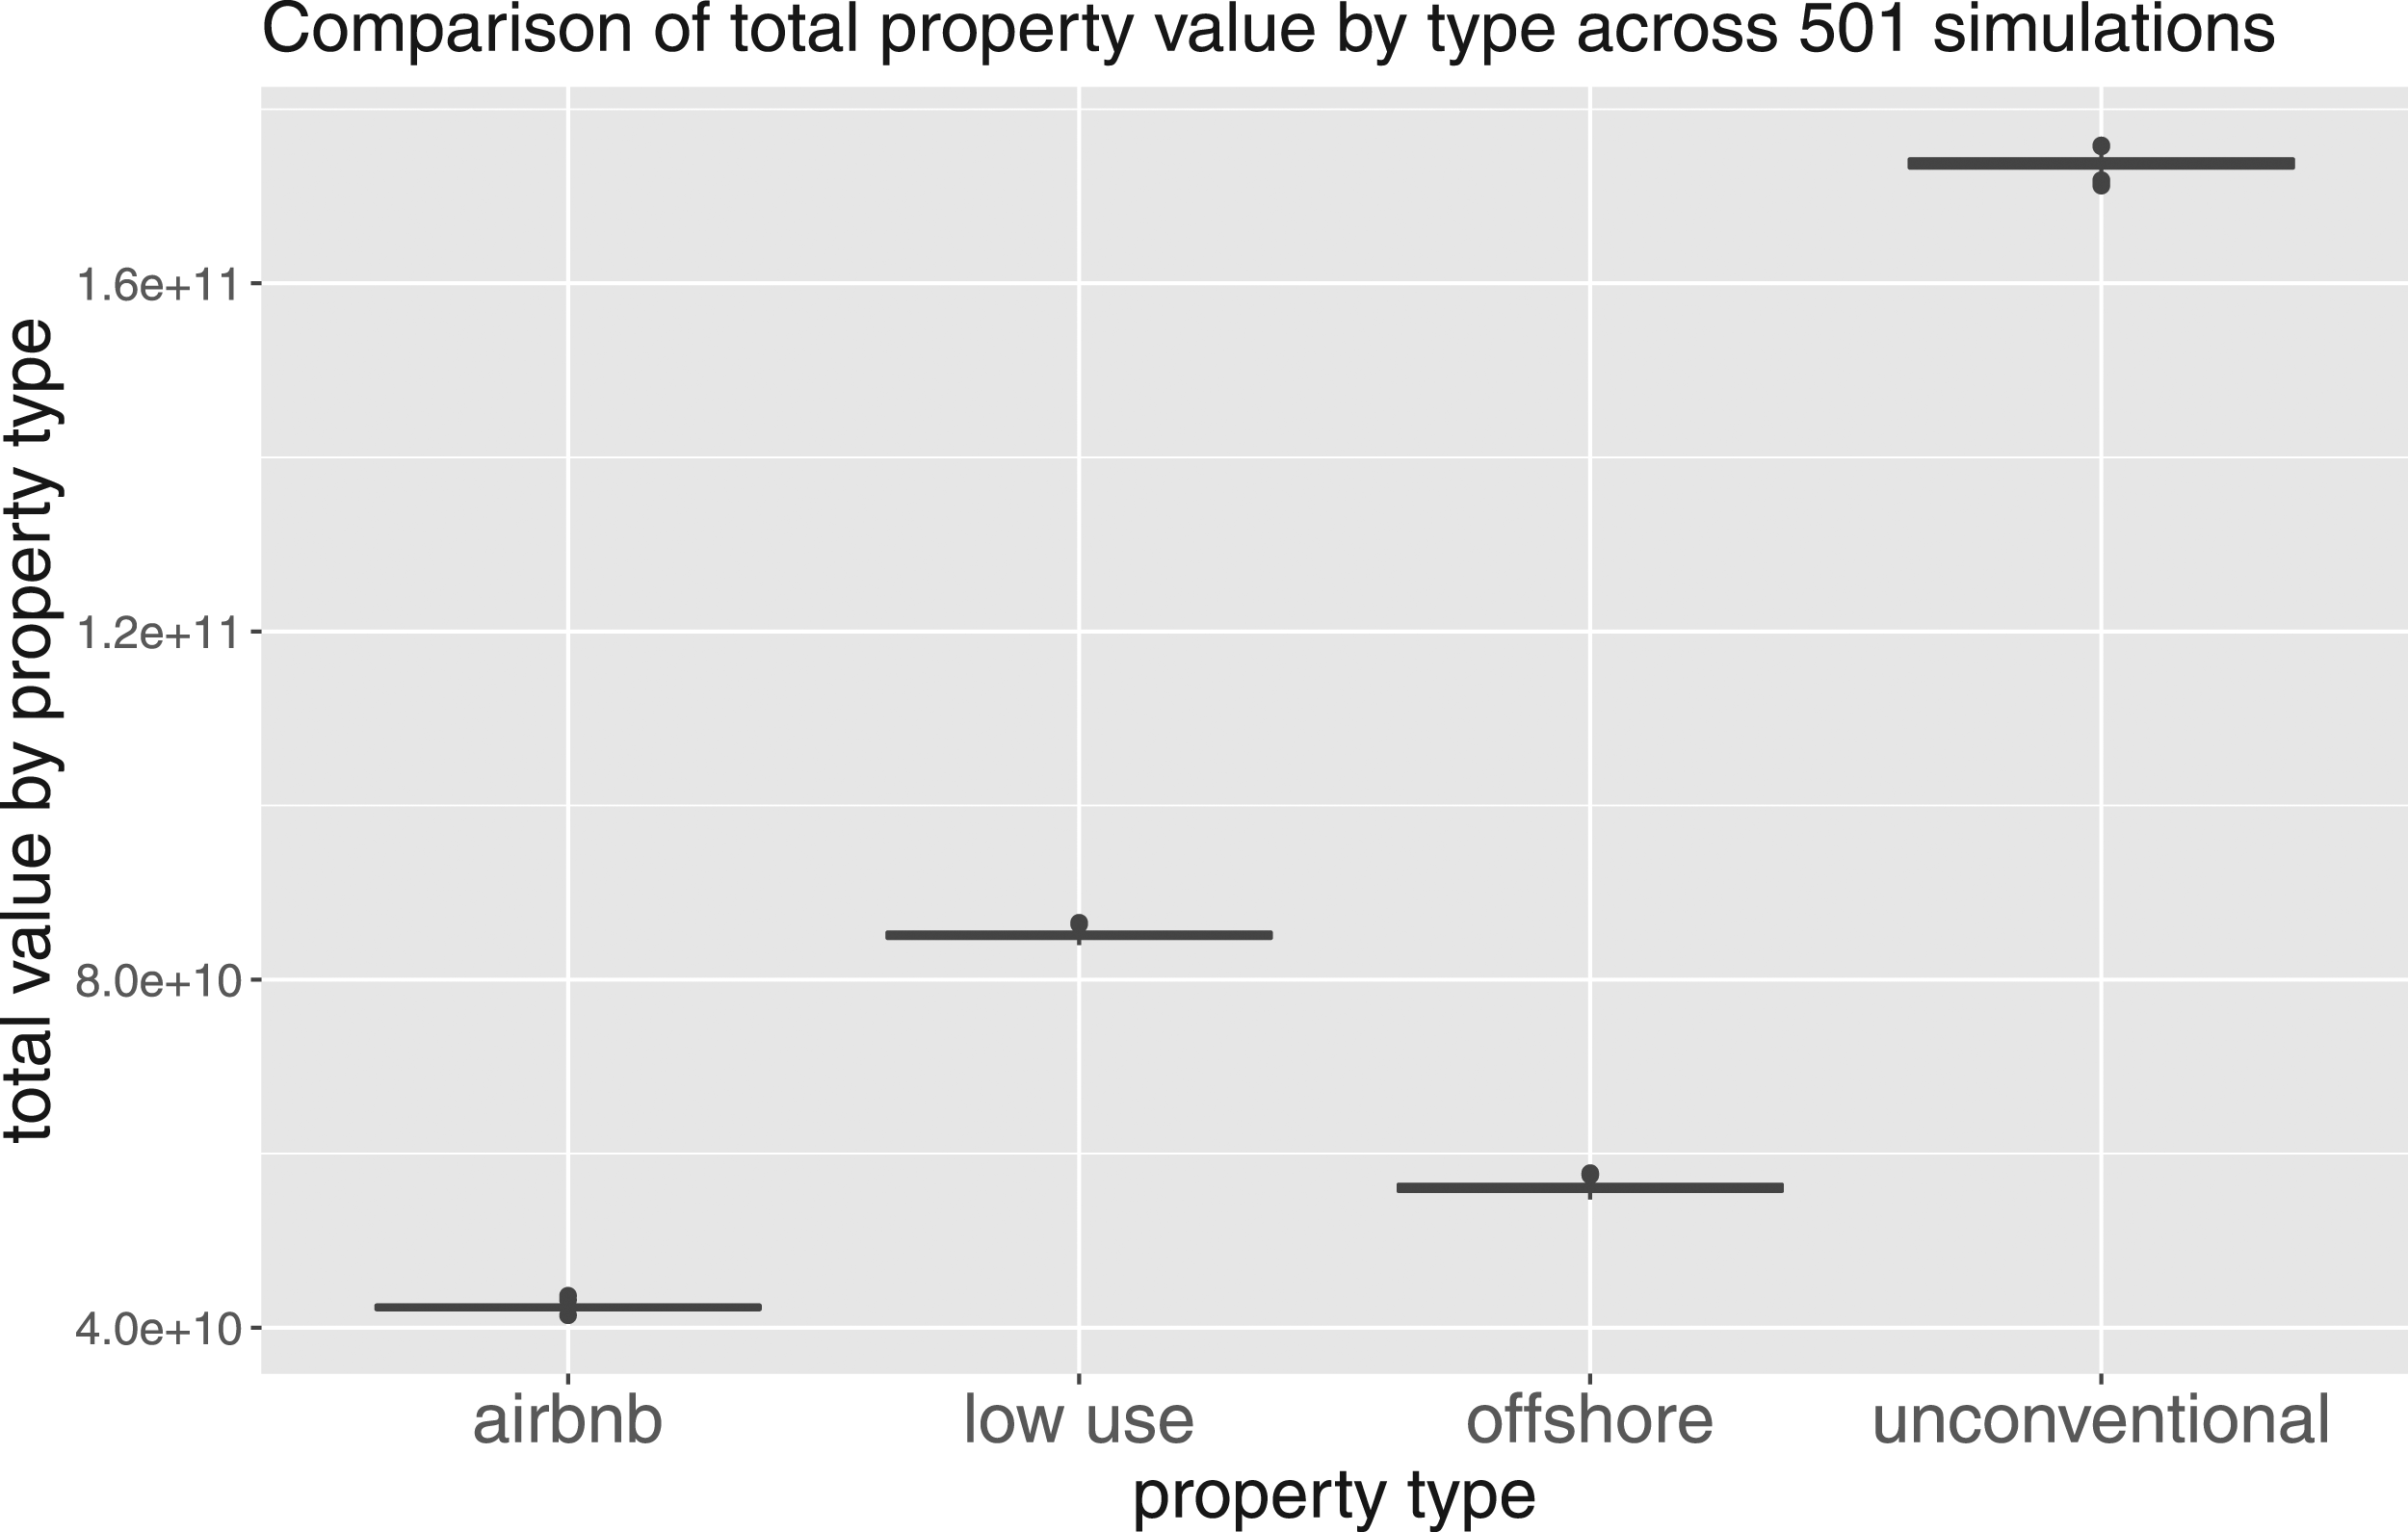
Due to the number of low-use homes, their total value dwarfs that of the offshore residential property, even though offshore residential property is substantially more expensive.
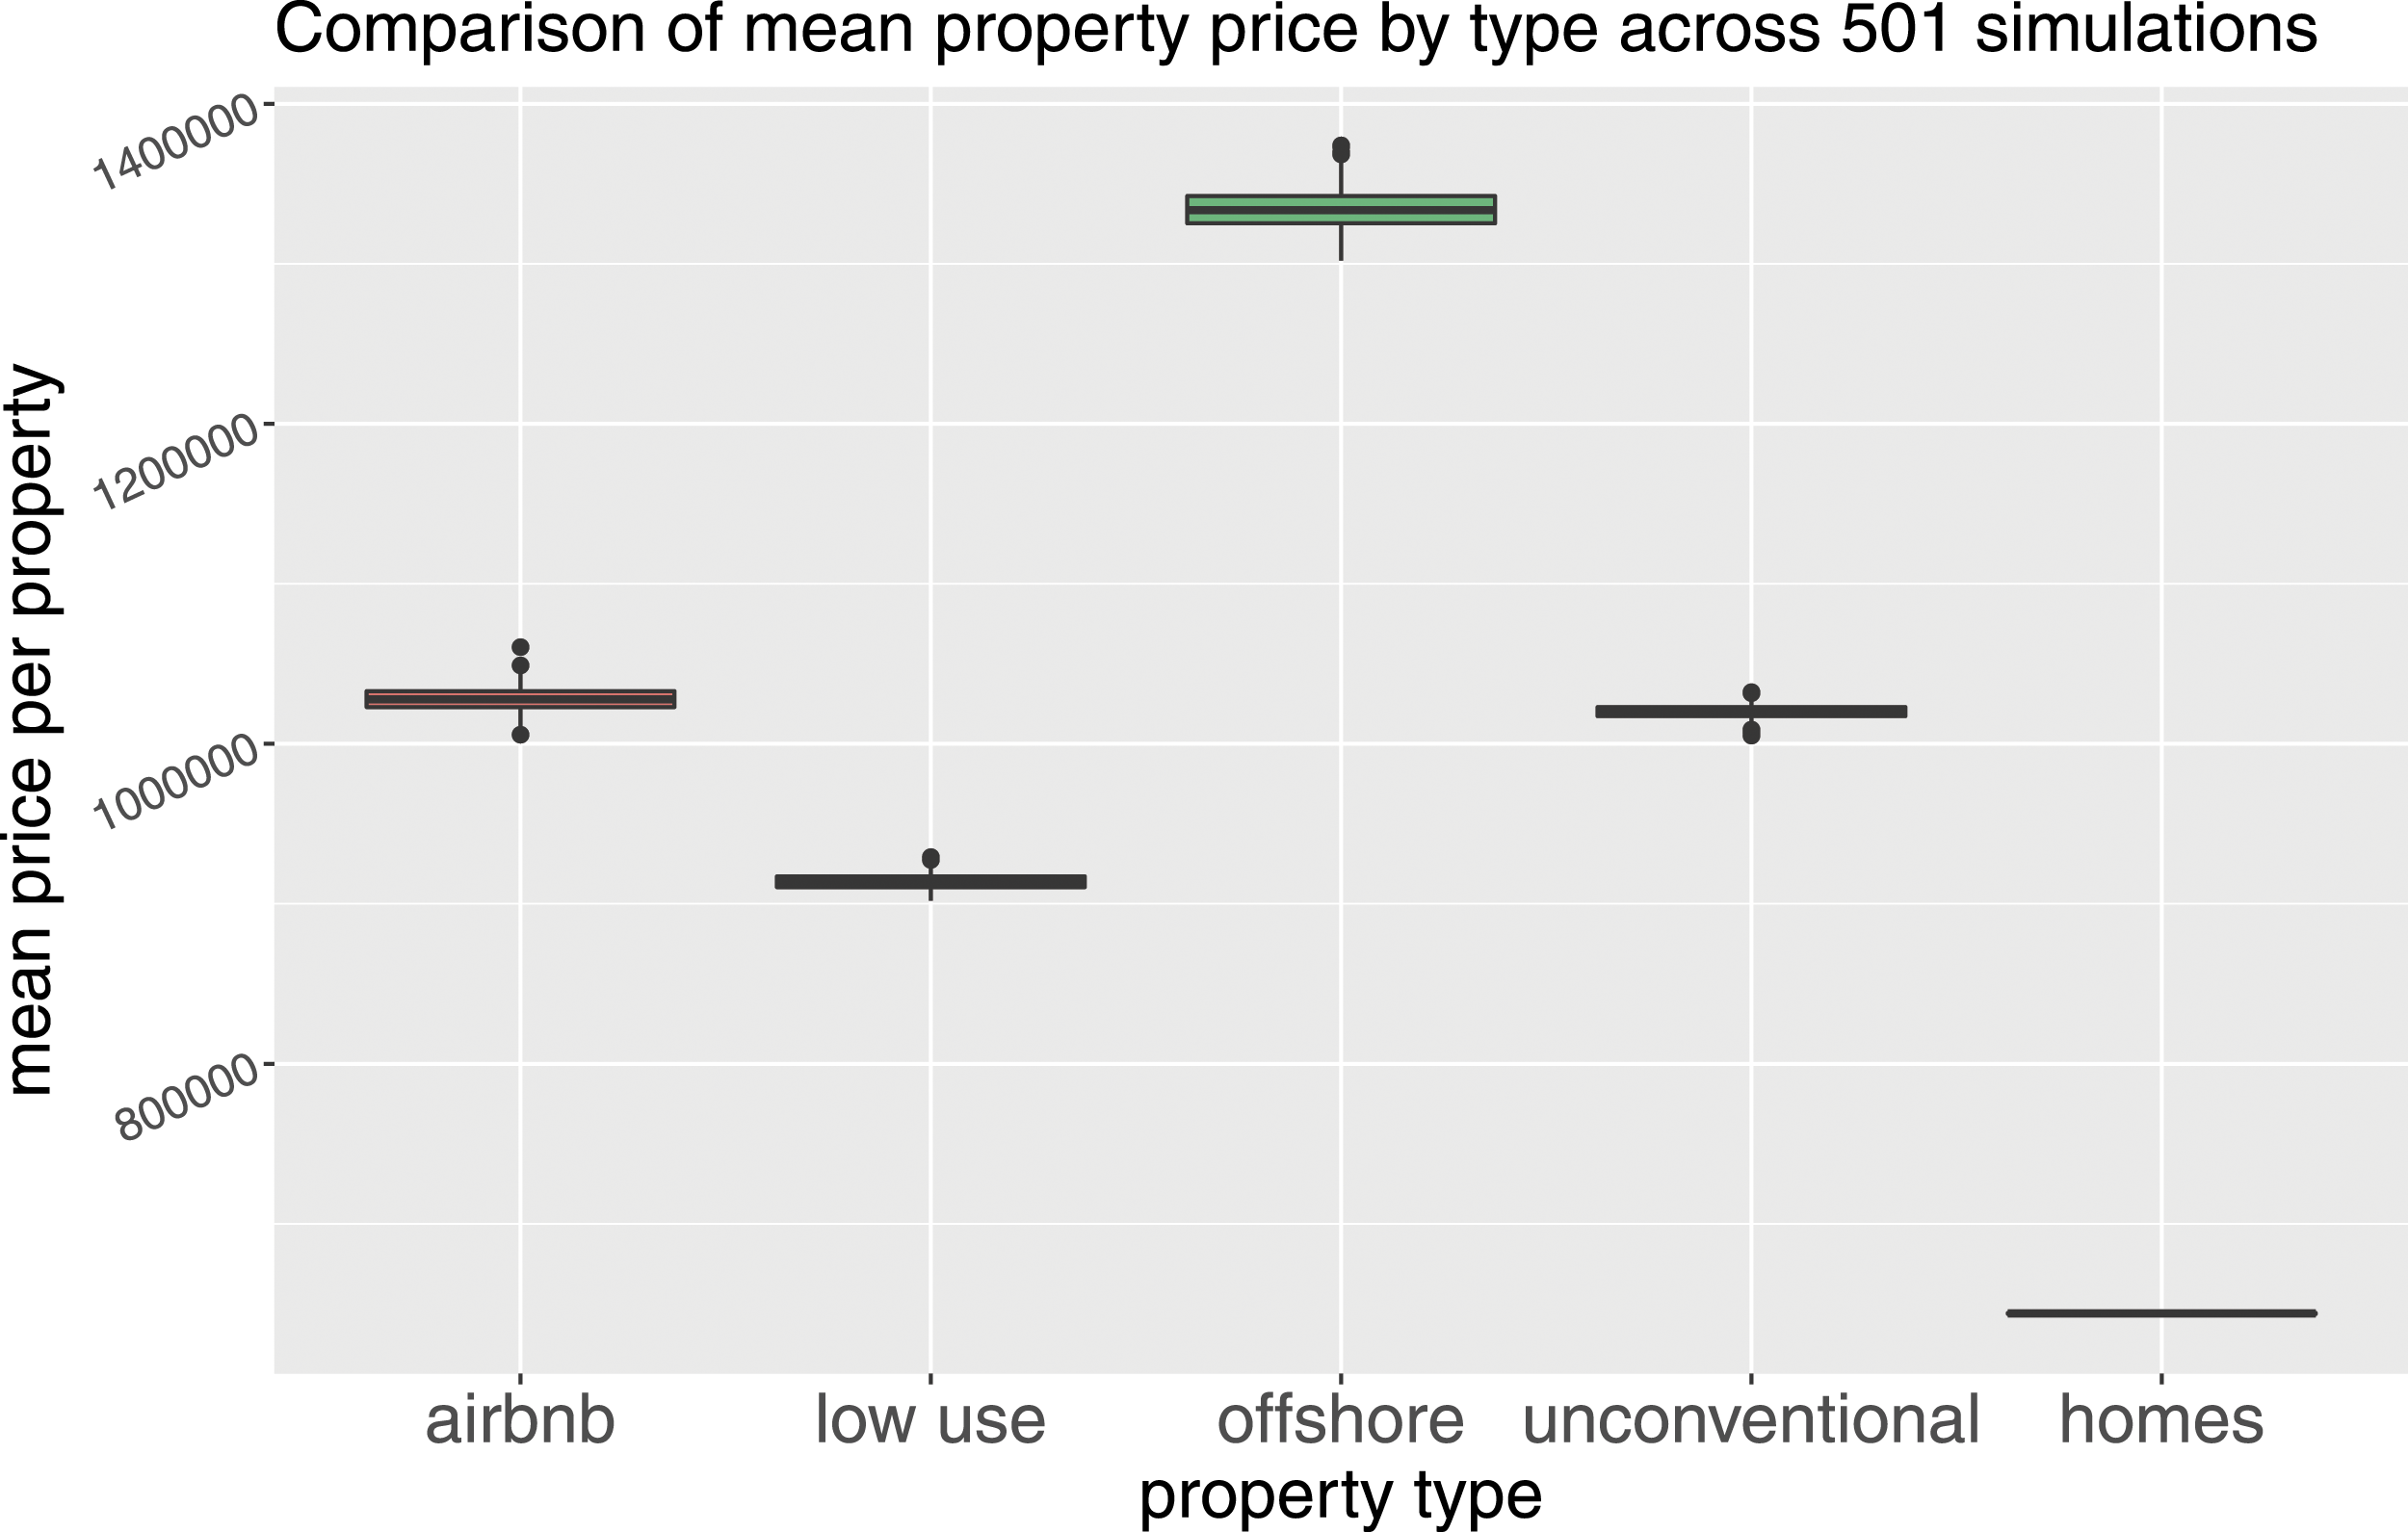
All three of the property types under analysis are worth substantially more than regular homes in the capital. In particular, Airbnb properties are worth more than low-use homes, highlighting the importance of location for this property type that exceeds that of general low-use property. However, offshore property is by far the most expensive of all the property types.
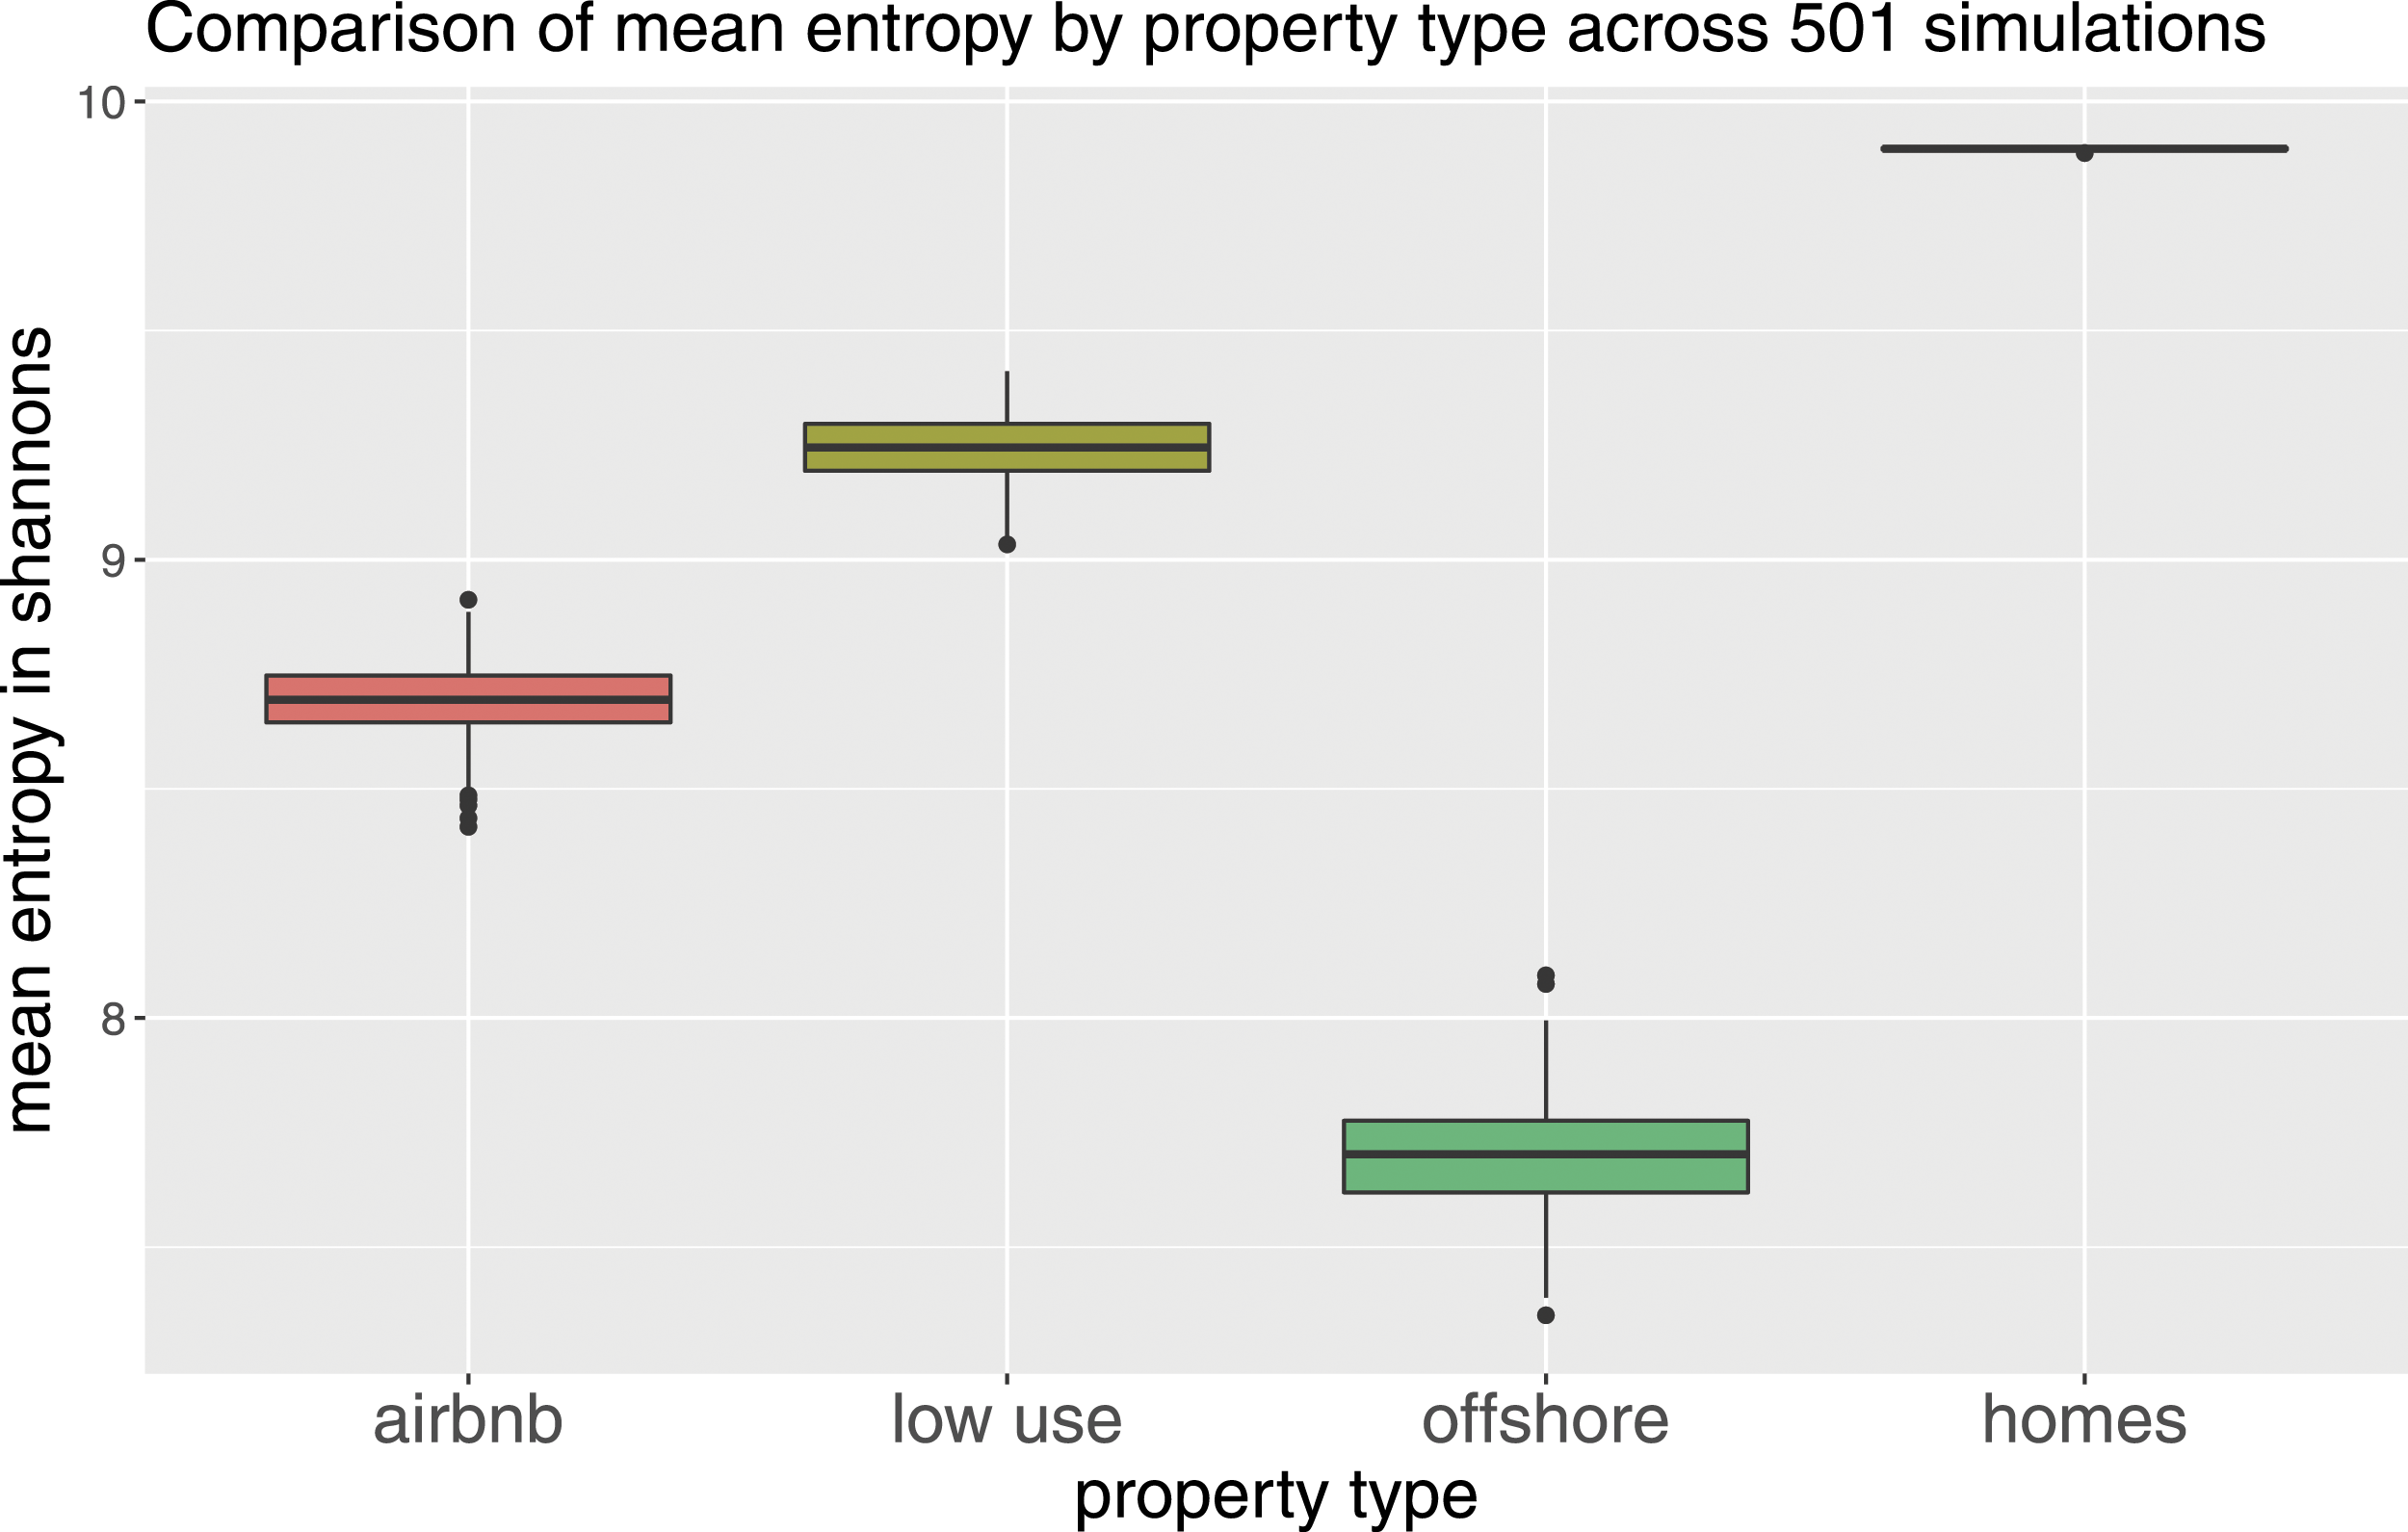
Figure 5 shows the distribution of the different property types across the capital. The map shows that offshore property is the most concentrated with a large proportion focused in the centre of the city. Airbnb properties are not as concentrated but appear to have high levels of spatial auto-correlation. In contrast, the distribution of empty homes appears to be relatively widely dispersed and with lower levels of spatial auto correlation. The visual interpretation of Figure 5 is supported by the quantitative analysis using entropy and Moran’s I. Figure 6 shows that the entropy of offshore property is substantially higher than that of the other property types. The mean entropy of the different property types is 7.70 for offshore, 8.69 for Airbnb, 9.24 for low-use and 9.09 for all URPs. This entropy ranking matches the mean value ranking of the property types, but this is not the case with the spatial auto-correlation. Table 6 shows that offshore property has low spatial auto-correlation (0.47) compared to the other URP types (Airbnb 0.72, low-use 0.61). It should be noted that Figures 3 and 4 have very small variance, and there is little doubt that the differences between the categories are statistically significant. Looking at the maps clearly shows that there is a significant difference in the distribution of the three property types. Offshore residential property has some extremely high concentrations, for instance, where an entire housing development is owned by an offshore company. Grey areas have no properties of that type present. The entropy of the property types appears inversely proportional to the value, indicating that the offshore, Airbnb and low-use properties are not only more concentrated geographically than normal homes, but are more concentrated into high value areas.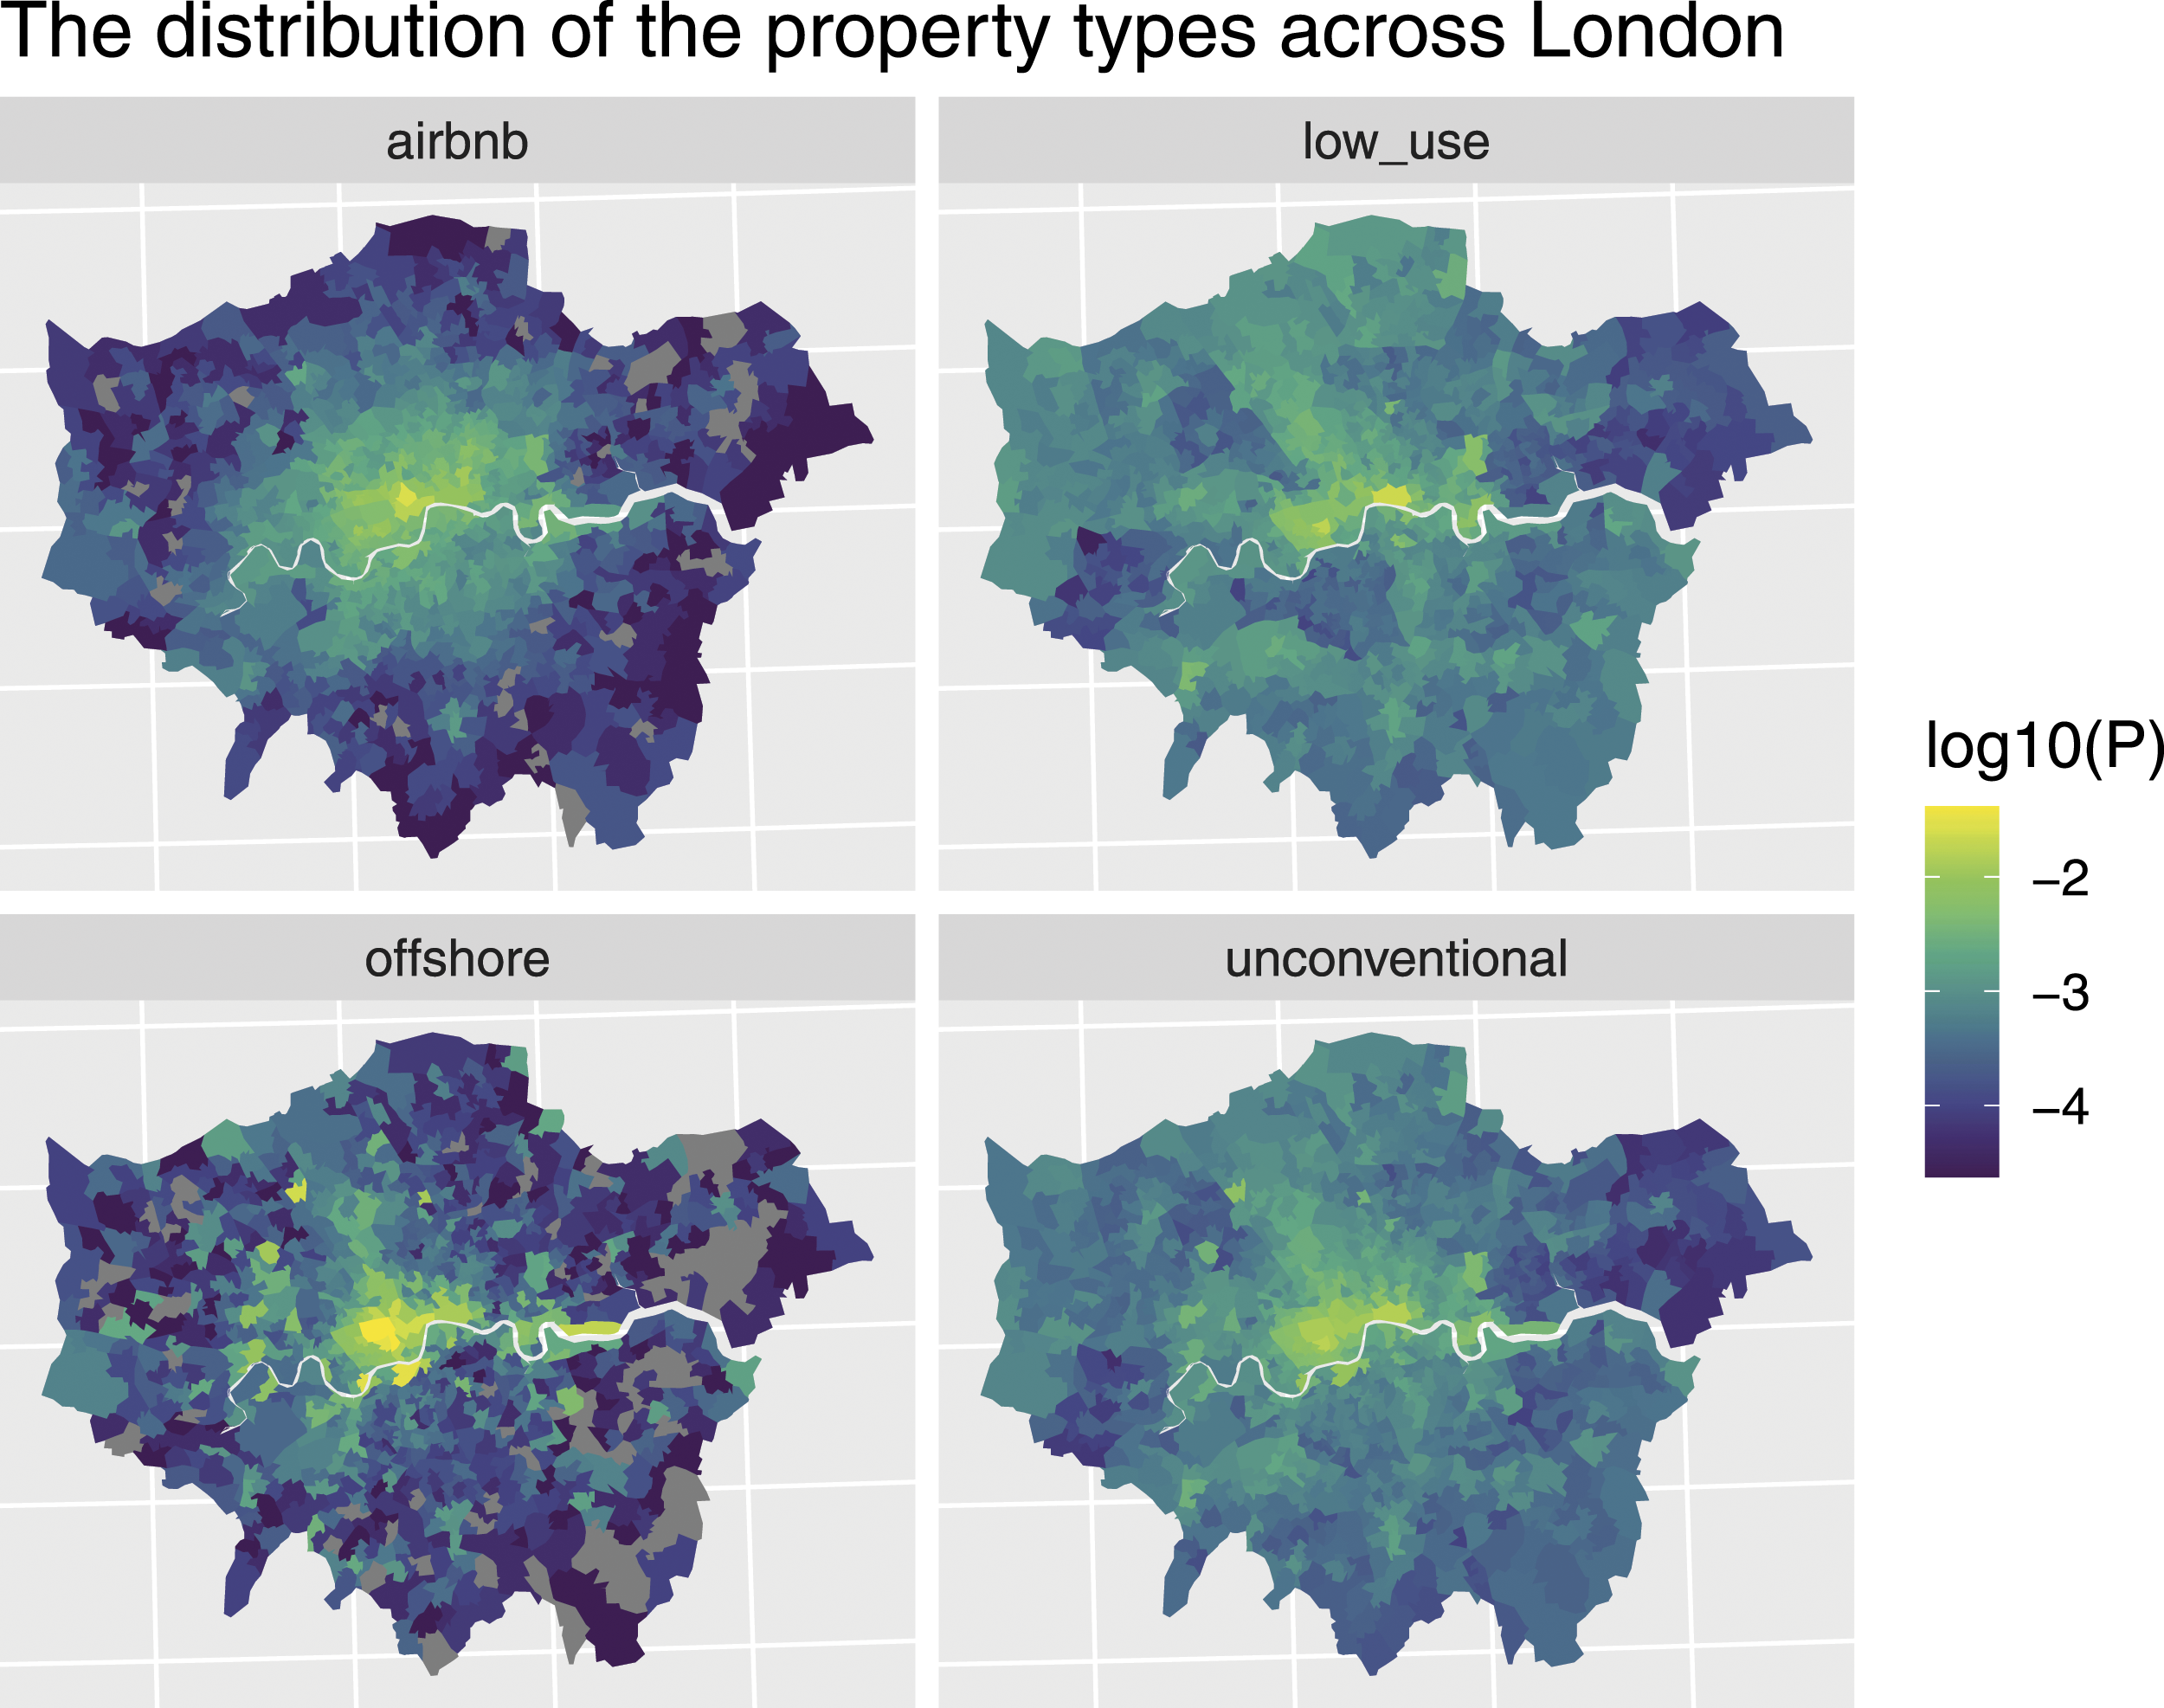
Nested versus single offshore properties
The complete metrics list comparing nested and single offshore homes.
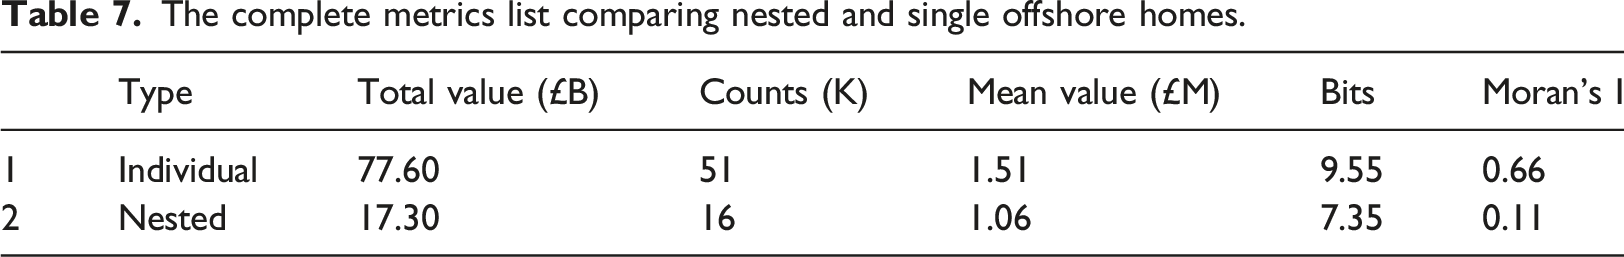
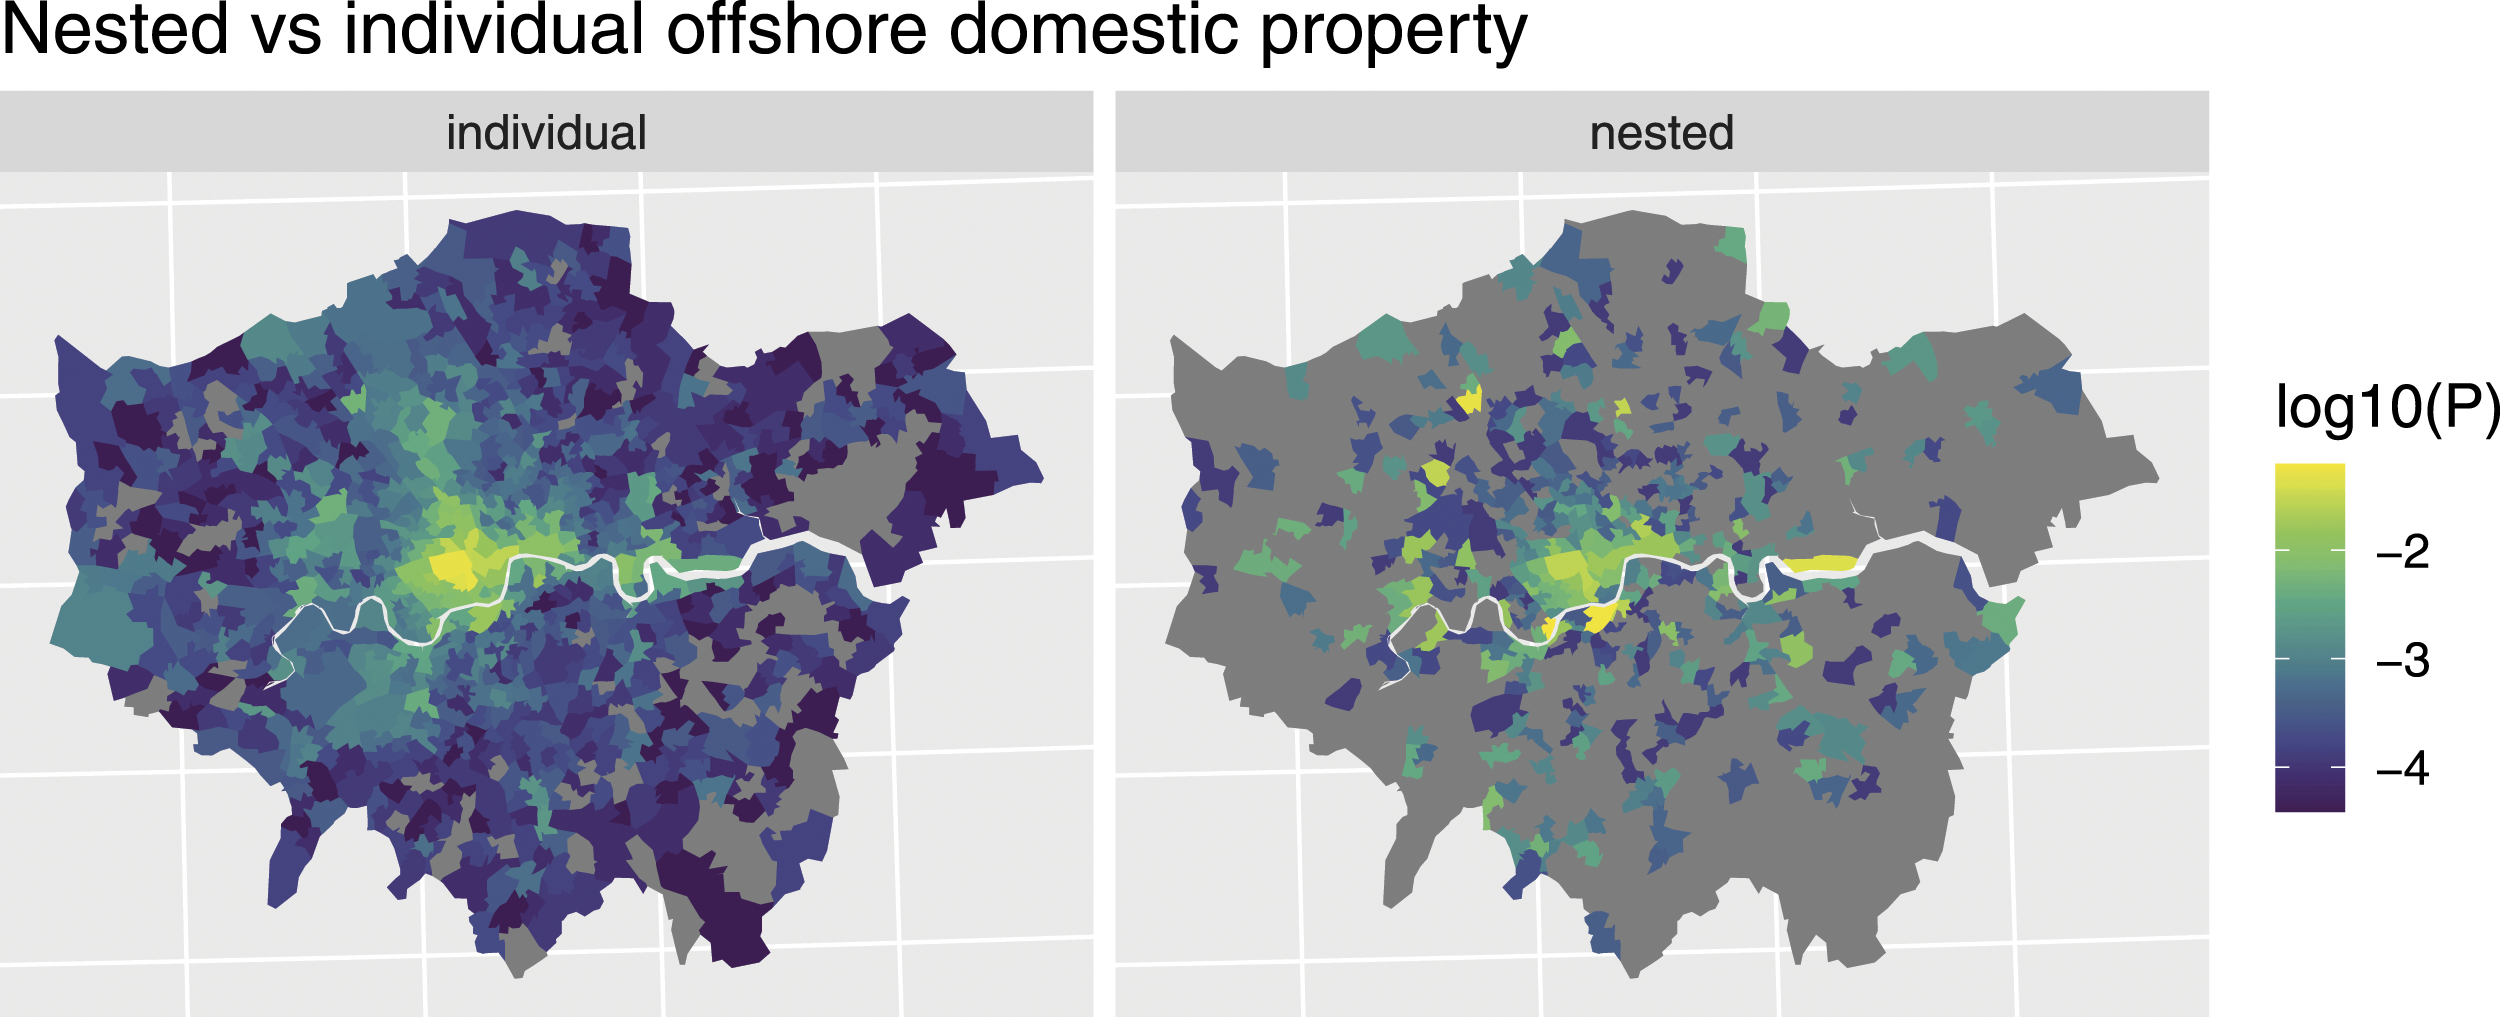
Comparing the nested versus normal property shows very different spatial patterns. These patterns correspond to large average differences in value. Grey areas have no properties of that type present.
Country of incorporation
There are clear patterns in the London residential property market with regards country of incorporation of offshore companies. Whilst there are properties associated with 133 different countries or territories, 50% of the properties are related to companies incorporated in the three crown dependencies of Jersey, Guernsey and the Isle of Man. A further 30% of properties are associated with one of the British Overseas Territories. In fact, four territories – British Virgin Islands, Jersey, Guernsey and The Isle of Man – are associated with 78% of all properties. Looking at the relationship with nested properties, there is an over-representation of nested properties in the Crown Dependencies and the BVI which represent 74% of all nested titles and 91% of all nested properties. Jersey alone represents 52% of all nested properties. More detail can be found in the Supplementary Material Section 5.
Discussion
The overall labelling quality was high: an F1 score of 0.96 suggests that the data is effectively labelled and provides confidence in the quality of the final addresses. This also shows that the deduction used in the Type 2 classifier is a robust approach. As well as this, the final classification values had strong performance across the categories, although separating businesses and residential properties was problematic at times. Improving the performance of the NER process would require a more in-depth analysis of why buildings were not being captured at the same level as the other entities: such analysis would possibly involve the use of large-scale visual data which is beyond the scope of this paper. Recall was notably lower for the ‘Buildings’ labels. This was partially due to the complexity of building names, but the high Precision suggests that there may be some patterns which have not been properly addressed. A failure to identify patterns equally across all building names highlights a drawback of the Weak Learning approach and the risk of inducing systemic bias. It was surprising that the RoBERTa based spaCy model did not improve performance, but this may be because the structure of the addresses is so simple and regular that the attention abilities of the transformer could not add any value. The lower Recall and Precision scores for Business and Residential properties was mostly due to these two classes being difficult to separate. This challenge highlights the importance of the UPRN system in the UK. It should be noted that a Freedom of Information request was sent to both the VOA and the Land Registry asking for the UPRN data; however, both FOI’s were rejected.
Although undoubtedly the most appropriate choice for the OCOD dataset, the parser developed for this paper is a niche product designed for a single use case and is unlikely to offer the robustness or flexibility of already-available general-purpose parsers such as Deepparse (Yassine et al., 2020) and libpostal (Barratine, 2017). We would not recommend it as a first choice for parsing data other than the OCOD dataset and possibly other UK government address data. The code for creating OCOD+ is publicly available under a GNU GPLv3 license, and Section 4 of the Supplementary Material appended to this paper provides an in-depth description of the training details.
Having the trained pipeline available means those who wish to use OCOD+ can do so for any past or future release of the Land Registry’s OCOD dataset.
The results of analysing OCOD+ show that there is a substantial amount of URP in London (Property that is either low-use, Airbnb or offshore-owned). There is an estimated £145-174 billion worth of URP in London. This is approximately 7.5% of the total residential value, and of this there is approximately £56 billion worth of offshore-owned property, representing 42 thousand dwellings. The high average value and central positioning of these properties matches the concept of ‘Leisure-related Investment’ – that is, property which has the dual purpose of enjoyment and making a financial return (Paris, 2009). In addition, the quantity and concentration of URPs in central London could provide a basis for the property price increases discussed in Sá (2016) and Guerrieri et al. (2013). We found that there were two distinct types of offshore property – single and nested. The single properties may be under-valued, as an analysis of the prices in the OCOD dataset suggests a mean value of £3 million whilst the empirical sample only returns £1.5 million. However, due to data quality concerns with the values reported in OCOD, the mean reported value should only be considered as context. In the dataset of nested properties, properties sharing a title number are mostly entire housing complexes and have very different spatial patterns from the individual offshore properties. Individual offshore properties are very expensive even by the standards of URP, and in addition they are concentrated on the centre of London with strong spatial auto-correlation. In contrast, nested offshore property is somewhat less concentrated on central London but more highly concentrated in general, but with almost no spatial correlation. The finding that offshore-owned property of the ‘individual’ type is more expensive than the other property types agrees with previous research that London property is used as a form of investment by the international ultra-wealthy (Fernandez et al., 2016) and as such are likely to be low-use as well as offshore-owned. The high value of these individual offshore-owned properties reinforces the findings of previous research and discussion related to money laundering in the London property market that found extremely expensive property was an effective way to launder funds (De Simone et al., 2015), (Question 2 Bullough et al., 2018).
Data relating to country of incorporation was also briefly analysed. Four territories control 78% of all offshore-owned residential property London: the three UK Crown Dependencies (Jersey, Guernsey, The Isle of Man); and the British Overseas Territory of the British Virgin Islands. . Such findings are supported by the witness testimony presented in Tugendhat et al. (2018).
Whilst the impact of UK-Government (2022) cannot be known, OCOD+ can be used to measure changes in behaviour in the offshore-owned property market. In addition, combining the register of beneficial owners with OCOD+ allows the analysis of country of ownership rather than just country of incorporation.
Conclusion
This paper proposes a new method of identifying and classifying offshore-owned residential property in England and Wales. Using the dataset created by this method, we have shown that offshore-owned residential property in London is not a homogeneous group, but contains at least two distinct types, characterised by measurable quantities and appearing to relate to purpose and country of incorporation. We have also shown the distribution and value of three different types of URP and that all three property types are more concentrated and more expensive than conventional residential property. Mapping and characterising the three types of URP is valuable as they are frequently accused of distorting the value of the housing market 2 so understanding the extent of URP property types can provide quantitative evidence upon which these discussions can build.
Whilst this paper does not suggest any causal relations or make any policy proposals, it provides for the first time a clear map to understanding the characteristics and value of offshore-owned residential property and low-use property in London. Put another way, the paper is able to look inside the laundromat, count what’s there, and how much it is worth, but does not differentiate between what is clean and what is dirty. The data produced by this research can be used by sociologists, economists and policy makers to ensure that attempts to reduce money laundering and high property prices are based on detailed data that reflect the real situation. In addition to the findings of the analysis, the paper has created a high-quality open-source dataset that allows further research, and a code pipeline to create new datasets as required. It has been said that fighting money laundering requires openness and transparency (Mitchell et al., 1998). The OCOD dataset was a step in that direction: we hope that OCOD+ is the next.
Future work
OCOD+ can be used for a wide variety of projects. Future work can expand the offshore analysis to the whole of England and Wales. Building on the work of Sá (2016), and analysis of the nested offshore properties can explore whether offshore-owned properties are vehicles for gentrification. Some of the properties appearing to have unusual characteristics, in the work of Unger and Ferwerda (2011) could be used to identify whether these properties may be being used for money laundering. Although the inferred average prices are a good guide for understanding the value of property in the OCOD dataset and URPs, combining the dataset with property sizes using Chi et al. (2021), as well as the Price Paid Dataset, would provide substantially more accurate estimates.
Supplemental Material
Supplemental Material – What’s in the laundromat? Mapping and characterising offshore-owned residential property in London
Supplemental Material for What’s in the laundromat? Mapping and characterising offshore-owned residential property in London by Jonathan Bourne, Andrea Ingianni and Rex McKenzie in Environment and Planning B: Urban Analytics and City Science
Footnotes
Acknowledgements
Declaration of conflicting interests
The author(s) declared no potential conflicts of interest with respect to the research, authorship, and/or publication of this article.
Funding
The author(s) disclosed receipt of the following financial support for the research, authorship, and/or publication of this article: The authors thank Trust for London (grant number MAIN-S2-06.10.2020-8792(6930)) for funding this research. We would also like to thank Kingston University for providing additional research funding. Finally we would like to thank UCL for funding the publication of this paper.
Supplemental Material
Supplemental material for this article is available online.
Notes
Author biographies
References
Supplementary Material
Please find the following supplemental material available below.
For Open Access articles published under a Creative Commons License, all supplemental material carries the same license as the article it is associated with.
For non-Open Access articles published, all supplemental material carries a non-exclusive license, and permission requests for re-use of supplemental material or any part of supplemental material shall be sent directly to the copyright owner as specified in the copyright notice associated with the article.