
Abstract
Urban planning relies on the definition, modelling and evaluation of multidimensional phenomena for informed decision-making. Urban building energy modelling, for instance, usually requires knowledge about the energy use profile and surface area of each use that takes place within a building. We do not have a detailed understanding of such information for mixed-use developments, which are gaining prominence in urban planning. In this paper, we developed a methodology to quantitatively define the characteristics of mixed-use developments using archetypes of programme profiles (ratios of each programme type) of a city’s mixed-use plots. We applied our methodology in Singapore, resulting in 163 mixed-use zoning archetypes using Singapore’s master plan data and Google Maps API data. In a case study, we demonstrated how these archetypes can be used to provide more detailed data for urban building energy modelling, including energy demand forecasts and energy supply system design. To enable future automation of the workflow, the archetype definitions were represented and stored as a machine-readable ontology. This ontology can later be extended with for example, the mobility properties of archetypes; thus, enabling the archetypes' use in other urban planning applications beyond building energy modelling.
Keywords
Highlights
⁃ We develop a methodology to understand mixed-use developments using master-planning data and Google Maps API data. ⁃ We formulate 163 mixed-use zoning archetypes in Singapore using machine learning methods. ⁃ We demonstrate how these archetypes impact urban building energy modelling. ⁃ We represent these archetypes as an ontology called ontoMixedUseZoning.
Introduction
Mixed-use developments feature in master plans of cities worldwide (City of Toronto, 2017; Greater London Authority, 2021; Urban Redevelopment Authority, 2019). These developments are zoned in such a way that they generally allow a variety of different land uses to co-exist on the same (land) plot. For example, a plot assigned with a mixed-use zoning type in a city’s master plan could combine a mix of land-use types, such as residential, commercial and office uses. Zoning legislation often specifies permitted and non-permitted combinations of uses at different levels of granularity (e.g. at the zoning or land-use level).
Mixed-use developments can be implemented simply to increase conveniences for inhabitants (i.e. increased access to amenities), and mixing uses with various busy hours may also improve an urban quarter’s liveliness throughout a day (Jacobs, 1992; Mehta and Bosson, 2021). In addition, mixed-use developments improve urban sustainability in many ways. For example, certain combinations of mixed uses may significantly improve urban energy systems' efficiency and cost-effectiveness (Shi et al., 2021b). Mixed-use developments can reduce vehicular travel, as some trips are replaced by walking (Sperry et al., 2012) and hence save urban transport-related energy and reduce carbon emissions (Bowley and Evins, 2020). As a result, we argue that mixed-use developments have become an important planning instrument for urban planning towards a sustainable future.
However, while mixed-use developments are ubiquitous in urban planning, we do not have a detailed understanding of what constitutes mixed-use, other than a combination of uses. While a masterplan – often the only source of information available about future urban areas – provides information on allowed zones and land uses in plots, it does not provide information on land uses at a finer level of granularity. We lack quantified definitions or archetypes to represent the different types of mixed-use developments that exist in terms of the numbers, kinds and distributions of uses that they contain. Yet, such information about the specific size and use of buildings is required for many different urban analyses and simulations, such as agent-based mobility modelling (Horni et al., 2016) and urban building energy modelling (Fonseca et al., 2016), the latter being the focus of this paper. The lack of definitions and archetypes for mixed-use developments hinders our ability to analyse and simulate their benefits concerning urban sustainability targets.
To address this, we have developed an approach to derive typologies of mixed-use zoning archetypes, which can also be considered as ‘patterns’ of mixed-use developments, from a collection of urban datasets. These typologies of existing mixed-use developments could help city planners envision and plan particular types of developments and help city scientists to model the impacts of mixed-use development more precisely. To facilitate the use of our typologies by such stakeholders, we represent them in a machine-readable ontology, which defines the characteristics, hierarchy and semantic relationships of these mixed-use zoning archetypes (Vinasco-Alvarez et al., 2020). This will enhance cross-domain interoperability and reusability of the derived mixed-use zoning archetypes, particularly within the context of Semantic City Planning Systems (Von Richthofen et al., 2021). While our approach can be adopted for other cities and their mixed-use plots, in this paper, we specifically derive mixed-use zoning archetypes for Singapore and demonstrate how these archetypes impact an UBEM workflow in a case study.
Singapore is a fitting context for this study due to the prevalence of mixed-use developments there. In Singapore, zoning and land-use planning are carried out by the Urban Redevelopment Authority (URA), mainly via the Singapore Master Plan. This is a statutory land-use plan, updated every 5 years, which guides Singapore’s development over 10–15 years (Urban Redevelopment Authority, 2019). Figure 1 shows a UML (Unified Modeling Language) Class Diagram of the zoning types included in Singapore’s most recent 2019 Master Plan. Ten of the thirty two zoning types allow and encourage mixed uses, particularly commercial uses (Singapore Government, 2019). Mixed-use development is ubiquitous in Singapore, with these 10 zoning types representing ∼10% of all zoned plots in Singapore’s current master plan (authors' calculation based on Singapore's 2019 Master Plan). UML class diagram linking zoning types and UBEM use types. The intermediate classes and relations have been defined by the authors.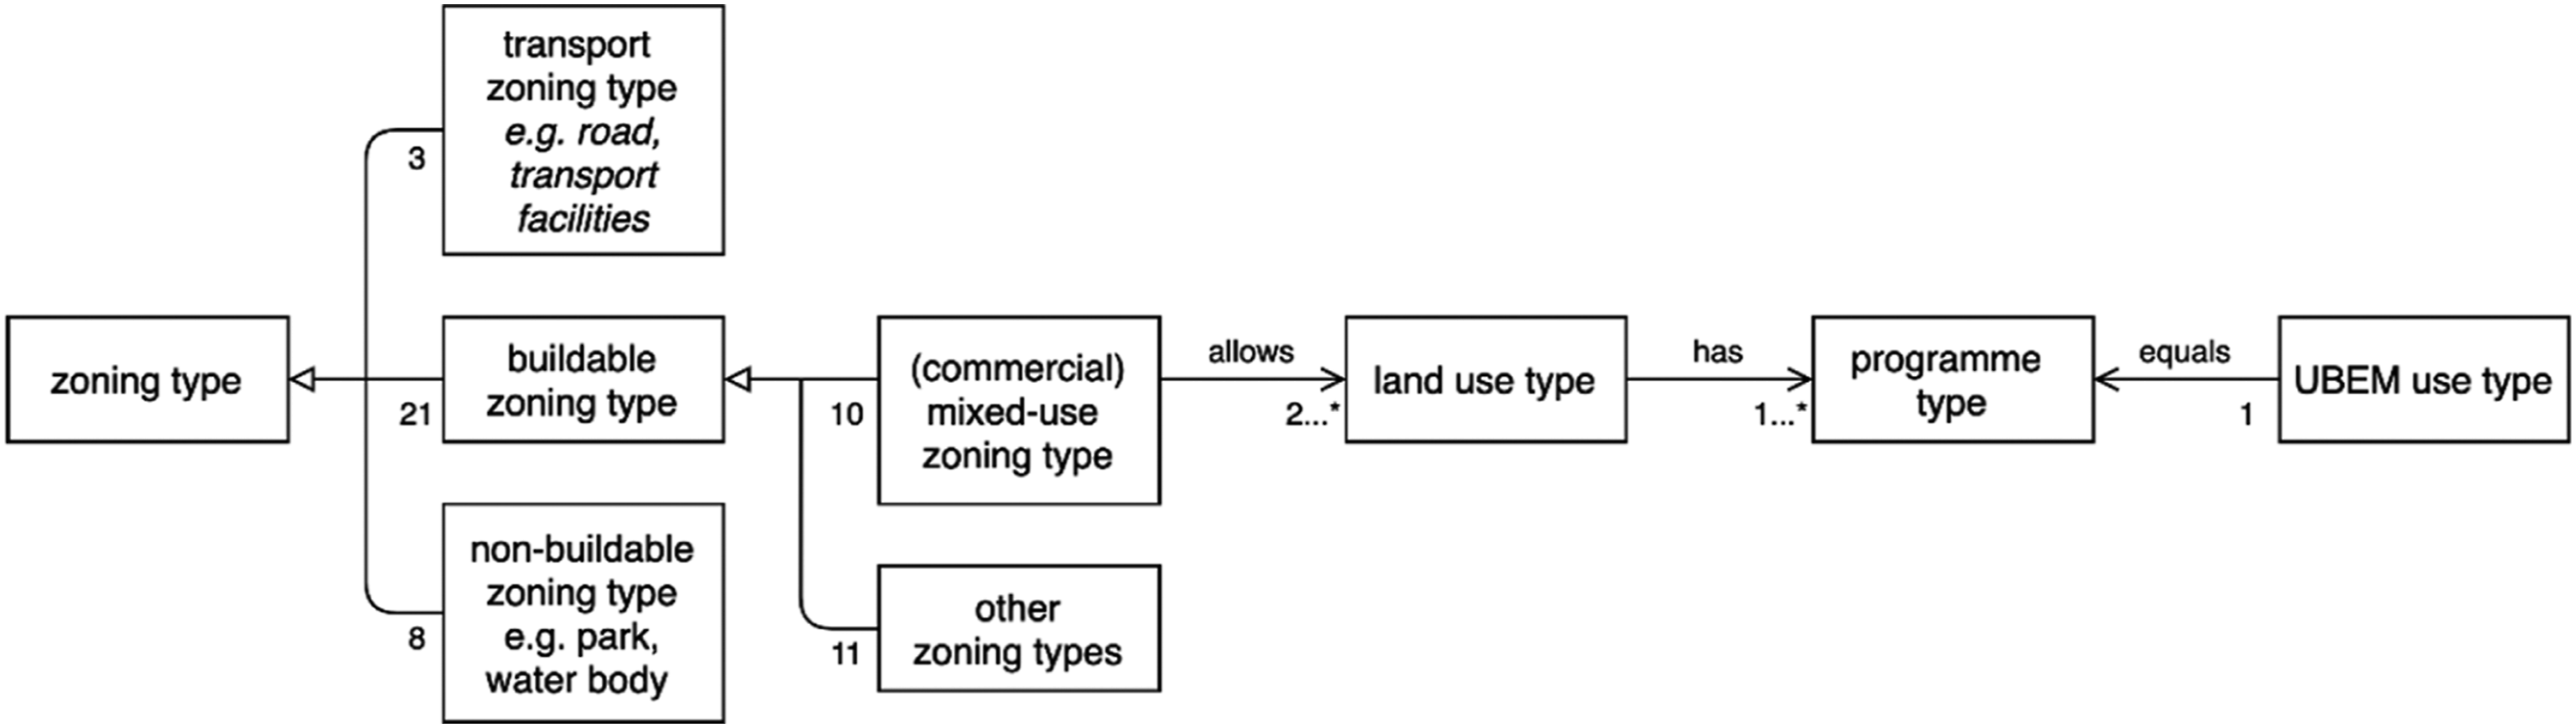
Understanding the different uses constituting mixed-use development is necessary for carrying out UBEM analyses, which in turn support the design of an appropriate energy supply system. Many UBEM tools require UBEM use types and their ratios as inputs. For example, EnergyPlus (Crawley et al., 2001) and City Energy Analyst (Fonseca et al., 2016) directly utilise or adapt use types defined in standards published by ASHRAE (American Society of Heating, Refrigerating and Air-Conditioning Engineers) or SIA (Swiss Society of Engineers and Architects). These standards provide energy use profiles per unit floor area for each UBEM use type, such as multi-family residential or restaurants with specific energy use intensities and schedules. As illustrated in Figure 1, in this work, we used data on programme types to link UBEM use types to zoning types.
The primary purpose of this paper is to establish a methodology to formulate mixed-use zoning archetypes. Such mixed-use zoning archetypes each consists of the programmes (specific land uses) that a plot contains and the percentage of the plot’s gross floor area occupied by each programme. Archetypes can be matched to plots based on each plot’s zoning type and GPR, which are basic parameters in a masterplan. Thus, the archetypes create a link between master-planning data and programmes. The benefit of programmes is that they can be linked to further properties and parameters, such as frequency of visits or UBEM energy profiles. In this vein, our second aim is to explore how the use of archetypes facilitates urban building energy performance assessment compared to the status quo, where urban planners and energy engineers may estimate a mixed-use plot’s UBEM use types and their ratios based on experience or rules of thumb. Our third aim is to facilitate the use of our archetypes by future applications which might, for example, automatically assess the energy performance of urban plans involving mixed-use zoning. This is carried out by creating an ontology that formally describes the links between archetypes, zoning types and plots.
Background
Archetypes
In urban planning and design, archetypes are typically used to express commonalities between individual objects or concepts, such as buildings, areas or land uses (Oliveira, 2016). Archetypes are commonly used in simulation-based studies on urban form for multiple urban qualities, such as urban daylighting (Saratsis et al., 2017), urban vitality (Van Nes and Shi, 2009) or on-site renewable energy use (Shi et al., 2021a). The use profiles required as inputs in UBEM analyses can also be considered archetypes. In UBEM tools, archetypes of different UBEM use types are used as inputs (ASHRAE Project Committee 90.1., 2019) and such archetypes summarise highly variable data related to building use and occupancy. Generally, these archetypes are formulated based on mass data of existing buildings and urban contexts. The archetypes developed in the present work differ from other archetypes through their focus on mixed-use plots, which are not accurately represented by the existing archetypes.
Data sources
Our mixed-use archetypes are based on data from the Singapore government and Google Maps. Zoning data were collected from the Singapore government’s open data platform, which provide the geolocation, zoning type and Gross Plot Ratio (GPR, the ratio of a plot’s gross floor area to the plot area) for each plot in Singapore. Singapore’s Master Planning Act documents the land-use types allowed in each zoning type (Singapore Government, 2019). Programme data, that is, data on the uses that take place in smaller units of the built environment can be used as a proxy for UBEM use data. We considered obtaining programme data for each plot from two different sources: OpenStreetMap and the Google Place API service of Google Maps. We use Google data in this work due to its greater likelihood of accuracy, that is, the inclusion of all existing programmes in operation. This accuracy is achieved, thanks to regular updates on the operational status of Google Places, made both by Google itself and by business owners and casual Google Maps users. For these reasons, Google Maps data have also been used in the past to conduct UBEM simulations (Happle et al., 2020; Parker et al., 2017; Yoshida et al., 2019).
Machine learning to derive urban archetypes
Our method to formulate archetypes is similar to previous efforts to formulate quantitative archetypes of urban forms using unsupervised machine learning techniques such as clustering. For example, Schirmer and Axhausen (2015), Vialard (2013) and Shi et al. (2021a) have used clustering to formulate archetypes of street block typologies in Zurich, Atlanta and Singapore. In all these works, archetypes are based on geometry-related data, such as street block areas, block dimensions and GPRs. To the best of our knowledge, no studies have formulated archetypes based on the types of programmes and the ratios between each programme type’s Gross Floor Area (GFA). We use multivariate regression to estimate the GFA of each programme type. This technique is commonly used to analyse data with multiple unknown variables (in this case, the floor area of each programme type found in an archetype).
Applied Ontology
We created an ontology to create machine-readable links between conceptual classes such as programme types and zoning types, and instances of geospatial data. Applied ontology implies the application of ontological approaches (from the philosophical branch of ontology) to specific knowledge domains (in our case, land-use planning) and is commonly practiced in information science and computer science (e.g. the Knowledge Representation and Reasoning field of Artificial Intelligence). Ontologies represent relationships between concepts within the same or between different knowledge domains, as well as the kinds of properties that objects or concepts can have. Such ontologies can then be used by Semantic Web Technology applications that take diverse data as inputs and perform operations that take into account such relationships and properties. As mentioned above, our ontology could provide the basis for an application that performs automated energy analyses for plots based on their zoning type.
It is possible to construct ontologies manually, based on domain expertise, as well as through various automated or semi-automated means (Bedini, 2007). In the manual approach, the concepts and relationships in the ontology are modelled by a human based on their understanding of the domain. In the data-informed approach, the ontology is abstracted from data through various methods, including clustering and natural language processing techniques (Bedini, 2007). We adopt a hybrid approach.
Methodology
This section introduces our data-informed methodology for linking zoning types to UBEM use types via programme types, using Singapore as a demonstration. Figure 2 presents the methodology’s five-step workflow. Step 1 is to collect the master plan data and Google Maps API for all mixed-use plots. Step 2 is to group Google Places into programme types, based on similarity from the point of view of building function and occupancy, which are typical UBEM parameters. Step 3 is to formulate, for each mixed-use plot, a programme profile (i.e. the floor area of each programme on the plot, as a percentage of the plot’s GFA). In Step 4, similar programme profiles are grouped together to form the mixed-use zoning archetypes. In Step 5, the archetypes and programme profiles are linked to other urban planning concepts in an ontology. Methodology to derive mixed-use zoning archetypes and develop the ontoMixedUseZoning ontology consists of five steps.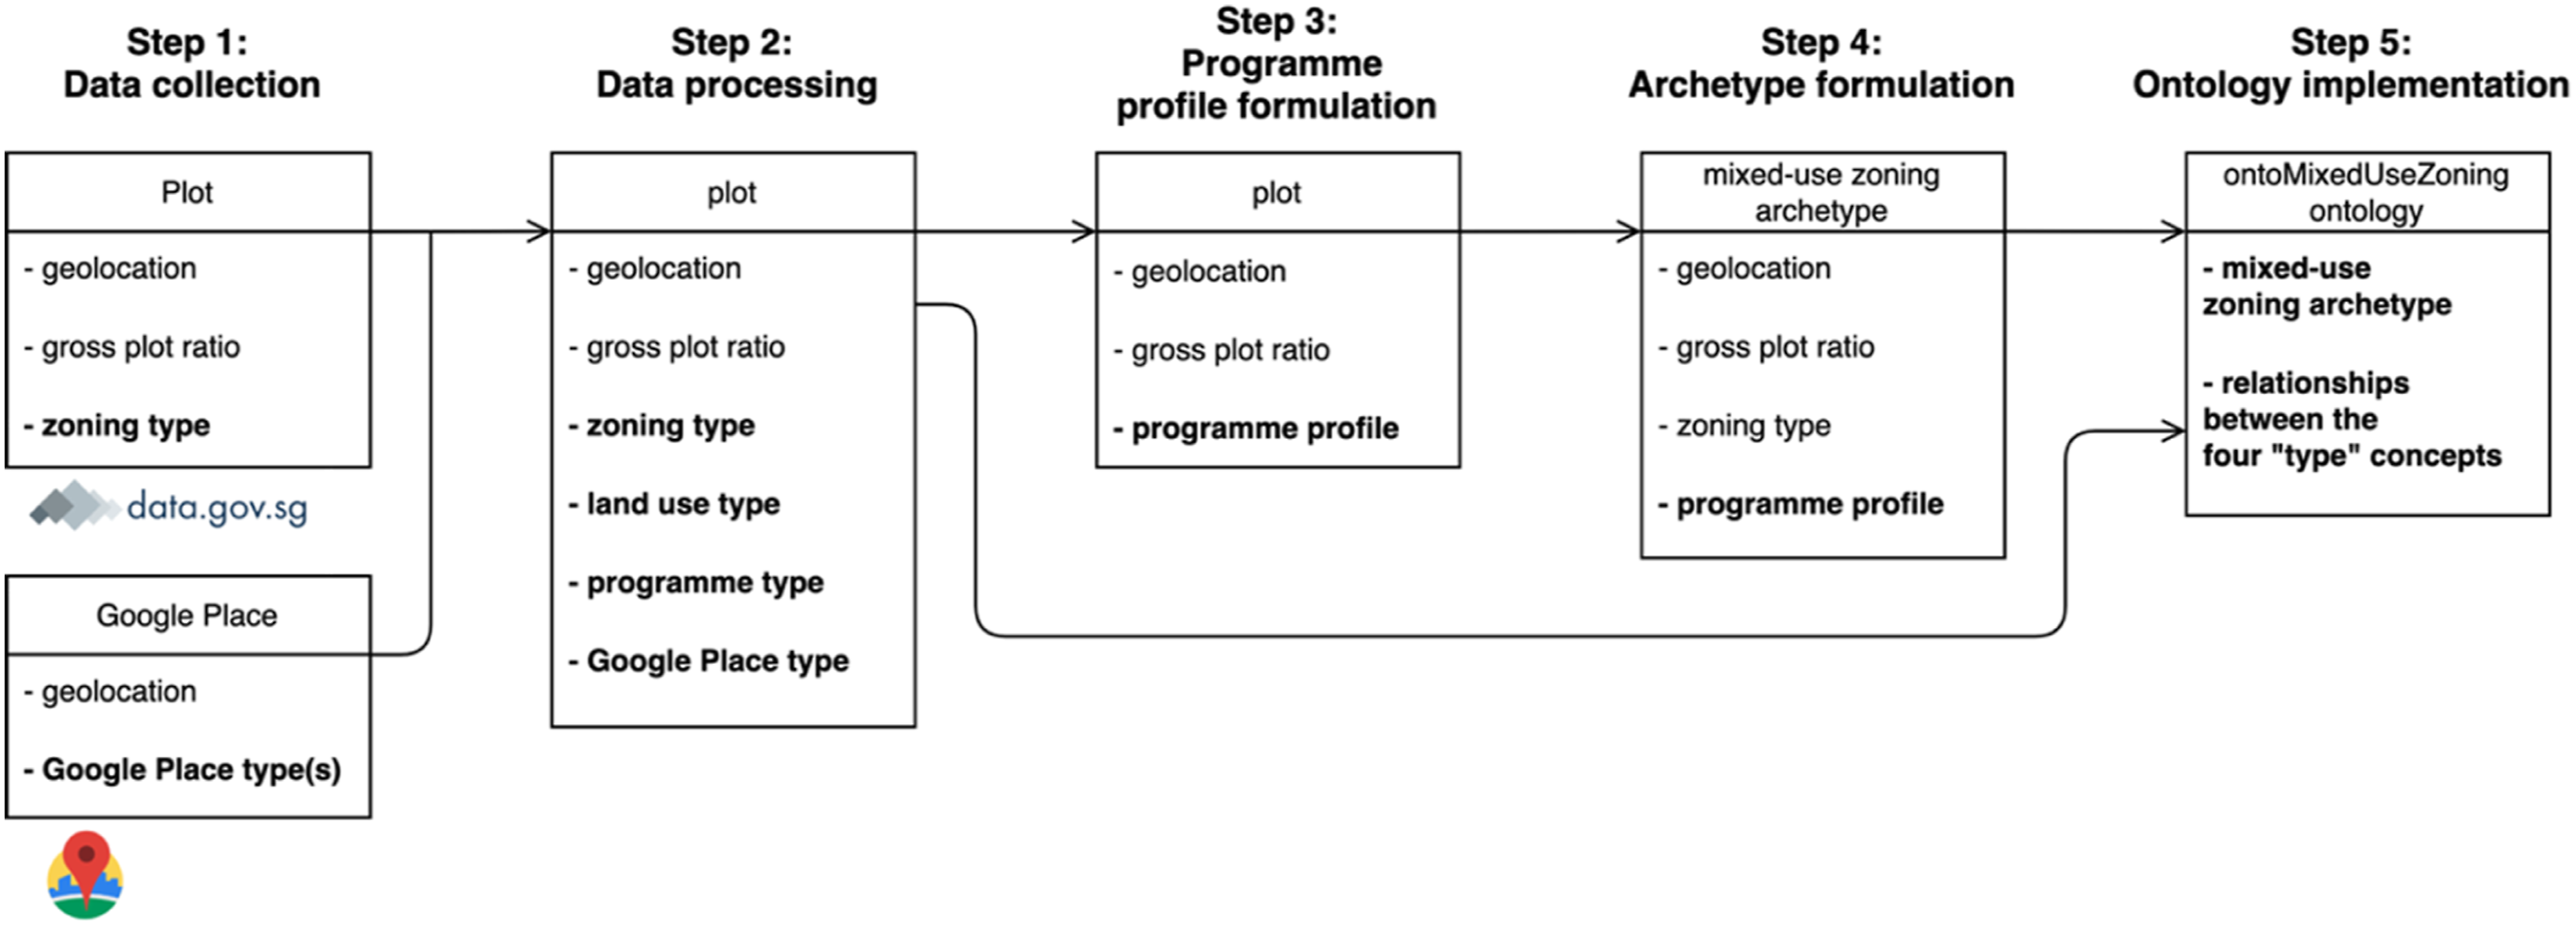
Step 1: Data collection
Our data collection began with Singapore's 2019 Master Plan from the Singapore Government’s open data platform data. gov.sg. The master plan data contain each plot’s geolocation, GPR and zoning type, as well as descriptions of the land-use types allowed by each zoning type. Of the master plan’s 32 different zoning types, our study focuses on the ten mixed-use zoning types: commercial, residential with commercial at first storey, commercial and residential, commercial and institutional, business park, hotel, white, business 1-white, business 2-white and business park-white. Each of these mixed-use zoning types allows at least some commercial uses. Figure S1 in the Supplementary Materials shows the 10,961 mixed-use plots assigned one of these zoning types.
Then, we collected data on Google Places, which are points of interest that appear on Google Maps. We filtered these data using two criteria: location and Place Type. The location filter was simply used to select those Google Places located on plots with one of the ten mixed-use zoning types listed above, using the Nearby Search Request of the Google Places API service (Google, 2021a). We then excluded some of these places based on their Place Types, which are labels created by Google to describe the function of each place (each place can have one or more types (Google, 2021b)). A place was included in our study if at least one of its Place Type labels was allowable in a land use that was in turn allowable in our ten mixed-use zones, according to the master plan documents discussed above (Singapore Government, 2019). Overall, 46 such corresponding Place Types were found (see Table S1 in the Supplementary Materials). This filtering process resulted in a dataset with 57,730 Google Places and their attributes: geolocation (latitude and longitude), name of place, address and Google Place ID (a unique identifier of the Google Maps platform). Data collection took place in January 2021. Of the 10,961 mixed-use plots in Singapore, 3064 have a complete set of plot data, that is, both a GPR and at least one Google Place data point.
Step 2: Data processing
The data was processed by merging Place Types that are highly similar from the perspective of building function and occupancy. Specifically, many Google Place Types are similar in their energy use intensity and temporal distribution, which are the main factors impacting an UBEM outcome. For example, the Place Types clothing_store and shoe_store are similar in both of these respects (and were thus combined into a single category, ClothingStore/ShoeStore), while a nightclub and a locksmith likely differ significantly (and were thus kept separate). This merging process resulted in 36 distinct categories, which are henceforth referred to as ‘programme types'. Each programme is composed of between one and three original Place Types, as shown in Table S1 in the Supplementary Materials. This mapping was then used to re-classify each Google Place according to its programme type.
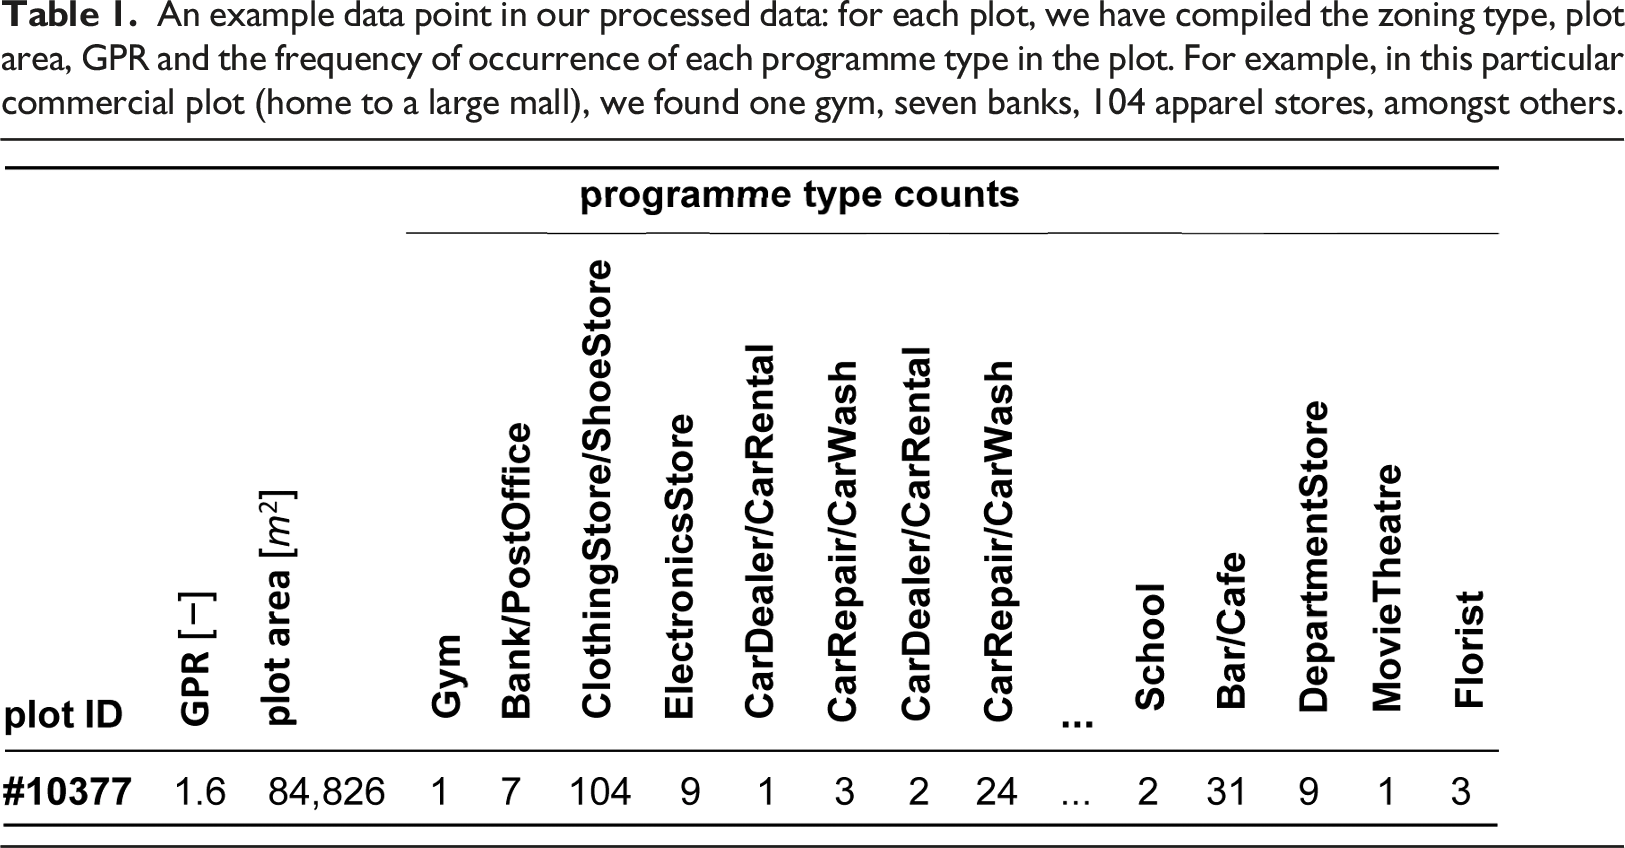
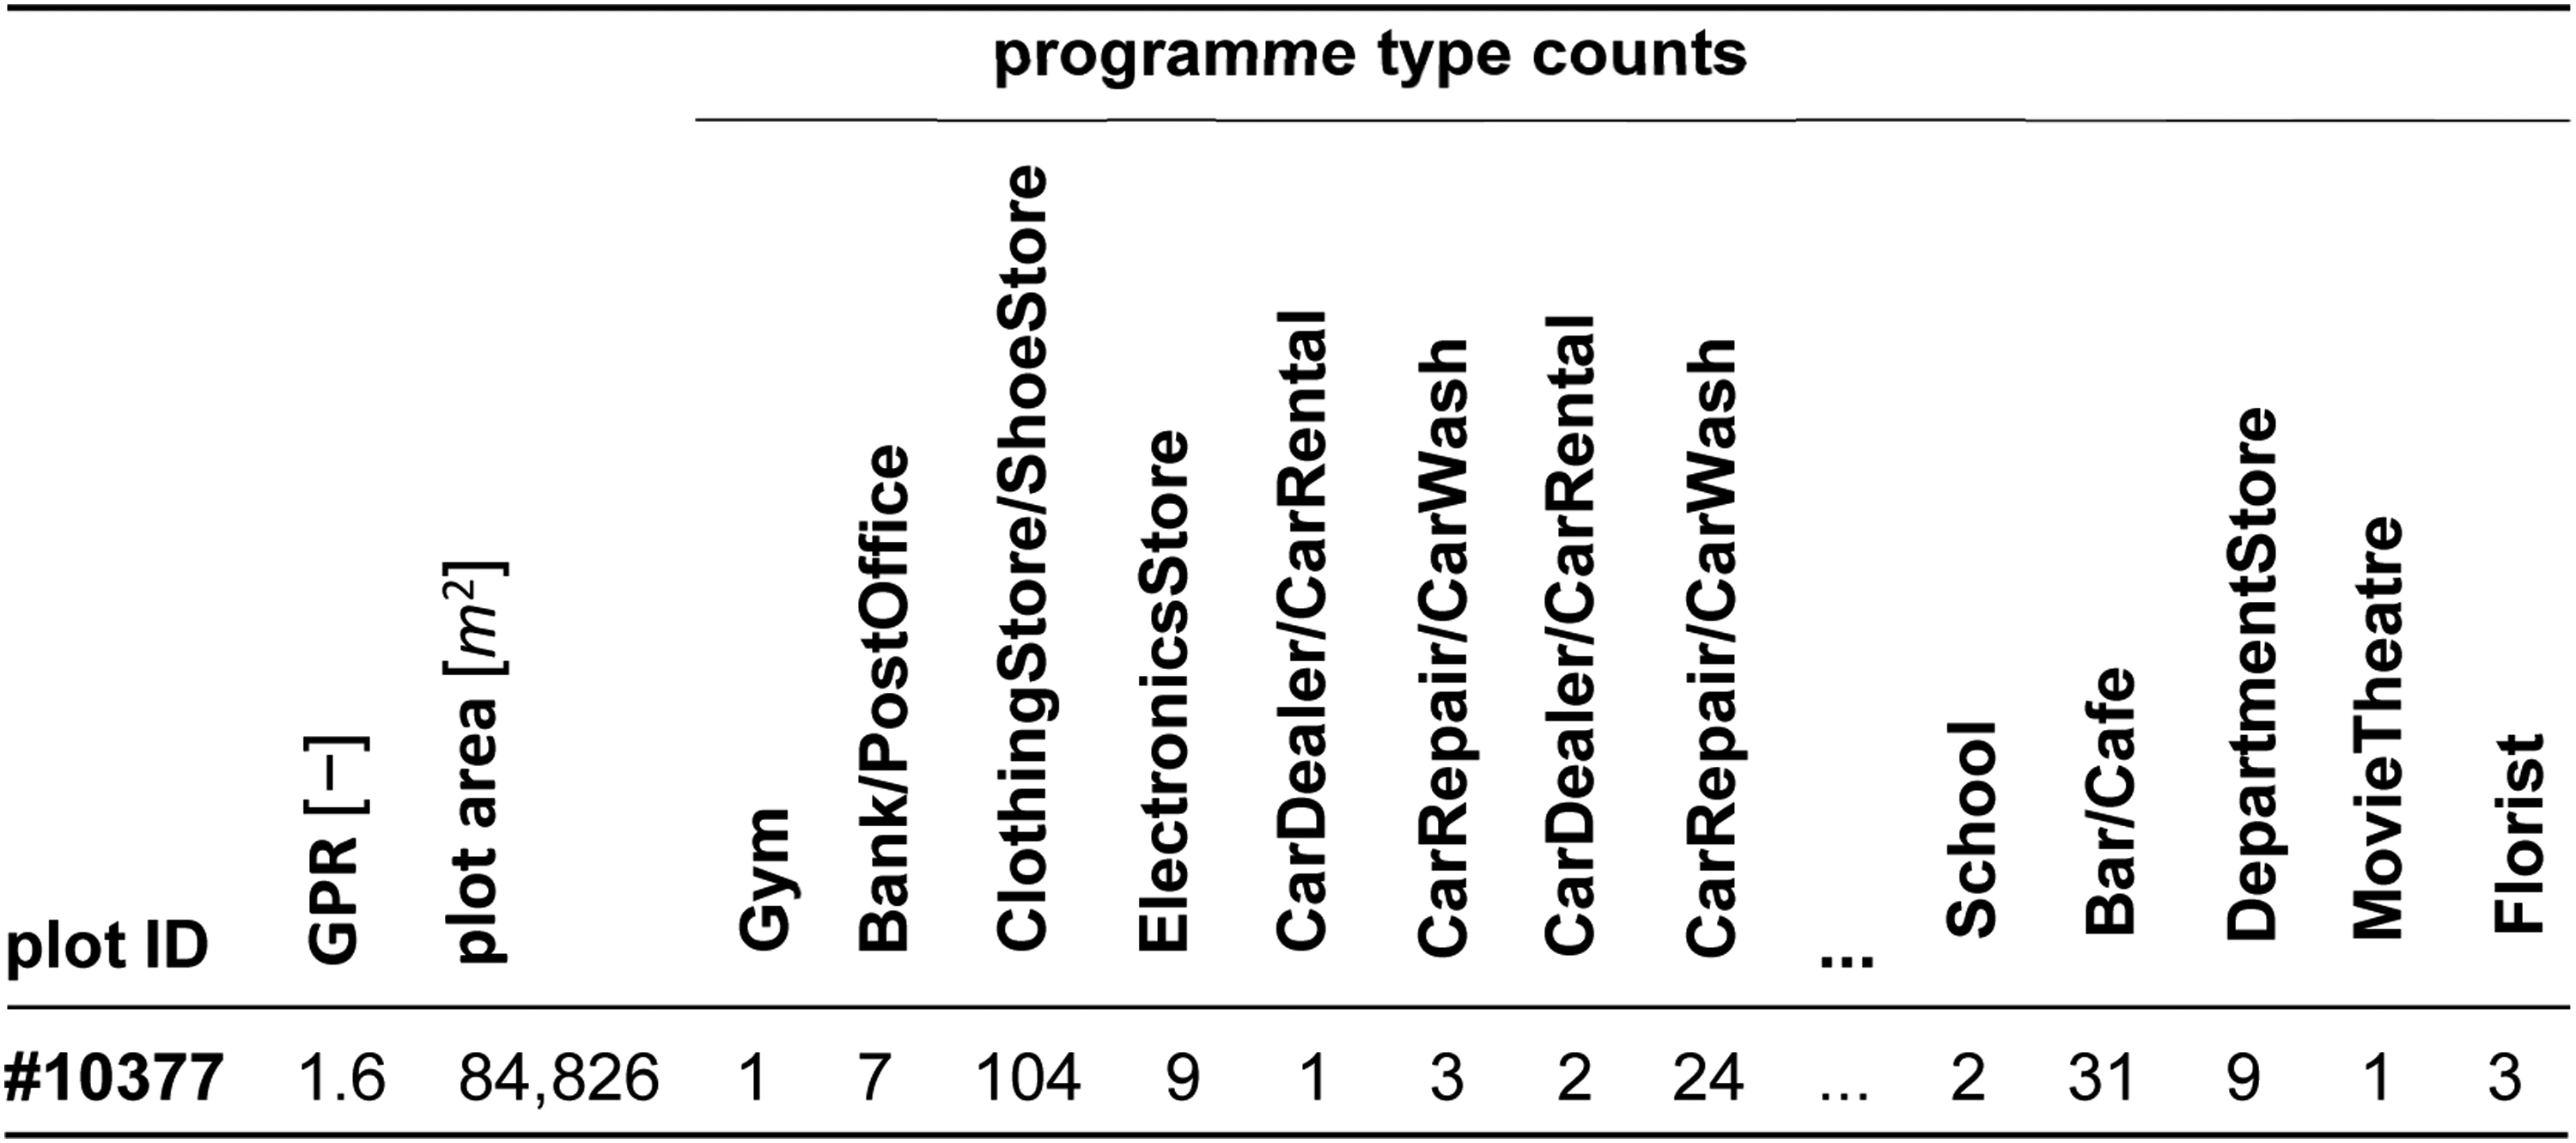
An example data point in our processed data: for each plot, we have compiled the zoning type, plot area, GPR and the frequency of occurrence of each programme type in the plot. For example, in this particular commercial plot (home to a large mall), we found one gym, seven banks, 104 apparel stores, amongst others.
Step 3: Programme profile formulation
We then used the processed data to formulate a programme profile for each of the 3064 mixed-use plots. The programme profile expresses the floor area of each programme type found on a plot as a percentage of the plot’s total GFA. Deriving the programme profiles thus required solving multivariate equations with the floor areas of each programme type on the left-hand side and plot’s GFA on the right. Such equations are possible to solve by combining data from many plots. However, a challenge is that some mixed-use plots may contain uses that are not marked as Google Places and hence not represented by our programme types, such as residential or office uses. For example, a plot with the commercial zoning type might only have a few Google places, with most of the floor area being occupied by office use, which would not be included in our programme data. We have thus added three programme types based on the Master Planning Act but not included in the list of Google Place Types as an addition to the 36 programme types. These additional four programme types are office, residential, industry and hotel room.
To minimise the influence of such ‘unknown’ programme types from Google Maps in the regression, we built our models using commercial plots that are clustered into groups sharing the same unknown programme types or having no such types. This allowed us to estimate the typical floor area of each of our programme types, which could then be used to create programme profiles for all mixed-use plots. Section B in the Supplementary Materials presents the four-substep method for formulating programme profiles for the commercial plots.
Step 4: Archetype formulation
We then derived more precise mixed-use zoning archetypes (i.e. sub-types) based on the results of the first round of clustering described in Substep 3.1 (see Section B in the Supplementary Materials). The method used was again hierarchical clustering. In Substep 3.1, the commercial plots were divided into five clusters based on GPR and programme count, resulting in clusters matching shophouses, malls, mega malls, office towers and mixes. We then divided each of these clusters further, based on plots' programme profiles derived previously, and their GPRs, resulting in several subclusters. By selecting the medoid of the cluster (i.e. the programme profile, which has the shortest combined distance to all other profiles within the cluster), we selected the most representative plot for each sub-cluster. The programme profiles of these most representative plots are defined as mixed-use zoning archetypes.
Step 5: ontoMixedUseZoning ontology implementation
After defining the mixed-use zoning archetypes, we formally defined and represented the archetypes as an ontology, named ontoMixedUseZoning. This ontology contains classes that represent concepts relevant to mixed-use zoning, properties of these classes, as well as relationships between classes. The ontology was created in three steps. First, we conceptualised the relationships between the key concepts of interest to us: plots, mixed-use zoning types, programmes allowed in each zoning type and archetypes. In doing so, we consulted the URA 2019 Masterplan Written Document (Singapore Government, 2019), which lists all zoning types in Singapore and specifies what kinds of land uses are allowed in each type. Based on the examples of more specific 'developments' allowed in each land use, we then manually matched land uses to our programme types as closely as possible, thereby creating an (indirect) link between each zoning type and its allowed and disallowed land uses and programme types. Each archetype in the ontology is connected to its constituent programme types and ratios and can also be linked to the geospatial plot objects that the archetype represents through its GPR and zoning type attributes, which are also shared by plots. Second, we formalised this conceptual diagram with Protégé, an ontology editor, in a machine-readable format using the Web Ontology Language (OWL2). Lastly, we use Protégé's in-built HermiT reasoner and the OntoDebug plugin to ensure that the ontology is consistent (lacks contradictions) and able to make correct inferences.
Results
Programme profiles for individual mixed-use plots
This section presents our approximations for the programme profiles in each of the 3064 mixed-use plots in Singapore that have a complete set of plot data (both a listed GPR and at least one Google Place data point). The programme profiles of these 3064 mixed-use plots, that is, GFA distributions of different programmes, were formulated as described in Step 3. Figure 3 maps all the programme profiles for the 3064 plots. Figure S4 in the Supplementary Materials illustrates the bars for these plots' formulated programme profiles by zoning type. Our total set of 3064 plots and their formulated programme profiles mapped across Singapore. For the other programme types: office or industry in business 1-white, business 2-white, business park, business park-white; residential in commercial and residential, residential with commercial at first storey; office in commercial institutional uses as defined in the master plan in commercial/institution; office or residential in white; hotel room in hotel.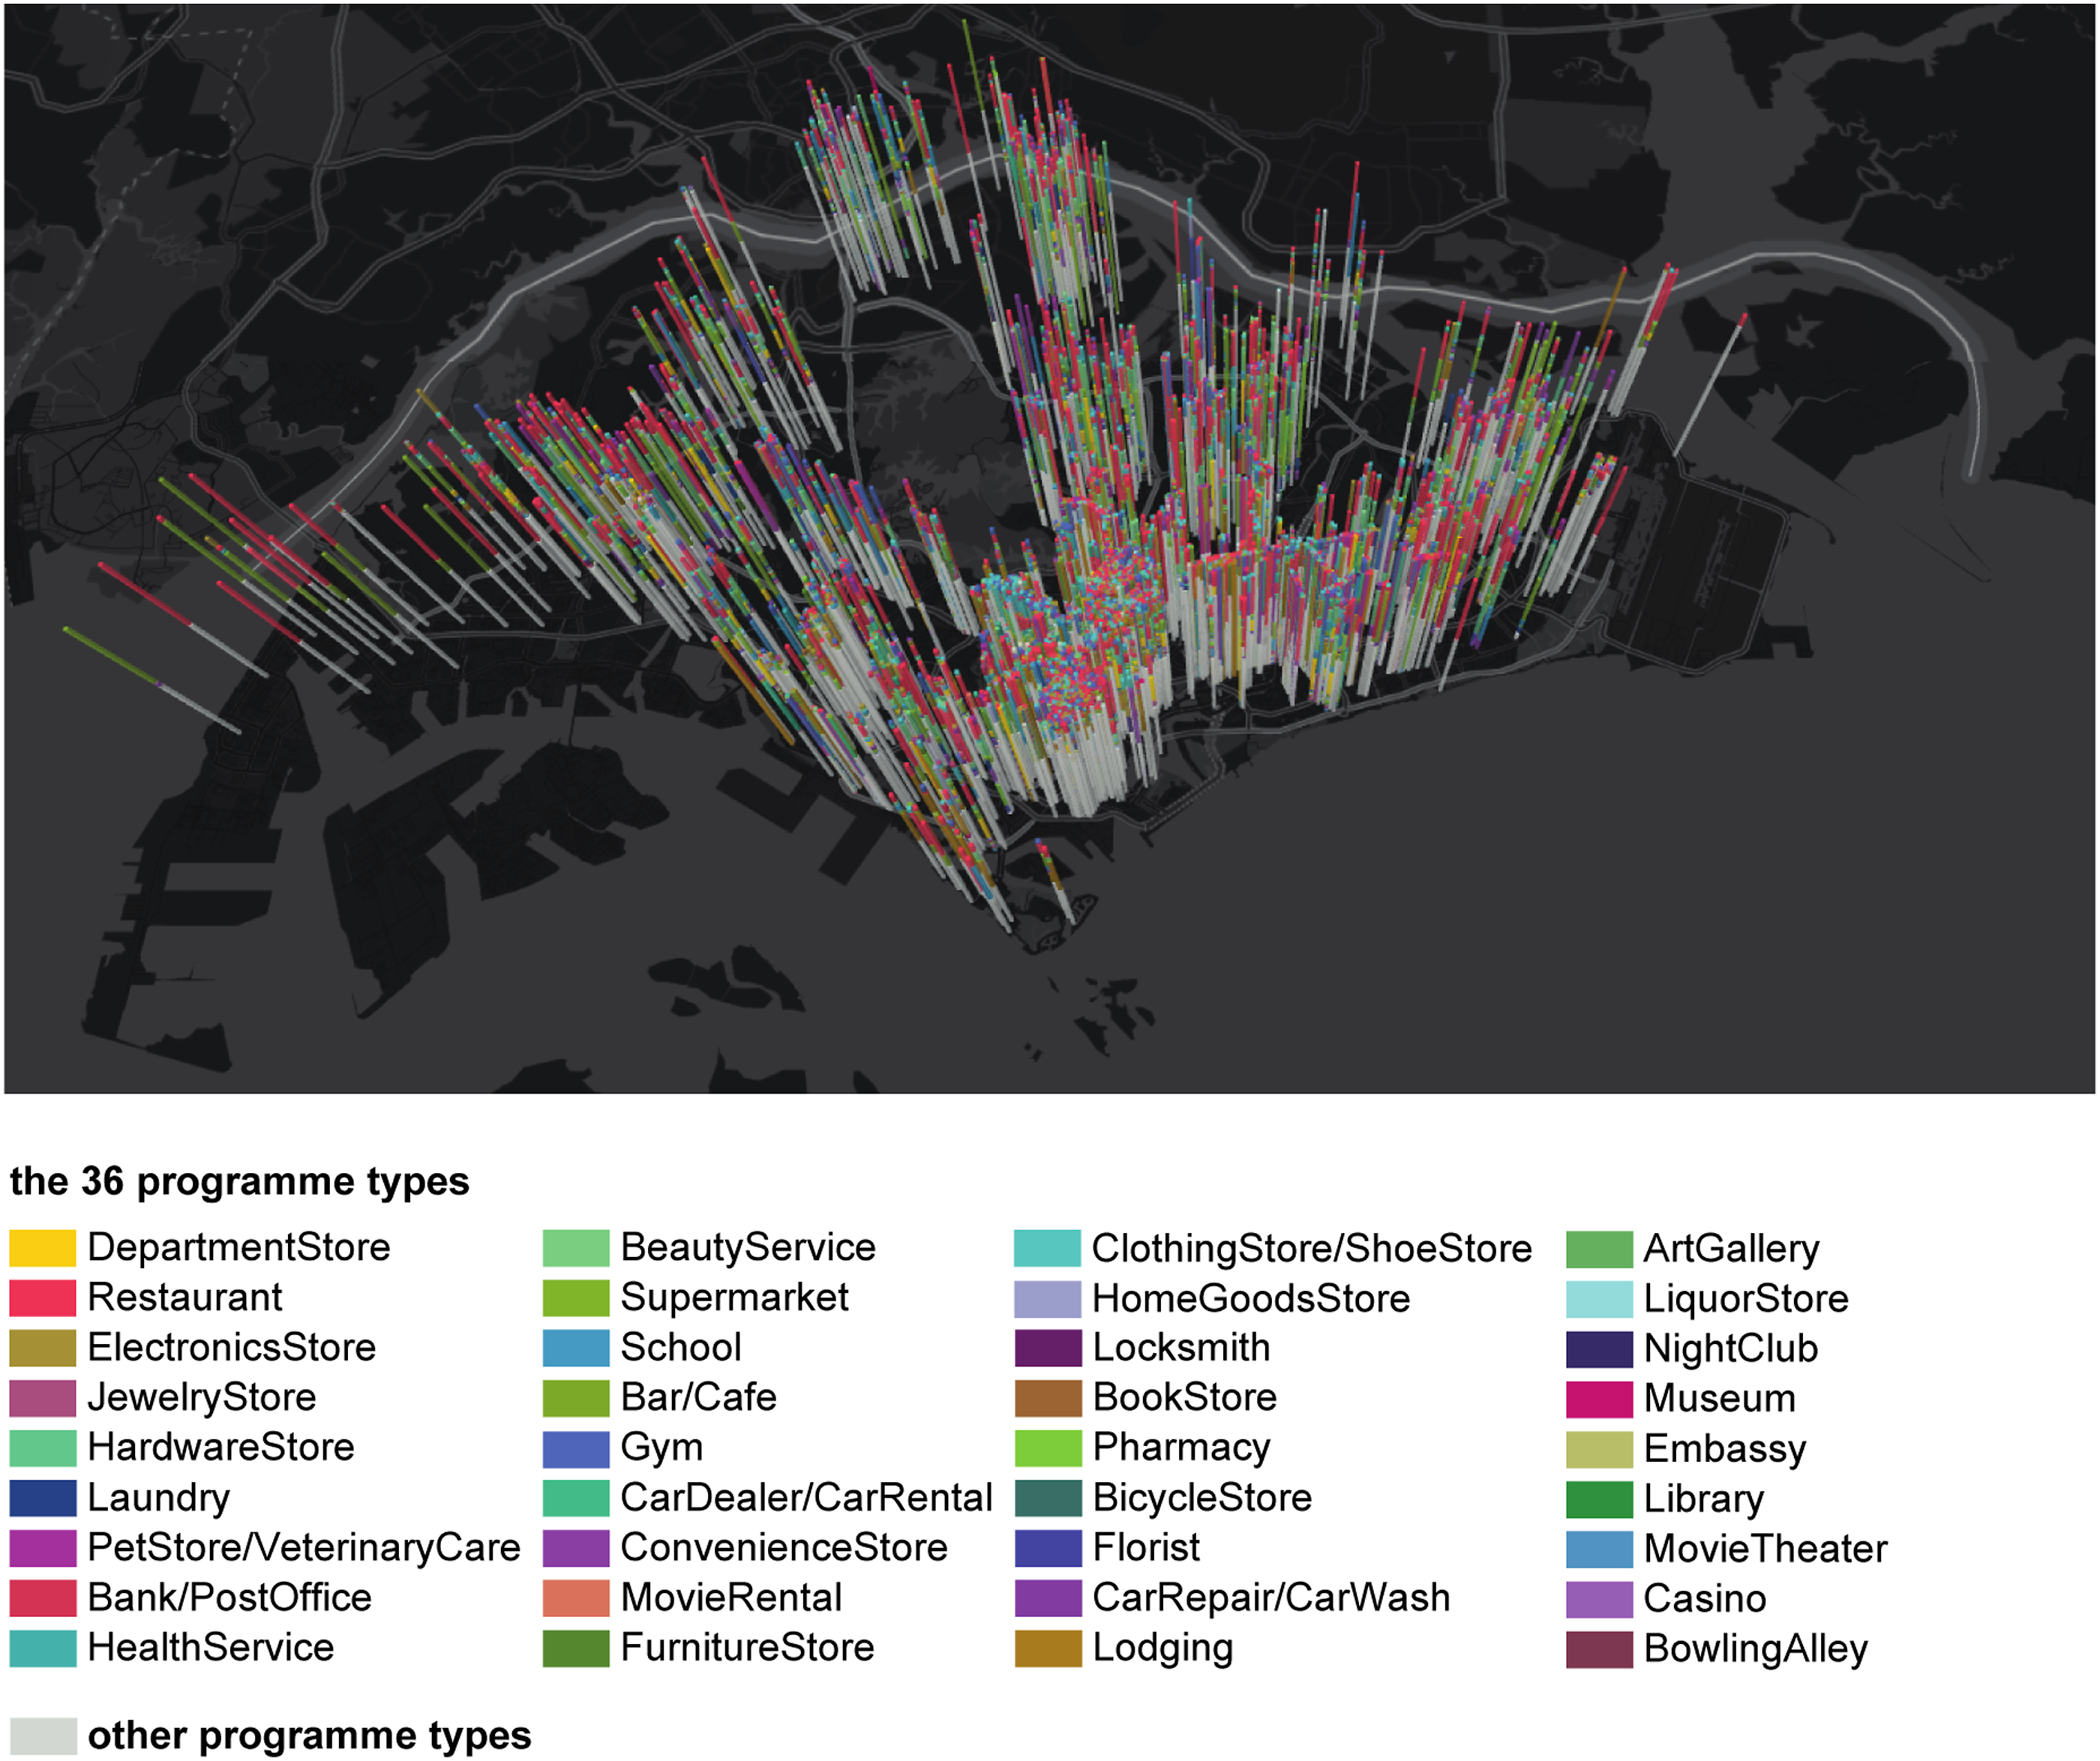
Mixed-use zoning archetypes
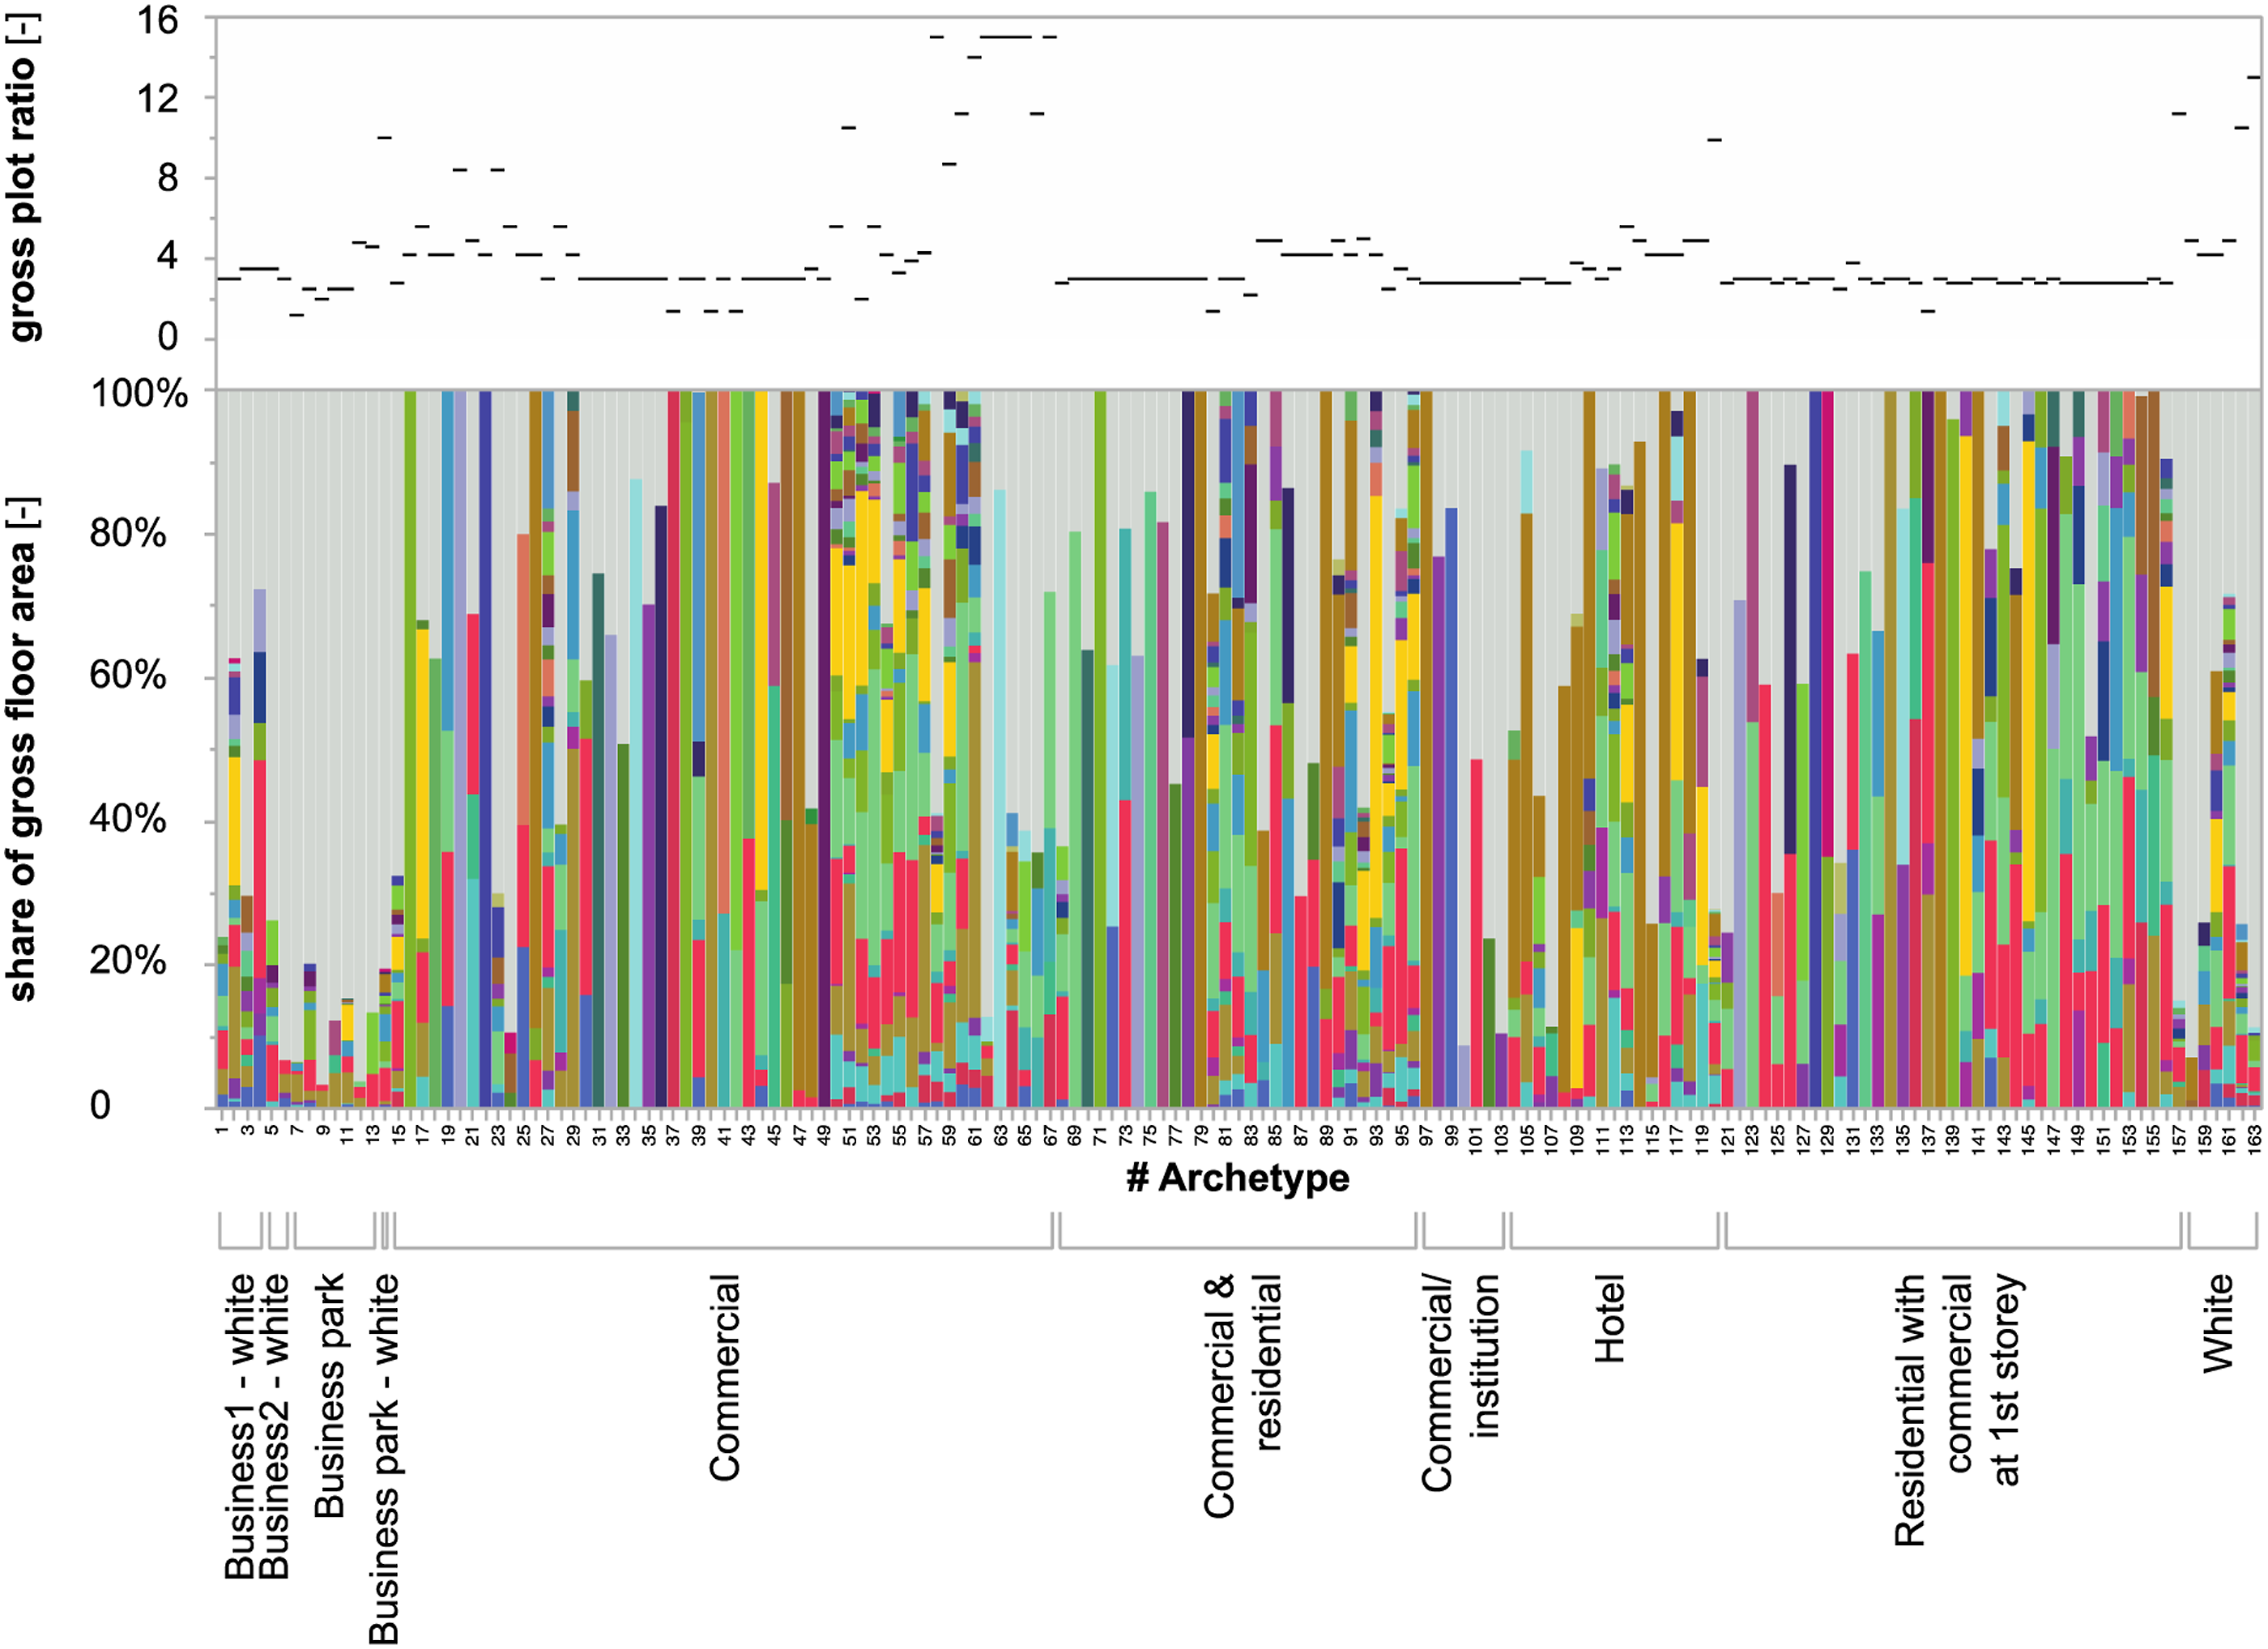
This section presents the mixed-use zoning archetypes. We derived 163 archetypes from the 3064 mixed-use plots' programme profiles and their GPRs. We computed the medoids of each cluster to represent the whole group; these 163 representatives are our mixed-use zoning archetypes for Singapore. Figure 4 presents the processes of producing the mixed-use zoning archetypes, and Figure 5 plots the mixed-use zoning archetypes' GPRs and programme profiles. Table S6 in the Supplementary Materials presents the GPR and ratios of each programme type for each mixed-use zoning archetype. 163 mixed-use zoning archetypes have been formulated from 113,212 plots of the whole Singapore. This figure illustrates the 163 mixed-use zoning archetypes for Singapore’s 10 types of mixed-use zones. Each of the ten mixed-use zoning types is associated with one or more archetypes. Each archetype is characterised by a particular combination and distribution of programme types and programme floor areas, as well as a particular GPR. Consult Figure 3 for a legend of the programme colours.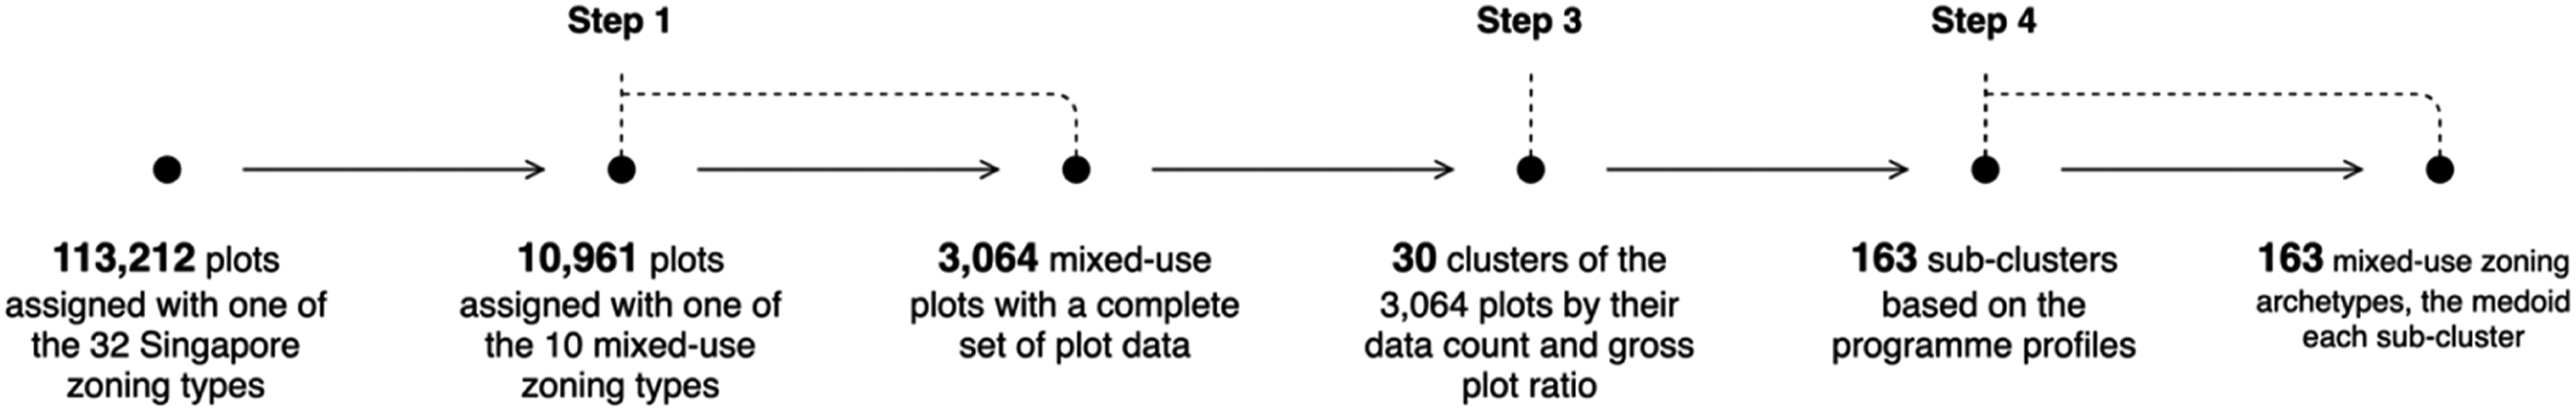
ontoMixedUseZoning ontology
The ontoMixedUseZoning ontology is illustrated in Figure 6. The figure shows how the classes plot, zoning type, land-use type, programme type, archetype and data source are related to each other, as follows. Each plot has a zoning type, which allows certain land-use types, as specified in the URA, 2019 Master-plan (Urban Redevelopment Authority, 2019). Each land-use type allows one or more programme types, which are essentially more specific land uses that are based on the empirical data collected. Archetypes are represented in their own class, and each archetype is linked to a zoning type and a GPR value. The programme ratios of each archetype (e.g. that archetype 1 consists of 20% beauty service and 80% hotel programme types) are represented by archetype components, each linked to a single programme type (e.g. beauty service) and its percentage value (e.g. 20%). Through these relationships, the ontology links plots to archetypes to programme types, which can in turn later be linked to UBEM properties to allow archetype-based UBEM calculations for each individual plot. Tables S3 through S7 in the Supplementary Materials present the Description Logic terms and axioms representing ontoMixedUseZoning ontology. Diagram illustrating the ontoMixedUseZoning ontology for Singapore, showing how the classes plot, zoning type, land use, programme type, archetype, archetype component and data source are related to each other. CityGML plot data in grey may be connected to archetypes through zoning types and GPR values. In the future, the ontology may be expanded with UBEM profiles for each programme type.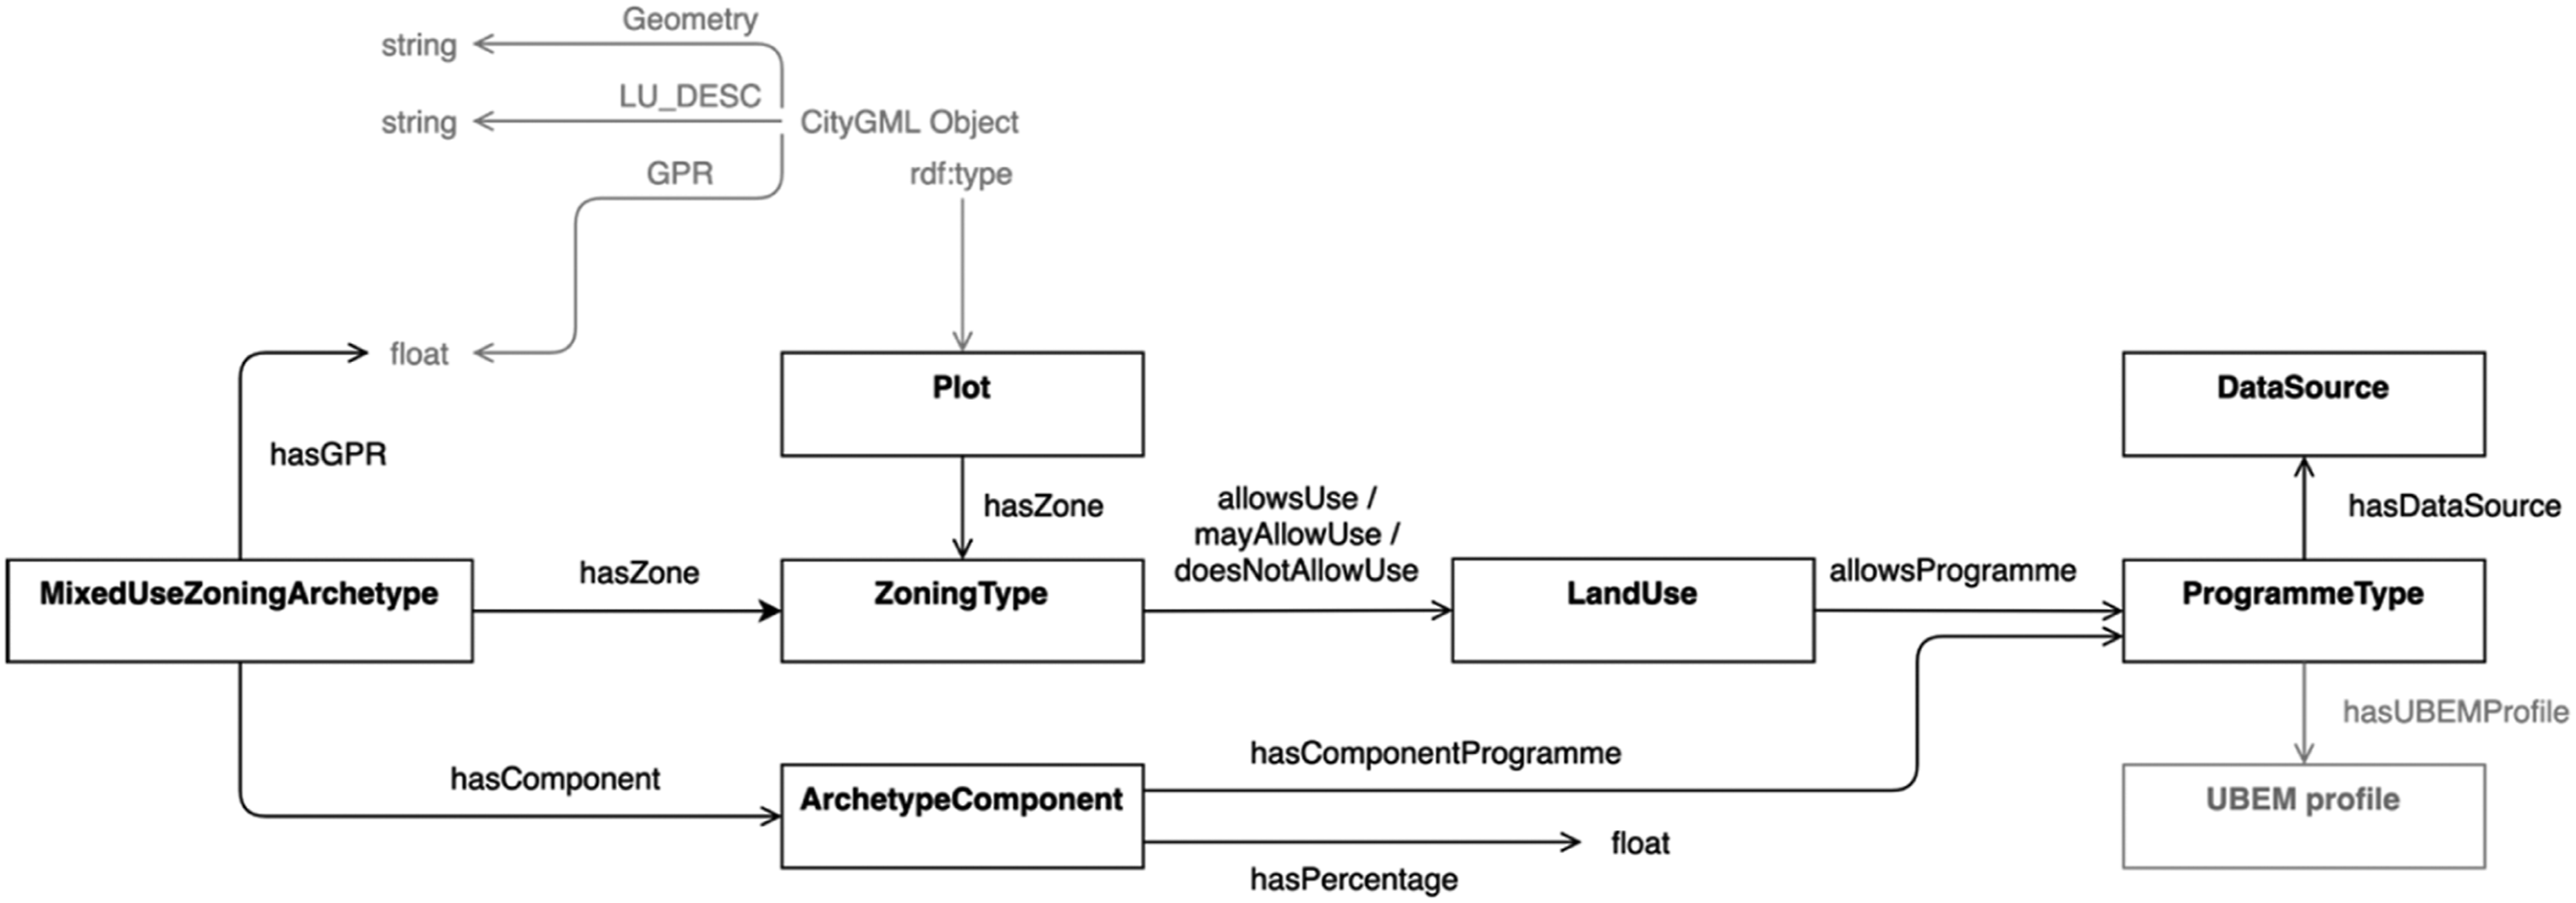
Validation
We then partially validated the formulated mixed-use plot profiles. Due to the difficulty of finding programme-level data – which is of course the motivation for our study – it was not possible to validate all 3064 programme profiles. To get a sense of the accuracy of our formulated archetypal programme profiles, we compared three of our results against data collected manually from three plots with malls in Singapore. See details about these plots in Table S8 in the Supplementary Materials. The names of the malls in these plots are 321 Clementi, Takashimaya and City Square Mall. We focused on malls because their programmatic data (types and floor areas of programmes) is readily available and accessible in comparison to data on other types of mixed-use developments. The validation data was collected in mid-May 2021 from mall directory maps by tracing the floor plan of each level and calculating the ratio of each programme type as a share of the mall’s GFA. Considering the diversity of mixed-use plots in Singapore, our method produces fairly accurate programme profiles: for each of the three cases, our archetype programme profiles identify dominant programme types and their shares of the total floor area.
Figure S5 in the Supplementary Materials compares the formulated programme profiles to the empirical measurements for the three malls. Consult Table S9 in the Supplementary Materials for a detailed quantitative comparison between the formulated and the measured programme profiles.
Discussion
Impacts on urban building energy modelling results
To demonstrate the utility of our archetypes in an urban building energy modeling (UBEM) workflow, we developed a case study in which we use one of our mixed-use archetypes to conduct an urban energy analysis for a plot in Singapore, showcasing how archetypes can be applied to facilitate an UBEM workflow, as compared to using conventional use types. In this comparison, we assessed the plot’s energy demand and the efficiency of the thermal energy supply systems. This is described in Section F in the Supplementary Materials, which introduces the study’s plot and its context, provides the metrics we use for our urban energy analysis and presents the energy analysis results of our case study.
In the energy simulations, the detailed programme profile was coupled with each programme type’s corresponding CEA use type’s energy use intensity and hourly occupancy schedules. When using the programme profile, the annual aggregated electricity demand from the city grid is ∼5% more than when using the default retail profile, while the hourly final electricity demand from the city grid is from ∼35% to ∼84% greater than in the simulation using retail use types. Such significant differences in energy demand forecast could impact the energy supply system design, as the temporal distribution of energy demand over time is crucial in energy system sizing and operation.
The difference in hourly cooling demand has a significant impact on the sizing and the operation of the centralised cooling energy supply system. The chiller capacity factors when using our archetype’s detailed programme profile and the default retail profile, measuring the cost-effectiveness of the chillers, are ∼37% and ∼41%, respectively. Although the results indicate the latter is seemingly more cost-effective, the size of the chiller may not meet the peak cooling demand if the plot’s programme profile ever develops following the path of Archetype #54. The required size of the chillers is ∼36% greater.
The workflows based on the mixed-use zoning archetypes and the conventional energy use profiles have produced different UBEM results. An UBEM simulation needs, as inputs, the type and size of each UBEM use type in each unit of each building in the urban area under consideration. The two workflows use different quality and granularity of inputs, which have a large impact on the model’s outcome, as different UBEM use types and their sizes can imply widely different energy-use intensities and (peak) operating hours. The peak energy demand is crucial to the sizing of the energy supply systems. An underestimation may result in an energy supply shortage while an overestimation may result in excessive energy supply capacity causing unnecessary capital investment.
Impacts on early-stage master planning
Aside from the impacts on UBEM analyses, the case study also demonstrates how the mixed-use zoning archetypes introduced in the present paper can support the early stages of master planning. The mixed-use zoning archetypes link programme types directly to the zoning types. In a greenfield project, urban planners can consult the archetypes for exemplary programme profiles when programming a mixed-use plot. The programme profiles provide detailed building occupancy information, which can inform not only building energy modelling but also other domains that rely on a detailed breakdown of programmatic GFA, such as urban mobility, real estate or urban design, for example.
Potential impacts of the ontoMixedUseZoning ontology
The mixed-use archetypes presented in this paper are integrated into an information system for master planning – a Semantic City Planning System (Von Richthofen et al., 2021) – called Cities Knowledge Graph (CKG). The ontoMixedUseZoning ontology links UBEM and master planning-related concepts (e.g. programme types and archetypes) to particular geospatial boundaries in a city (i.e. plots). These plots are represented in the CityGML ontology, which links the plot geometry to attributes such as GPR and zoning type. This approach enables us to query for plots with a specific zoning type and GPR, and for archetypes that match these attributes. Thus, we can connect the archetypes' programme profiles to plots.
As pointed out by Chadzynski et al. (2021), the use of ontologies within dynamic geospatial knowledge graphs can help to address common issues related to keeping digital city models up to date. Moreover, queries on a much broader range of data and domains are possible, as the CKG is part of a broader research effort called The World Avatar (TWA), which aims to link data from all domains into a single knowledge graph. Such integration not only allows sharing and querying linked datasets but also applying specific functionalities present in the TWA semantic information system, such as its Parallel World Framework capabilities (Eibeck et al., 2020), which, in case of master planning, would allow for scenario analysis and multi-factor optimisation of land-use plans using various criteria.
Limitations
The first limitation concerns the validation, which is limited in scope. As building floorplan and programme datasets are not commonly available, our validation is limited to manually measuring the GFA of each programme in mixed-use plots for which such information is publicly available. In the case of Singapore, this limits us to shopping mall plots.
The second limitation is that our estimations of typical GFAs for particular programmes are solely based on commercial plots that feature either malls or historic shophouses, disregarding other types of mixed-use plots. This is the case as these two types of commercial plots represent the majority of the mixed-use plots in Singapore, hence the largest dataset to apply a multivariate regression to. Nevertheless, applying the multivariate regression separately to each zoning type that allows mixed-use, if sufficient data were to be available, would likely lead to more archetype-specific (and hence context-specific) results.
The third limitation is the temporal accuracy and frequency of our base data and how it reflects changes. Our data collection was performed in January 2021, during the COVID-19 pandemic, when commercial programmes had likely already been impacted by major governmental restrictions and changes in usage patterns. Hence, to more precisely inform the programming of future or current mixed-use plots, it would be best to collect data frequently and repeatedly generate the programme profiles of mixed-use archetypes, enabling the monitoring of shifts in programmatic use patterns. There is a need for frequent and preferably automated updates in our methodology and archetypes.
The fourth limitation concerns the universality of our results and methodology. The mixed-use zoning archetypes presented in this paper are based on data collected in Singapore at a specific point in time, limiting the representativeness of the archetypes over time and in another city. Nevertheless, the methodology presented in the present paper can be used to produce specific mixed-use archetypes for different urban contexts. Applying the method to a new context requires some manual work, particularly in Step 5 (linking programme types to local land uses and zoning types). In addition, the suitability of our programmes to a new context should be verified, particularly in cases where several Google Places were grouped under a single term due to the similarity of their UBEM profiles in Singapore (e.g. ClothingStore/ShoeStore).
The fifth limitation concerns the application of the archetypes in UBEM. The lack of empirical data on the building energy demand hinders us from comparing our workflow with the conventional one. Moreover, we acknowledge the impacts of other design aspects on UBEM, such as urban and building forms. The City Energy Analyst does not consider the effect of microclimate. Future works should include sensitivity analysis to study the varying impacts on urban building energy performance by mixed-use programme profiles and the aspects mentioned above.
Sixth, while the archetypes enable urban designers and planners to grasp the patterns of built mixed-use developments and provide high-resolution occupancy information in urban modellings, their drawbacks do exist. The use of archetypes requires the assumption that future developments will follow similar patterns as existing ones. The possibility of completely different development patterns is ignored. When assessing the impact of urban planning in the far future, it is necessary to carry out UBEM scenario analyses based on not just existing, but plausible new archetypes. However, it is a challenging task to invent new archetypes due to the uncertainty of the future. Still, the existing archetypes are nevertheless valuable for estimating the mixed-use development in the near future.
Seventh, fees may incur using the Google Map API services. For those who are to apply our method, OpenStreetMap data can be used as a substitute. However, we chose the Google Map API service for its greater likelihood of accuracy, which is achieved by the regular updates of Google Places by Google, the business owners and the Map users. In addition, the methodology requires a relatively large amount of data as inputs. To formulate the mixed-use archetypes, one may need to collect the Google Map API data across the city as the input for the model in the proposed methodology.
Conclusions and outlooks
This work presents our methodology to quantitatively define the characteristics of mixed-use zones and plots in cities. Our methodology derives archetypes of programme profiles (the distributions of use types and their GFAs) of mixed-use plots in a particular city. The resulting set of archetypes can be used by built environment professionals as standard representations of mixed-use programme types commonly found in their particular city, for example, in urban modelling applications such as UBEM.
Our methodology combines machine-learning methods (hierarchical clustering and multivariate analysis) to derive the programme profile for each mixed-use plot. The most representative profile of each cluster becomes the mixed-use archetype. The archetypes' definitions are represented and stored as a machine-readable ontology in .owl format. We applied our methodology to the city-state of Singapore, resulting in a total of 163 archetypes for the ten mixed-use zoning types used in Singapore’s master plan. Based on Singapore’s master plan data and Google Maps API data, we also formulated a list of 36 different programme types. We applied the resulting archetypes for Singapore by demonstrating their use in an UBEM workflow, simulating energy demand forecasts of an urban development proposal and evaluating its particular energy supply system design. We discussed how the use of our mixed-use zoning archetypes affected simulated results when compared to conventional building use representations used in UBEM workflows.
This work contributes to state of the art in three main ways. Firstly, it introduces a new concept, programme types, linking the zoning types used in land-use planning and the (building) use types used in UBEM and other urban modelling approaches. Secondly, these programme types are then used to create mixed-use zoning archetypes, which have many potential urban planning or city science applications. For example, they can inform the master planning process by serving as examples of possible planning outcomes for a plot with a similar GPR and zoning type. Such archetypal programme profiles also facilitate various urban modelling workflows that rely on representations of use type and use surface area, UBEM being the example highlighted in this work. Our archetypes remove the need for each modelling effort to independently determine mixed-use distributions when simulating mixed-use urban areas, reducing modelling time and increasing comparability between simulations. Thirdly, the representation of these archetypes as the ontoMixedUseZoning ontology allows for robust interoperability between the frequently updated Google Maps API data and the master-planning data. The semantic representation of the archetypes lays the foundation for a live and automated workflow to update the programme profiles and the archetypes at regular intervals when integrated into a Semantic City Planning System, providing the underlying technology to enable the monitoring of shifts in programmatic use patterns over time.
We want to highlight four research outlooks. First, as mentioned, we aim to automate the workflow introduced in this work in our Cities Knowledge Graph system. This would enable us to update the programme profiles and archetypes frequently whenever Google Maps API data is updated. Second, we want to apply the methodology introduced in this work to urban contexts beyond Singapore, as mixed-use urban planning initiatives are gaining ground worldwide. Third, we want to conduct sensitivity analyses comparing to what extent the mixed-use programme profiles and such aspects as urban forms are impacting the urban building energy performance. Finally, we will likely apply the ontoMixedUseZoning ontology in more types of urban modellings, such as transport modelling.
Supplemental Material
Supplemental Material – Defining archetypes of mixed-use developments using Google Maps API data
Supplemental Material for Defining archetypes of mixed-use developments using Google Maps API data by Zhongming Shi, Heidi Silvennoinen, Arkadiusz Chadzynski, Aurel von Richthofen, Markus Kraft, Stephen Cairns and Pieter Herthogs in Environment and Planning B: Urban Analytics and City Science.
Footnotes
Acknowledgement
Markus Kraft gratefully acknowledges the support of the Alexander von Humboldt foundation.
Declaration of conflicting interests
The author(s) declared no potential conflicts of interest with respect to the research, authorship and/or publication of this article.
Funding
The author(s) disclosed receipt of the following financial support for the research, authorship and/or publication of this article: This research is supported by the National Research Foundation, Prime Minister’s Office, Singapore, under its Campus for Research Excellence and Technological Enterprise (CREATE) programme.
Data availability statement
Supplemental Material
Supplemental material for this article is available online.
References
Supplementary Material
Please find the following supplemental material available below.
For Open Access articles published under a Creative Commons License, all supplemental material carries the same license as the article it is associated with.
For non-Open Access articles published, all supplemental material carries a non-exclusive license, and permission requests for re-use of supplemental material or any part of supplemental material shall be sent directly to the copyright owner as specified in the copyright notice associated with the article.