
Abstract
Analyses of urban spaces have often stressed the importance of both the density and diversity of the people they attract. However, the diversity of people is a challenging concept to operationalize within the context of urban spaces, which is why many evaluations of urban space have relied primarily on density-based measures. We argue that a focus on only one of the two aspects misses important aspects of the variety of urban spaces in our cities. To address this, we design a methodology that evaluates both the density and diversity of human behavior in urban spaces based on geosocial media data. We operationalize density as the frequency of tweets from visitors to a particular location and diversity as the variety of the home neighborhoods of those visitors. Taking Singapore as a test case, we identify networks between the home neighborhoods of 28k Twitter users based on 2.2 million geolocated tweets collected between 2012 and 2016. Based on these data, we categorize the urban landscape of Singapore into four “performance” categories, namely High-Density/High-Diversity, High-Density/Low-Diversity, Low-Density/High-Diversity, and Low-Density/Low-Diversity. Our findings illustrate that this combined indicator provides useful nuance compared to differentiation between well and less performing spaces based on density alone. By enabling a categorization of urban spaces that fits closer to the diversity of human behavior in these spaces, human mobility data sets, such as the social media data we use, open the door to a practical evaluation of the design and planning of our heterogeneous urban environment.
Introduction
Density and diversity are key aspects of the urban environment, each with their own characteristics. Density of people and the built environment is often considered as a prerequisite for a vital and sustainable city (Jacobs, 1961: 205), whereas diversity, too, plays a key role in fostering a dynamic and active city life (Montgomery, 1998). However, rapid urban growth—as we have seen over the last decades—can also be at odds with the ostensible heterogeneity of a vital city. Modern cities can run the risk of providing a relatively dense yet segregated or even homogeneous urban landscape (Mumford, 1961; Trancik, 1986). On that account, urban thinkers and designers as far back as the 1960s have advocated for the role of diversity in reviving or safeguarding this essential quality of urban life (Cullen, 1961; Jacobs, 1961).
However, to actually measure or empirically identify diversity whether it relates to the physical characteristics or social dimensions of urban spaces, is a formidable challenge. Venturi et al. (1997) pointed out that the design of our built environments relies mostly on “decorative shades” of standard boxes. The physicality of building facades may appear in a mix of shapes and sizes but do not necessarily reflect their uses and programs. Therefore, the physical diversity of the urban landscape is often approached in conjunction with variety of services and activities that the built environment offers (Carmona, 2001, 2019). Similarly, social diversity can be challenging to measure directly but can, for example, be proxied by the diversity of uses in an urban environment (Jacobs, 1961; Talen, 2012). This is why studies of urban diversity have adopted neighborhood-level land use (Fuentes et al., 2022; Talen, 2005), housing typology mix (Talen & Lee, 2018), and policy controls (Kleinhans, 2004) as indicators of social diversity in urban areas. More recent studies have also started relying on digital technologies and big data resources to analyze, for example, the diversity of building footprints (Scepanovic et al., 2021) and changes in neighborhood characteristics from street view (Naik et al., 2017) to evaluate social diversity at large.
In this research, instead of quantifying diversity from the physical environment or “use” perspective, we focus on the “user” dimension analyzing spaces from the perspective of different visitor groups. This perspective of the visitor, which constitutes one critical aspect of social diversity, can help capture meaningful insights around diversity and the formation of social capital at both neighborhood and urban levels (Glaeser et al., 2002). Thus, we explore more directly how this visitor-based approach can complement our understanding of the different characteristics of urban spaces. Diversity in our approach is the co-location of people from various neighborhoods. Therefore, instead of viewing urban spaces through the functional lens of housing, work, recreation, and transportation (Cullen, 1961; Mumford, 1961; Živković, 2019) that construct the physical form of the city, we analyze the social dimension of urban spaces through the daily mobility of people.
During the last two decades, geolocated social media has become prolific data sources to measure different aspects of urban spaces (Martí et al., 2019). This type of data allows us to conduct analysis to be at a granular scale than previously was possible by traditional, on-site data collection methods. More so, the detailed nature of these datasets and the ability to connect data over longer time periods, create opportunities to start to measure more intangible aspects of urban spaces, such as quantifying the diversity of participants of urban spaces, as we do in this article.
However, research utilizing geosocial media data often relies on metrics derived from the frequency of posts, essentially measuring density, as a proxy for the activity or “vitality” of a specific geographic location (Chen et al., 2019; Kim, 2018). Although a certain density of people might be an important contributor to an active social environment, there does not need to be a direct, linear correlation with diversity (Talen, 2012). Diversity differs from density in the urban design context because diversity might contribute to the potential for economic and social exchange and, ultimately, the vitality of a place (Greenberg, 1995). Furthermore, diversity in urban environments also links to social equity as it might engender access to the city for all social groups and generate opportunities for mixing and increased understanding between population groups (Talen, 2012). From this point of view, we argue studies of urban vitality can be significantly enhanced by not only using density-based metrics but also including a specific diversity dimension.
Here, we leverage geosocial media, Twitter specifically, to quantify this relatively intangible aspect of urban spaces. We first derive home locations from geotagged Twitter data and use this as a basis to construct networks of flows between urban locations. Then we infer diversity based on the variety of origins that visitors of a certain location have and analyze density according to the frequency of visitors within that certain location. Subsequently, we combine the two (i.e., diversity and density) metrics into a 2-dimensional categorization of the activity-level in urban spaces (see Fig. S1 in the Supplementary Material). In this way, we construct a bottom-up activity-based classification of urban spaces, rather than one that is based on land-use or policy-prescribed urban functions.
To illustrate this potential, we select Singapore as a case study and combine the inferred 2-dimensional categorization of each location’s activity level with land-use data to contextualize our findings. As such, the research sketches out the overall socio-spatial landscape of Singapore, with patterns of “vitality” (high density and high diversity) and “low profile” (low density and low diversity) places clearly identified throughout the city. Beyond that, most interestingly, our approach also identifies locations that might easily be overlooked if diversity would not be considered (i.e., low density and high diversity). For instance, local neighborhood parks that are loved by local residents can attract diverse visiting groups but do not draw the same crowds that popular tourist destinations do. Although these locations are valued urban amenities in spatial planning frameworks, the extent to which specific places contribute to this type of visitor-based diversity might not always be known or fully appreciated. As such, diversity-based metrics based on social media can offer an additional perspective on urban spaces study that helps urban planners and designers better understand and appreciate the variety of urban spaces in the city.
Related work
In urban studies, the concept of diversity has been used in a wide variety of context and has taken on many different definitions, from a mixture of physical characteristics (Jacobs and Appleyard, 1987; Montgomery, 1998), urban functions (Pendall, 2000), to social activities (Montgomery, 1998). Moreover, social diversity is seen as a normative goal in urban design and planning in order to promote social cohesiveness (Talen, 2012), to “bridge” social capital (Putnam, 2000), to capitalize on “collective efficiency” (Sampson, 2019), and to enhance urban vitality (Kang et al., 2021).
It is, therefore, no surprise that urban designers are constantly searching for solutions to bridge the relationship between diversity and the design of the built environment. For example, there have been various comprehensive models that attempt to evaluate and measure urban spaces from these aspects. The Star-Model proposed by Varna (2014) evaluates the attributes of ownership, control, and physical configuration. Public Space Index (PSI) model empirically assesses the inclusiveness, meaningfulness, safety, and comfort through 43 variables that range from variety of activities to articulation in architectural features of context buildings (Mehta, 2014). The Tool for Urban Space Analysis (TUSA) evaluates all aspects of urban spaces in categories of Software (social dimension), Hardware (physical and spatial value), and Orgware (operation and management aspects) (Cho et al., 2016). These models all include the aspect of diversity in physical configuration and activity in a space based on visual observation, only the PSI model embeds measure of social diversity according to observations to infer people’s age, gender, and ethnicity, but not other aspects of social diversity (e.g., income and education).
Consequently, in empirical research of urban design and spaces, social diversity itself is often implied rather than directly observed or calculated. This is in contrast to analyses of social diversity in urban studies that often use metrics derived from census or survey data at the neighborhood level (Altman, 2018; Smith, 1998), as well as interviews to collect detailed demographic information. However, the use of such data in analyses of small-scale urban spaces can be both resource-intense and time-consuming and still only allows for a relatively coarse spatio-temporal understanding of social diversity.
Recently, new digital data sources on human mobility patterns are quickly becoming a valuable mainstay in urban research, as people’s spatial activities can be derived from GPS logs (Kong et al., 2018), mobile phone data (Li et al., 2019; Zhao et al., 2019) as well as geosocial media platforms (Psyllidis et al., 2018; Song et al., 2020). Geosocial media data have enabled new and creative approaches to study the urban landscape due to its relatively accessible nature and the detailed spatio-temporal resolution of the data. Such data have gained significant popularity as a way to investigate the spatial, social, and temporal characteristics of urban spaces (Li et al., 2019; Martí et al., 2019; Shaw and Sui, 2020). In addition, researchers have used these data to infer socio-geographical relations between people and places and use these relations to shine light on a number of urban issues such as individual activity spaces (Ayala-Azcárraga et al., 2019; Jurdak et al., 2015), social interaction (Prasetyo et al., 2016), gentrification (Poorthuis et al., 2021), and social inequality (Pendall and Hedman, 2016; Shelton et al., 2015).
Although, geosocial media presents outstanding potential, much of this research is based on an analysis of the “density” of social media activity but does not necessarily take into account the characteristics of who is creating this activity. As such, the diversity of urban space is understudied in this regard, except for some notable exceptions. For example, Hristova et al. (2016) explore the potential of geosocial networks (Twitter and Foursquare) to capture the social diversity of urban locations through mobility patterns of their visitors. Similarly, Wu et al. (2019) use mobile phone application data to study people’s exposure to racial diversity by considering their entire activity space, while Dong et al. (2020) and Moro et al. (2021) use mobile phone and Twitter data to analyze (income) segregation. These studies rely on a proxy for the socio-economic characteristics of individual users in mobility datasets. Often little is known about each user in this regard, but a home location can be inferred from each mobility pattern. This home location can be tied to a specific census tract, of which the socio-economic characteristics can be used as an—imperfect—proxy for the characteristics of people from that tract. In this paper, we will use a similar approach—using a person’s home location as a proxy for the diversity of their socio-economic characteristics—but instead of taking residents as our ultimate unit of analysis, we apply this technique to analyze the density and diversity of small-scale urban spaces.
Although geotagged Twitter data have proven to offer valuable affordances for urban research, it is worth noting that such data have clear limitations as well. These limitations range from the more technical, such as spatial accuracy and precision (e.g., Mittal et al., 2019), to the representational—the uneven data “shadows,” potential biased representation, and overall lack of socio-demographic information (Longley et al., 2015)—to the ethical (Boyd and Crawford, 2012; Zook, 2017). Different efforts have been made to partially address these challenges, for example, through aggregating mobility patterns or inferring larger patterns based on statistical models (e.g., Alexander et al., 2015; Phithakkitnukoon et al., 2010; Ye et al., 2009), through contextualizing data with nearby land use information and point of interests (POIs) (Horozov et al., 2006), and through specifically evaluating the bias in these types of data (e.g., Longley et al., 2015; Luo et al., 2016). It should be noted that in most applications of Twitter data any such efforts can only partially address these limitations, for example, because a “ground truth” is simply not known. In this regard, such data are not a replacement for census and surveys based on a representative sampling strategy.
In this research, we address this challenge by using a dataset provided by Chen and Poorthuis (2021) as our foundation. It is based on all Twitter users posting from Singapore between 2012 and 2016 and carefully filters out both sporadic users (because not enough data points exist to reliably infer meaningful locations) as well as “power” users (as these are likely bots and other automatic accounts). For the remaining users, a home location is inferred using both a set of derived variables that weigh spatio-temporal “home-like” behavior as well as a set of stringent filters designed to prevent false positives (see Table S1). Using this strategy, we filter out 93% of all users but the remaining 7% (∼28k users) follow the distribution of the population quite closely. Chen and Poorthuis (2021) report a precision of 77% based on a manual verification and a correlation coefficient between the number of detected users and actual residents per planning zone of 0.96. The results in this paper are further contextualized through and verified by the local knowledge of the authors. We will continue to discuss these issues in the following section and the conclusion.
Research methodology
As people move around the city, they create a web—a network—of connections between the different places they visit. In this work, we infer this network of connections from Twitter data. When users opt-in to this, tweets contain explicit coordinates and timestamps that reflect the spatio-temporal path of its creator. The more often a person tweets from a place, the more likely that place is meaningful to this person and thus the stronger the connection to that location (Hossain et al., 2016; McGee et al., 2013). We use these networks to ultimately understand the specific make-up of the visitors to a particular place and by extension the social diversity of a location. As such, we are able to operationalize both the density (i.e., frequency of visits) as well as the diversity of visitors (where individuals are visiting from).
To illustrate our approach, we begin by evaluating the visitor density, followed by analyzing diversity based on the variety of home locations of these visitors. We then combine these two concepts into a 2x2 matrix (see Figure S1) that allows for the categorization of activity levels in urban spaces. We take Singapore as the case study and use an anonymized locational based social media (LBS) dataset that contains approximately 22 million tweets sent by around 405.5k users from July 2012 to Jun 2016 (Chen and Poorthuis, 2021) for the analyses. It is important to note that the precision of the geographical attributes of social media is varied based on both user settings (automatic or self-entered) and the accuracy of the used smartphone devices (Shelton, 2017). To circumvent this issue, we aggregate data points to hexagonal grid cells with a 300-meter resolution. In doing so, our analysis includes a total of 10,910 grid cells with 71% of them containing tweeting activity.
Density analysis
We define density based on the visitor frequency of tweets that can be geographically linked to a location. However, simply aggregating data points can result in the mere mapping of a tweet population distribution without yielding any meaningful insights (Poorthuis et al., 2014). For instance, in the Singapore context, this will only identify the “global” (i.e., island-wide) high-density places, like well-known tourist spots (e.g., Marina Bay Area, Chinatown, and Orchard Road) but easily dismiss other significant neighborhood spaces with much less footfall relative to these city-wide hotspots. This can yield a skewed understanding of the overall social landscape of a city. Therefore, we instead opt to calculate a “local” version of a density metric that makes the density in a location relative to the density in its vicinity. Specifically, we use a 1km buffer, which encompasses a community with approximately a 15-minute ped shed and compares the density value of each grid cell to that of the 1km neighboring area. Therefore, the local density (D) of a grid cell is calculated as follows
To ensure grid cells have sufficient observations for the analyses, all grid cells with fewer than 100 tweets and fewer than 5 different visitors during the entire study period are eliminated. As such, we retain a total of 4588 (60%) grid cells for subsequent analysis.
Diversity analysis
We define diversity as the variety of visitors’ home locations to each urban space (i.e., the 300m grid cell). To operationalize diversity, we first infer home locations of visitors by using “homelocator” package developed by Chen and Poorthuis (2021). The embedded HMLC algorithm weights data points sent by a user across multiple time frames and extracts the location with the highest accumulated weights as the user’s home location. The detailed parameters used in the algorithm are attached as Table S1 in the Supplementary Material. In doing so, we are able to identify 27,892 (7%) users’ home locations (see Fig. S3(a)). As a validity test of this approach, we compare the spatial distribution of inferred home locations with Singapore’s public housing locations—derived from the Singapore Land Authority data, where 80% of Singaporeans are housed. The home location pattern correlates heavily with the public housing clusters, indicating that the identified home locations can be sensibly used as a proxy for the subsequent diversity analysis (see Figure S3(b)).
Following, we apply the concept of biological diversity from ecology by adopting the Shannon diversity index (H)
1
. It evaluates both the richness and evenness of the distribution for all species within an ecological environment. This concept resonates with the social variables used to analyze the composition of diversity in visitor groups at the neighborhood level (Talen, 2012). Borrow the concept of “species” from ecology, we construct dynamic buffers for each grid cell based on different radius distances and directions (citation omitted for blind review). Specifically, we construct buffers with 1 km, 3km, 5km, and 10km radii around each grid cell, and further divided these circular buffers by the four cardinal directions (i.e., Northeast, Southeast, Northwest, and Southwest), yielding a total of 24 different zones (see Fig. S4). These dynamic zones reflect the different distances as well as related purposes and motivations that lie under people’s travel behavior (Spinney and Millward, 2013). For example, people visiting from within the 1 km buffer are more likely to be local residents who use the space in a daily manner. As the distance increases, visitors would be visiting for different reasons and frequencies, and are thus construed as a different “species” in the diversity calculation. In doing so, we are able to compute a single quantitative metric to represent the different groups of visitors visiting from different geographical zones. The Shannon index (H) is calculated as follows
However, it is important to note that the size of the zones increases at larger distances, which may result in a bias of the diversity findings. To alleviate the issue, we use visitor density instead of actual counts of visitors by normalizing by the zone area.
Spatial classification
The concepts of “density” and “diversity” are then combined to form a 2x2 categorization matrix for classifying the activity level in an urban space. Due to the different calculation methods as described above, the natural distribution for density value is skewed (skewness = 34.21) ranging from 0.00074 to 5.07246, while diversity value ranges from 0 to 2.5. To ensure the density and diversity metrics are on the same scale, we first apply log transformation on the density value, and then rescale the diversity based on the minimum and maximum value of the logged density. The scaled density and diversity are used as x-axis and y-axis separately in the matrix (see Figure S2). Subsequently, locations with density and diversity values above the median (50% benchmark) are classified as High-Density and High-Diversity (H-density/H-diversity). These places are the high “vitality” locations in the city that attract many visitors from different parts of the city. The same logic applies to the rest of the three categories, namely High-Density and Low-Diversity (H-density/L-diversity), Low-Density and High-Diversity (L-density/H-diversity), and Low-Density and Low-Diversity (L-density/L-diversity) as, respectively, with different levels of density and diversity measures.
Furthermore, within each category, we identify the top 30 places, representing examples of an “ideal” type in that category. In the empirical analysis, we will visualize these geographical locations, and contextualize them so they can be used as an informed indicator for understanding Singapore’s urban spaces’ socio-spatial characteristics.
Results and discussion
In this section, we first discuss the results of our analysis of density and diversity in Singapore separately, before combining the two measures in the categorization of urban spaces. As discussed previously, density encompasses a localized measure of density relative to a 1km buffer around each area. Figure 1(a) shows the overall spatial distribution of density. To contextualize the resulting patterns, we zoom in from city-scale to neighborhood scale. Specifically, we take the neighborhood of Tampines as an example (see Figure 1(b)), which is one of the four regional centers in Singapore housing with an array of facilities and urban programs to support residents’ needs. The places with the highest local density in Tampines are the transportation interchange, IKEA shopping complex, ITE college campus, and the exposition center. This makes sense as urban transportation interchanges, large commercial complexes, education institutions, and event spaces are bound to attract large crowds. The second category of relatively dense places (relatively “active”) is identified at the center of the large public housing complex developed by the Singapore Housing Department Board (HDB) in the area. HDBs, as they are colloquially called, are high-density residential clusters that house ∼80% of Singaporeans. Again, these results by themselves do not reveal anything unexpected about urban vitality in this area of Singapore. Where it is expected to have a much higher density of population in the area and exhibit relatively high social activity. Spatial distribution of density and diversity. (a) Logged local density of Singapore; (b) Logged local density of Tampines; (c) Normalized diversity of Singapore; (d) Normalized diversity of Tampines.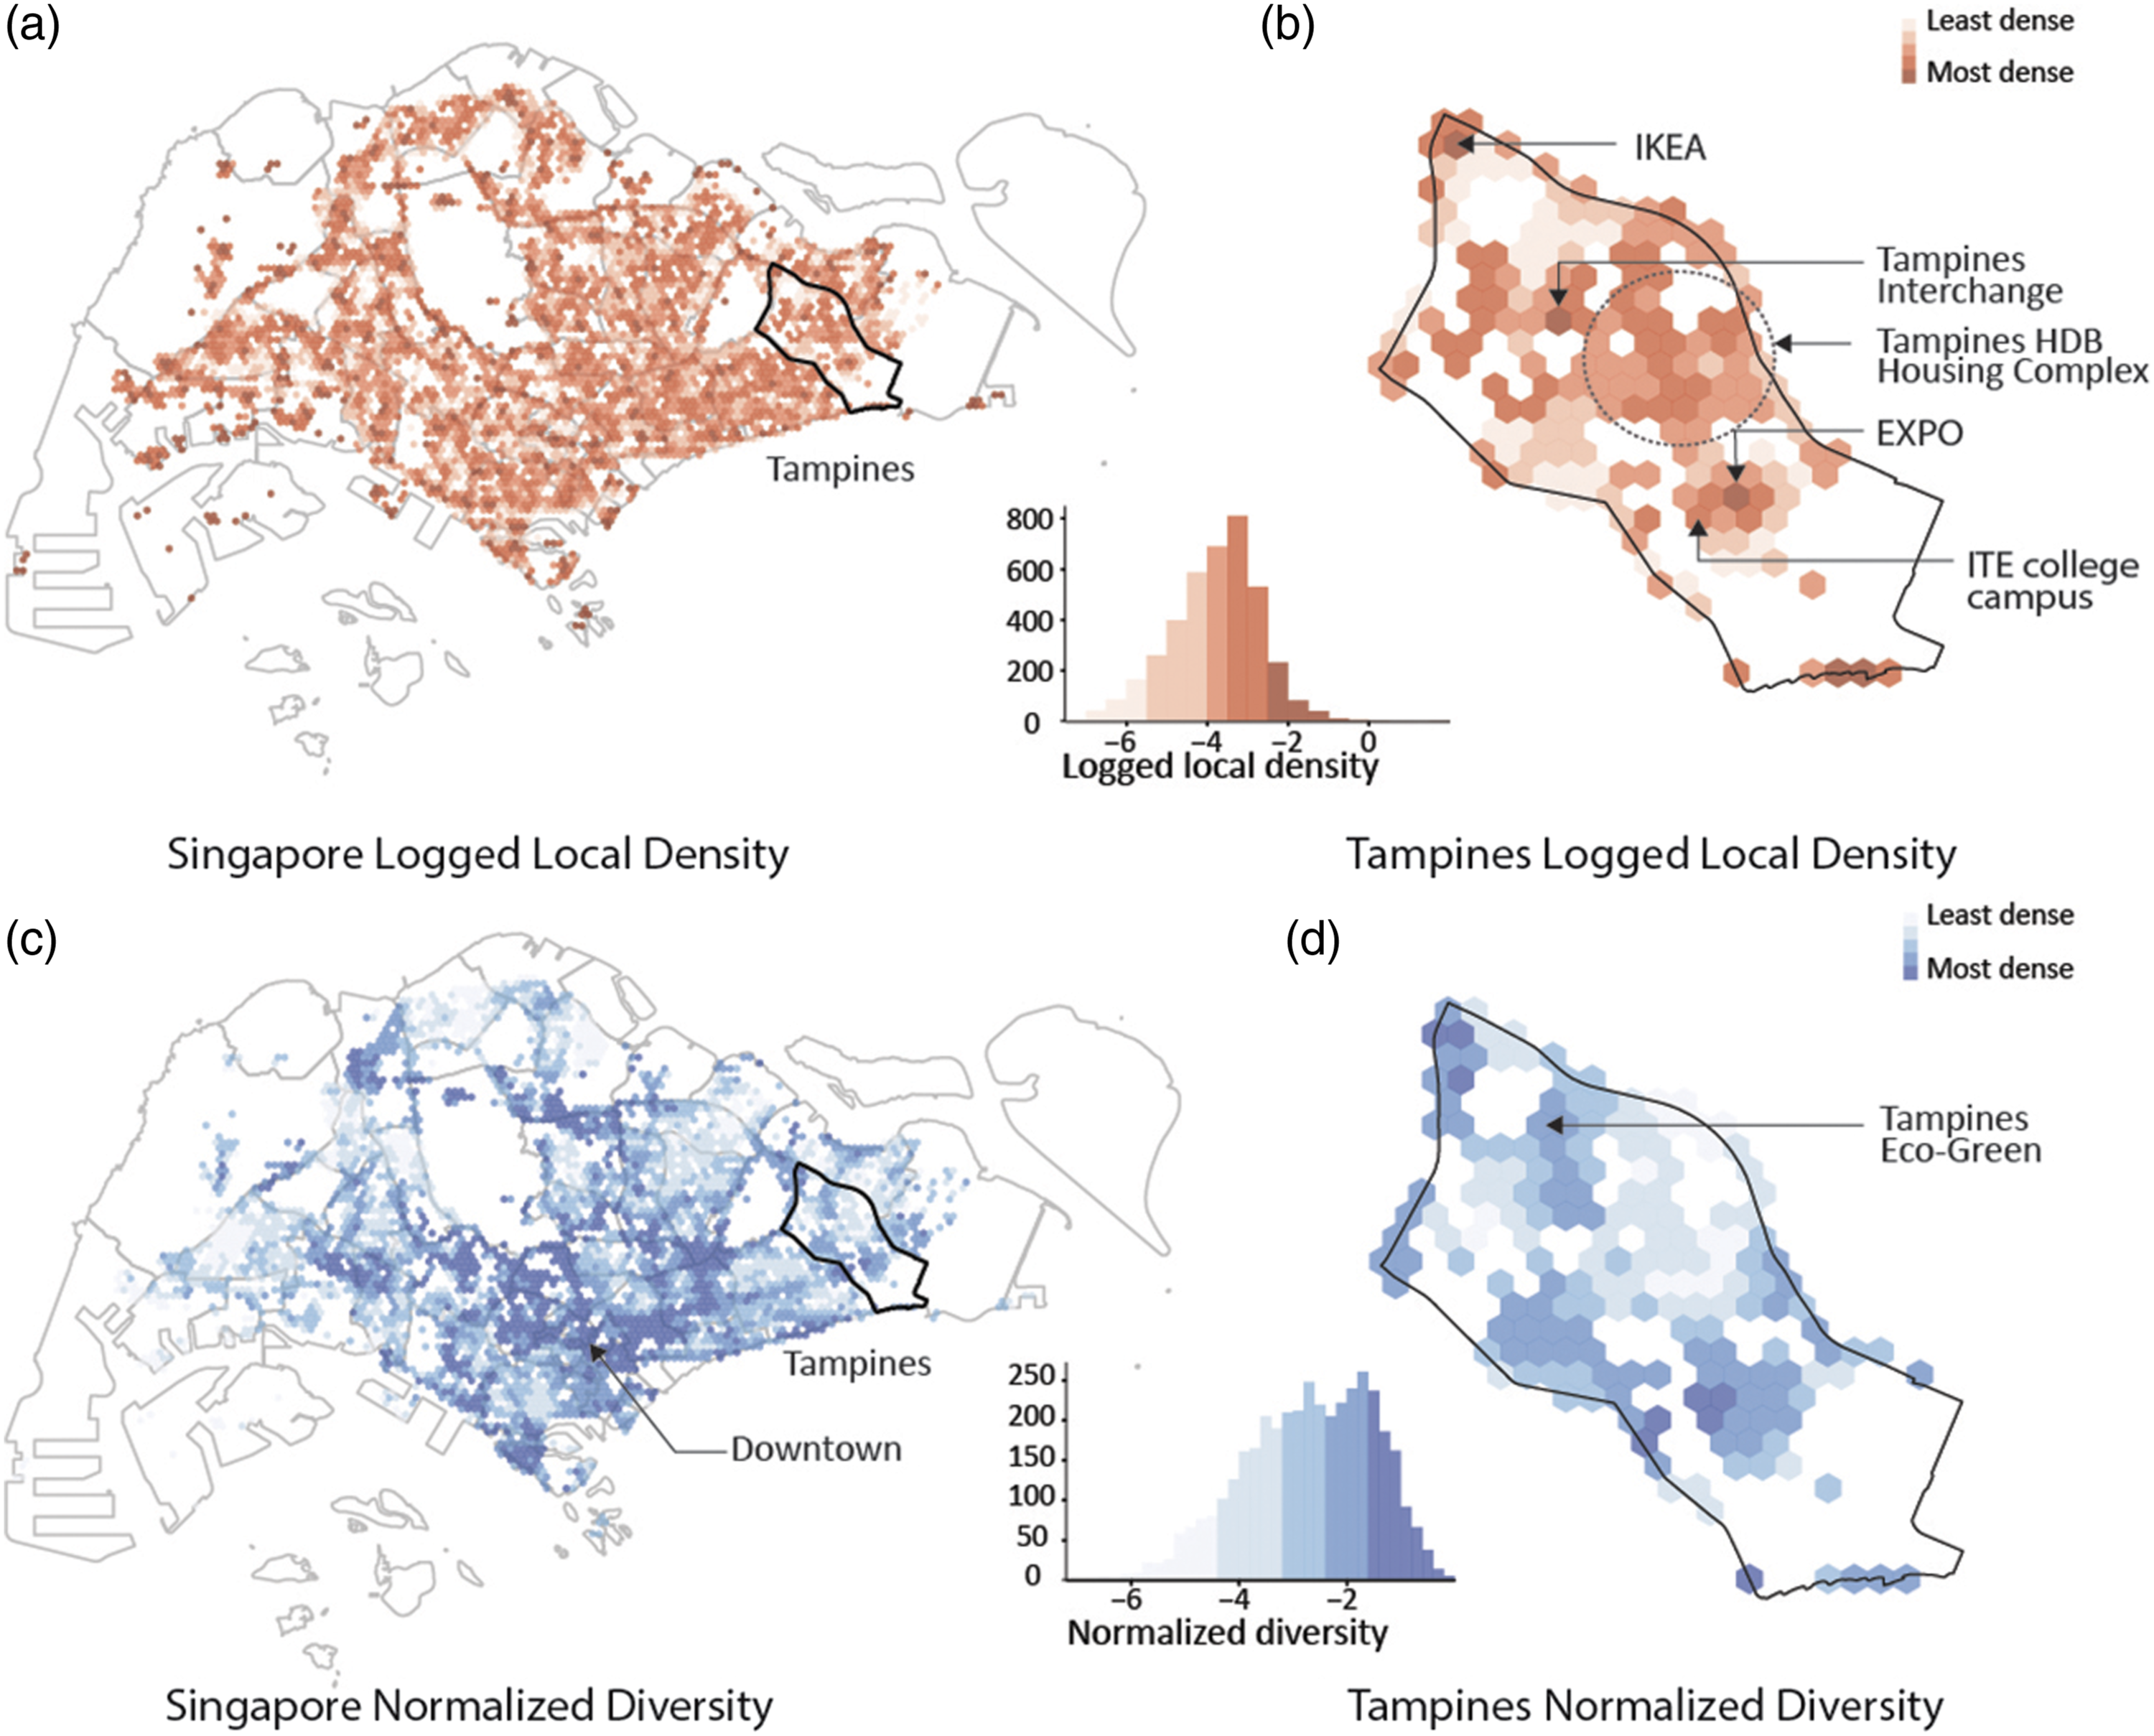
The mapping of the diversity metric in Figure 1(c) highlights the downtown area and marks the major express highways, reflecting that both roads and the downtown area generally attract a wider diversity of people than the residential neighborhoods in the peripheral ring around Singapore (colloquially referred to as “the heartlands” in Singapore). However, in the context of Tampines (see Figure 1(d)), the diversity mapping reveals an immediate contrasting pattern to the density mapping in Figure 1(b). The most distinct difference is that the high-density HDB areas are identified with very low diversity measures. In this sense, residential areas are predominantly local or private, that domain with fewer public incentives to attract visitors from different neighborhoods. This is especially the case in the Singapore context where family members often live in the district of the city. Some of the most diverse places also come back as the denser places in the previous section. But importantly, there are some clear discrepancies as well. For example, Tampines Eco Green—an ecological park focused on nature trails—does not rank as a very dense place, but it does seem to attract visitors from a wide range of neighborhoods.
As demonstrated from plotting “density” and “diversity” measures (see Figure S2), there is a minimal association between the two (Pearson’s correlation coefficient = 0.01). In other words, the two metrics are independent of each other in the sense that high-density places can certainly have a low diversity in the origin of visitors (e.g., HDB housing), or high-diversity places can have a limited number of visitors (e.g., Tampines Eco Green). Based on either variable individually, evaluating urban space can result in a biased assumption of what a “well-performing” (high-density and high-diversity) urban space is. Therefore, we argue that both variables should be equally considered to obtain a balanced and comprehensive view of our urban spaces.
To illustrate how the combined density and diversity measure can be used to classify urban space, we take a few representative locations from the top-30 places mentioned earlier in each category and discuss the underlying reasons that may contribute to specific activity levels in each place. Figure 2 outlines a general typology for each spatial category, where H-Density/H-Diversity places are prone to be high profile tourist destinations, H-Density/L-Diversity places are located mostly at high-density residential neighborhoods, L-Density/H-Diversity places are identified with leisure programs, and L-Density/L-Diversity places that tend to be low density with unitary urban functions. Spatial categories and representative spots. 1) Ion Orchard MRT Station, photography by 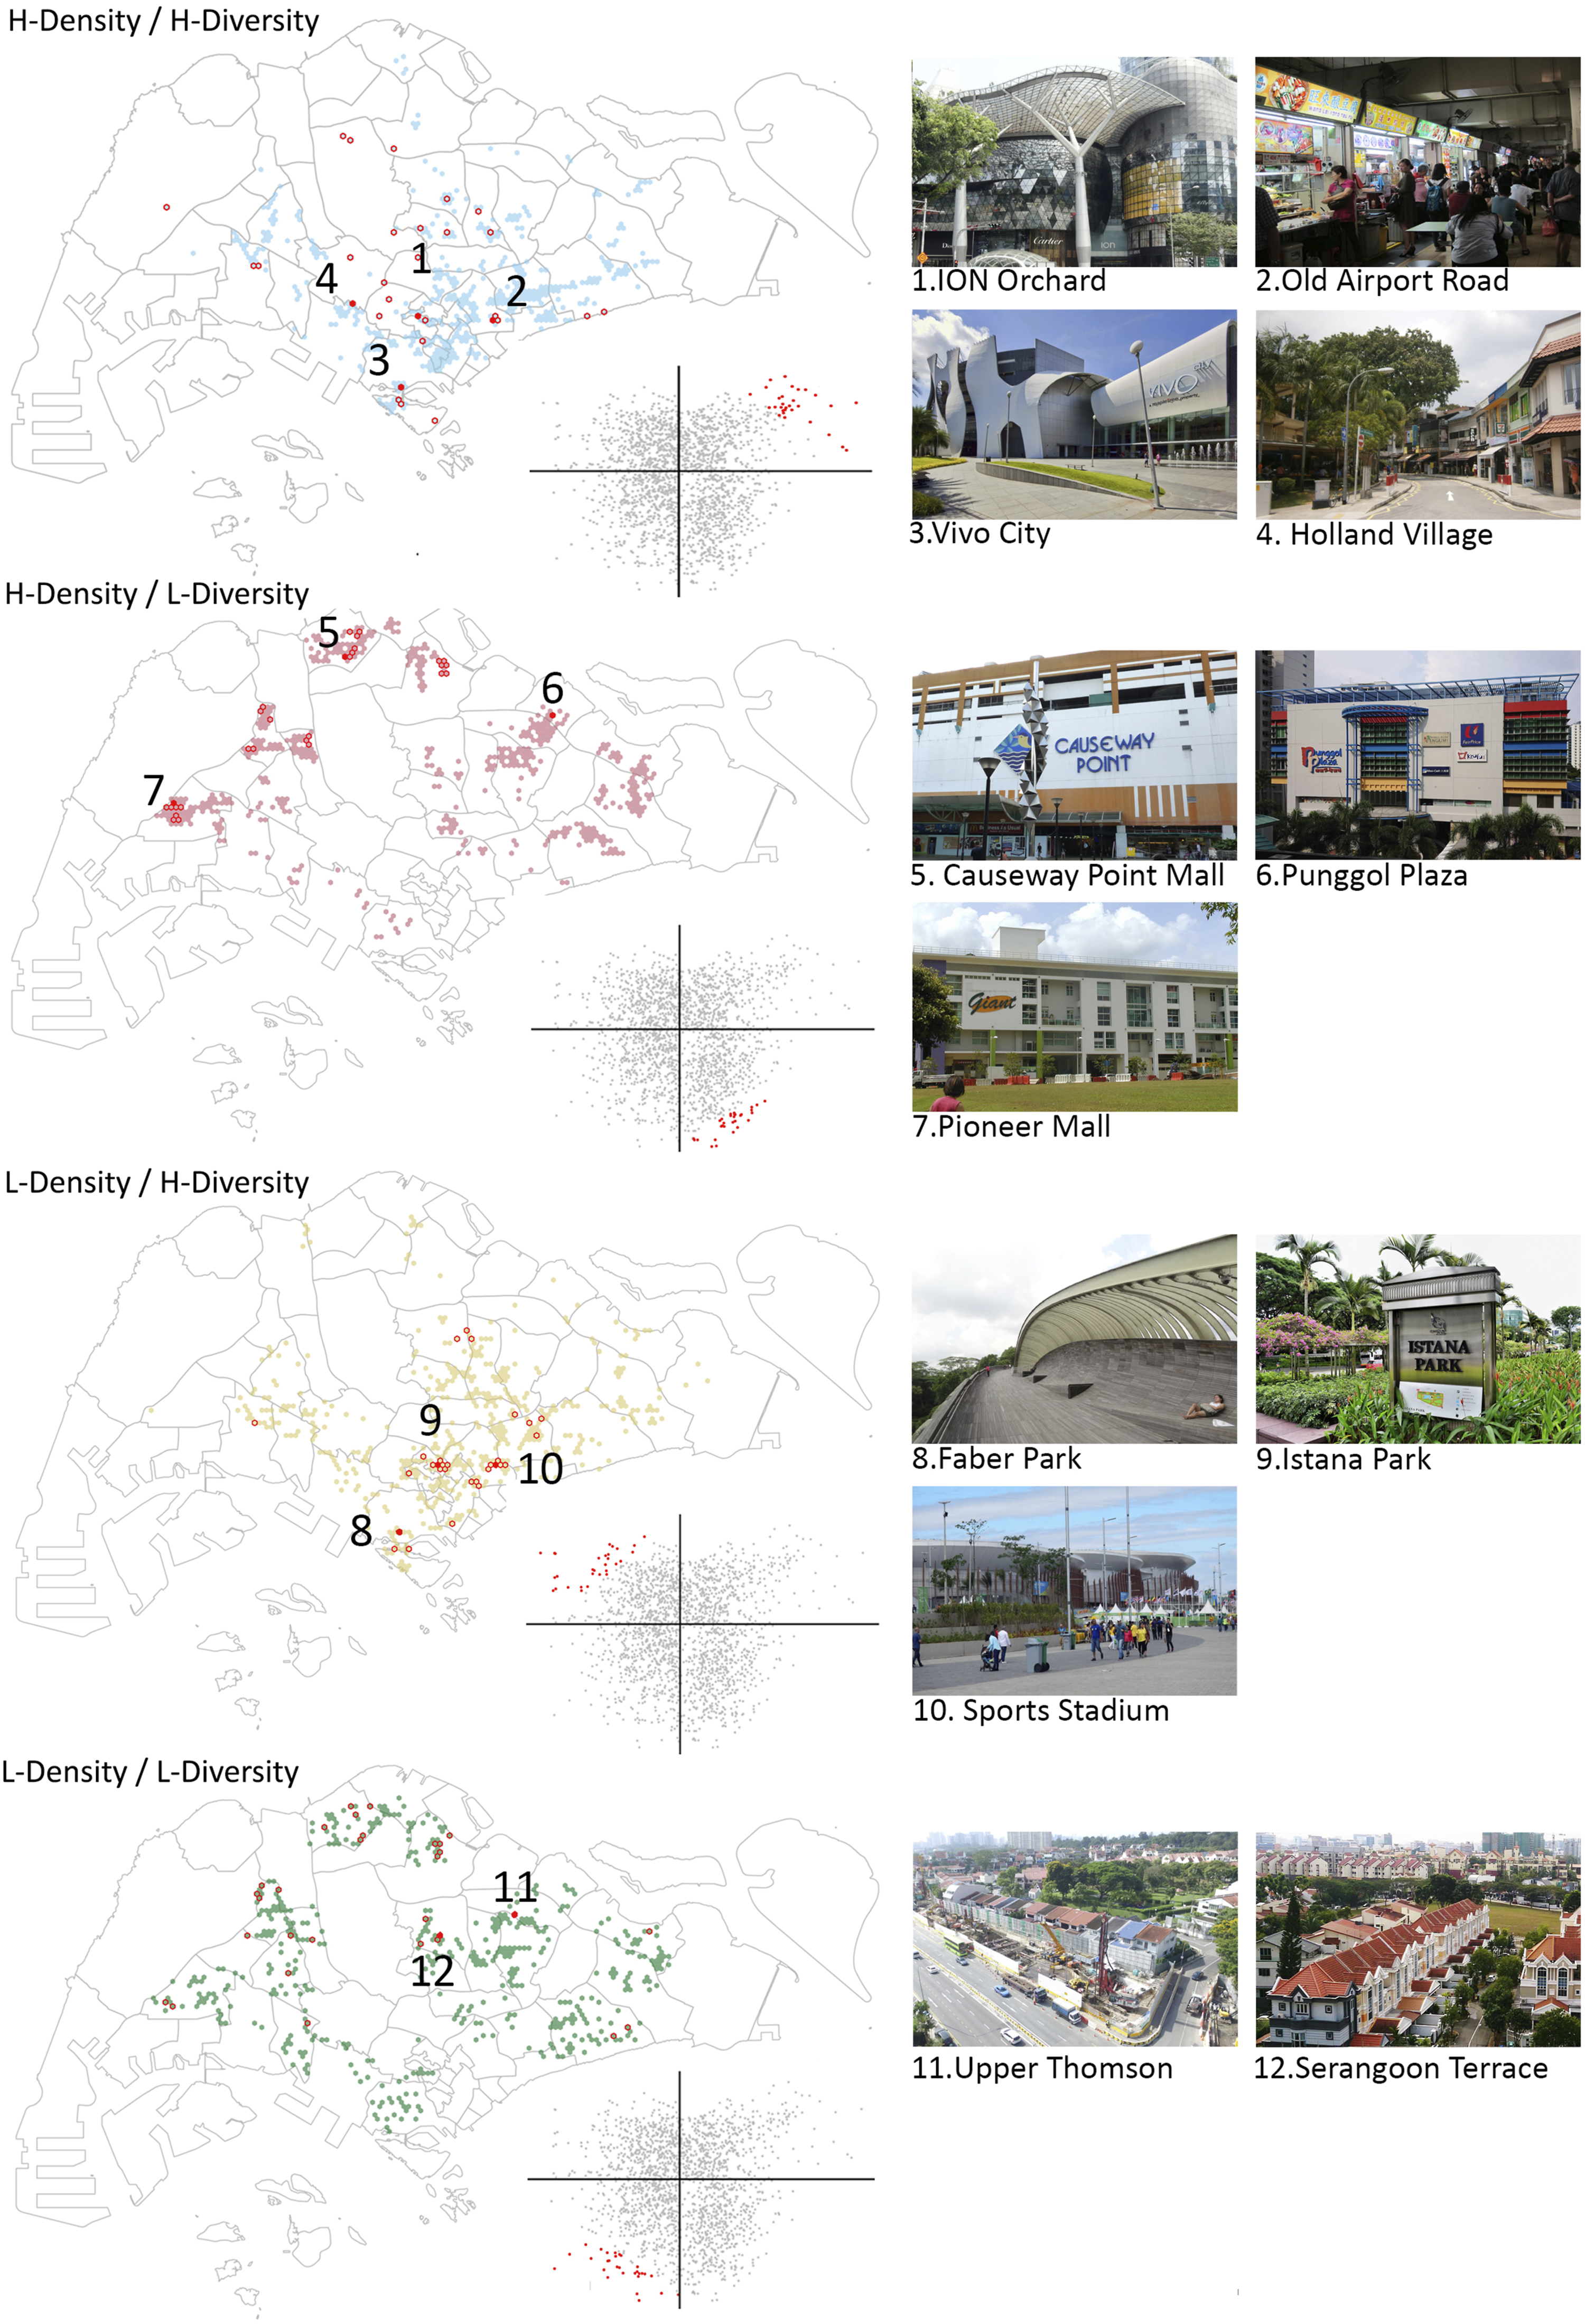
More specifically, in the H-density/H-diversity category, HarbourFront Vivo City, Holland Village, Orchard MRT station vicinity, and the Old Airport Road Food Centre are four well-known destinations. It is expected that these high-profile places would have both a high density and diversity of visitors. For instance, the Orchard MRT station area is a prominent transportation hub that inter-connected four different subway lines and the heart of Singapore with vibrant commercial and social activities. HarbourFront is a landmark destination that houses a range of leisure and recreation facilities for both international and local visitors. Other places like Holland Village, which is a well-known expatriate social enclave that houses services for foreigners and is also home to many famous and characteristic pubs and restaurants to draw visitors from all over the city. Most interestingly, it is the places like Old Airport Road Food Center, a local favorite with classic dishes and long history that attracts both locals from all different areas of Singapore but less well-known for tourists, that can be identified using the localized version of density we use here. This illustrates the capability of the methodology for reflecting insights that are contextualized to both global and local conditions.
As demonstrated earlier, high-density places do not directly imply a high-diversity place and vice versa. Looking at the H-density/L-diversity category, spaces that fall in this category are primarily dense residential community centers or local shopping centers, such as Woodlands Causeway Point Mall, Jurong West Pioneer Mall, and Punggol Plaza. These neighborhoods are Singapore’s “heartlands.” They are planned to be relatively self-contained to cater to residents’ daily needs with markets, shopping malls, cinema complexes, restaurants, and schools. In this sense, there are relatively few reasons to travel from one residential community to a community or shopping center in another neighborhood. From this point of view, these heartland areas are highly populated with residents and cater primarily to locals, which are in line with our expectation of high density but low diversity urban space.
Among the four categories, L-density/H-diversity spaces make up the most interesting quadrant. It is here that the addition of diversity to the study of urban activity makes the most difference. Research that focuses only on density can easily overlook locations with diverse visitor presence. The underlying characteristics of locations that attract highly diverse groups of visitors even if they do not draw large crowds, can be informative to derive insights for future urban space design to be more inclusive. Based on our findings, the representative locations are Istana Domain and green recreation spaces (e.g., Faber Park, Singapore sport stadium parks). The Istana is the official residence of the President of Singapore and its grounds are often used for state functions and ceremonial occasions. The result shows that the Istana incurs diverse but less dense visitor groups from different areas across the city, which is akin to the nature of its program. In addition, the categorization also identifies green recreational spaces, for example, Faber Park is one of the oldest parks with a lookout point, which offers stunning panoramic views and a wide range of activities to visitors. Although Faber Park is a well-loved recreational park, compared to high-profile tourist destinations such as Marina Bay, the frequency of visitors is distinctively lower. If solely focusing on the density index, we could easily overlook such a successful urban precedent. This example again demonstrates the capacity of the method for capturing the hidden well-performing urban spaces.
The last category is the L-density/L-diversity urban spaces. We observe places at the landed property neighborhoods where housing density is relatively low or places along the country’s periphery adjacent to open green. For example, landed property neighborhoods at Seletar Hill and Thompson community. These locations are expected to have a lower density and diversity of visitors. Although they are less interesting from an urban design point-of-view, this category does provide a useful sanity check for the categorization we employ here.
Conclusion and future research
In this article, we have applied a quantitative analysis of the density and diversity of urban spaces through geosocial media data. This combination of density and diversity into a single categorization allows us to classify urban spaces based on human behavior. Instead of analyzing urban landscapes through the more common functional lens of land use or urban programming, this analysis foregrounds the social dimension of activity in urban spaces. The resulting 2x2 activity-based matrix helps to categorize urban spaces into four types, namely H-density/H-diversity, H-density/L-diversity, L-density/H-diversity, and L-density/L-diversity categories. This matrix offers a scan of the overall socio-spatial landscape of Singapore that identifies “vital” (H-density/H-diversity) urban spaces as well as “low profile” (L-density/L-diversity) locations. However, most interesting is the capability to highlight locations that score high on only one metric, and would likely be missed by analyses taking into account either density OR diversity.
As such, we argue that, although both the density and diversity of participants in urban spaces play a key role for the vitality of the city, the two concepts should be treated as independent, uncorrelated variables and be taken into account together. In conventional urban research, the intangible quality of diversity poses significant challenges for the operationalization and measurement of this concept. In order to address this challenge, we design a systematic approach to tabulate “diversity” of visitor groups based on social media data (or other similar datasets) so that it can be evaluated together with “density.” We operationalize density as the frequency of tweets from visitors to a particular location and diversity as the variety of the home neighborhoods of those visitors. Even this relatively simple proxy for diversity helps to create a better understanding and evaluation of urban spaces and their performance. Subsequent analysis with a more complete definition of diversity, including socio-economic characteristics, is likely to yield a more comprehensive view.
The Singapore case study reveals insights demonstrating that the concept of diversity is an important determinant for identifying “well-performing” urban spaces. Specifically, through contextualization with our own local knowledge, we show that adding diversity to density allows for an understanding of how people use urban spaces that is closer to the ground-truth of our qualitative understanding of many spaces. The analysis has successfully identified places that were expected to be in specific categories, such as highlighting top tourist destinations like Marina Bay and the Orchard Road area in the H-density/H-diversity category, which provides an important validity check for this research method. However, the most fruitful insight is the capability to locate the “in-between” classifications categories (i.e., L-density/H-diversity and H-density/L-diversity) and also the “outliers” within each performance category. These findings open the opportunity to examine further underlying factors that contribute to a specific categorization or high value on either metric. For instance, Tampines Eco-Green is a park and nature reserve that falls in the L-density/H-diversity category. During a physical visit, it is often quiet and not that many can be seen. However, the analysis here suggests that the visitors that it does attract are very diverse: they come from many different neighborhoods. We would argue that such a place, with low-density visits but that sufficient incentives (e.g., comfort, identity, accessibility, spatial quality, and programs) to draw diverse groups of visitors, provides solid ground to be further studied and learned from to inform the future design of inclusive (diverse) urban spaces.
This activity-based perspective on urban space in the city creates many potential research opportunities, such as studies focusing on the functionality of space (e.g., do we find specific uses in different density/diversity categories?), or their physical qualities (e.g., can certain design aspects help explain why places have a high density/diversity score?). The research can also be expanded by taking into account other geo-located datasets, for example, mobile application data, which potentially offers a more finely grained spatio-temporal resolution or by incorporating other ancillary datasets (e.g., standard census data), which can provide additional explanatory value in terms of users’ socio-demographic characteristics. This would also help alleviate the clear limitations and bias of Twitter and other social media datasets. We would like to stress here again that our Twitter-based analysis only provides a partial perspective on the diversity and density of urban spaces in Singapore. It is used here as an illustration of the value of combining diversity and density for analyzing urban spaces with mobility data. In addition, as discussed previously, the specific definition of diversity can significantly impact the resulting view on urban spaces. As such, exploring other diversity definitions (e.g., socio-economic, language, text, temporal, and travel distance) can contribute to a more comprehensive view of urban space.
Nonetheless, this research further widens the use of LBS data for urban analysis by adding the dimension of diversity to existing (density-based) approaches to understanding urban spaces. It opens the door to more informed evaluations of spatial performance, quick scans of social hotspots or underutilized spaces, and the foundation to make informed decisions for future urban design and development.
Supplemental Material
Supplemental Material - Categorizing urban space based on visitor density and diversity: A view through social media data
Supplemental Material for Categorizing urban space based on visitor density and diversity: A view through social media data by I-Ting Chuang, Qingqing Chen, Ate Poorthui in Environment and Planning B: Urban Analytics and City Science
Footnotes
Declaration of conflicting interests
The author(s) declared no potential conflicts of interest with respect to the research, authorship, and/or publication of this article.
Funding
The author(s) received no financial support for the research, authorship, and/or publication of this article.
Data availability
Supplemental Material
Supplemental material for this article is available online.
Note
Author Biographies
References
Supplementary Material
Please find the following supplemental material available below.
For Open Access articles published under a Creative Commons License, all supplemental material carries the same license as the article it is associated with.
For non-Open Access articles published, all supplemental material carries a non-exclusive license, and permission requests for re-use of supplemental material or any part of supplemental material shall be sent directly to the copyright owner as specified in the copyright notice associated with the article.