
Abstract
Capturing whether mysteries of trade are ‘in the air’ remains a central issue for understanding the spatial nature of innovative activities. We offer new insights on the intangible dimension of the geography of innovation comparing the spatial distribution of patenting rates and a novel measure of ‘innovative buzz’ from a 9-billion-word corpus based on 900 million geolocated tweets across US counties. We find the use of words connected to innovation and technology to be characterised by significant spatial concentration. The results show the presence of strong bivariate correlation in the spatial clustering between the two elements, pointing to stimulating opportunities in the use of big data from social media for economic geography research.
Researchers have started leveraging new sources of geo-localised information available through Twitter to offer insights on a diverse range of spatial perspectives including localised personality traits and geographical variation of heart-disease (Eichstaedt et al., 2015; Obschonka et al., 2019). Similarly, linguistics analysis has utilised big data from social media to reveal regional linguistic variation (Grieve et al., 2018).
This study applies big data analysis to explore intangible elements in the geography of innovation. We compare the spatial clustering of patents per capita (Pat_Cap), collected from the USPTO, to a novel variable reflecting social media discussion and ‘buzz’ around topics related to technological innovation. This variable, labelled InnoTech_Tw, is based on a corpus of around 8.9 billion words from 890 million geocoded Tweets across US counties in 2014 (for more information on the dataset, see Grieve et al., 2018). It is defined as the sum of the relative frequency of all words in each US county weighted by their cosine similarity to both terms innovation and technology obtained by applying the word2vec algorithm on a dataset of 300 dimensional vectors for 3 million words trained on a corpus of roughly 100 billion words from Google News 1 (Mikolov et al., 2013). In line with text analysis methods, the values are adjusted by the inverse word frequency in order to confer a smaller weight to words that are more common in the corpus.
We compare the spatial distribution patterns of the two variables analysing their Getis-Ord Gi*(d) statistic as measure of local clustering (Getis and Ord, 1992). The threshold distance for the spatial weight matrix is set at 100 km. 2 We map the z-scores in Figure 1. Patents per capita reflect the well-known uneven distribution of patenting intensity across US counties. Similarly, z-scores for InnoTech_Tw also indicate marked spatial concentration in ‘innovative buzz’ within tweets. More importantly, spatial clusters for the two variables broadly overlap.
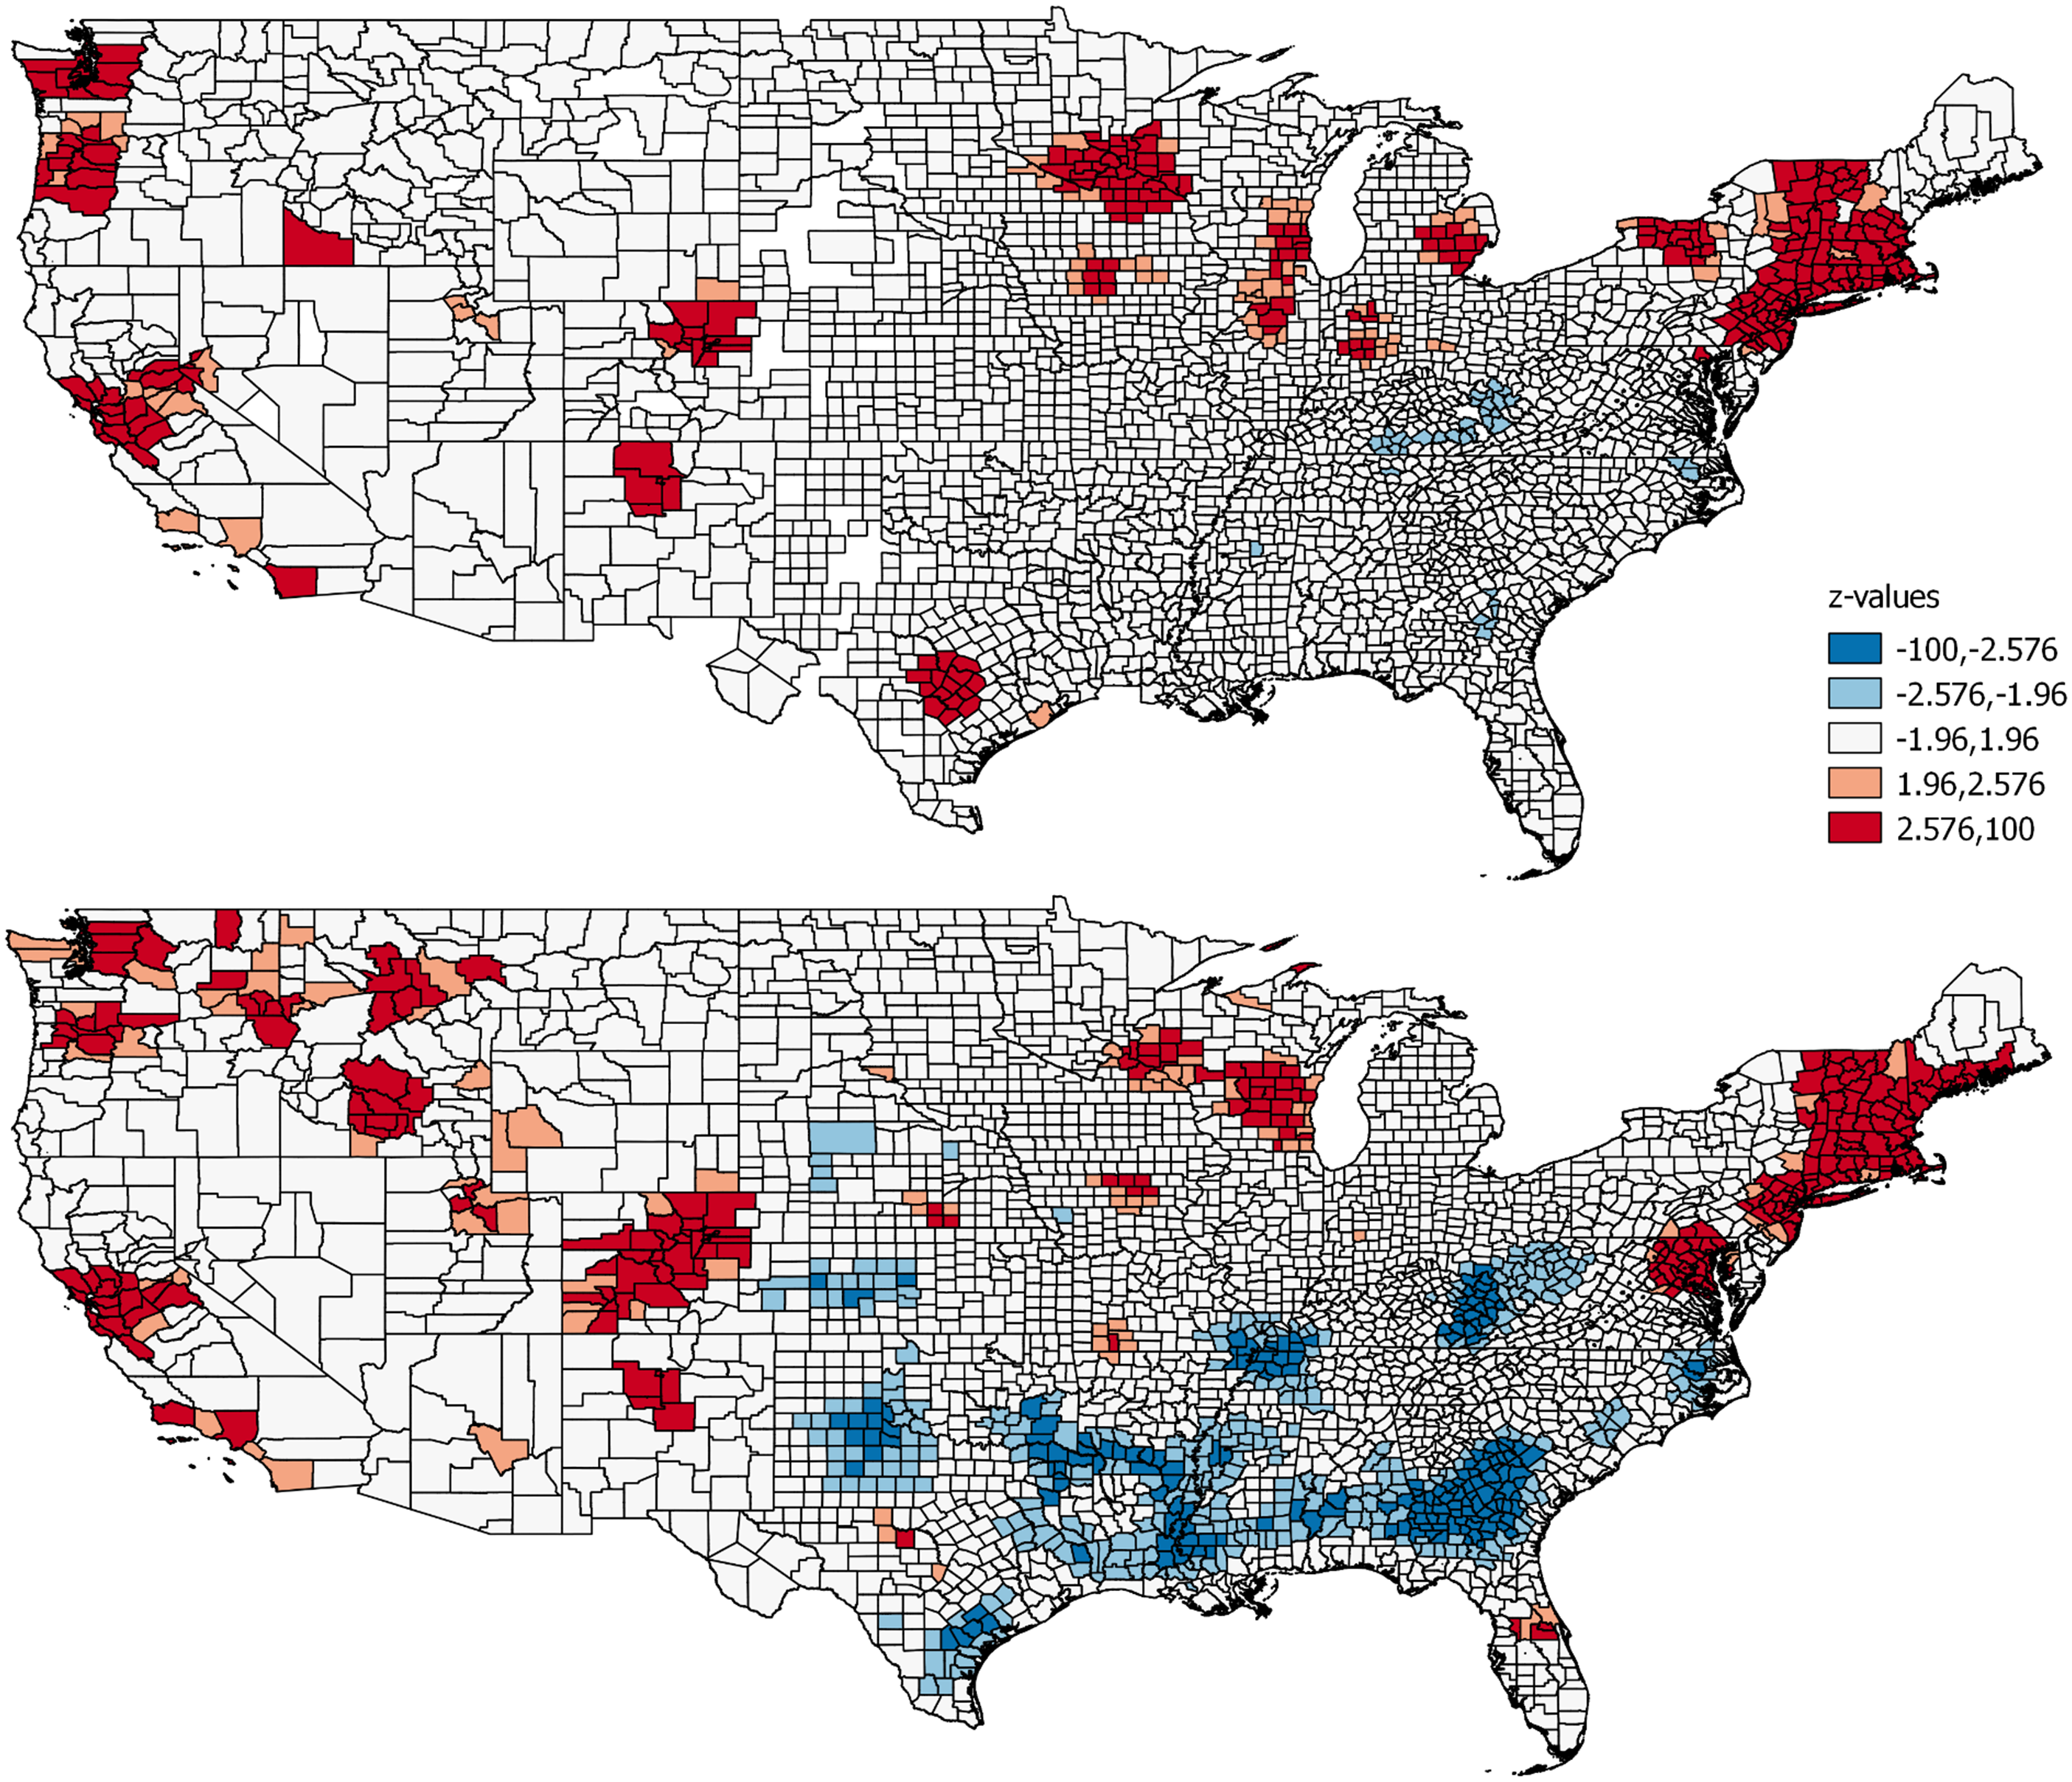
Getis-Ord Gi* z-scores for Pat_Cap (Top panel) and for InnoTech_Tw (Bottom panel).
We illustrate this relationship in Figure 2 across four quantiles of college education levels. The overall Pearson’s correlation coefficient for the Getis-Ord Gi* z-scores is 0.68 (p < .001). Considering only significant z-scores beyond the 1.96 significance level this increases to 0.75. The strength in this relationship is confirmed by the strong Pearson’s correlation between log of patents per capita and InnoTech_Tw of 0.69 (p < .001) shown in the right panel of Figure 2.
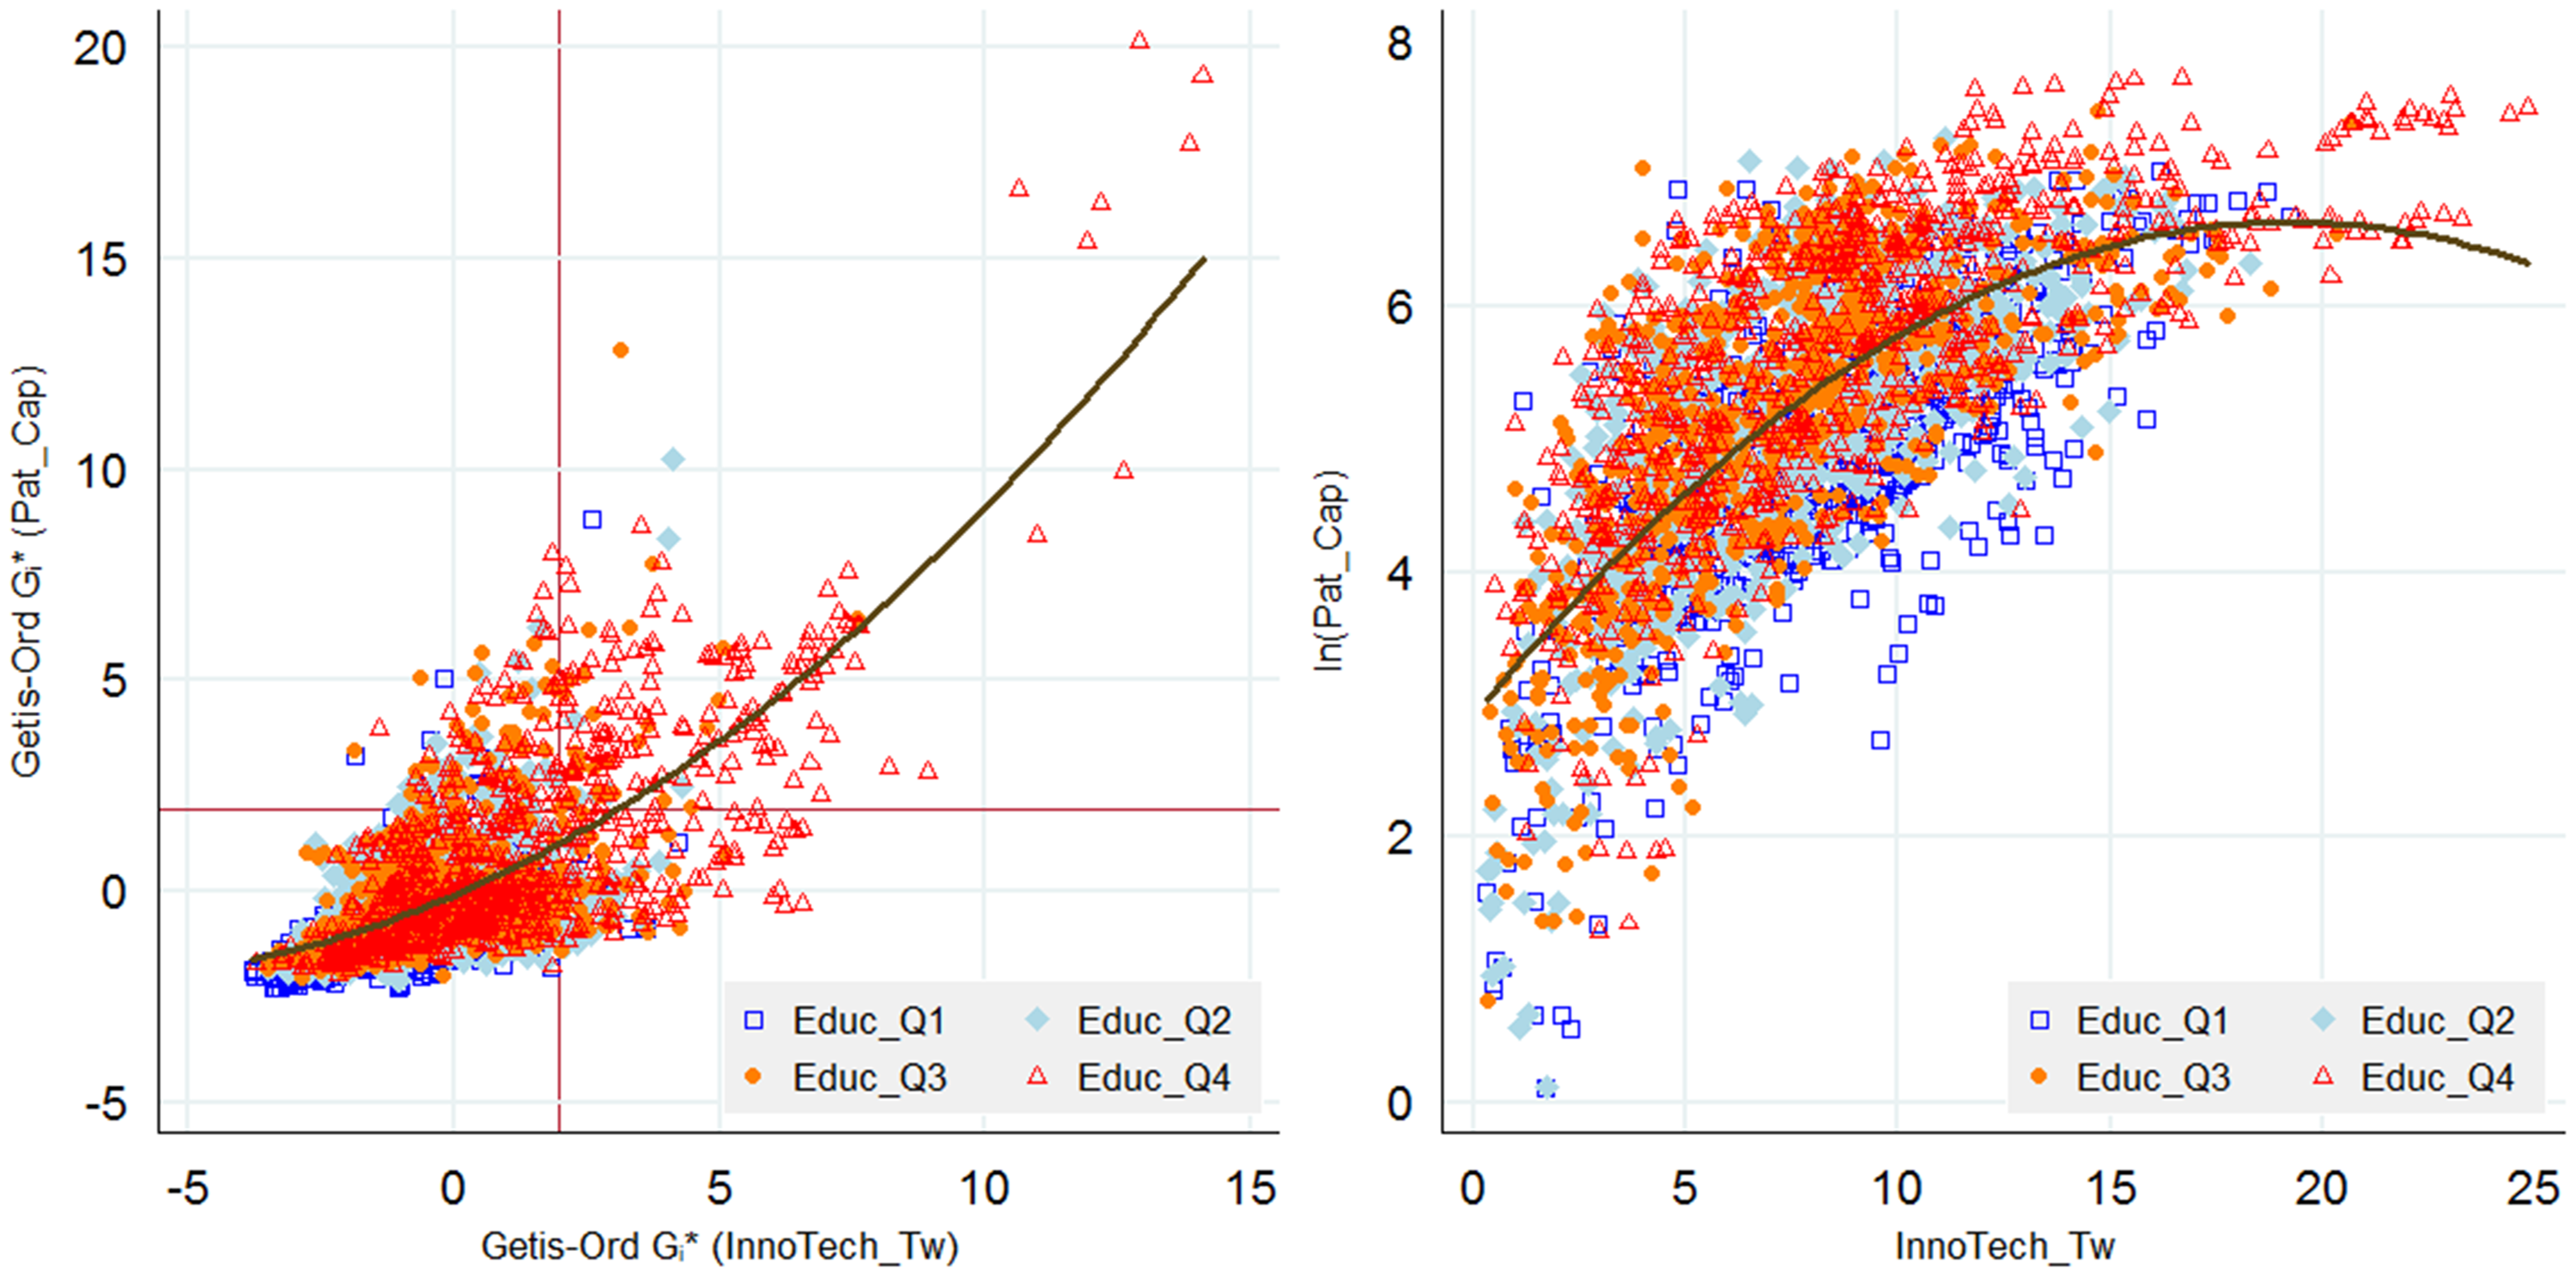
Correlation between Getis-Ord Gi* z-scores for Pat_Cap and InnoTech_Tw (Left panel); correlation between log of Pat_Cap and InnoTech_Tw (Right panel).
These results highlight the significant opportunities available in big data and language analysis from social media for economic geography. We note this may be particularly important in unpacking the intangible dimension of the innovative character of places.
Footnotes
Declaration of conflicting interests
The author(s) declared no potential conflicts of interest with respect to the research, authorship, and/or publication of this article.
Funding
The author(s) disclosed receipt of the following financial support for the research, authorship and/or publication of this article: The research was funded by a Leverhulme Trust research fellowship (Grant Number: RF-2020–505\7).