
Abstract
Emerging research has begun to document the nuanced ways that urban form can influence water quality in urban areas. To facilitate the greater consideration of water quality by planning practitioners, this paper illustrates a two-step method to predict the water quality performance of land use scenarios through the presentation of a case study in the Huron River watershed in Michigan, USA. First, random forest models are used to relate 38 urban form variables to three water quality outcomes within the watershed: total suspended solids (TSS), total phosphorus (TP), and Escherichia coli (E. coli) concentrations. Second, the calibrated random forest models are used to predict the water quality performance for three land use scenarios for a local jurisdiction. The case study illustrates how even scenarios describing additional urbanization can result in predicted improvements to water quality. The methods contribute to the greater consideration of water issues in urban planning practice.
Introduction
There is growing concern about water quality in urban areas. Streams and water bodies receive a range of pollutants from urban runoff and many waterways remain degraded, despite growing implementation of green stormwater infrastructure and other policy measures. A large body of research has documented a negative relationship between the amount of urbanized land in general—or the total amount of impervious surfaces—and water quality outcomes (Brabec et al., 2002; McGrane, 2016). Historically, water quality efforts in urban areas have centered on two areas. One is the adoption of green stormwater infrastructure and other best management practices (BMPs) such as tree planting, detention ponds, rain barrels, bioswales, and rain gardens, which are all intended to slow runoff, encourage infiltration into groundwater, and improve water quality (Artmann et al., 2019, on the use of these terms see Matsler et al. (2021) and Fletcher et al. (2015). The other focus area is to assess how different land uses and development scenarios influence water quality. Process-based hydrological models can dynamically assess pollutants in urban catchments with specific land uses in different weather conditions (Abdul-Aziz and Al-Amin, 2016; Prodanovic et al., 2022). However, intensive flow measurement and continuous water quality samplings are needed for model setup and calibration (Clark et al. 2017). Compared with process-based models, empirical models have more flexible data inputs requirements since they do not require finescale weather and flow data if their goal is to assess the average water quality outcomes for the watershed (Carle et al., 2005; Miranda et al., 2022; Zhou et al., 2021). Moreover, besides the two most common factors, impervious area and land use, empirical models can be used to explore the influence of more nuanced urban form factors on water quality, such as parcel layout, street and building characteristics, and development intensity, which all influence the pollutant generation and transportation processes (Atasoy et al., 2006; Janke et al., 2017).
Machine learning models are increasingly applied to predict water quality because of their ability to identify nonlinear relationships between a large set of spatial variables and water quality (Nearing et al., 2021). Random forest models, in particular, have been applied to predict electrical conductivity (EC), total nitrogen (TN), total phosphorus (TP), total dissolved solids (TDS), Escherichia coli (E. coli), and many pollutant indicators with a diverse set of predictors, including land use and land cover, soil, climate, geology, and socioeconomic variables (Fang et al., 2021; Khan et al., 2022; Virro et al., 2022; Wang et al., 2021a). Among its several advantages, random forest models are favored in water quality studies over other machine learning models because of their higher predictive accuracy and ability to allow for interpretation of individual variables (Tyralis et al., 2019; Wang et al., 2021a). In particular, random forest models have been applied to scenario prediction of water quality and demonstrated that qualities of urban form itself, not only the amount of urbanized land or aggregate imperviousness, can be related to water quality outcomes (Wang et al., 2021b). This creates the potential for tools and methods that consider water quality when land use decisions are being made, as a complement to the existing focus on site-scale BMPs.
Most scenario analysis of water quality relies on hypothetical scenarios, which incorporate assumptions of population growth, house density, land use change and so on (Delpla and Rodriguez, 2014; Sharifi et al., 2017; Wilson et al., 2020). The results of hypothetical scenario analysis are often driven by differing assumptions about urbanization extent or intensity, resulting in unsurprising results. For example, it was found that 30% increase in cropland and 15% increase in urban areas above the historical trend could cause 11.6% increase in turbidity and 15.2% increase in fecal coliform in an urban catchment in Canada (Delpla and Rodriguez, 2014). However, in reality, land use plans are different in many different factors (e.g. the size and shape of lawns and buildings, the connectivity of land over patches, Beck et al., 2016), so modeling approaches are needed that focus on the combined effect of these many different factors instead of aggregate land cover changes.
This article describes how water quality outcomes can be incorporated into land use scenario analysis. This is done through a data-driven method to calibrate models with field sampling data and urban form variables computed from geographic information systems (GIS) data, and then apply the models to estimate the performance of several alternative land use scenarios for a study region. The resulting analysis demonstrates that water quality improvement in urban areas should not be limited to the siting of green stormwater infrastructure facilities, but rather should extend to broader urban design characteristics considered by land use planning. The case study results demonstrate that, given the complex relationships among variables, urbanization can occur without degrading water quality.
Sketch-planning tools for land use scenario performance
Land use planning, or defining the desired form of urban development for a given area, remains ubiquitous in planning practice (Chapin et al., 1995). Despite scholarly interest in alternative approaches to planning for land use, such as strategic spatial planning (e.g. Albrechts, 2004), many national planning systems require local jurisdictions to create land use plans that define a desired future land use pattern. In principle, future land use plans guide various decisions about zoning, subdivision and other land development regulations, and infrastructure development.
Whereas historically creating a land use plan often involved professional intuition and judgment, contemporary planning practice frequently makes use of geographic information systems (GIS) to analyze current conditions and trends and to conduct suitability analysis as part of the land use planning process (Chapin et al., 1995). Furthermore, practitioners are increasingly adopting planning support systems (PSS) such as CommunityViz, Envision Tomorrow, UrbanFootprint, What If?, and others to not only analyze existing data but model indicators describing the impact of future land use scenarios. 1 One important professional advancement has been replacing coarse land use categories used in older plans with place types, which provide more specific, quantitative descriptions of urban form. Using place types, sketch-planning tools like UrbanFootprint and Envision Tomorrow allow professionals to create plans that contain detailed quantitative assumptions about the urban design, site design, and building characteristics for future scenarios. These planning support systems and place types make it possible to construct quantitative indicators describing future land use scenarios, allowing professionals to compare the future population, employment, fiscal impact, travel behavior, and other indicators, often within a scenario planning process (Goodspeed, 2020).
Through the use of one or more scenario modeling tools, state-of-the-art land use planning projects can readily model a suite of indicators that are used to compare and analyze the predicted future performance of alternative scenarios. Although some land use scenario indicators are simply based on input assumptions, such as densities of different land uses, many rely on the body of urban research linking the built environment to various urban outcomes. For example, sketch-planning tools can be used to provide more precise estimates of neighborhood-scale travel behaviors through models that incorporate detailed urban design qualities (Cervero, 2006). Recent efforts have extended these tools to consider topics such as greenhouse gas emissions (Condon et al., 2009) and health outcomes (Schoner et al., 2018).
Despite growing concerns about water quality in many urban areas, this topic has not been included within planning support systems used to model land use scenarios. One reason for this is that most research on the topic lacks the incorporation of detailed urban design variables required to explore differences among land use scenarios, or focuses exclusively on green stormwater infrastructure. An extensive body of literature has documented a negative relationship between the growth of total urbanized land area and measures of stream health and water quality (Brabec et al., 2002). One typical research approach examines the relationship between water quality and various land use categories, often treating urban areas within a single land use category (e.g. Hwang et al., 2016; Tong and Cheng, 2002; Wan et al., 2014). Other studies have examined the relationship between imperviousness and runoff volume and water quality outcomes (Brabec, 2009). Stone and Bullen (2006) presented an unusual example of a more nuanced exploration of imperviousness and urban form through a model-based study that explored associations between runoff amounts and site design characteristics regulated through zoning, such as setbacks and street widths. However, their analysis was conceptually focused on urban design parameters (such as setbacks and road width) related to water quality through imperviousness, not a broader array of variables that might impact water quality such as paving materials.
Urban water quality research
An emerging body of research focused specifically on water quality has demonstrated the potential benefits of green stormwater infrastructure, as well as produced findings suggesting that broader urban design characteristics influence water quality beyond imperviousness. An empirical study comparing a residential community incorporating green stormwater infrastructure and ecological design principles (The Woodlands, Texas) with a comparison community using conventional suburban design concluded that green stormwater infrastructure can mitigate both runoff amounts and water quality (Yang and Li, 2013). Xu et al. (2020) documented the benefits of higher-density residential development, specifically the ways it can minimize loss of natural land uses that are beneficial for water quality. Wang et al. (2021b) examined relationships between urban densities and three pollutants—nitrate (NO3−N), total phosphate (TP), and Escherichia coli (E. coli) and used the resulting statistical model to compare the estimated water quality performance of hypothetical scenarios describing different development density scenarios.
Existing planning support systems used in stormwater management do not allow for the nuanced exploration of urban form factors. For example, the Storm Water Management Model (SWMM) focuses on general land use categories—which can have different buildup and wash-off assumptions for different pollutants. In addition, SWMM has been extended to allow for the testing of several standard forms of urban green stormwater infrastructure (GI), such as rain gardens, swales, rain barrels, and permeable pavement (Baek et al., 2020). The widely used sketch-planning tool UrbanFootprint models water consumption, based on assumptions about domestic use and lawn irrigation, but not water quality. 2 Kuller et al. have explored the need for a PSS for water-sensitive urban design, identifying practitioner’s needs (Kuller et al., 2017), exploring practitioner views (Kuller et al., 2018), and proposing a suitability model for placing GI (Kuller et al., 2019) in this domain.
The present paper demonstrates a methodology that uses emerging research exploring nuanced relationships between urban form and water quality to facilitate the comparison of predicted water quality performance of alternative land use scenarios. We compared the performance of a land use plan recently adopted by the community with a previous county-wide land use plan. The aim of the study was to demonstrate how water quality can be incorporated as a performance measure within projects modeling future land uses with planning support systems, thereby adding water quality to the suite of sustainability outcomes to be considered when communities evaluate alternative future land use scenarios.
Methodology
This section introduces the case study context and then describes the two-step methodology we used to estimate the water quality of three land use scenarios.
Case study context
The method was developed through a case study of Scio Township, Michigan. Located in Washtenaw County outside of Ann Arbor, Scio Township has experienced urban growth in recent years. It is in the Huron River watershed (Figure 1), which spans 908 square miles and drains portions of Oakland, Livingston, Washtenaw, and Wayne counties in Southeast Michigan. The watershed contains a wide range of land uses, including rural, suburban, and urban areas in and around the cities of Ann Arbor and Ypsilanti, and also extending to some residential suburbs of Detroit in Oakland and Wayne counties. The western portion of the watershed contains significant lands dedicated to agriculture, conservation, and recreation. The Huron River Watershed and direct drainages to the Detroit River and Scio Township, Southeast Michigan.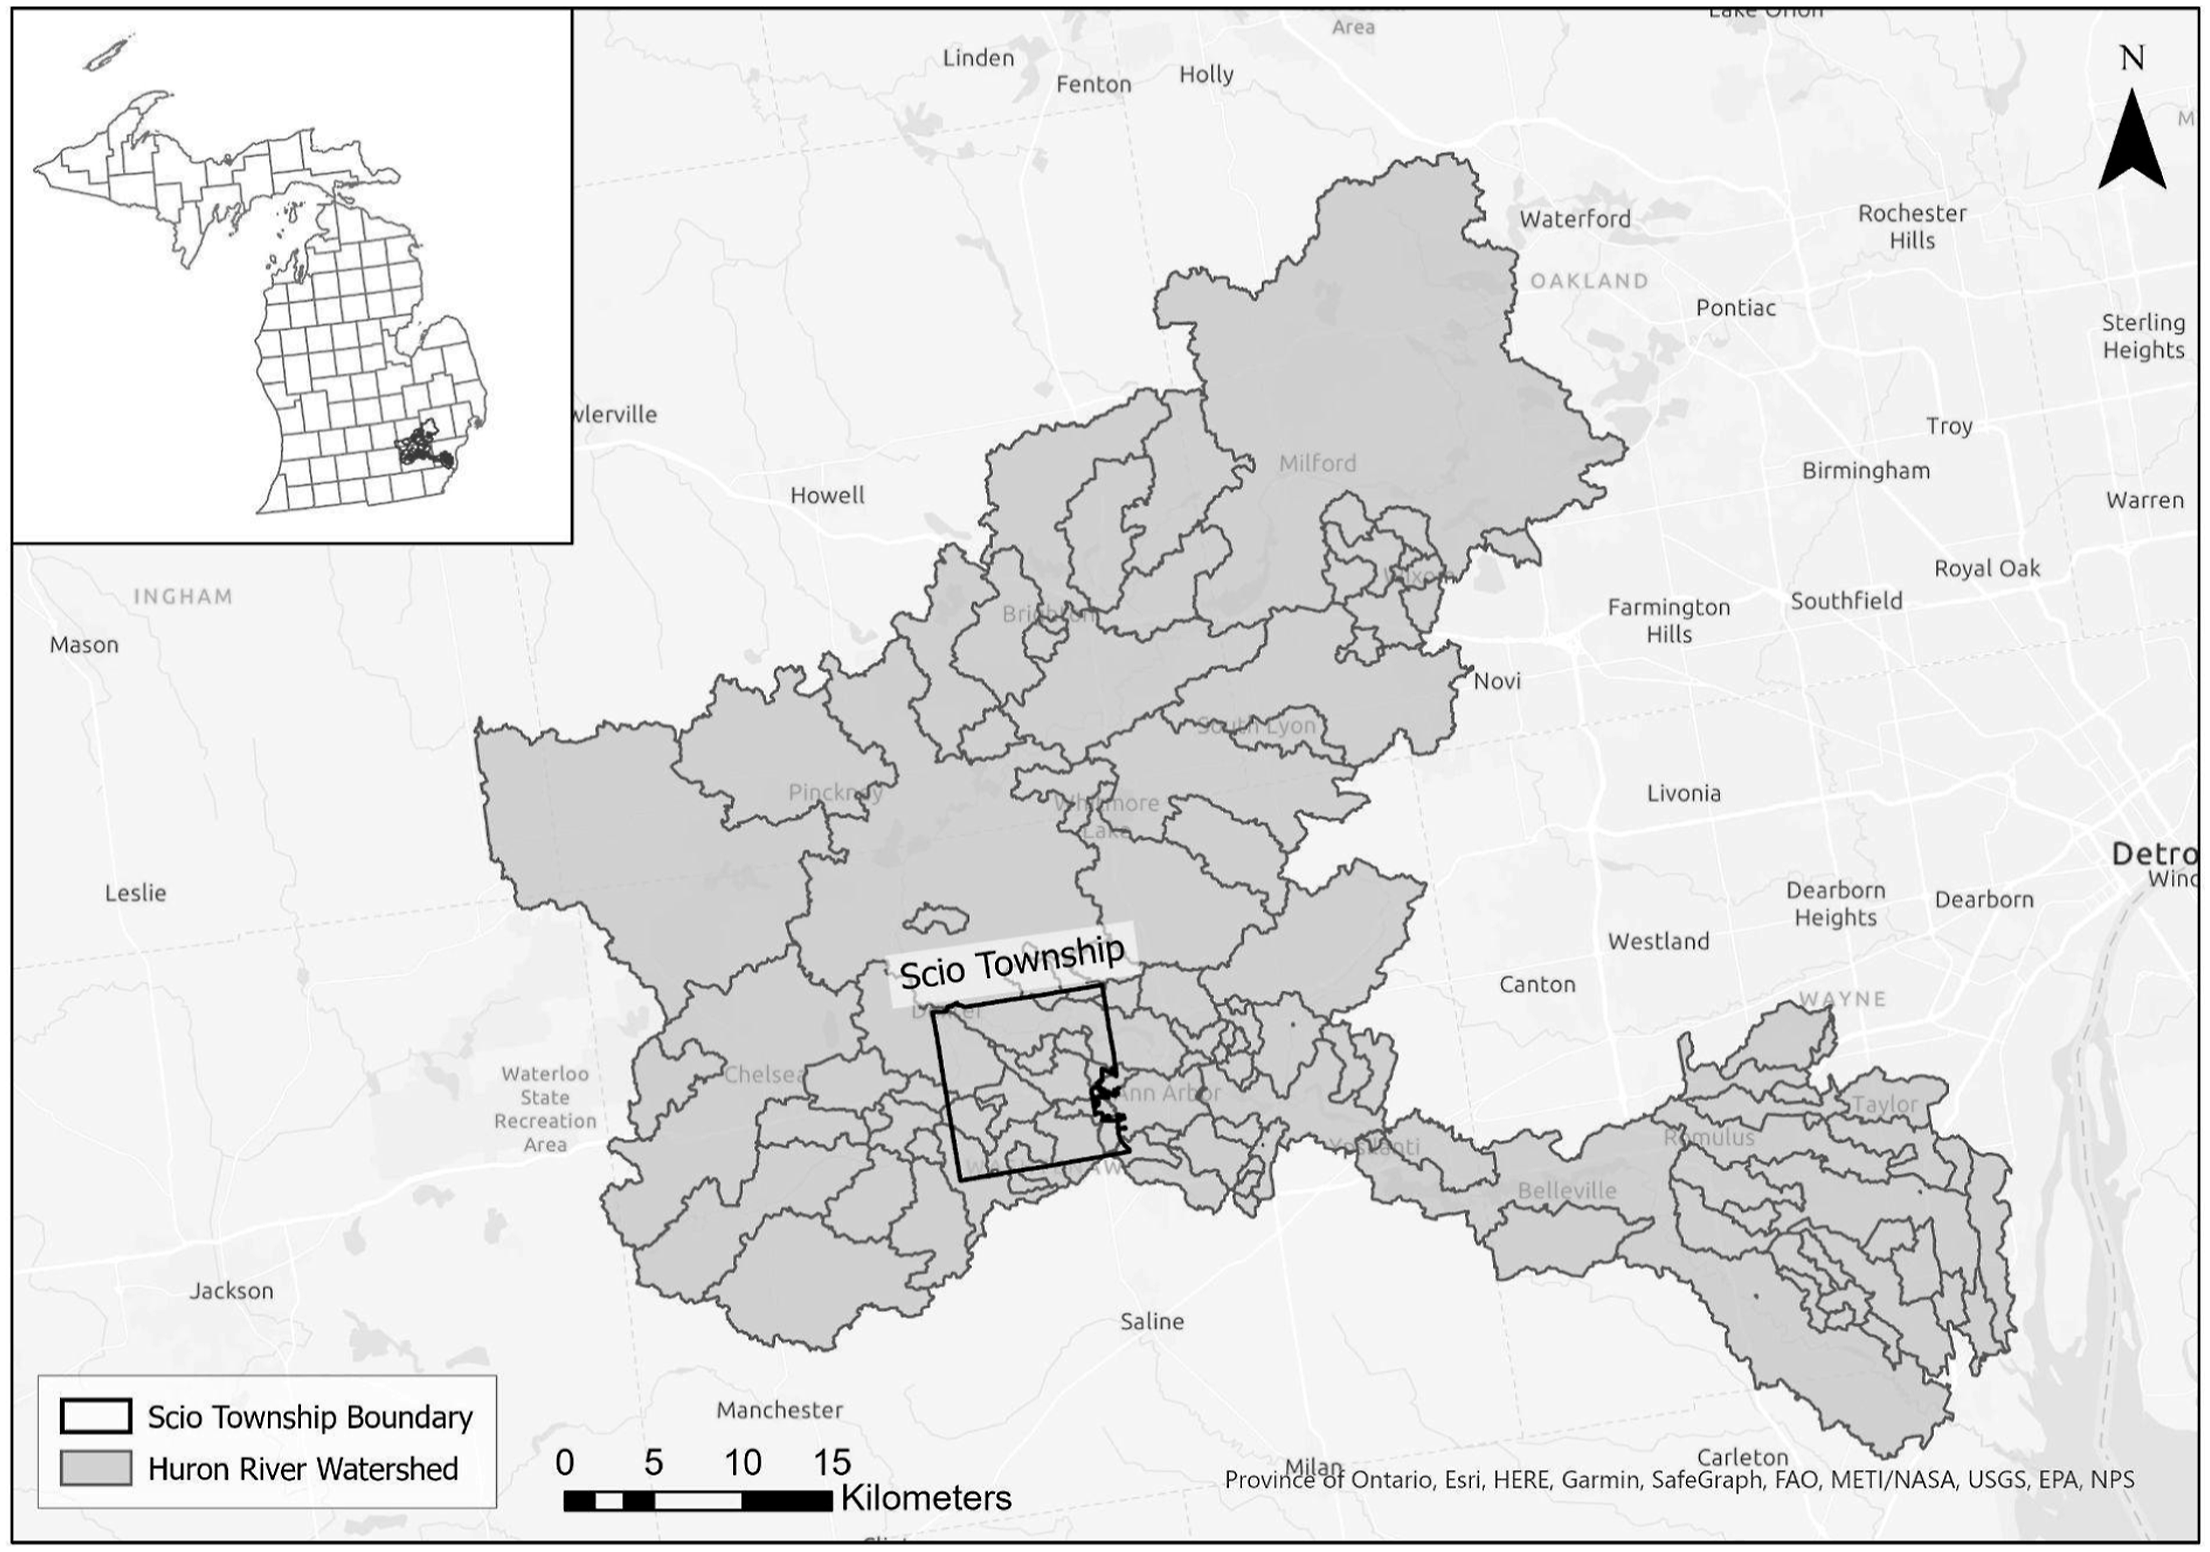
Although the random forest (RF) models were calibrated from sampling data collected from throughout the watershed, we sought a specific jurisdiction to serve as a case study for the scenario predictions. In consultation with the Huron River Watershed Council (HRWC), we identified Scio Township for the case study. Located immediately west of the growing city of Ann Arbor (home to the University of Michigan and a dynamic cluster of technology and automotive firms), Scio Township contains some more intensely developed areas, along with significant agricultural and conservation lands. The jurisdiction had not conducted a scenario-based land use plan, so for our analysis scenarios we used three sources (Figure S1): Current Land Use, derived from a 2020 regional land use layer created by the Southeast Michigan Council of Governments; a Township Master Plan approved in 2021 to satisfy the state requirement for the creation of a local master plan; and a Washtenaw County Plan drawn from the local portion of a county-wide land use plan created in 2004.
Modeling the relationship between urban form and water quality
Our modeling approach involved two related steps (Figure 2). First, we modeled the quantitative relationship between urban form and three water quality variables using subwatersheds as the unit of analysis: total suspended solids (TSS), total phosphorus (TP), and E. coli. The variables were constructed from sampling data collected by HRWC’s Chemistry and Flow Monitoring Program, with TSS and TP collected from May 2003 to September 2020, and E. coli from July 2007 to September 2020. Originally, we delineated the Huron River watershed to 154 subwatersheds according to the location of water quality monitoring stations and topography. For each station, we aggregated the pollutant concentration data by taking the mean as the predicted outcomes, given the goal of the project to understand long-term relationships. However, we acknowledge that seasonal effects, special events, or episodic industrial discharges can play a critical role in determining water quality. After we dropped subwatersheds with missing water quality values or outliers, the sample size was 91 for TSS and TP, and 83 for E. coli. Analysis method overview.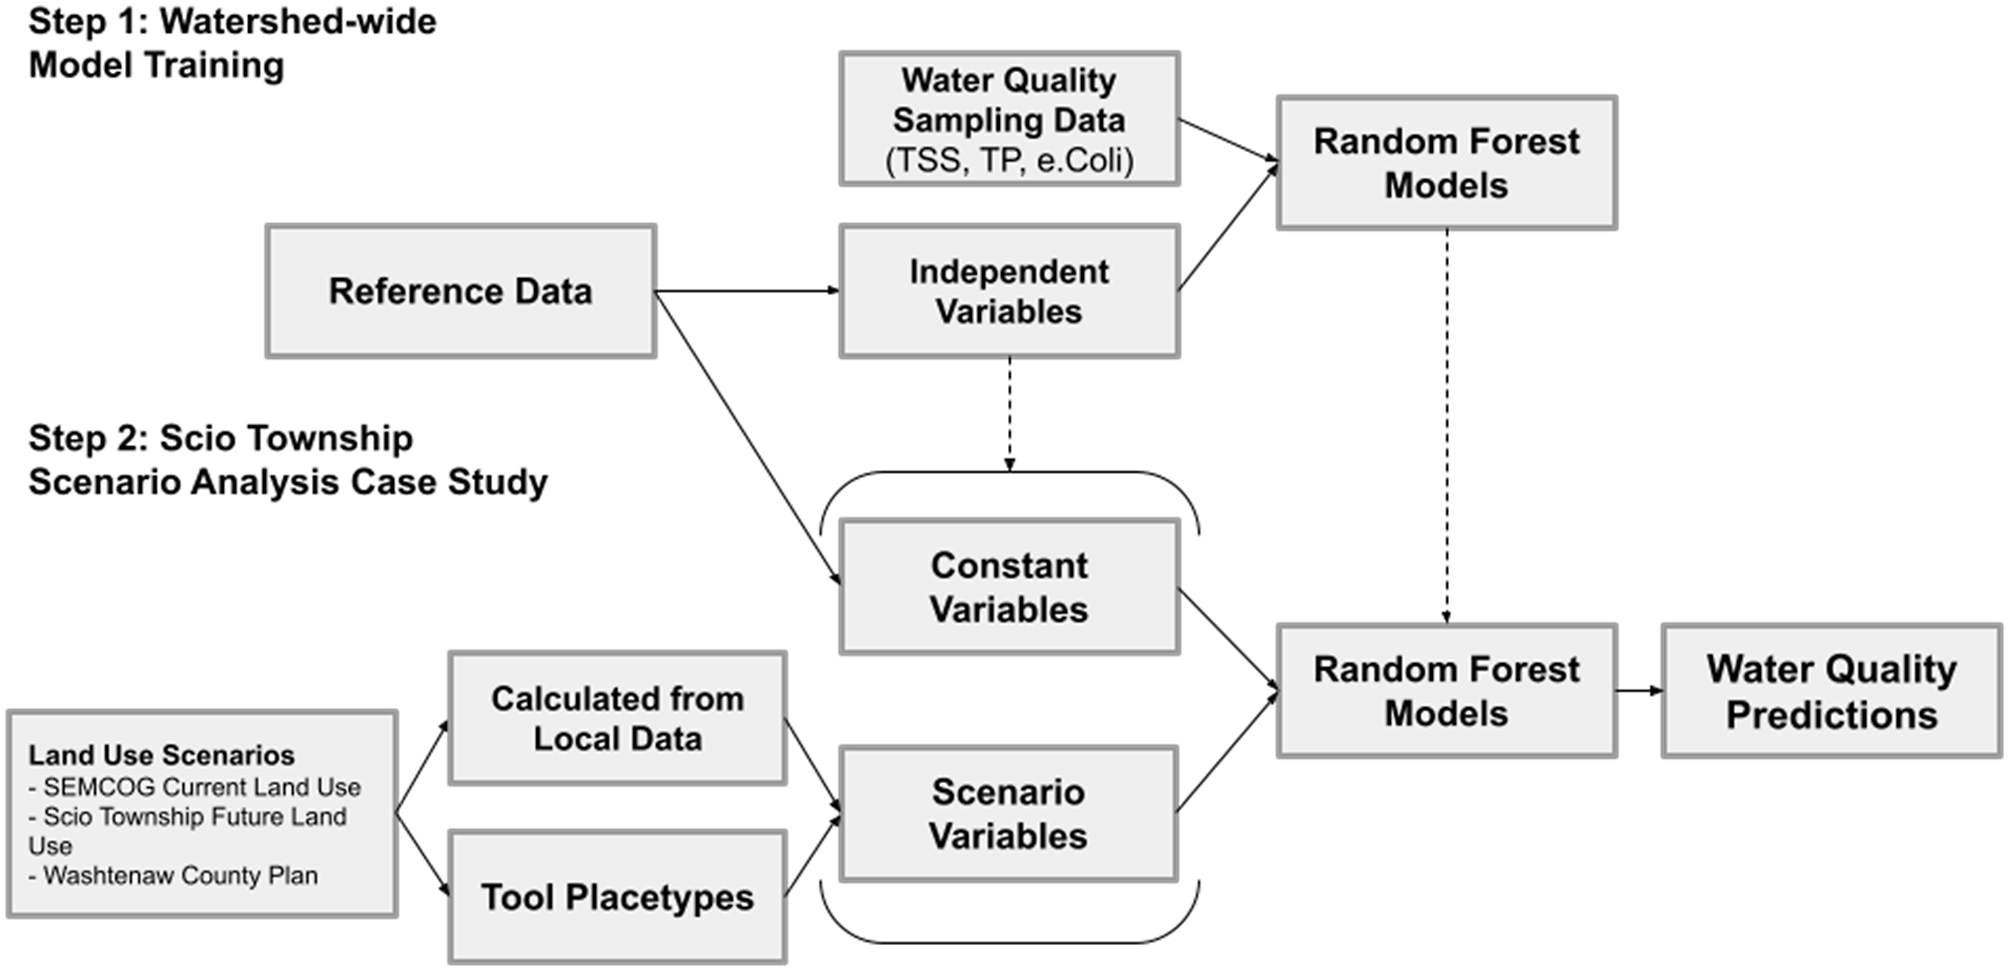
We then developed three RF models to build the relationships between 38 urban form or environmental variables and pollutant concentrations for TSS, TP, and E. coli. RF models are a widely used machine learning algorithm that relies on a large number of decision trees to obtain their prediction results. Each independent decision tree is constructed by using a unique bootstrap sample of the training dataset and a random subsets of features. After an ensemble of decision trees are generated, random forest regression takes the mean of all the decision trees to product final prediction results (Breiman, 2001). A RF model was selected, due to the high predictive accuracy and strength of the model to handle nonlinearity and high dimensionality as compared with standard statistical techniques (Tyralis et al., 2019). The method is also generally recognized for its ability to deal with small sample size (Biau and Scornet, 2016).
We split the samples into train and test sets to demonstrate the validation of the RF models. See the Supplementary Material for details about our model training and validation approach.
Development of predictive scenario model
Second, we applied this calibrated model to predict the water quality performance for three land use scenarios that had been developed by professional urban planners for a case study community located within the Huron River watershed. To calculate a prediction, the model requires a quantitative value for all 38 variables used in the empirical training. To calculate these, we followed the method shown in Figure 2. First, we separated the variables into constants, which do not change among the scenarios, and scenario variables, which do. The scenario variables fell into four categories: traffic and road characteristics, parcels, land use, and land cover (Table S1). The constant variables fell into three categories: the prevalence of different soils, climate assumptions, and building characteristics (see Supplementary Material for definitions and methods for all variables). We treated the building age variables as constants since they depend on real estate markets and not land use plans. Other building variables, such as median height or median year built, could be included as scenario variables for future projects where they are specifically modeled through placetypes or real estate models. These were calculated for the case study community from GIS data using the same method as they were computed for the stage 1 analysis. The implementation of any scenario would not affect climate and soil composition, and the building variables (such as year built) were held constant because they would depend on factors separate from the scenarios such as economic cycles.
To predict scenario water quality, we estimated values for each scenario variable for each land use category used within the scenarios. Since we were applying RF models that described the aggregate relationship between urban form variables and water quality for the entire community, we calculated our predictions for the jurisdiction as a whole. As a result, our analysis does not take into account the potential water quality benefits of the internal design of each scenario; for example, scenarios that contain forests downstream from more polluting land uses might perform better than scenarios with the same land uses configured differently across the landscape. Therefore, to create our predictions we first calculated the percentage of land area within each category for each scenario.
Future land use scenarios use various classification systems of land use, and in our case the current and future land use are defined using somewhat different taxonomies. To construct a scenario-wide value for each variable, we defined a variable value for each land use category by either calculating it from local data or assigning it a value from a representative place type used by the PSS UrbanFootprint (see Supplementary Material for a full methodology described for each variable). We then computed a single value for each scenario variable for each land use scenario. For most variables, we did this by calculating an area-weighted average across all of the land use types contained within the scenario. The resulting values were provided to the random forest model to generate predictions for the three water quality outcome variables for each scenario.
Results
This section presents the calibration and validation of the random forest model at the watershed level, the calculation of scenario variables for the land use scenarios, and the application of the model to predict water quality performance.
Urban form and water quality analysis
We fit three models among our set of 38 variables and the three water quality outcomes. The RF models produced satisfactory performance in predicting TP and TSS with urban form and environmental factors. Test set R2 values were 0.71 and 0.73 for TP and TSS, respectively. The predicting accuracy (test set R2 = 0.36) was relatively lower for E. coli. With log value of pollutant concentration as the predicting outcome, we also calculated the exponential value of percentage bias to indicate how much the predicted water quality deviated from the measured water quality. The exponential values for percentages bias of TP, TSS, and E. coli were 1.22, 1.49, and 1.74, respectively. The bias was smaller than 2, indicating that the predicted concentration was between half and two times the measured concentration.
An analysis of the Shapley values (SHAP) revealed that a relatively small number of variables had a strong relationship with the three outcomes. Examining the model for TSS concentrations, we found that soil characteristics (hydrologic soil groups and average storage depth) were the most critical factors affecting TSS concentration, while some urban form variables were also important. We present the 15 most important variables in Figure S3. The percentage of roadway was the most important urban form variable, possibly because street traffic generates pollutants and streets often directly drain into stormwater systems. Building characteristics were more influential than land use with regard to TSS concentration. When the median year built was older, TSS concentration in that subwatershed became higher. Also, TSS concentration was positively associated with the median number of stories of buildings. The percentages of open (land cover) and green (land use) both had a negative relationship with TSS concentration, while high percentages of high development, vacant land, commercial land use, and service land use all had positive relationship with TSS concentration. Hydrologic group B was the most important soil type affecting TSS concentration, where high area percentage of soil group B was associated with low TSS concentration. Monthly precipitation depth was positively associated with TSS concentration.
Many similar variables appeared in the model predicting TP concentration, but there were important differences (Figure 4). Urban form variables buildings, roads, and land use were all important factors affecting TP concentration. The older the median year built, the higher the TP concentration of the subwatershed. The more building ages varied in the subwatershed, the lower the TP concentration was. Different types of street seemed to have varying influence on TP concentration; for example, while the length density of city-level roads was positively associated with TP concentration, the effect of county-level road length on TP was negative. Among land use categories, percentages of vacant, high development, and open areas were most influential to TP concentration. More vacant land, more high-intensity development, and less developed open space contributed to higher TP. Commercial land use exerted a positive impact on TP concentration, while the effect of service land use was ambiguous. Higher service area percentage generally led to lower TP concentration, while some subwatersheds with large service areas also had very high TP concentration (see Supplementary Material). Regarding soil type, the most influential one was hydrologic soil type D, indicating less infiltrated soil, that was associated with high TP concentration.
The model for E. coli emphasized different variables, reflecting the distinctive nature of this contaminant. The most important factors in affecting E. coli concentration were monthly precipitation and soil type, followed by the percentage of green space and median year built. We discovered that lower percentages of green space and developed open space, and higher percentages of industrial area, residential area, and vacant land contributed to higher E. coli concentration. Similar to the TP results, the older the building age and the smaller building ages varied, the higher the E. coli concentration was in the subwatershed. New developed areas seemed to have better water quality in general, with lower TSS, TP, and E. coli concentrations. The road density was also positively associated with E. coli concentration, with the positive relationship with state road length being particularly important. Regarding natural factors, E. coli concentration was higher in summer months with more rainfall events. Hydrologic soil group A, with the highest infiltration capacity, was associated with lower E. coli concentration.
Scenario variables
Next, to apply the RF models to create scenario predictions, the percentage of land area allocated to each land use category was calculated with GIS (Table S1). We calculated values for all 28 scenario variables by assigning each land use category to place types, or in some cases by using calculations from existing data. All intermediate values are reported in the Supplementary Material. In general, both the Township Master Plan and Washtenaw County Plan described growth scenarios, with increases in the number of roads and parcels. We estimated the length of roads would increase by 25% for the Township Master Plan, and 213% for the Washtenaw County Plan. The estimated average parcel area for the Washtenaw County Plan was somewhat larger than was estimated for the Existing Land Use scenario, but smaller than in the Township Master Plan. 3 In other regards, the three scenarios resulted in similar scenario variables. For example, each plan retained similar proportions of the land use variables “percentage agriculture” and “rural” (between 26% and 31%), percentage green space (28% and 34%), and percentage residential (19% and 26%).
Predicting scenario performance
Next, we used the calibrated RF model to predict the water quality performance of the three scenarios (Figure 3). The predicted TP and TSS concentration in all the scenarios did not exceed defined aquatic toxic thresholds. TP predicting value for the Current Land Use, Township Master Plan, and Washtenaw County Plan scenarios were 0.069 mg/L, 0.063 mg/L, and 0.058 mg/L, respectively, which all fell between rivers and streams thresholds from the Ecoregional Nutrient Criteria for TP (0.01–0.08 mg/L) (EPA, 2021). The differences in TP concentrations among the three scenarios were subtle because of the tradeoff effects in different urban form variables. Compared with the Current Land Use scenario, although the Township Master Plan and Washtenaw County Plan had higher road density, these plans were associated with smaller vacant land and larger developed open areas. The negative effect of vacant land reduction and open area expansion on TP concentration offset the positive effect of increases in the road density. TSS concentrations in all the scenarios were below 10 mg/L, levels that do not affect macroinvertebrates in the stream (Gammon, 1970). The reasons for similar TSS concentrations for the three scenarios were also the tradeoff effects among independent variables. Comparison of the predicted total phosphate (TP), total suspended solids (TSS), and Escherichia coli (E. coli) for the analysis scenarios.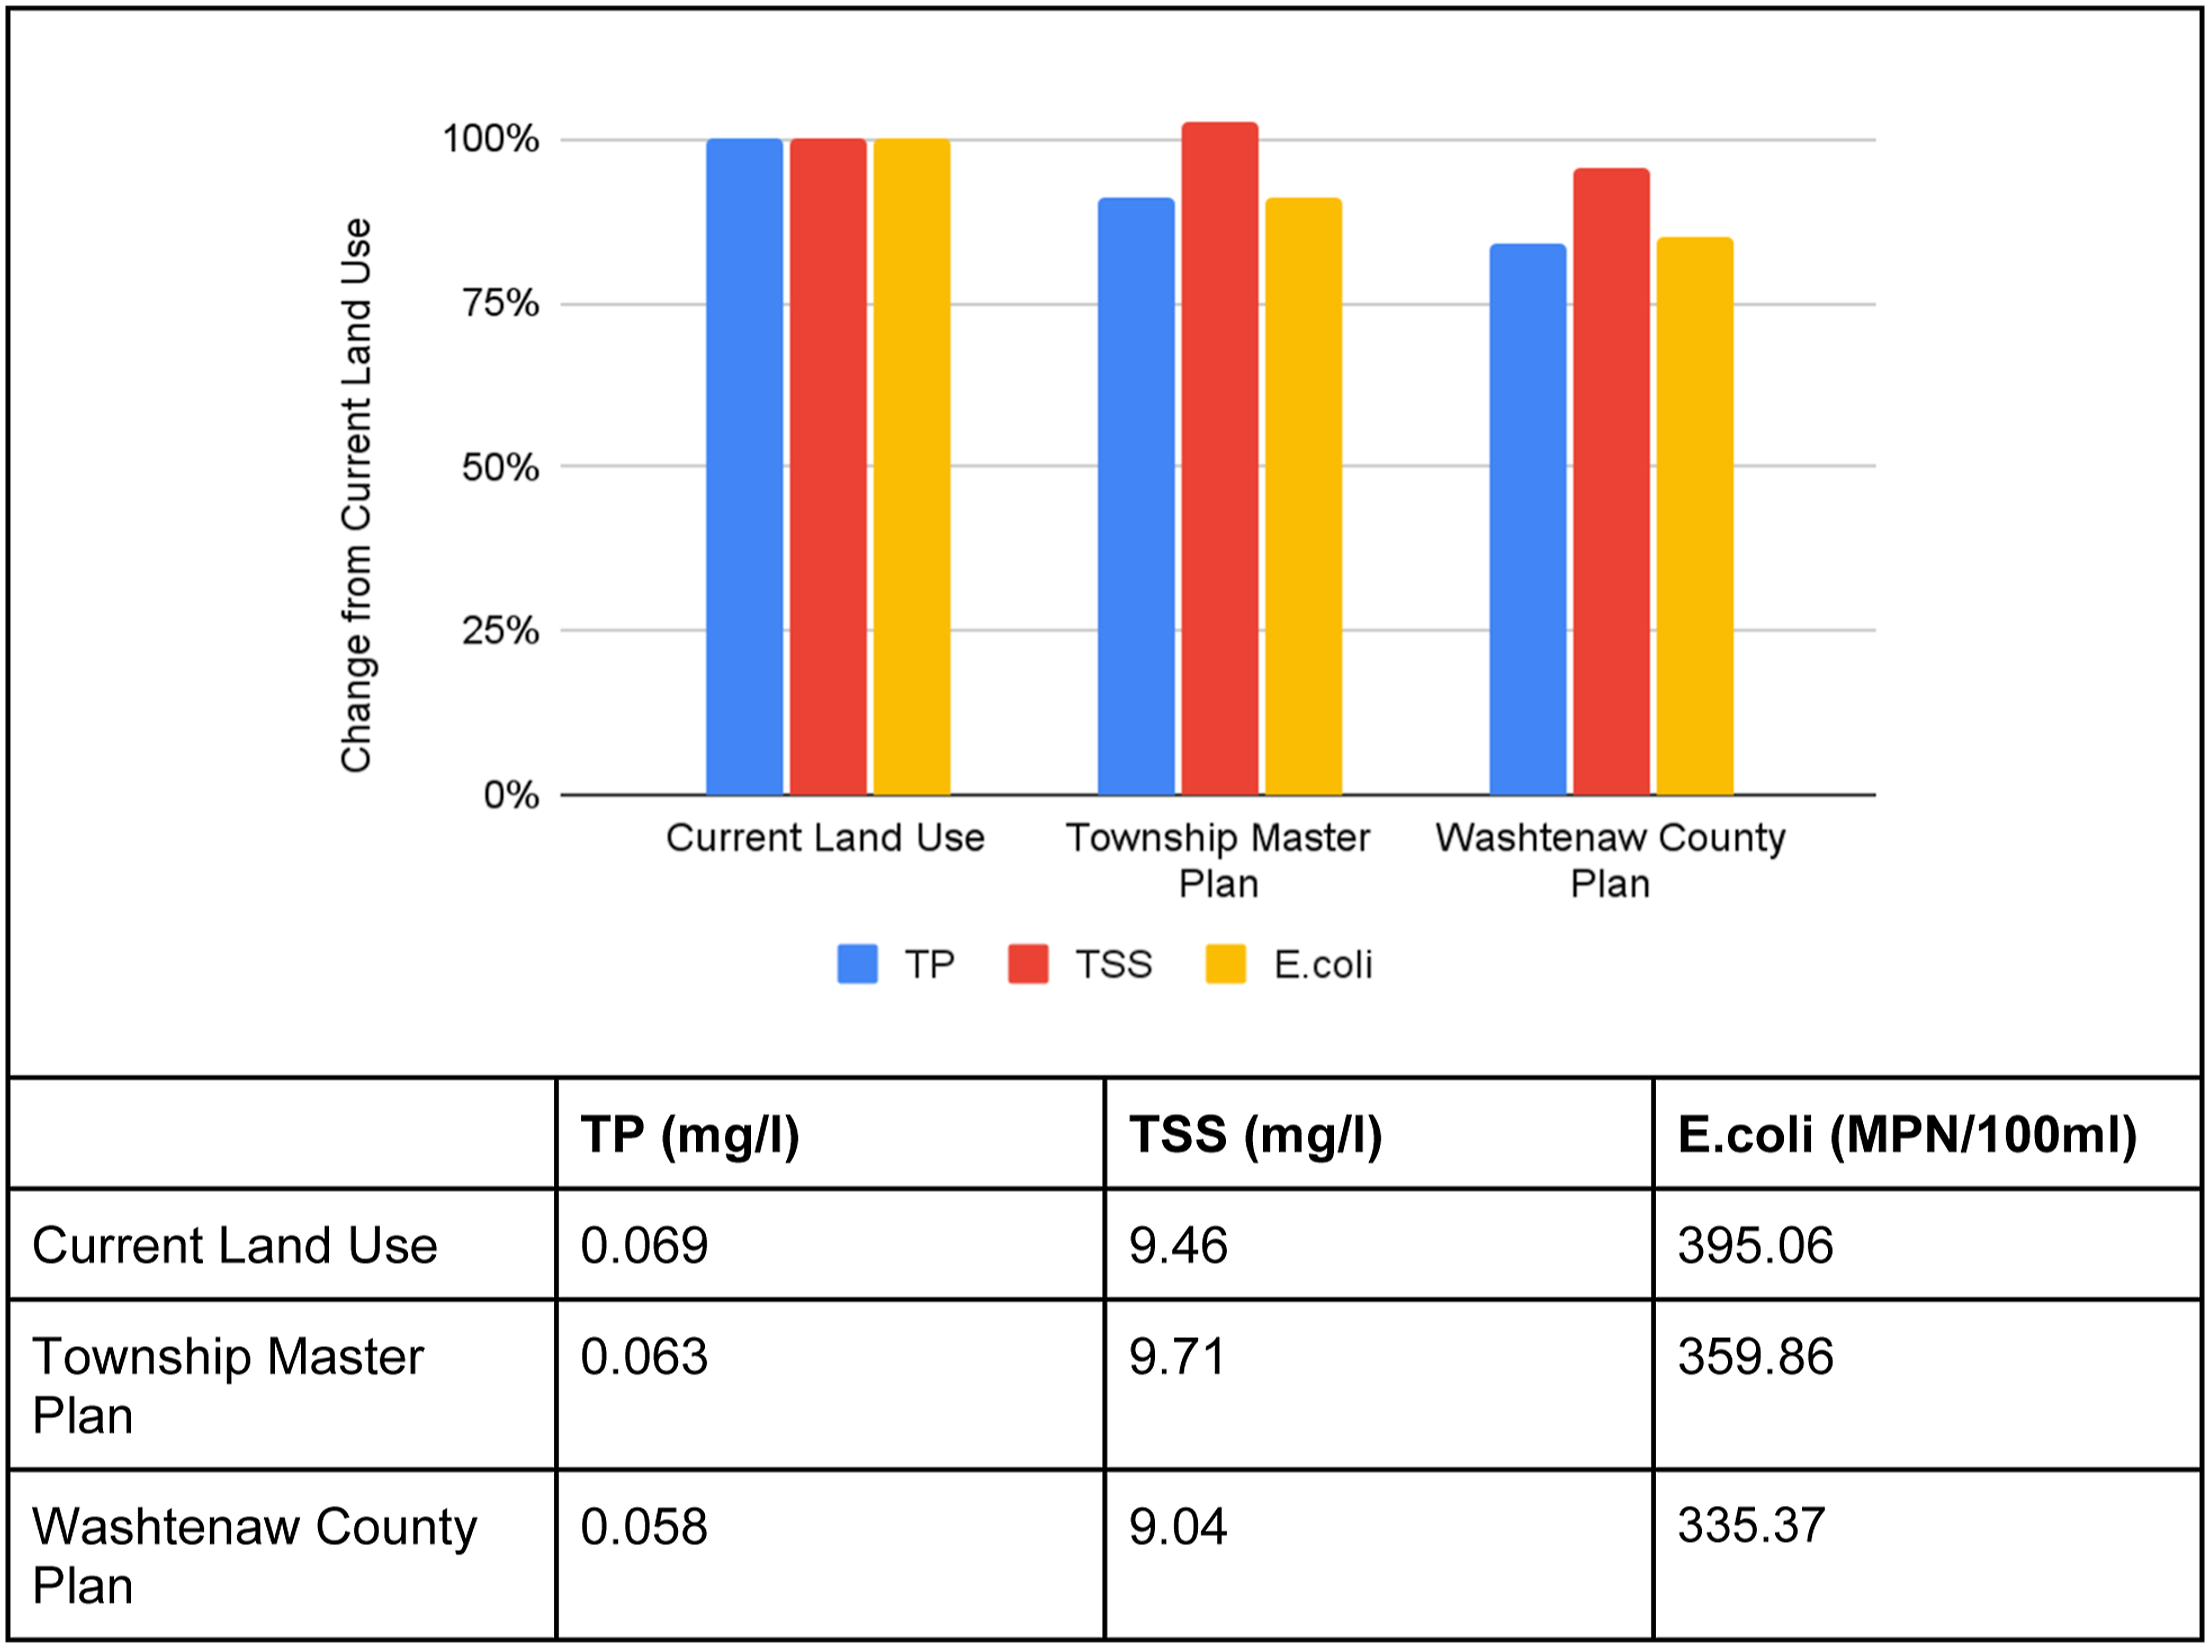
E. coli concentration in the three scenario only satisfied the criteria threshold defined for “lightly used full body contact” (406 mpn/100 mg/L) but exceeded the criteria of freshwater bathing (126 mpn/100 mg/L) and beach area recreation (235 mpn/100 mg/L) (EPA, 1986). 4 E. coli concentrations in the Township Master Plan and Washtenaw County Plan were lower than that of the Current Land Use.
Discussion
The methodology reported in this paper reflects the meeting of trends in two fields. Research on urban ecology has increasingly adopted research designs that account for the heterogeneous nature of vegetation, built structures, and surface materials in urban environments (Cadenasso et al., 2007). As a result, traditional ecological research approaches—which characterize land into coarse categories or only focus on imperviousness—are being superseded by studies that increasingly quantify multiple dimensions independently. The result allows opening the “closed box” of urban environmental processes, highlighting a finer-scale understanding that can inform policy and planning decisions. In a parallel development, there has been a movement in urban land use planning away from the use of coarse categories that combine descriptions of land use and land cover, and toward the use of place types (e.g. Fregonese and Gabbe, 2009). Place types provide greater specificity, and importantly are accompanied by a wide range of quantitative assumptions that can be used to calculate a range of descriptive and predictive indicators.
Our method, which links these two worlds, demonstrates both the potential and challenge of work that translates fine-grain urban ecological research on water quality—and potentially other outcomes—to the scenario modeling tools in current use by professional urban planners. In this discussion, we reflect on the methods and comment on future research needs for each of the two stages of our method, before ending with some general remarks.
Using random forest models to analyze urban ecological relationships
With a novel set of predictive variables including road, building, parcel characteristics and land uses, our RF model explores more nuanced relationships between urban form and water quality than prior research. The relationships between percent of urban development, climate, soil and water quality are similar compared with prior studies with similar methodologies. Specifically, higher percentage of urban areas, higher percentage of hydrological soil group D, and wet climate all resulted in higher TP concentration (Virro et al., 2022; Wang et al., 2021b). However, previous studies highlighted forest land proportion as a strong predictor of TP concentration (Mainali and Chang, 2018; Wang et al., 2021a), which we did not find here. The reason might be the purification effect of forest in our watershed is small due to the generally small area percentage (13% on average). An important new result from this study is that the RF model selected many important urban form variables, such as road density, percent of vacant land, and median year built, that were not typically considered in previous water quality prediction studies. This could imply the existence of important, yet neglected, urban hydrology mechanisms. For example, roads are an indicator of surface hydrological connectivity because they provide flowpaths on the surface (Baruch et al., 2018). Urban vacant land adds a significant amount of additional disconnected impervious surfaces, thus has potential to be redeveloped to green space to provide hydrological benefits (Kelleher et al., 2020). To overcome limited sample size, there is possible modeling bias produced by averaging the predicted values from models fit from 500 train and test splits (see Supplementary Material).
Due to the costs of monitoring, most water quality data may be even more sparse than in this watershed, and achieving even more robust models would require significant data collection efforts or broadening the spatial and temporal scales of analysis. A major limitation of this prediction framework is the aggregated water quality outcomes (average values during the sampling period) that cannot reflect the dynamic weather-water quality relationship, where antecedent dry period and rainfall intensity could play important roles (Guzman et al., 2022). For example, previous work has shown the effects of road on total runoff volume is larger after dry periods (Chow et al., 2013; Woldie et al., 2009). Future studies would benefit from investigating water quality as a function of rainfall, soil permeability, and land uses if measured weather data is available (Roodsari and Chandler, 2017).
The broad spatial scale required to achieve robust quantitative results for an outcome of interest is often accompanied by challenges in obtaining sufficient data to also describe the independent variables in the study for all the jurisdictions within the study area. For example, green and gray stormwater infrastructure data were only available in Ann Arbor but did not cover the whole study area; thus features such as pipe density and the number of and type of BMPs were not included in the RF models. Future studies are needed to more fully account for detailed stormwater infrastructure and BMPs in influencing water quality.
From a technical perspective, a major benefit of using RF models was their utility for creating models with satisfactory predictive performance (R2 = 0.71 and 0.73 for TP and TSS, respectively) from a dataset with limited observations and high dimensionality. This accuracy is comparable to the state-of-the-art hydrological model (Noori et al., 2020). We speculate that this high-accuracy advantage is due to the nonlinear assumption between urban form and stream water quality in the RF model, which is closer to the nature of the urban form–water quality relationship than that assumed by linear regression models (Virro et al., 2022). Another possible reason is that RF models can make use of the cross effects among variables, such as the cross effect between soil and urban form (for example, in low-infiltrated areas, impervious characteristics could have a larger impact on stream water quality).
A general challenge of RF models is that they are less easily interpretable than other types of models. Possible strategies to address this include interpretable regression methods, such as interactive random forest (Basu et al., 2018) and models which combine process-based and machine learning approaches (Burns et al., 2015; Guan et al., 2015).
Predicting land use scenario water quality performance
The modeling result provided the potentially counterintuitive result that both future land use plans, which describe greater development, resulted in improved TSS and E. coli water quality measurements. This was probably because both alternative scenarios were planned with smaller high-intensity development and vacant land. Particularly, the Washtenaw County Plan had the lowest percentage of high-intensity development and commercial land use among the three scenarios. It is worth noting that the Washtenaw County Plan had the highest residential land use and road density. This suggests that although some urban form factors are more important than others in affecting water quality, no single factor is decisive. With smart planning approaches such as reducing vacant land and increasing open space, water quality can be improved even with increasing residential development and road construction.
Concerning the methods we used, another set of challenges and insights arose from our efforts to apply the RF models to predict water quality performance of the land use scenarios. First, because the water quality research proceeded first, the dimensions of land use that we considered were limited to those that could be included in the watershed-wide analysis. There might be quantitative assumptions associated with place types in scenario planning tools that could be used to better predict water quality other than the assumptions included here. Second, we discovered that some of the variables found to predict water quality were not modeled in existing scenario planning tools, requiring us to assign values by referring to local data about existing patterns or professional standards.
Ideally, the model would be applied to a set of scenarios that had already been created through the use of a scenario planning tool with quantitative place types. The use of scenarios with consistent population assumptions would clarify the influence of the built environment. In our case, our desire to analyze real-world plans resulted in the need to translate quite coarse land use categories into specific place types. This was especially challenging for categories that are somewhat internally diverse. In particular, the Washtenaw County Plan’s use of only four categories made our analysis sensitive to our decisions about exactly which place type to use to represent each. Therefore, adopting the scenario planning paradigm in place of the older comprehensive planning tradition would allow for the greater use of methods like ours.
Even when the land use scenario is directly composed from a palette of place types with all the relevant quantitative assumptions, model accuracy can be a concern. Beyond limited sample sizes, predictive accuracy is impacted by other biases, such as differences between the times and places where empirical research is conducted, and the time and place of the scenarios. If scenario planning tools increasingly incorporate water quality tools, they need to account for regional differences in ecology, urban infrastructure design and maintenance, and even culture.
Toward next-generation tools for water-sensitive planning
This research contributes to the growing focus on urban water through exploring how water quality outcomes can be incorporated into scenario modeling tools. Achieving this goal requires not only alignment between the variables used for scenario modeling and water quality research to enable predictions using the method demonstrated here, but also the use of new and different tools. Future tools could account for spatial relationships across the landscape, such as interactions between development and GI location and soil types. Other tools could quantify the benefits of green stormwater infrastructure and foster consideration of multiple benefits in siting decisions (e.g. Goodspeed et al., 2021; Kuller et al., 2019).
Conclusion
Given the growing concern about water quality in many places, we urge a greater focus on the relationship between urban form and water quality outcomes to complement existing efforts that focus only on imperviousness or installing BMPs. Building off an exciting area of emerging research documenting that how we build cities matters for water quality, we present a prototype of a tool that can quantify the water quality performance of alternative land use plans. Although limited by the use of general land use categories, the tool nonetheless documents important differences between two proposed land use plans for a specific jurisdiction.
The adoption of scenario planning methods has introduced a new era of planning that fuses the visionary potential of planning with rigorous analysis that relies on quantitative assumptions. Our paper advances the development of scenario planning analytical methods through two primary contributions. First, we demonstrate the usefulness of random forest models to scenario planning, showing how they can be useful in situations where the number of empirical observations required for calibration is limited and relationships between variables are difficult to model with conventional multivariate regression models. Second, we demonstrate the use of random forest models to predict water quality, in particular, which had not been incorporated into scenario modeling tools.
It is often said that “not everything that counts can be counted, and not everything that can be counted counts.” 5 As a result, although planning decisions can and do often incorporate non-quantifiable considerations, practitioners have pursued creating quantitative indicators to broaden the issues that are considered and foster more nuanced, rigorous comparisons that are not possible with purely qualitative comparisons. Of course, the intelligence or usefulness of these predictions depends on the rigor and quality of the analysis.
In an age of rapid change, it will be necessary for decision-makers to make bold decisions in the absence of detailed quantitative analysis, to protect ecosystems and the health of our planet. However, on longer timescales, planners continue to prepare long-range plans that shape myriad public and private decisions that in turn shape urban form. Exciting advances in scenario planning modeling tools means that all of these projects can and should take advantage of the benefits of adopting scenario methods. Among the library of indicators it unlocks for practitioners, adopting scenario modeling tools allows for communities to understand how land use choices are central to achieving a large range of sustainability goals, including, one can hope, the water quality of their future city.
Supplemental Material
Supplemental Material - Incorporating water quality into land use scenario analysis with random forest models
Supplemental Material for Incorporating water quality into land use scenario analysis with random forest models by Robert Goodspeed, Runzi Wang, Camilla Lizundia, Lingxiao Du and Srishti Jaipuria in Environment and Planning B: Urban Analytics and City Science
Footnotes
Acknowledgments
The authors would like to thank the Huron River Watershed Council (HWRC) for providing the data, and HRWC staff Ric Lawson and Andrea Paine for providing valuable input on the analysis, and Leah Maurer for copy editing. The project received support from a Catalyst Grant from the University of Michigan’s Graham Sustainability Institute.
Declaration of conflicting interests
The author(s) declared no potential conflicts of interest with respect to the research, authorship, and/or publication of this article.
Funding
The author(s) disclosed receipt of the following financial support for the research, authorship, and/or publication of this article: This work was supported by Graham Sustainability Institute, University of Michigan (Catalyst Grant).
Supplemental Material
Supplemental material for this article is available online.
Notes
References
Supplementary Material
Please find the following supplemental material available below.
For Open Access articles published under a Creative Commons License, all supplemental material carries the same license as the article it is associated with.
For non-Open Access articles published, all supplemental material carries a non-exclusive license, and permission requests for re-use of supplemental material or any part of supplemental material shall be sent directly to the copyright owner as specified in the copyright notice associated with the article.