
Abstract
Socioeconomic and place-based factors contribute to grocery shopping patterns which may be important for diet and health. Big data provide the opportunity to explore behaviours at the population level. We used data collected from Flipp, a free all-in-one savings and deals content app, to identify visitation to grocery stores and estimate home-to-store distances, monthly frequencies and number of unique stores visited in eight Canadian cities during 2020. Grocery shopping outcomes and associations with income, population density and percentage of car commuters were explored using data aggregated at the Aggregate Dissemination Area level in which app users lived. Changes in patterns of grocery shopping following restrictions implemented in response to the COVID-19 pandemic were also investigated. The median of average home-to-store distances ranged from 4 to 5 km across all cities throughout 2020. Shorter distances for grocery shopping were shown consistently for shoppers living in lower income, densely populated and low car-commuting ADAs. A maximum of three unique supermarkets were visited on average each month. Decreases in the frequency and variability of grocery store visits were shown across all cities in April 2020 following the implementation of restrictions in response to COVID-19, and pre-pandemic levels of shopping were rarely achieved by the end of the year. Ultimately, these results provide much needed information regarding the characteristics of grocery shopping trips in a high-income country, as well as how food shopping was impacted by the onset of the COVID-19 pandemic. This information will be useful for a range of future studies seeking to characterise access to food retail.
Introduction
The spatial configuration of food retailers influences the potential distances required to travel for grocery shopping and to access healthy food. The geography of food retailers forms one important component of food access, in addition to other factors such as availability and affordability of healthy and culturally relevant foods (Penchansky and Thomas, 1981; Widener, 2018). However, most studies that seek to characterise spatial access to food retail rely on arbitrary and standardized distance or travel time thresholds, such as 0.8 km or 30 min, based on limited or no empirical evidence (Bivoltsis et al., 2018; U.S. Department of Agriculture, 2021). This presents an issue given that other household factors, including income and available transport options, play a role in shaping how far and often people are willing, or compelled, to travel to particular grocery stores. Added to this, disruptive events, such as the COVID-19 pandemic, can greatly shift the grocery shopping behaviour of individuals who continue to shop in-person by adjusting how far and frequently they make grocery trips.
The dependence of food environment and access measures on unobserved distance and store visitation assumptions impacts the results of studies seeking to understand the associations between food retail environments and a range of dietary and health outcomes. In this paper, we hypothesise that typical home-to-store distances, frequency of store visits and number of unique stores visited will vary by populations and place. Using big data from approximately eight million grocery shopping trips recorded via Flipp, a free all-in-one savings and deals content app, we test these hypotheses across eight Canadian cities and present how these three grocery shopping traits change following the onset of the COVID-19 pandemic during 2020.
Background
A wealth of literature has explored grocery store access by assessing proximity to the closest retailer from home addresses or quantifying the number of retailers within a specified area (Charreire et al., 2010). Insufficient access in low income neighbourhoods, defined as food deserts, has been highlighted as a potential contributing factor to poor diet quality with populations without car access identified as high risk groups (Walker et al., 2010). However, the generalisability of findings, measures and concepts has been contested (Cummins et al., 2014). In the Canadian context, studies from major cities have shown limited evidence that geographic access to supermarkets is related to neighbourhood socioeconomic status (Apparicio et al., 2007; Smoyer-Tomic et al., 2008) yet household food insecurity remains an issue for low income families (Kirkpatrick and Tarasuk, 2010). Access to fresh food has also been shown to vary by population sub-groups, including older and minority populations in cities in Saskatchewan, and longer distances to the nearest supermarket have been observed for neighbourhoods with higher car ownership (Wang et al., 2014; Wang et al., 2016). Due to the complex and multidimensional nature of access and variability in shopping requirements, there has been little consensus on how best to measure food access with an underlying, and potentially problematic, assumption that more stores within close proximity to residential addresses equates to better accessibility and ultimately healthier food behaviours (Bivoltsis et al., 2018). As a consequence, evidence relating to food access and health has been largely inconclusive and there is a need to understand what constitutes improved access for whom to better inform policy interventions.
Store visitation data can provide information to guide relevant measures of food access and improve understanding of relationships with shopping behaviours. Studies have shown that many shoppers do not shop at the supermarket closest to their home address (Drewnowski et al., 2012; McGuirt et al., 2018) and measures that capture actual retailers visited are more relevant than times or distances to the most proximal store or boundaries of residential areas. Shedding light on typical home-to-store distances is also important for understanding shopping trip frequency. Frequency has been associated with the purchase and consumption of fresh and healthy foods (Banks et al., 2020; Kopetsky et al., 2020) yet distances that individuals travel, either through choice or necessity, may have an inverse relationship with the frequency of trips made (Gustat et al., 2015). Place plays a key role in shaping shopping behaviour through the availability of transit and shopping opportunities as well as embedded perceptions, cultures and sociodemographic characteristics. Intuitively, car owners may make longer and fewer grocery trips as they are able to transport more items in a single journey. However, studies focussing on narrow geographical areas, typically single cities, report conflicting outcomes. For example, both car owners (Gustat et al., 2015; Vojnovic et al., 2021) and alternative mode users (Nilsson et al., 2015; Jiao et al., 2016) have been identified as the most frequent shoppers, with income appearing to moderate findings.
From a policy perspective, identifying where and how often people shop is important for understanding the implications of events and interventions in different urban contexts. Increased supermarket density has been hypothesised to be protective for poor health outcomes and the simplicity of building more stores to alleviate food insecurity, diet and health issues provides an attractive solution. However, findings have largely been shown for high income and high transit areas (Murphy et al., 2017) and few studies evaluate the effects of changes in food access over time, particularly at large geographical scales. There is also limited evidence to understand whether density is related to the use of multiple stores to access a greater range of food items and whether there is an upper threshold to the number of stores that provides optimal access. Large-scale studies which capture temporal changes allow for comparisons across places. An opportunity is therefore presented to identify commonalities in shopping traits and understand how built environment and sociodemographic characteristics may explain variability in shopping behaviour and responses to changes in food access.
The application of big data in social science research provides an opportunity to enhance understanding of human behaviour at scale (Lee, 2017). Big data are typically free from survey bias, capturing more natural behaviours and choices, and tend to be dynamic by logging activities in real-time. Supermarkets have attempted to use visitation data from in-store observations to inform marketing strategies and maintain customer loyalty (Min, 2006; Allaway et al., 2011). When collected at the individual-level and coupled with information on home neighbourhoods, insights into store usage, trip characteristics and how they vary across place can be determined. From a methodological and research perspective, this information allows for assumptions made when measuring food access to be challenged. For example, it is possible to test whether the number and proximity of unique stores are linearly synonymous with use, and whether primal (the number of shopping opportunities within a specified time or distance) or dual (time or distance to reach the closest opportunities) measures are more relevant for defining healthy food access (Cui and Levinson, 2020). Further, repeat observations and linkage to administrative data by home location create a powerful resource for investigating responses by different groups to a particular event across a national scale (Connelly et al., 2016).
In March 2020, states of public emergency were declared individually by provinces across Canada in response to the COVID-19 pandemic. Non-essential services, including restaurants, were ordered to close and restrictions were placed on individuals’ mobility at the province-level which led to immediate and widespread changes in shopping and travel patterns. Consumers became limited in the locations where they could shop and the requirement to consume all meals at home caused a change in demand for quantities of groceries purchased, frequency of shopping trips and demand for online or collection services (Goddard, 2020). In the USA, initial increases in grocery stores visits were reported in early March 2020, which subsequently declined below baseline in the following weeks, with different rates of change and recovery observed by shoppers’ income and racial identity (Bian et al., 2021; Kar et al., 2021).
Widespread changes in shopping demands created challenges for existing food provisioning and delivery systems. In addition, increases in financial hardship, food insecurity and reliance on emergency food aid, coupled with decreases in public transit services (Niles et al., 2020; Allen and Farber, 2021), created differential impacts on food access across populations and place. For example, lower income workers were less likely to be able to work from home and were more vulnerable to food insecurity (Gallacher and Hossain, 2020; Men and Tarasuk, 2021), highlighting cumulative harmful consequences for groups already facing risks relating to food access, health and well-being pre-pandemic (Gundersen et al., 2018; Wolfson and Leung, 2020).
This study first aims to contribute to food access literature by using large-scale data to establish baseline grocery shopping patterns in eight major cities across Canada. Second, we aim to build on studies in the USA, which focus on more specific locations and time periods (Bian et al., 2021; Kar et al., 2021), by assessing changes in grocery shopping in response to the COVID-19 pandemic for the pan-Canadian urban cohort. We quantify home-to-store distances, the frequency of grocery trips and the number of unique stores visited during 2020 and test for differences by socioeconomic status, built environment and transport opportunities at a monthly temporal scale.
Methods
Data
Store visitation data were provided by Flipp; a free all-in-one savings and deals content app, available to users in the USA and Canada. In a recent qualitative analysis of social media platforms in Ottawa, participants recommended apps including Flipp as a way to save money on food shopping (Lynch et al., 2022). Flipp reports that their app is used by approximately 25% of households lead by individuals aged 15 to 54 in Canada. Weekly user-growth prior to the COVID-19 pandemic averaged 15% with an increase to 19% in the second week of March 2020 which declined and then stabilised in the following 2 months (Flipp, 2020). Throughout this period, the greatest number of flyers opened were for grocery stores.
Canadian cities included for analysis.
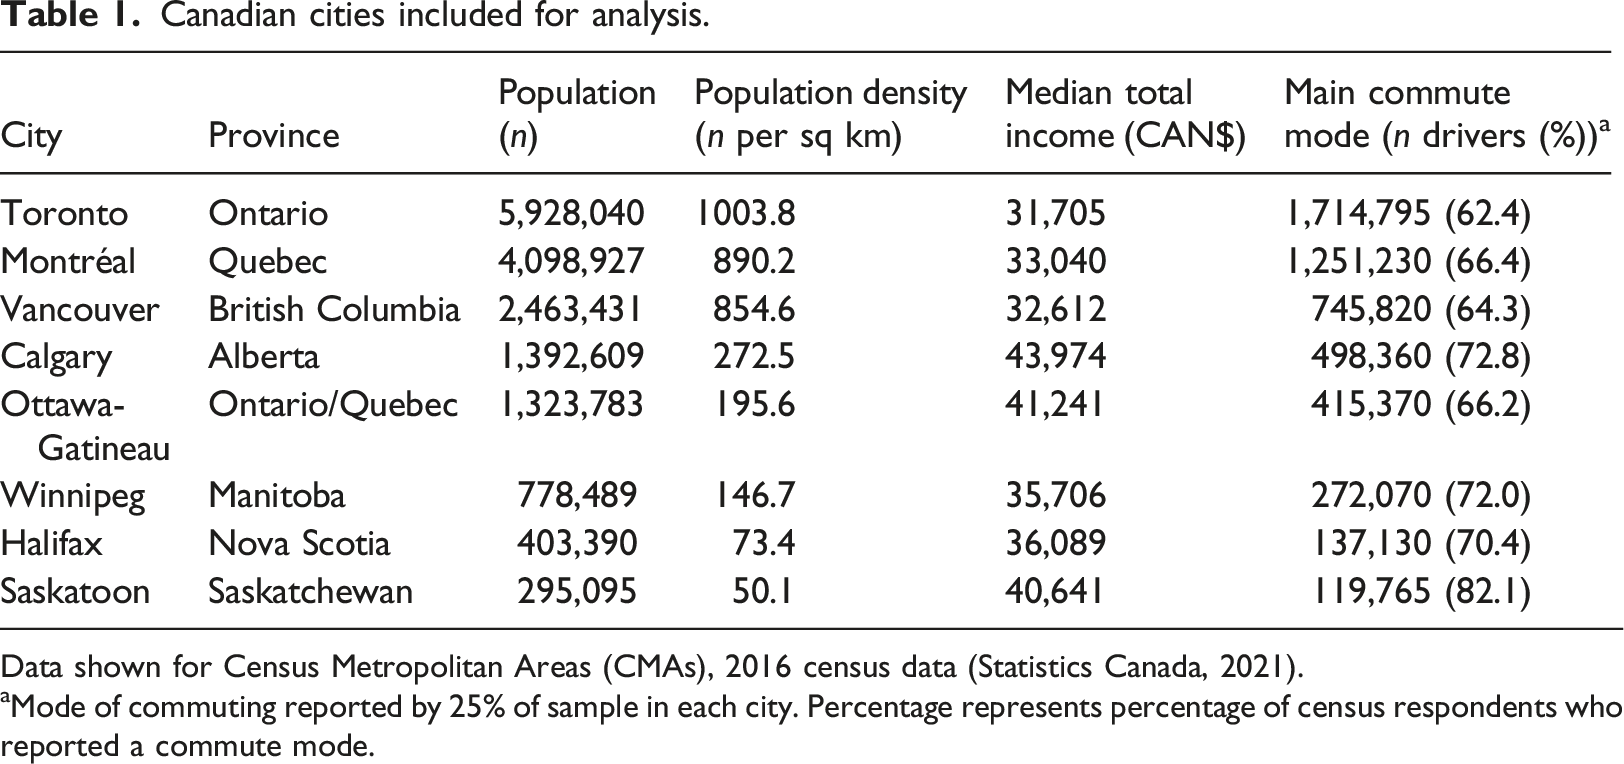
Data shown for Census Metropolitan Areas (CMAs), 2016 census data (Statistics Canada, 2021).
aMode of commuting reported by 25% of sample in each city. Percentage represents percentage of census respondents who reported a commute mode.
Grocery store visitation
Using Foursquare’s Pilgrim technology, store visitation is recognised using all signals available on the phone. These signals include GPS coordinates, WiFi triangulation, cell tower signals, compass and accelerometer.
Flipp provides content in-app that can be categorised by store type, among other ways. The set of possible venue categories is created and managed by Foursquare. For a given venue, it is either set by users, business owners, or Foursquare-suggested category. Stores have the option of primary, secondary and tertiary classifications. For example, if a supermarket includes a pharmacy, the primary classification will be supermarket and secondary pharmacy. For the purposes of this study, visits to stores categorised as supermarkets, grocery stores, or big box stores as either primary, secondary or tertiary store type were identified as grocery trips and included for analysis. App users were required to have on average at least one visit to a store every 2 months (n > 5) and at most one store visit per day (n < 366) during 2020. This allowed users within the thresholds who made multiple trips on the same day to be included. Given the median number of monthly store visits has been reported as 6 in previous literature (Gustat et al., 2015), these thresholds were considered appropriate to exclude improper use, such as the download and deletion of the app in short succession. Exploratory analysis of grocery trips taken throughout the year was initially undertaken for the Toronto sample. Spikes in frequency were observed in January and December, uniquely characteristic of holiday shopping trends. Given these spikes skewed general annual trends across sociodemographic characteristics and consistently showed significant differences with baseline frequencies in March, these months were subsequently excluded in analyses of all cities. This enabled post-COVID recovery and differences by people and place to be more clearly identified.
Based on the full exclusion criteria across all cities, 269,608 (43.6%) app users were removed from a potential sample of 618,879.
Grocery trip variables
The home-to-store distance for each grocery trip was calculated by estimating the Euclidean distance between the address of each grocery store visited and the centroid of the app user’s home postal code. Trips of more than 50 km were excluded as they were not considered to be representative of typical shopping trips within CMAs. For each month, distances of valid trips made by each individual were averaged.
The total number of visits to grocery stores by each individual per month, irrespective of whether the same or different stores were visited, was used to estimate the grocery trip frequency whilst the number of unique stores visited per month represented grocery store variability.
App users were grouped at the Aggregate Dissemination Area (ADA) level based on their home postal code. ADAs have a population of 5000 to 15,000 based on the previous census population counts and align with provincial and CMA boundaries (Statistics Canada, 2019). Values described in the preceding two paragraphs were used to derive aggregate values for ADAs. For users in each ADA, the median of individuals’ average distances, mean frequency and mean variability of grocery trips were calculated for each month.
Sociodemographic variables
Data from the 2016 census, provided by Statistics Canada (Statistics Canada, 2021), were used to estimate income, population density and percentage of car commuters. These variables were chosen to represent three important factors related to access to food: financial security, urban form and transportation options (Caspi et al., 2012). Income was represented by the median total income of households and population density the number of dwelling counts per square km. As car ownership was not available in the census data, car commuters were used as a proxy and represented as the percentage of workers who commuted primarily by car, truck, or van. Data aggregated at the ADA level for each sociodemographic variable were categorised as quintiles separately for each CMA.
Statistical analysis
For each CMA, descriptive analyses were performed separately to visualise variations in grocery store trips over space and time. First, spatial variation in sociodemographic variables and grocery trips were mapped by ADA where maps presenting grocery trip variables were based on total trips made in 2020. Second, grocery trip values for each ADA were grouped by sociodemographic variables and monthly variations were described through two-way interaction linear plots.
To test for differences in grocery trip variables by sociodemographic variables and month, two-way ANOVA models were used, including interaction terms for the sociodemographic variable being investigated and month. Next, multiple regression was performed to estimate relationships between each grocery trip and sociodemographic variable, as well as potential interaction effects for each level of the sociodemographic variable being investigated by month.
Grocery trip data were prepared and joined to census data using PostgreSQL and the PostGIS extender, descriptive maps were created using PostGIS and QGIS and regression analyses were performed in R Studio. Data processes were trialled, and scripts finalised using data from the Toronto CMA. Subsequent analyses were performed individually for each remaining CMA and general trends across results were compared narratively.
Results
Samples
Sample sizes and characteristics.
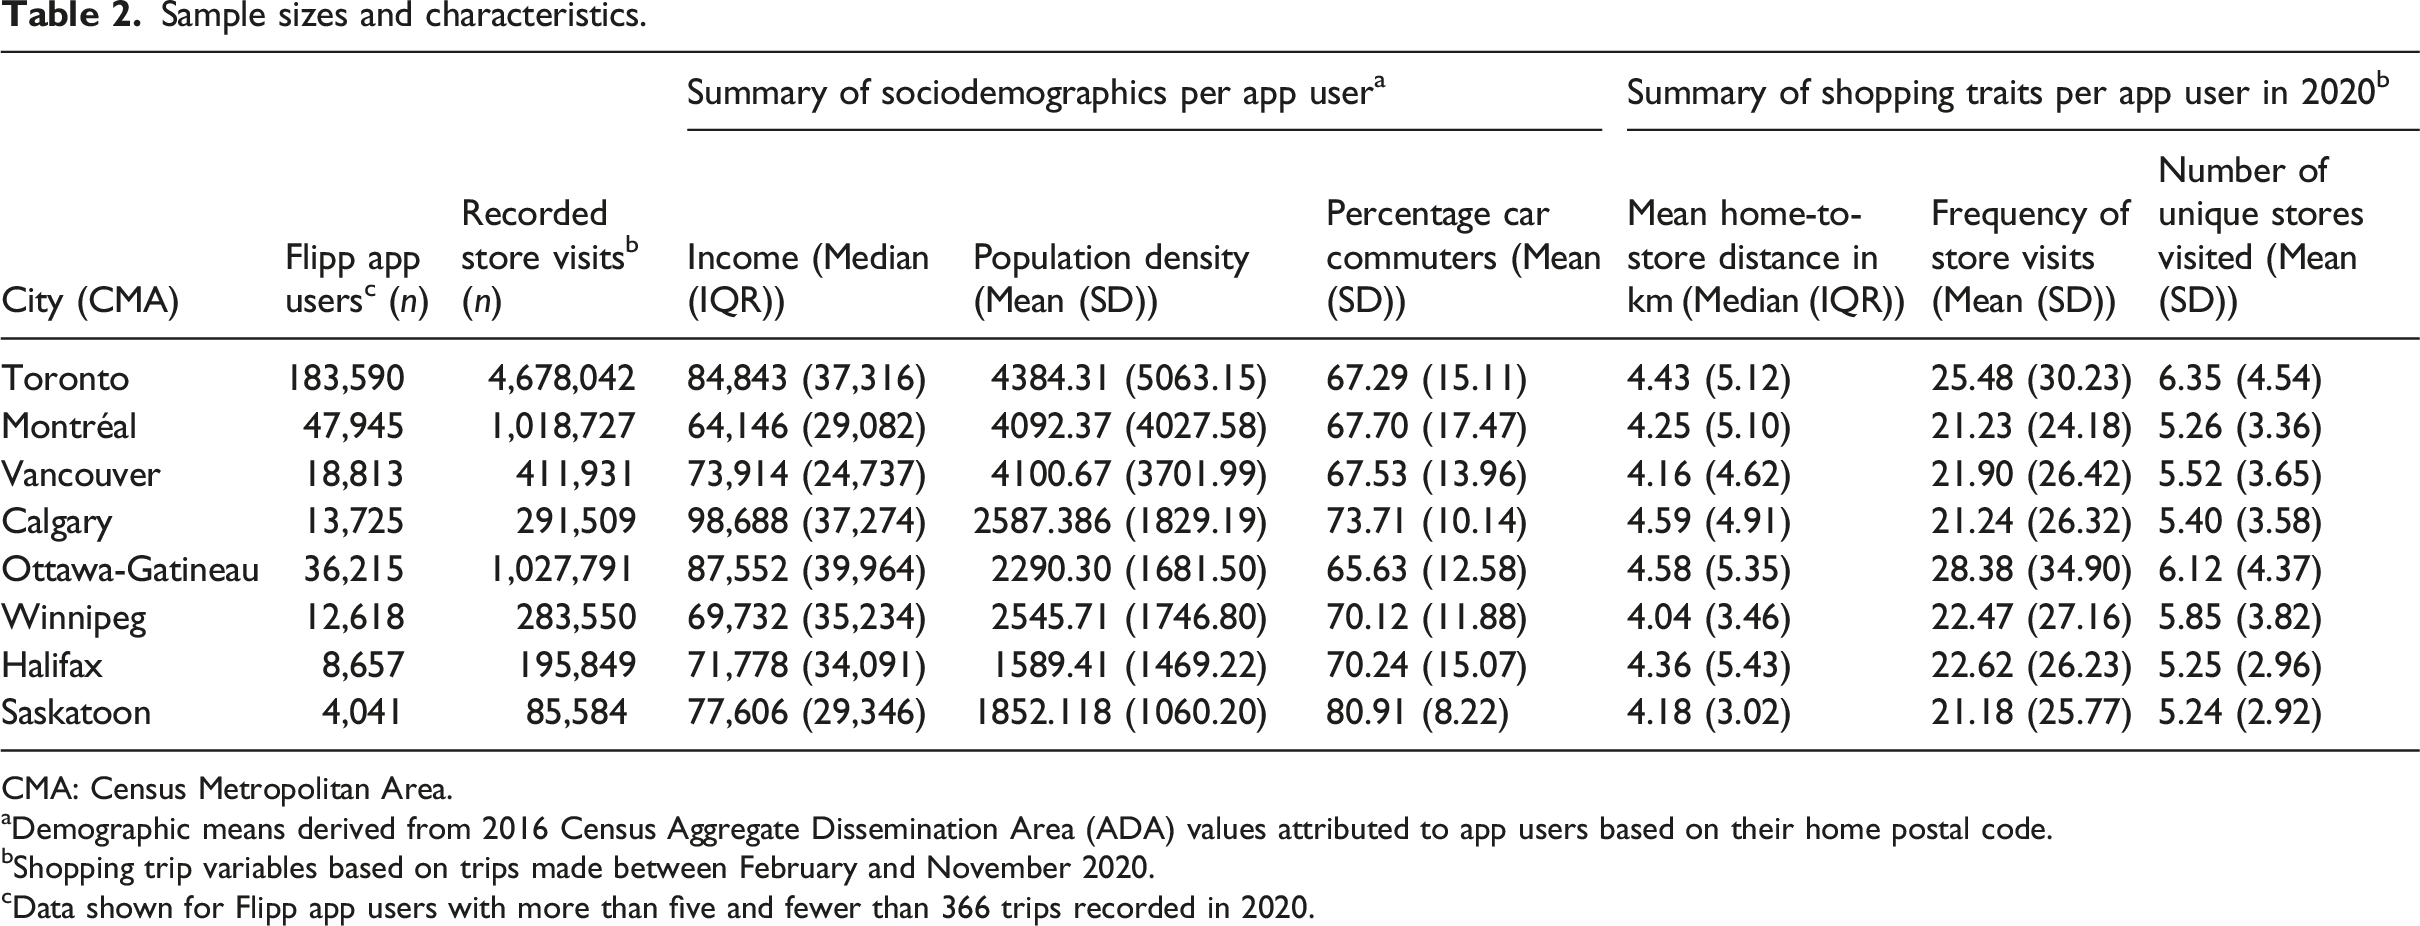
CMA: Census Metropolitan Area.
aDemographic means derived from 2016 Census Aggregate Dissemination Area (ADA) values attributed to app users based on their home postal code.
bShopping trip variables based on trips made between February and November 2020.
cData shown for Flipp app users with more than five and fewer than 366 trips recorded in 2020.
App users made an average of 21–28 grocery store trips in 2020 (e.g. Saskatoon Mean (SD): 21 (26) and Ottawa-Gatineau Mean (SD): 28 (35)) to an average of 5–6 different stores throughout the year. The median home-to-store distance, based on individual averages for 2020, ranged from 4–5 km across all cities.
Spatial distribution of sociodemographic variables and grocery store trips (2020)
Figure 1 illustrates the spatial distribution of demographics as well as the median of average home-to-store distances, mean frequency and mean number of unique grocery stores visited in 2020 by ADA in Toronto. Equivalent maps for the remaining seven cities are provided in the Supplemental Material, Section S1. Maps showing demographics (2016) and grocery store visits (2020) by Aggregate Dissemination Area (ADA) in Toronto. 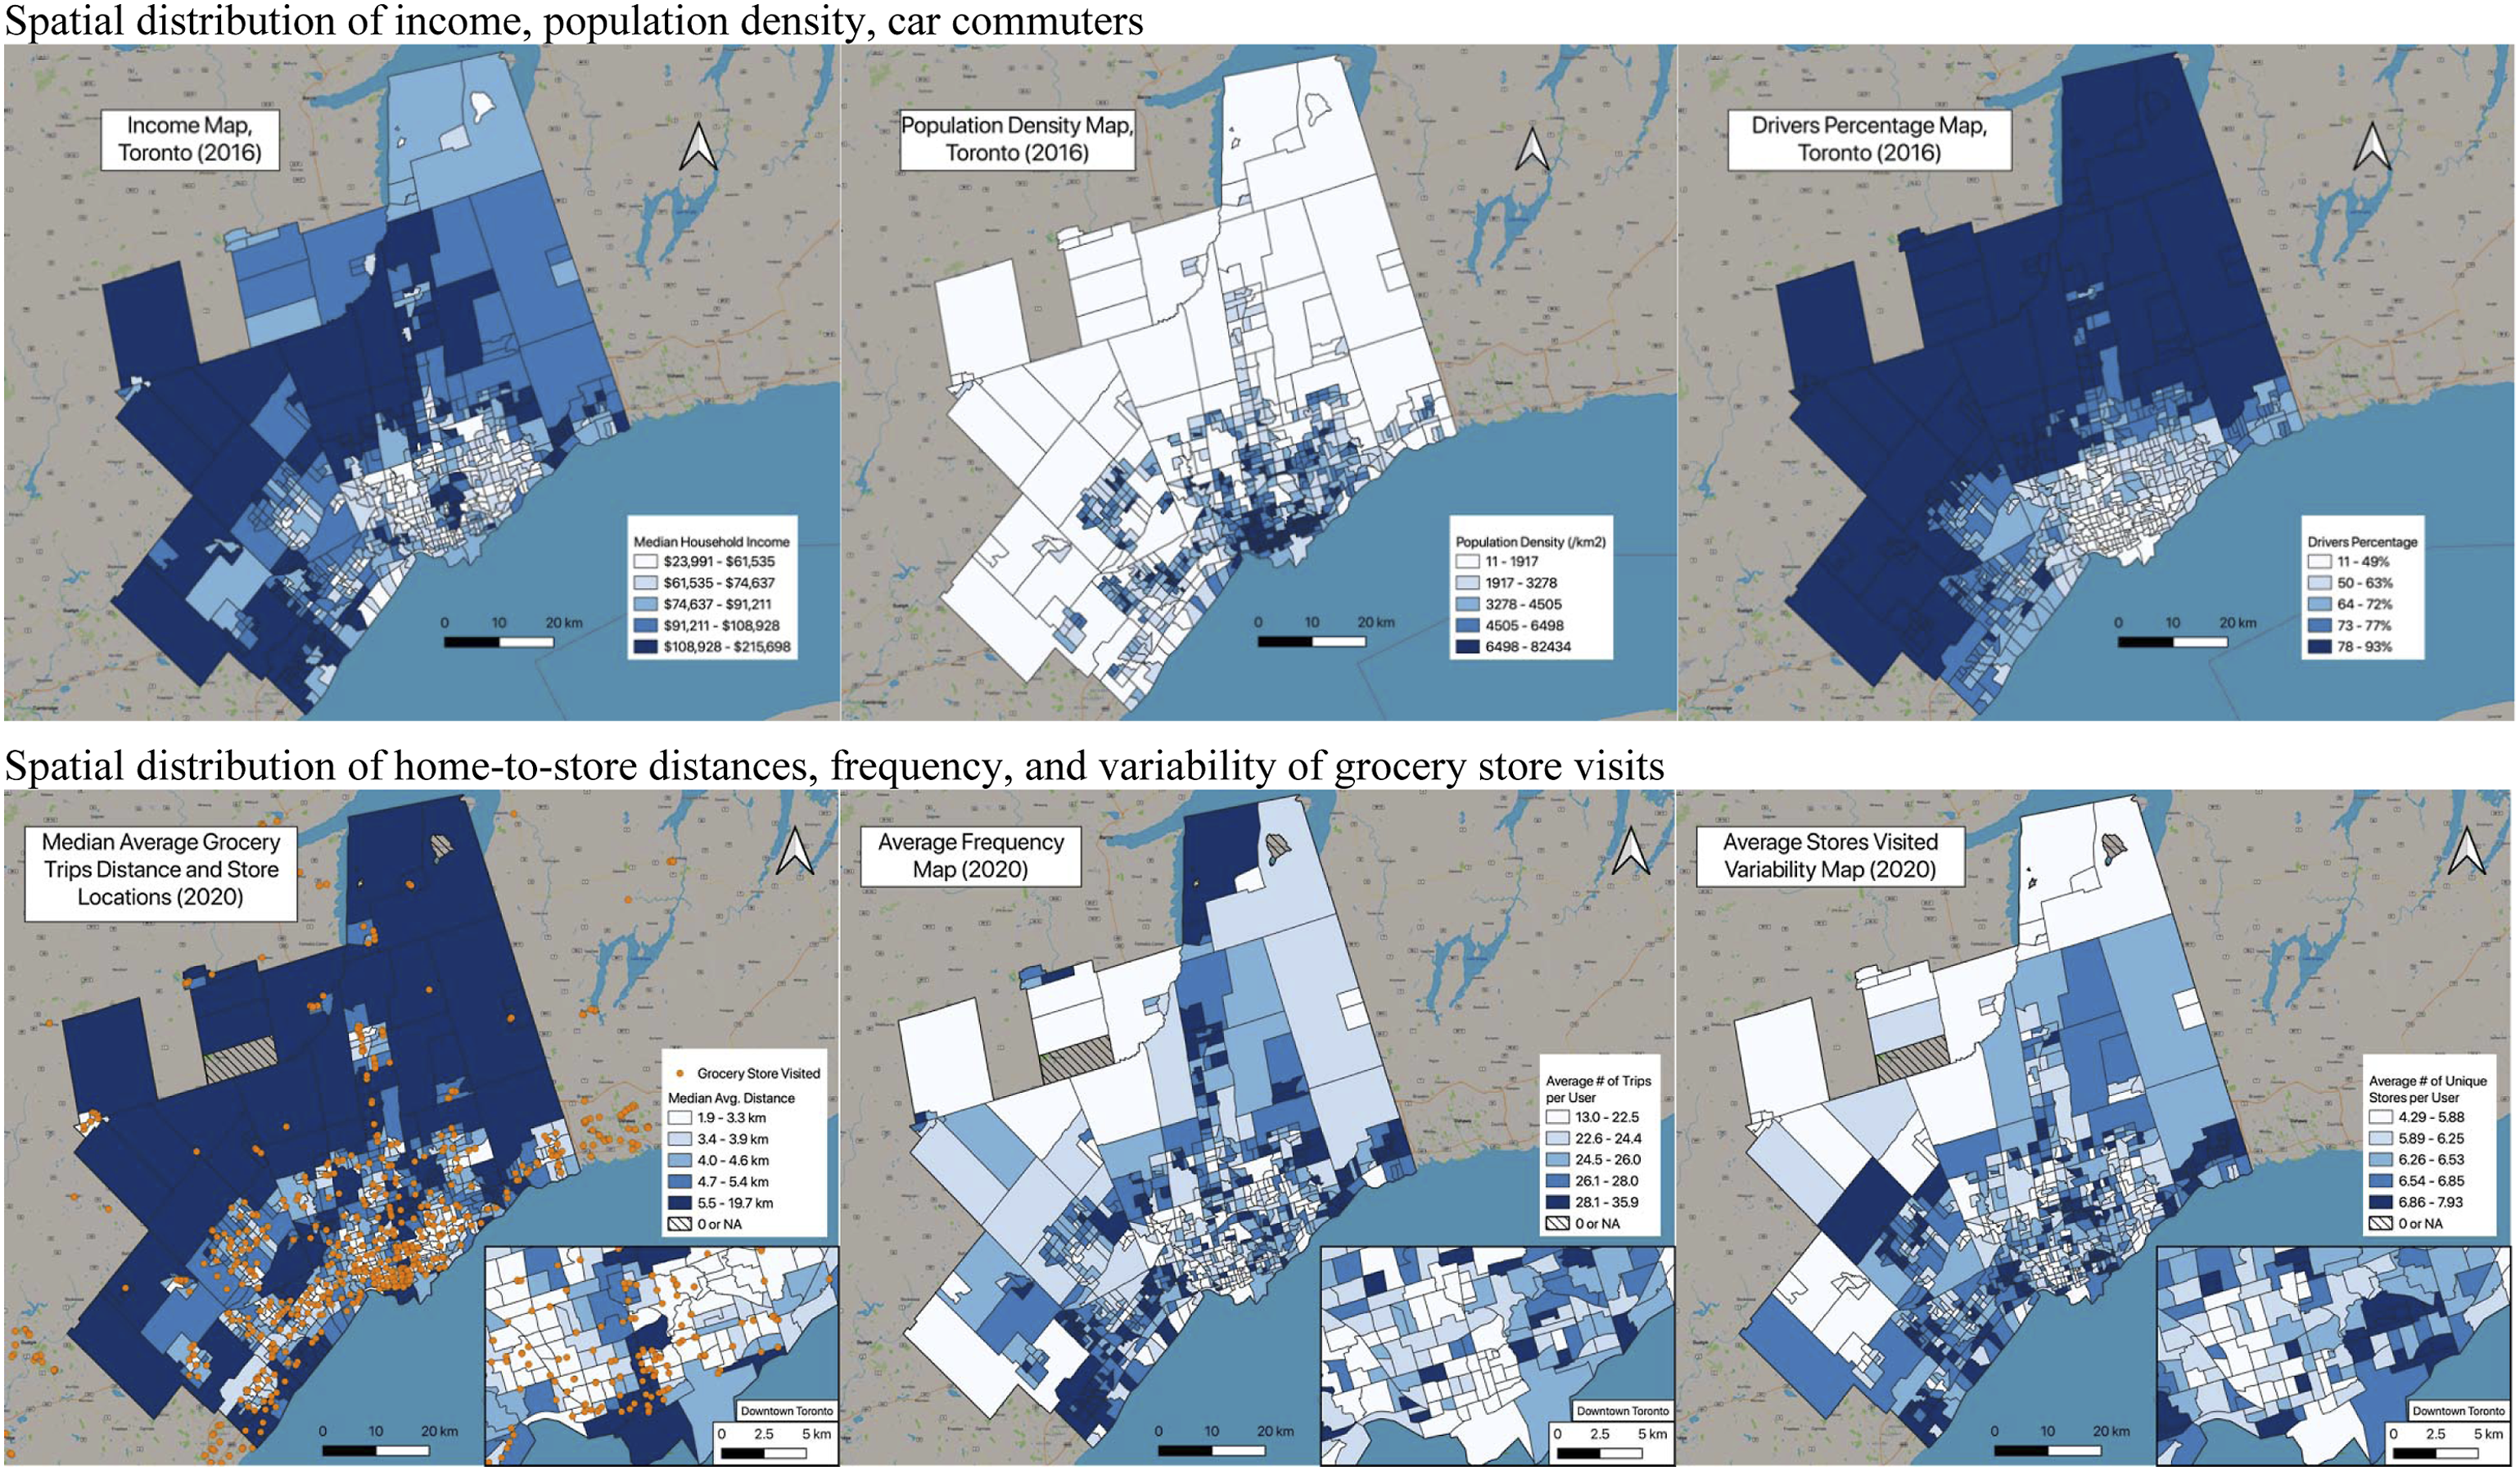
In general, ADAs in the urban core of all cities are lower income, more densely populated and have a smaller proportion of commuters who drive compared with suburban ADAs. In terms of grocery shopping, suburban dwellers who lived furthest from the downtown core consistently recorded the furthest distances (at least 2 km further than trips made by those in the lowest quintile); however, the shortest journeys were not always observed by those in the most central ADAs. Frequency and variability appeared to cluster in locations across the cities. The fewest visits and least number of unique stores visited were recorded in some of the most peripheral ADAs, particularly in Ottawa-Gatineau, Winnipeg and Calgary.
Temporal trends of grocery monthly store trips (2020)
The results of the ANOVA tests showed home-to-store distances varied over time for app users in Toronto and Montréal only (Supplemental Material, Section S5). Variations in frequency and variability of store visits were shown over time for all cities.
An example of two-way interaction plots showing changes in grocery trip variables for Toronto in 2020 are provided in Figure 2. Plots included in the Supplemental Material show changes in grocery trip variables by income (Section S2), population density (Section S3) and percentage of car commuters (Section S4) for all cities. Differences by sociodemographics and whether effects were modified by time are described in detail in the following three sections. Supporting results from multiple regression are provided in the Supplemental Material, Section S5 for all cities. Temporal trends of monthly grocery store visits (2020) by sociodemographic groups in Toronto.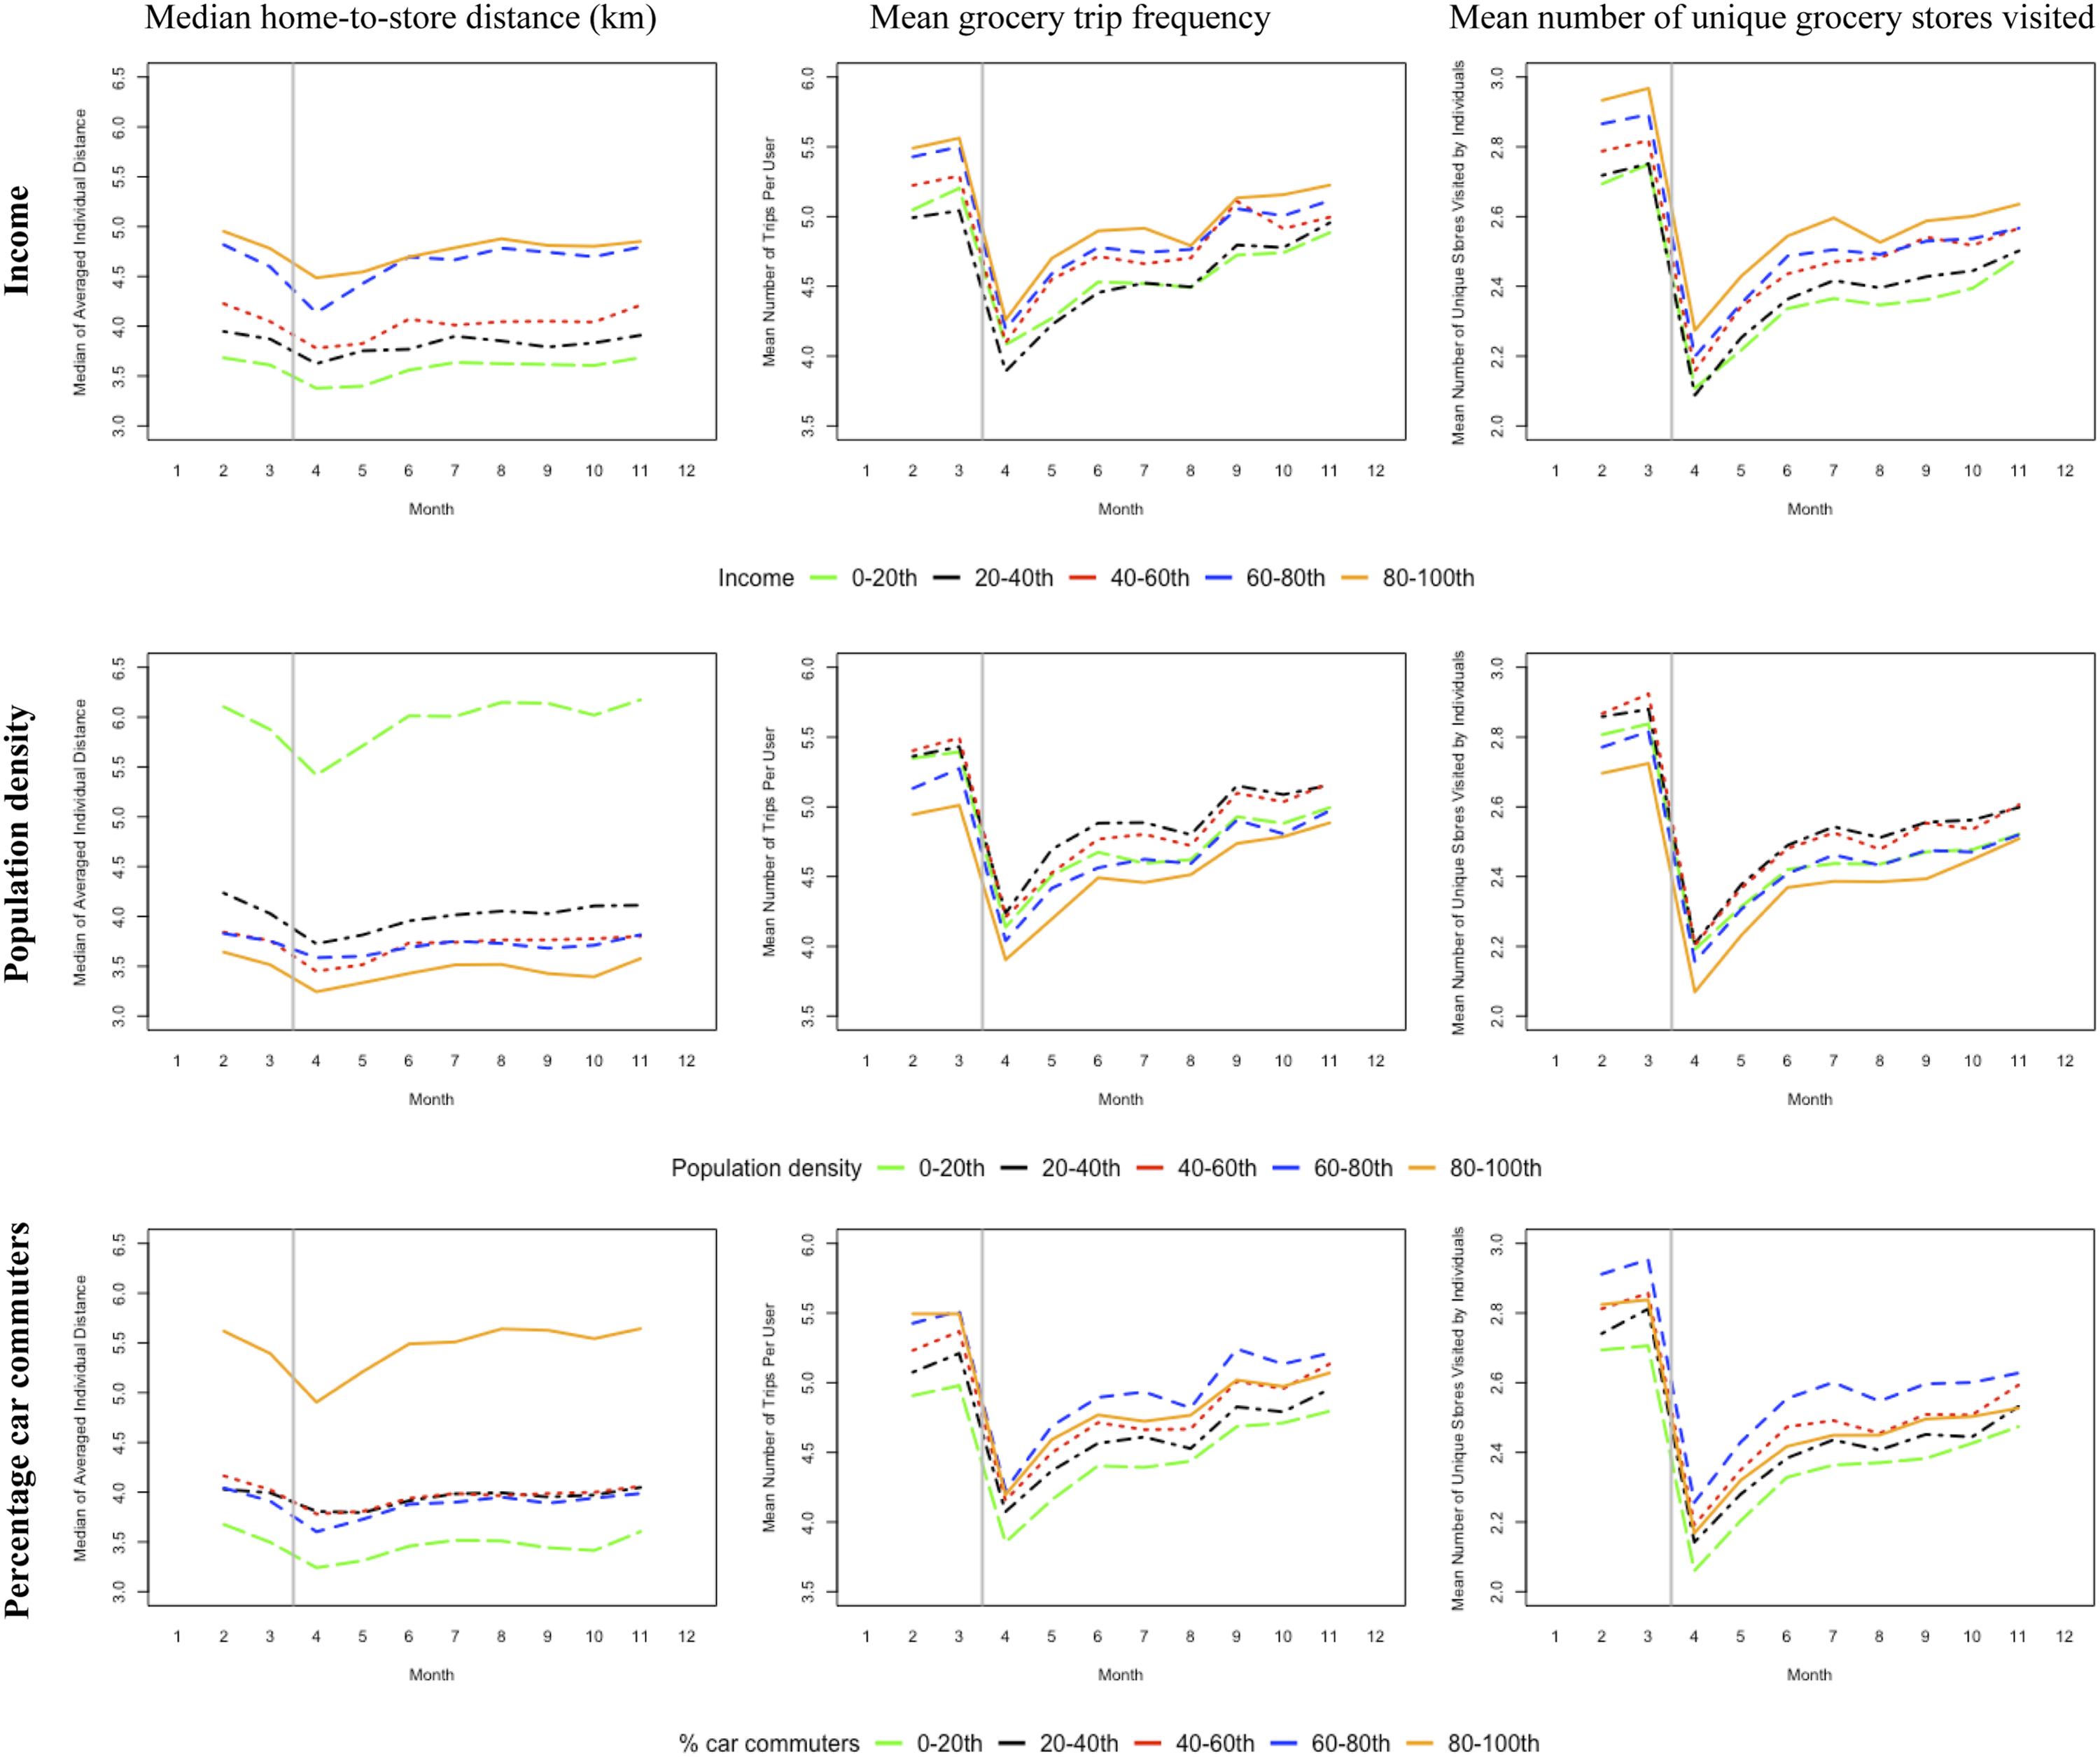
Based on the linear plots, general temporal trends show a decline in distances between February and April in Toronto and Montréal, with a steady recovery to near pre-pandemic levels by June. Whilst trends in distances remained relatively stable over the year for other cities, a similar pattern of decline and recovery appear to occur for some groups, particularly in Ottawa-Gatineau and Vancouver.
A significant decline in frequency and variability of grocery store trips is shown between March and April for all cities. Whilst recovery to pre-pandemic levels appears to happen in Saskatoon, no other cities recovered to the same degree in 2020 with lower levels observed in April remaining consistent in Calgary through the remainder of the year. In some cities, particularly Montréal and Ottawa-Gatineau, a second decline in variability was shown between August and October which aligned with a second wave of COVID-19 cases and provincial responses.
Income
The ANOVA results showed significant differences between income groups for each grocery trip variable for all cities (p < .05), with the exceptions of Calgary and Saskatoon where no differences were shown for variability of stores visited.
Based on the multiple regression models, compared with app users living in the lowest income ADAs, users in higher income ADAs were more likely to have further home-to-store distances, holding the time variable equal (e.g. Montréal upper three quintiles: β > 1.9, p < .001). This was observed for all cities except Ottawa-Gatineau where no effects were shown. In contrast, few variations in frequency and variation were seen by income groups except in Toronto and Vancouver where higher income groups were more likely to shop more often and visit a higher number of unique stores than the lowest income group (e.g. Vancouver upper quintile for frequency: β = 0.64, 95% CI: 0.23, 1.06).
Temporal effects on frequency and variability described in the preceding section appeared to be dependent on income group. When considering interaction terms, increases in frequency appeared greatest for app users in higher income ADAs later in the year in Montréal and Winnipeg (Supplemental Material, Section S2). Changes in variability by income appeared unique to different cities. In Vancouver, app users in the highest income ADAs consistently visited the greatest number of unique stores in the months following April and continued to increase store variability by the greatest rate through to September. App users in the highest income ADAs also appeared to show the greatest rates of changes in Winnipeg, Ottawa-Gatineau and Montréal later in the year but these groups were not always visiting the highest numbers of unique stores. In Halifax, increases in the unique number of stores visited was greater and more consistent for the lowest income groups.
Population density
Differences were shown by population density across cities for all grocery trip variables from the ANOVA (p < .05).
Compared with app users living in the least densely populated ADAs, users in higher density ADAs were more likely to have shorter home-to-store distances when holding the time variable constant in all cities. Patterns of grocery trip frequency and variability by population density were less distinct. Toronto and Vancouver exhibited unique results with app users in the most densely populated ADAs shopping less often and visiting fewer stores compared with those in the least dense ADAs (e.g. Toronto upper quintile for frequency: β = −0.40, 95% CI: −0.57, −0.24, and variability: β = −0.11, 95% CI: −0.17, −0.05). Conversely, in Montréal and Ottawa-Gatineau, app users living in medium density ADAs were likely to shop more often and visit more unique stores than users in the least densely populated ADA (e.g. Ottawa-Gatineau third quintile for frequency: β = 1.10, 95% CI: 0.12, 2.08, and upper four quintiles for variability: β > 0.25, p < .05) whilst no effects were shown for the remaining cities.
Effects shown by time or population density did not appear to be dependent upon each other for any of the grocery shopping variables for app users in Calgary, Ottawa-Gatineau, or Saskatoon. However, effect modification was apparent for other cities. Between March and April, the rate at which home-to-store distances declined was greatest for users in the least densely populated ADAs in Montréal and Vancouver (Supplemental Material, Section S3). The rate at which increases in frequency and variability occurred, particularly later in the year, appeared greater for higher density groups in Montréal and Halifax.
Percentage of car commuters
Based on the ANOVA, differences in grocery trips were shown by percentage of commuters who travelled by car in ADAs across cities (p < .001). Significant effects were also shown for interactions for store variability in Montréal, Vancouver and Halifax, suggesting effects seen cannot be generalised for all groups over time.
The results of the multiple regression showed that compared with app users living in ADAs with the lowest proportion of car commuters, users in higher car-commuting ADAs were more likely to record further home-to-store distances (e.g. Halifax upper quintile: β = 8.89, 95% CI: 6.36, 11.42). In the most populated cities of Toronto, Montréal and Vancouver, users in ADAs with a higher prevalence of car commuters were also more likely to shop for groceries more often and visit more unique stores, whilst this pattern was often reversed in other cities.
Changes over time appeared to have little effect for distances; however, interaction effects for frequency and variability showed the rate of recovery differed by car-commuting groups (Supplemental Material, Section S4). App users living in ADAs with the highest prevalence of car commuters increased at a steadier rate, particularly in Winnipeg and Halifax where in the case of the latter, declines were shown around August when restrictions began to ease.
Discussion
For a large sample of shoppers in eight Canadian cities, we explored home-to-store distances of grocery trips, as well as the frequency and number of unique grocery stores visited, and how these changed throughout 2020 in response to the COVID-19 pandemic. Distinct declines in the frequency and variability of store visits were apparent across all cities, although distances only appeared to change over time in Toronto and Montréal. Neighbourhood characteristics of income, population density and percentage of car commuters were each related to grocery store trips and these effects were modified over time with divergent relationships observed across cities for different demographic groups by month.
Home-to-store distance of grocery trips
General patterns across all eight cities suggested that app users who lived in higher income, less densely populated and higher car-commuting ADAs were likely to record the furthest home-to-store distances for grocery shopping. These findings at baseline support evidence that food access is not necessarily synonymous with geographical proximity to the home address. Whilst shown to be important, additional factors including price, transport opportunities and potential to save time influence store selection, with higher income individuals or individuals with access to a car able to travel further for better store prices (Aggarwal et al., 2014; Ghosh-Dastidar et al., 2014; DiSantis et al., 2016).
Over time, patterns and distances travelled remained relatively stable in most cities. In Toronto, Vancouver and Calgary, for example, average monthly distances rarely exceeded 5 km by any group in line with the annual (Table 2). However, there were some declines in distances in April following lockdown restrictions in the most populated cities with app users living in the least densely populated ADAs experiencing the greatest reductions in Montréal and Vancouver. As workplaces and public transit routes were temporarily closed, changes in travel requirements and opportunities created shifts in travel behaviour and the extent of individuals’ spatial mobility patterns (Abdullah et al., 2020; Palm et al., 2021). Given food shopping has been linked with daily mobility and the commute to work (Shannon and Christian, 2017), these adjustments may have contributed to changes in the ways food shopping was incorporated into daily routines and the grocery stores accessed. Those living in more suburban areas in Montréal and Vancouver, who likely travel the longest distances for daily activities to begin with, may have switched to using grocery stores closer to their residential neighbourhood. This may have been relatively easier within these specific cities given their wider distribution of store locations in low density ADAs, although changes to shorter distances appeared only temporary for this group.
Frequency and variability of grocery trips
Findings relating to frequency of grocery trips and the number of unique stores visited were more varied across cities. In Toronto and Vancouver, living in ADAs with higher income, lower population density, or more car commuters was associated with more regular trips and a greater number of unique stores visited. These findings were shared by users living in ADAs with the highest percentage of car commuters in Montréal. Yet in contrast, frequency of grocery trips was lowest for these users in Calgary, Ottawa-Gatineau and Saskatoon.
Mixed findings relating to the frequency of shopping reflect inconsistency reported in the literature (Gustat et al., 2015; Jiao et al., 2016; Banks et al., 2020). Car access has been both positively and negatively associated with frequency but available transit options and required distance to travel may mediate relationships. In Ottawa-Gatineau and Saskatoon, the longest home-to-store distances were recorded which may reflect local shopping opportunities and transport infrastructure, contributing to infrequent, high volume grocery shops for app users living in more car-oriented neighbourhoods due to longer travel times. This may have implications for the purchase and consumption of fresh foods which have a shorter shelf life compared with processed options. A sparse distribution of stores in low density and high car-commuting areas in Calgary, Ottawa-Gatineau and Saskatoon contrasts with a denser distribution of stores across the whole of the CMA in Toronto and Montréal (Supplemental Material S1) where it may be easier for residents in low density ADAs to make shorter and more regular trips. Downtown residents in Toronto and Vancouver may have also recorded fewer grocery trips as they procure food in alternative ways, such as through online delivery which may be more popular in low car-oriented neighbourhoods due to offered ease of transporting groceries. Additionally, areas of high population density are typically associated with a high density of food retail outlets including restaurants which may reflect choices to substitute grocery trips with eating out or take-out.
Distinct declines seen in frequency and variability of grocery trips were shown in April following initial restrictions with pre-pandemic levels rarely achieved again in 2020. However, the rate of recovery was experienced differently by sociodemographic groups across cities. App users living in higher income ADAs in Winnipeg and Montréal appeared to return to a higher frequency of grocery trips at the fastest rate. In contrast, increases in frequency and the number of unique stores visited appeared more consistent for groups living in lower income, higher density and lower car-commuting ADAs in Halifax. Divergent responses may be reflective of shopping capabilities and local urban landscapes. For example, having a reliable income, access to a car or experiencing less competition for items on shelves may have enabled greater flexibility in terms of undertaking larger and less frequent shops compared with groups who may have had to return more quickly to pre-pandemic shopping patterns out of necessity. Additionally, visitation to discount stores as an alternative for grocery shopping or the participation in online grocery delivery may contribute to variable recovery patterns shown (Chenarides et al., 2021; Kar et al., 2021).
Strengths and limitations
In this study, we used large-scale, objective store visitation data to provide insights into shopping patterns for urban populations across Canada. In doing so, we were able to identify consistent trends which challenge current measures of food access with regards to proximity and store counts and densities. The use of longitudinal data also allowed for responses to COVID-19 restrictions to be explored. However, the study is not without limitations.
In an attempt to understand socioeconomic and place-based determinants of shopping behaviour, we used aggregate measures based on shoppers’ home postal codes. As app users input their home postal code manually, often based on their current location, there may be some misclassification. However, we tested this by removing downtown populations in Toronto where unexpected shopping distances were observed and estimates remained qualitatively consistent. No further information was available for individuals and so it is unclear how representative app users are of the wider population and individual-level conclusions cannot be drawn as there is a risk of residual confounding. Although the sample is uniquely large which brings some confidence in terms of observed estimates and generalisability, app users were not always evenly distributed across cities or groups. For example, summary values were often derived from a higher number of app users in ADAs with high population density or in cities such as Toronto with a higher proportion of app users. The sample was also limited to urban populations in seven provinces of Canada. Further investigation is therefore warranted for smaller city, rural and territorial populations.
Lastly, no information on the cost or type of foods being purchased was available and we had no data for visits to alternative shopping locations such as dollar stores or ethnic grocers. We recommend future studies incorporate such information where available to provide a broader understanding of shopping behaviour and implications for food access, diet and health.
Study implications and future directions
This study adds to the literature by using comparable measures of food shopping behaviour across different urban centres within a national context. Behaviours and responses to changes in access following the onset of the COVID-19 pandemic were demonstrated at scale. Differences in shopping behaviour within and between cities highlight the importance of incorporating characteristics of place into access measures. This study showed the median monthly home-to-store distance to be a minimum of 2–3 km for all cities. Distances for app users in lower density ADAs were at least 2 km further than those in higher density ADAs, and app users in the lowest income ADAs were most likely to record the shortest distances for grocery shopping. These findings call into question the use of standard distance thresholds to estimate food access, as well as assumptions underlying food deserts. Additionally, research has often used the count or density of grocery stores as an indicator of food access. In our study, shoppers consistently visited an average of 2–3 supermarkets per month, suggesting there may be a threshold for the maximum number of unique stores shoppers visit.
Based on the high volume of demand data across all cities, two critiques of accessibility measures used in food research are raised. First, standard distance thresholds that have been incorporated into existing studies may be too low and do not capture nuanced experiences of people and place. Second, primal measures which quantify the number of stores within a given distance may be less relevant unless an upper limit is accounted for. Instead, custom measures of access as functions of neighbourhood characteristics and dual measures which consider time and distances to reach the nearest three shopping opportunities may be more appropriate. Some studies have started to incorporate sophisticated access measures which account for differences in urban structures, transport mode accessibility and time budgets (Widener et al., 2015; Niedzielski, 2021). We therefore recommend further exploration into the derivation of custom measures to incorporate cost and transport opportunities, as well as investigation into how distances to stores visited may change for different groups based on the cost and availability of healthy and culturally appropriate food at local retailers.
Capturing changes in shopping behaviour in response to a change in food access provides important findings in relation to store visits which can help inform planning around retail in light of future events. The frequency and variability of store visits appeared to be unique to cities and population sub-groups, suggesting shopping patterns may be influenced by place in terms of localised urban landscape, attitudes and policy, as well as transport and financial capabilities. These differences may provide reasoning for heterogeneous findings reported in existing studies of food environments, grocery trips and diet. Consideration should therefore be given, not only to what constitutes improved food access but also healthy food shopping behaviours in relation to the local context.
Supplemental Material
Supplemental Material - Geographies of grocery shopping in major Canadian cities: Evidence from large-scale mobile app data
Supplemental Material for Geographies of grocery shopping in major Canadian cities: Evidence from large-scale mobile app data by Lindsey G Smith, Maggie Yifei Ma, Michael J Widener and Steven Farber in Environment and Planning B: Urban Analytics and City Science
Footnotes
Acknowledgements
We thank Harmandeep Deol, Omar Shariff, Oleg Calcines, Roman Cezar, Yana Yang, and the team at Flipp for their cooperation, assistance, and feedback. Widener would like to acknowledge the Canada Research Chairs program for supporting him with a Tier 2 Canada Research Chair in Transportation and Health and the Ontario Ministry of Research and Innovation for supporting him with an Early Researcher Award.
Declaration of conflicting interests
The author(s) declared no potential conflicts of interest with respect to the research, authorship, and/or publication of this article.
Funding
The author(s) disclosed receipt of the following financial support for the research, authorship, and/or publication of this article: This work was supported by the Canada Research Chairs program for supporting him with a Tier 2 Canada Research Chair in Transportation and Health and the Ontario Ministry of Research and Innovation for supporting him with an Early Researcher Award.
Supplemental Material
Supplemental material for this article is available online.
References
Supplementary Material
Please find the following supplemental material available below.
For Open Access articles published under a Creative Commons License, all supplemental material carries the same license as the article it is associated with.
For non-Open Access articles published, all supplemental material carries a non-exclusive license, and permission requests for re-use of supplemental material or any part of supplemental material shall be sent directly to the copyright owner as specified in the copyright notice associated with the article.