
Abstract
The spread of COVID-19 pandemic provoked new policies and restrictions, which had an unprecedented impact on urban mobility and traffic on local and global scales. While changes in motorized traffic were investigated and monitored throughout the recent pandemic crisis in many cities around the world, not much was done on the changes in pedestrian street-traffic and walking patterns during this time. This study aims to identify, quantify, and analyze the changes in pedestrian traffic and walking patterns induced by COVID-19 policies. The “first wave” period of COVID-19 policies in Tel-Aviv, Israel, is used as a case study in this work. The analysis includes over 116 million pedestrian movement records documented by a network of 65 Bluetooth sensors, between 1.2.2020 and 26.7.2020, with a comparison to the equivalent time in 2019 that signifies “normal” pre-COVID-19 conditions. The results show clear correlation between the various COVID-19 policy restrictions and pedestrian count. The shifts to work-from-home and closure of businesses were highly correlated with changes in walking patterns during weekdays, while distinguishing changes in commercial and residential street segments. Nevertheless, while the restrictions dramatically influenced pedestrian movement volume and time of walking, it did not significantly change where people chose to walk, signifying the essentialness of attractive streets, parks and squares for citizens living in urban areas. This study shows how policy affects walking behavior in cities, demonstrating the potential of passive crowdsourced sensing technologies to provide urban planners and decision makers an efficient tool for monitoring and evaluating pedestrian infrastructure implementation in cities.
Keywords
Introduction
The spread of COVID-19 pandemic around the globe is one of the most impactful events of the 21st century. In early stages, as medical interventions were limited to treat the virus and a vaccine was yet to be developed, a variety of non-pharmaceutical policy decisions were applied by governments around the world. These varied from advisory recommendations to legal enforcements, such as social distancing, lockdowns, closure of educational institutes and businesses, bans on gatherings, restrictions on local and international travel—and more (Shakibaei et al., 2020). Among other profound impacts of these restrictions on all areas of life, the new policies have had an unprecedented effect on people’s mobility on local and global scales (Bian et al., 2021; Parady et al., 2020).
While changes in motorized traffic were investigated throughout the recent pandemic crisis in many cities around the world (De Haas et al., 2020; Parady et al., 2020; Shakibaei et al., 2020; Shamshiripour et al., 2020), research on changes in pedestrian street-traffic and walking patterns during this time is limited. Few studies explored the effect of the pandemic on physical activity in general, including—to some extent—on the walking activity (Ács et al., 2020; Alomari et al., 2020; Askarizad et al., 2021; Dunton et al., 2020). Yet, the investigation of the magnitude and spatio-temporal aspects of these changes on pedestrian traffic is still limited (Hunter et al., 2020).
This paper aims at scrutinizing the impact of COVID-19 pandemic policies on pedestrian traffic and walking patterns, addressing two main research questions: (1) How, and to what extent, did the COVID-19 policies influence pedestrian traffic volumes? (2) What changes have occurred in walking hours and spatial distribution of pedestrians during the time of policy restrictions? Accordingly, we identify, quantify, and analyze the changes in pedestrian movement during the “first wave” period of COVID-19 policies in Tel-Aviv, Israel. The underlying principle of this study is that governmental policies, aiming at controlling and limiting the spread of the virus, have significant impacts on urban mobility in general, and particularly on pedestrian mobility in the public realm. The analyzed dataset is consisted of more than 116 million pedestrian records, collected by a network of 65 Bluetooth (BT) sensors. The data was recorded between 1.2.2020 and 26.7.2020 and was compared to “normal” pre-COVID-19 conditions for the equivalent period in 2019.
An epochs division was performed according to the varying legal enforcements and policy decisions given by the Israeli government, and the results showed a prominent association between these and the pedestrian traffic (volume) and walking patterns (frequency peaks). Additionally, the spatial distribution of pedestrians in the study area was analyzed for each policy phase while identifying popular streets. Accordingly, we discuss the influence of policy on how many, when and where people walk in the city, and suggest that decision makers can use policy as a powerful tool to affect walking behavior. Moreover, this work illustrates the great potential of ubiquitous BT technology in monitoring pedestrians’ behavior and preferences and in supporting planning decisions.
Background
Research on pedestrian movement in the built environment is of growing interest in recent years, mainly due to increasing awareness of sustainability and health matters (Sharmin and Kamruzzaman, 2018). Studies in the field have used mostly surveys, manual observations, accelerometers, and pedometers to document walking (Ferrer and Ruiz, 2018; Kim et al., 2019; Mitra et al., 2015); however, these methods are limited in scale, time, and financial resources. The emergence of new technologies in recent years holds great potential for pedestrian documentation and research, yet relatively few studies have used crowedsourced data collection methods for pedestrian monitoring. For example, Bongiorno et al. (2019) used an activity-based mobile phone application to compare pedestrian and bicycling mobility patterns in Boston, US. The results of pedestrian traffic volume during the day showed frequency peaks at morning commute time, afternoon commute time, and at lunch time. Compared to cycling, pedestrian trips were found to be shorter, and mostly used to access locations in business and university districts. Similarly, Malleson et al. (2018) used a smartphone application to understand the asymmetry in pedestrian behavior and route choice in Boston, and showed a typical “9-to-5” working pattern with trip frequency peaks in the morning, at lunch, and again in the afternoon.
Moreover, Lee (2020) used hourly automated pedestrian count (PC) data of seven locations in New York City to analyze pedestrian walking patterns in the city. Unique patterns of foot traffic were associated with land use, development intensity, and the characteristics of the neighborhood. Additionally, different walking patterns, as well as pedestrian traffic volume, were found between weekday and weekend, indicating the divide between office and residential uses of the neighborhood. Finally, Salazar Miranda et al. (2020) used pedestrian trajectories obtained from GPS signals to construct a desirability index for streets in Boston. The study included an investigation of pedestrians’ willingness to deviate from their shortest path and found that desirable streets have better access to public amenities, have fewer complex facades, and have more diverse business establishments.
The technology used in this study for pedestrian monitoring is BT sensors. This technology has been vastly used for motorized-traffic monitoring in the past few years (Mercader and Haddad, 2019), while introducing advantages, such as the ability to collect large quantities of real-time data, the ease of sensor installation and privacy protection (Kurkcu and Ozbay, 2017; Lesani and Miranda-Moreno, 2019). However, only few studies used BT technology for pedestrian tracking, all in small-scale systems (comprised of several detectors), and often in areas with limited transportation modes (Lesani and Miranda-Moreno, 2019; Malinovskiy et al., 2012; Zhao et al., 2019).
The effect of COVID-19 pandemic on walking in urban spaces was investigated in recent studies, mostly evaluating the pandemic’s impact on physical activity in general (Dahlberg et al., 2020; Stockwell et al., 2021). These studies are usually based on survey data. For example, Dunton et al. (2020) used surveys and a built-in accelerometer application to observe early effects of the COVID-19 pandemic on physical activity locations and behaviors of 268 adults in the United States, during April to May 2020. The results showed a reduction in walking activity, ranging between 20.7% and 45.7%, during the mentioned period; still, the researchers observed an increase in steps count by people who were active on the roads in their neighborhood or at parks/trails. Another study, by Alomari et al. (2020), surveyed changes in physical activity and sedentary behavior induced by COVID-19 lockdown among 1844 participants in Jordan, and found similar results, as the majority of the participants reported a “decrease” in walking, jogging, and sports during April and May 2020. Changes in physical activity due to COVID-19 pandemic were also examined by observing the activity of 827 university students in Hungary, by Ács et al. (2020), who found a reduction in reported physical activity during April and May 2020.
Various studies have investigated COVID-19 impact on travel behavior in general (Yabe et al., 2020), and more often specifically on car and public transportation usage. When compared to pre-COVID-19 period, car usage was reported with remarkable reductions in many cities around the world, as some cities experienced declines of over 80% (e.g. Milan, Rome, Barcelona, Madrid, Paris) and around 70% (e.g. Moscow, New York, London, Boston, Lisbon) in car traffic in March 2020 (Shakibaei et al., 2020). Others, for example, Australian cities, experienced 35% drop in car use (Beck and Hensher, 2020). A similar trend was reported in public transport use. Jenelius and Cebecauer (2020), for example, found 40%–60% decrease in public transport ridership in three regions of Sweden, based on ticket validation data, during spring 2020. In Budapest, Hungary, public transportation ridership was reported with 80% reduction during the time of mobility restrictions (Bucsky, 2020). Moreover, a substantial decline of ∼90% in public transport usage was observed across many European countries, such as the Netherlands (De Haas et al., 2020), France and Italy (Falchetta and Noussan, 2020), with some variations across cities.
A different trend was reported on cycling during the pandemic. Jenelius and Cebecauer (2020), for example, found no clear decline in bike flows in Sweden during the COVID-19 pandemic (compared with the previous year), and even an increase in Stockholm’s outer city. Similarly, Bucsky (2020) reported only 2% reduction in bike sharing demand in Budapest, with a 23% decrease in cycling.
Little research was done on the effect of COVID-19 pandemic specifically on pedestrian traffic and walking patterns, yet few studies observed pedestrian movement in small-scale areas with a limited data sample. One example is Askarizad et al. (2021), who counted (using the gate count method) pedestrians in seven locations of urban public spaces in Rasht, Iran, before and after the onset of COVID-19, and showed no significant difference between people’s use of urban spaces. At a larger scale, a study by Hunter et al. (2020) investigated walking patterns of users using their mobile devices in 10 metropolitan areas in the United States before, during and after the lockdown policy. Declines at a rate of ∼30% in the number of walks were found, as well as changes in the common walking patterns.
Methodology
Study area and data
The study area is situated in Tel-Aviv, the second largest city in Israel, with over 450,000 citizens (Tel Aviv-Jaffa Municipality, 2019). The city constitutes an important financial, cultural, and commercial hub and the center of the largest metropolitan area in Israel (Reznik et al., 2019). The study area (Figure 1), approximately an area of 10 sq km, is part of the central district of the city, bordered by Rokah boulevard and Shai Agnon st. in the north, Shaul Hamelech st. and Frishman st. in the south, Ayalon road in the east and Hayarkon st. in the west. Study area—left: general location of Tel-Aviv city center; right: the 65 Bluetooth sensors and 77 operating network links (street segments).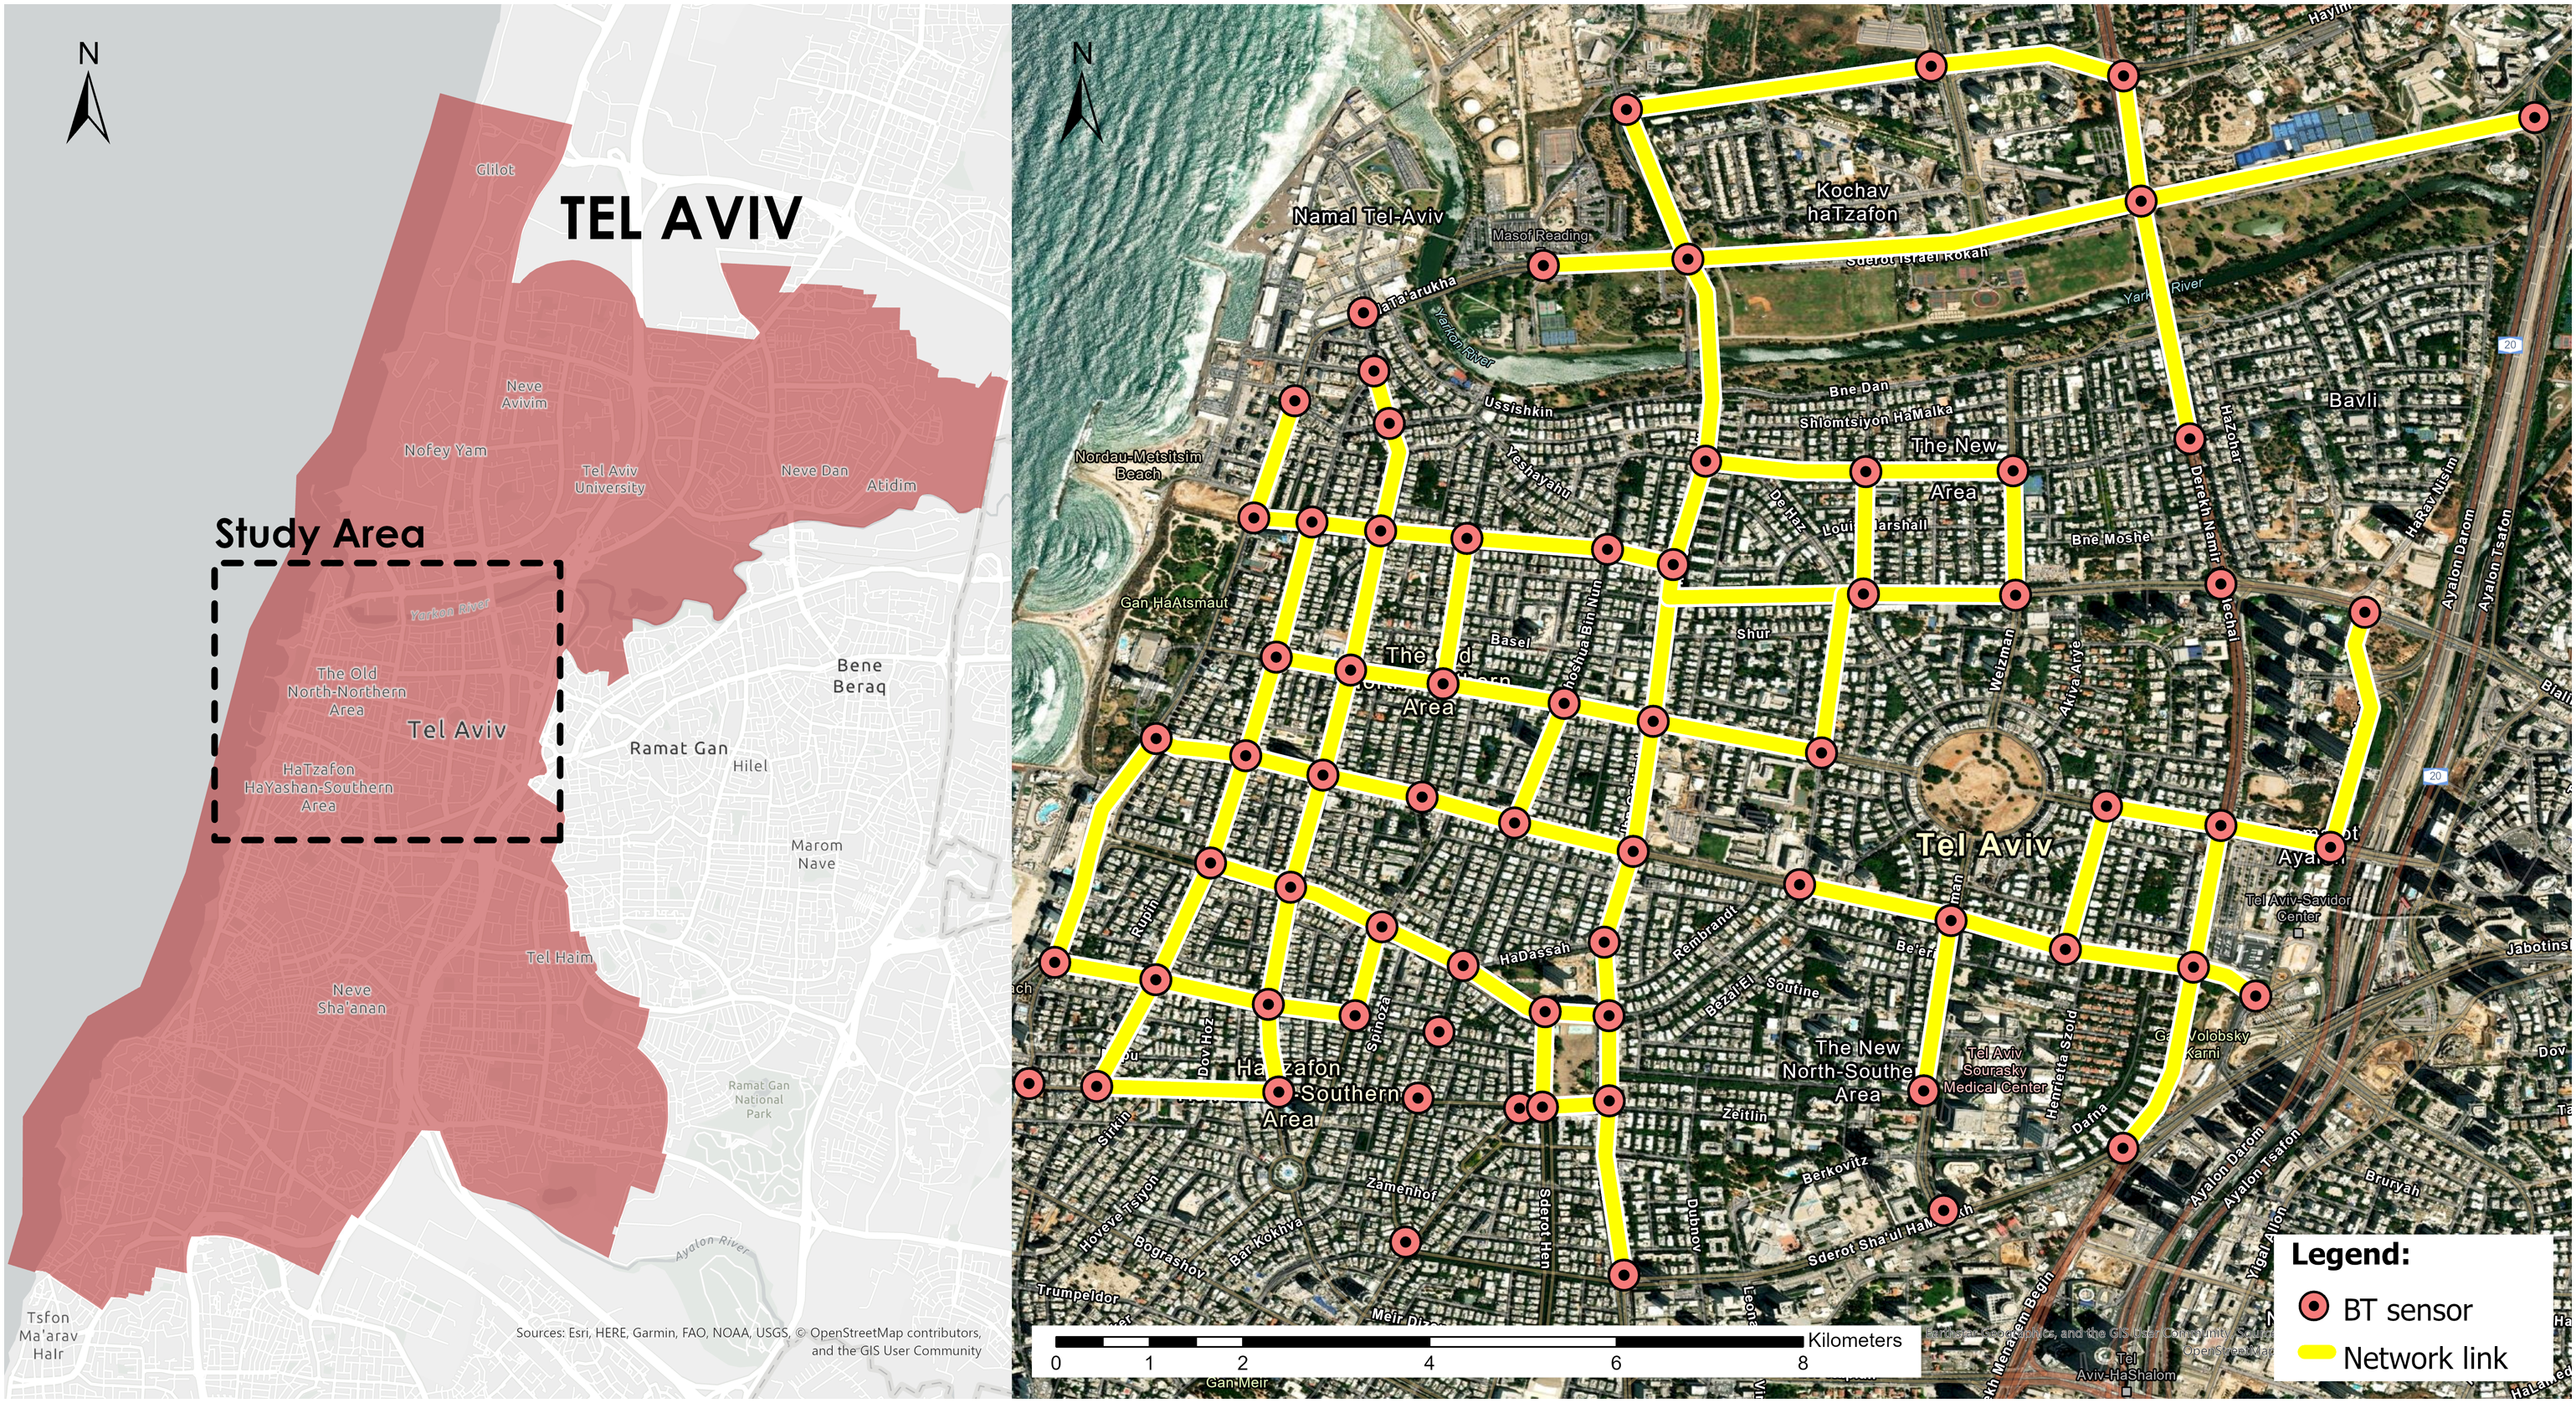
The BT network used in this research consists of 65 BT sensors, placed at fixed locations at road intersections in the study area. The sensors record and monitor encrypted BT Media-Access-Control (MAC) addresses (sent from mobile phones, headsets, etc.) 24\h a day on 77 street segments, referred to as network “links.” Data were collected from 1.2.2020 to 26.7.2020 and for the equivalent time in 2019 (1.2.2019–30.7.2019); the latter is used for baseline comparison to “normal” pre-COVID-19 conditions.
Pedestrian classification
The raw data file recorded by the BT sensors contains travel time information of all BT users traversing the street. To identify pedestrians and filter all other transportation modes, a classification algorithm was applied, which showed high accuracy rate of 89% in classifying pedestrian movement across the BT network. The classification algorithm relies on the statistical approximation of velocity values, and includes these stages: 1. System calibration: The detection range and direction for each sensor in the system is different and changes; hence, the active length (traveled distance) between two adjacent sensors cannot be accurately determined. To overcome this, we established an Effective Link Length (ELL) calculation for all network links, by performing a one-time system calibration. This included walking and driving passes (measurements) on the different network links, while collecting GNSS data, compared with the time stamp (TS) data recorded by the BT sensor system. Accordingly, the traveled distance between adjacent sensors was calculated, resulting in average and standard deviation (STD) ELL values for each link, later used for the calculation of traveling velocity values. 2. Effective travel time calculation: For calculating the traveler’s travel time, that is, considering movement time on the link while minimizing wait (stop) time near intersections, we used two TSs recorded by the adjacent sensors: TS of leaving the sensor detection range of one intersection (i) and TS of arriving to the sensor detection range of the adjacent intersection (j) (see equation (1)). 3. Classification by velocity: For each record, we calculate the velocity and its STD value as a function of the corresponding ELL (see section 1-) and TS—according to the error propagation law
1
. Moreover, we considered an error size, which was subtracted from the calculated velocity. The error size is defined by the velocity’s STD value multiplied by a constant parameter (defined as k). Accordingly, the velocity range calculated is (velocity-(STD*k), velocity). After calculating the record’s velocity range, we classified it according to the presumable velocity of pedestrians. Based on the vast literature on travel mode classification (Fitzpatrick et al., 2007; Pinna and Murrau, 2018; Zhang et al., 2012; Zheng et al., 2016), we used the value of 1.5 m/s as the maximum traveling speed of pedestrians. 4. Traffic jam probability: Finally, to avoid bias resulting from slow-moving vehicles in traffic jams wrongly classified as pedestrians, we removed records with low velocity value with the probability of vehicular traffic.

An example of hourly calculated PC value on several links between 00:00 a.m. and 10:00 a.m. on 02.03.2020.
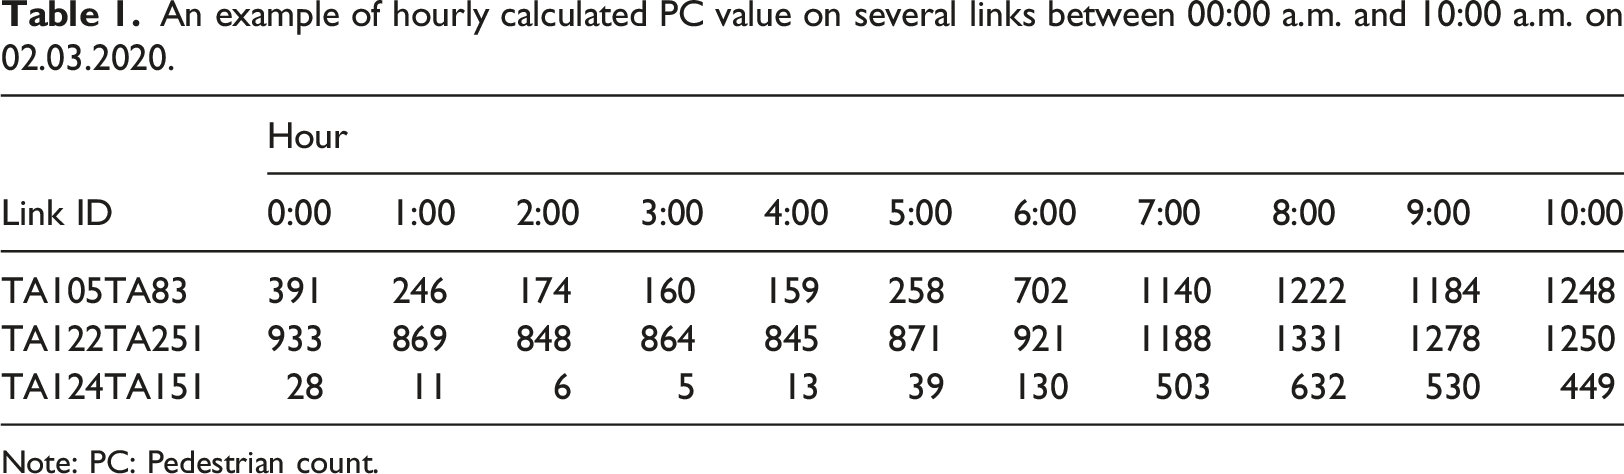
Note: PC: Pedestrian count.
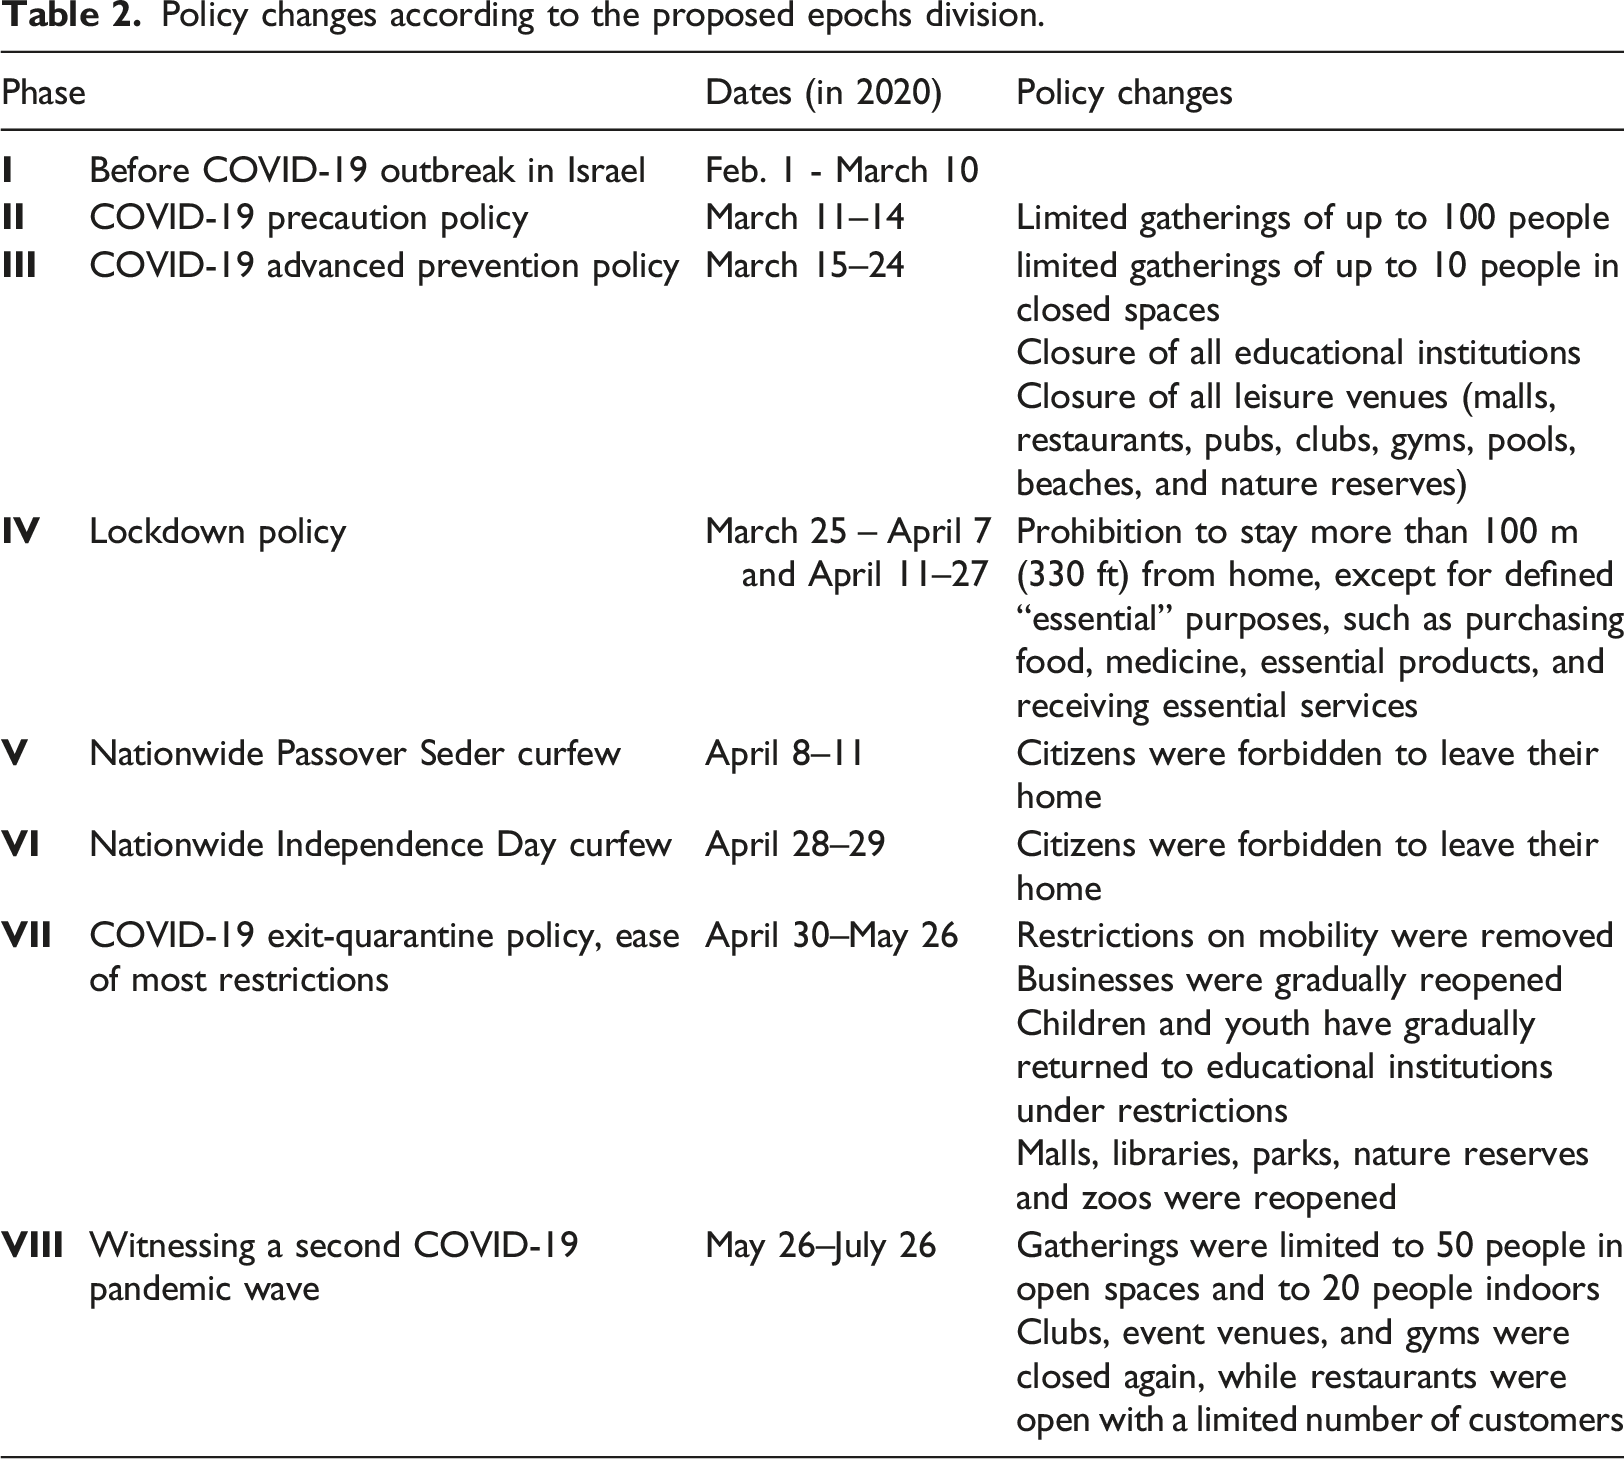
Epochs division
Policy changes according to the proposed epochs division.
Data analysis
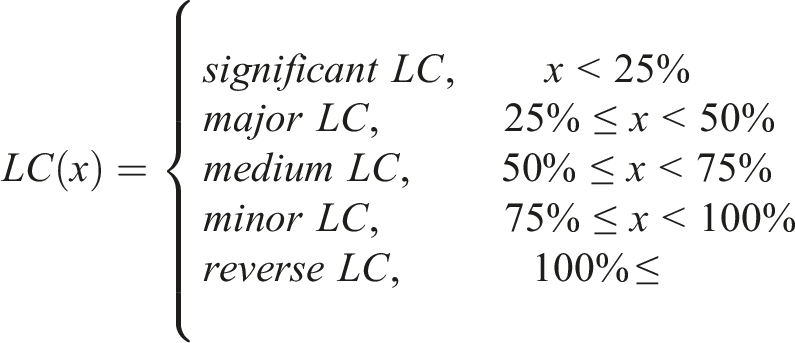
The analysis focuses on: 1. Finding correlations between COVID-19 restriction policies and PCs by examining the daily average PC over the predefined periods for each network link and for the entire study area. In addition, we compare the resulting values to the equivalent period in the previous year prior to the COVID-19 onset. This is also perceived by defining five Level(s) of Change (LC) in PC, which represents the ratio (in percentage) between PCs in the observed period and those in the equivalent period (equation (2)): 2. Studying the different walking patterns by calculating separately for each link the average PC and LC values per hour and per restriction policy phase. Particularly, we aim to highlight the differences between commercial and residential links due to policy changes. We expect to find more significant changes in commercial links (compared with residential links) during the lockdown policy, as businesses were closed during that time, and maybe even a reverse LC in some residential links when movement was restricted to 100 m from home. The definition of a “commercial street” appears in previous studies mostly as a street designed primarily for commercial uses. For example, Li (2014) defined it as “where the space and buildings on the street are mainly for commercial uses”; Fan (2016) defined a commercial street as “a major street with commercial activities for a long time”; more recently, Young Hong and Yong Jeon (2020) used a definition of a street that is “primarily composed of retail stores and restaurants.” For analysis purposes, we chose to define links with active businesses covering 50% and more of its street facade as “commercial”, whereas the rest are classified as “residential”. Finally, the Mann–Whitney U test is used to determine whether there is a statistical significance between commercial and residential links in relation to the LC and PC values.

Results and discussion
Study area analysis
A total of 116,107,592 pedestrian records were classified and analyzed in the network for the defined phases. Figure 2(a)–(h) shows the calculated average PC values identified per network link in the study area according to the eight phases—2020 compared to the equivalent time in 2019—distinguishing between weekdays and weekends. LC values are given for each phase. (a–h). Daily average pedestrian count per network link in the study area, according to the eight analyzed policy phases in 2020 and 2019.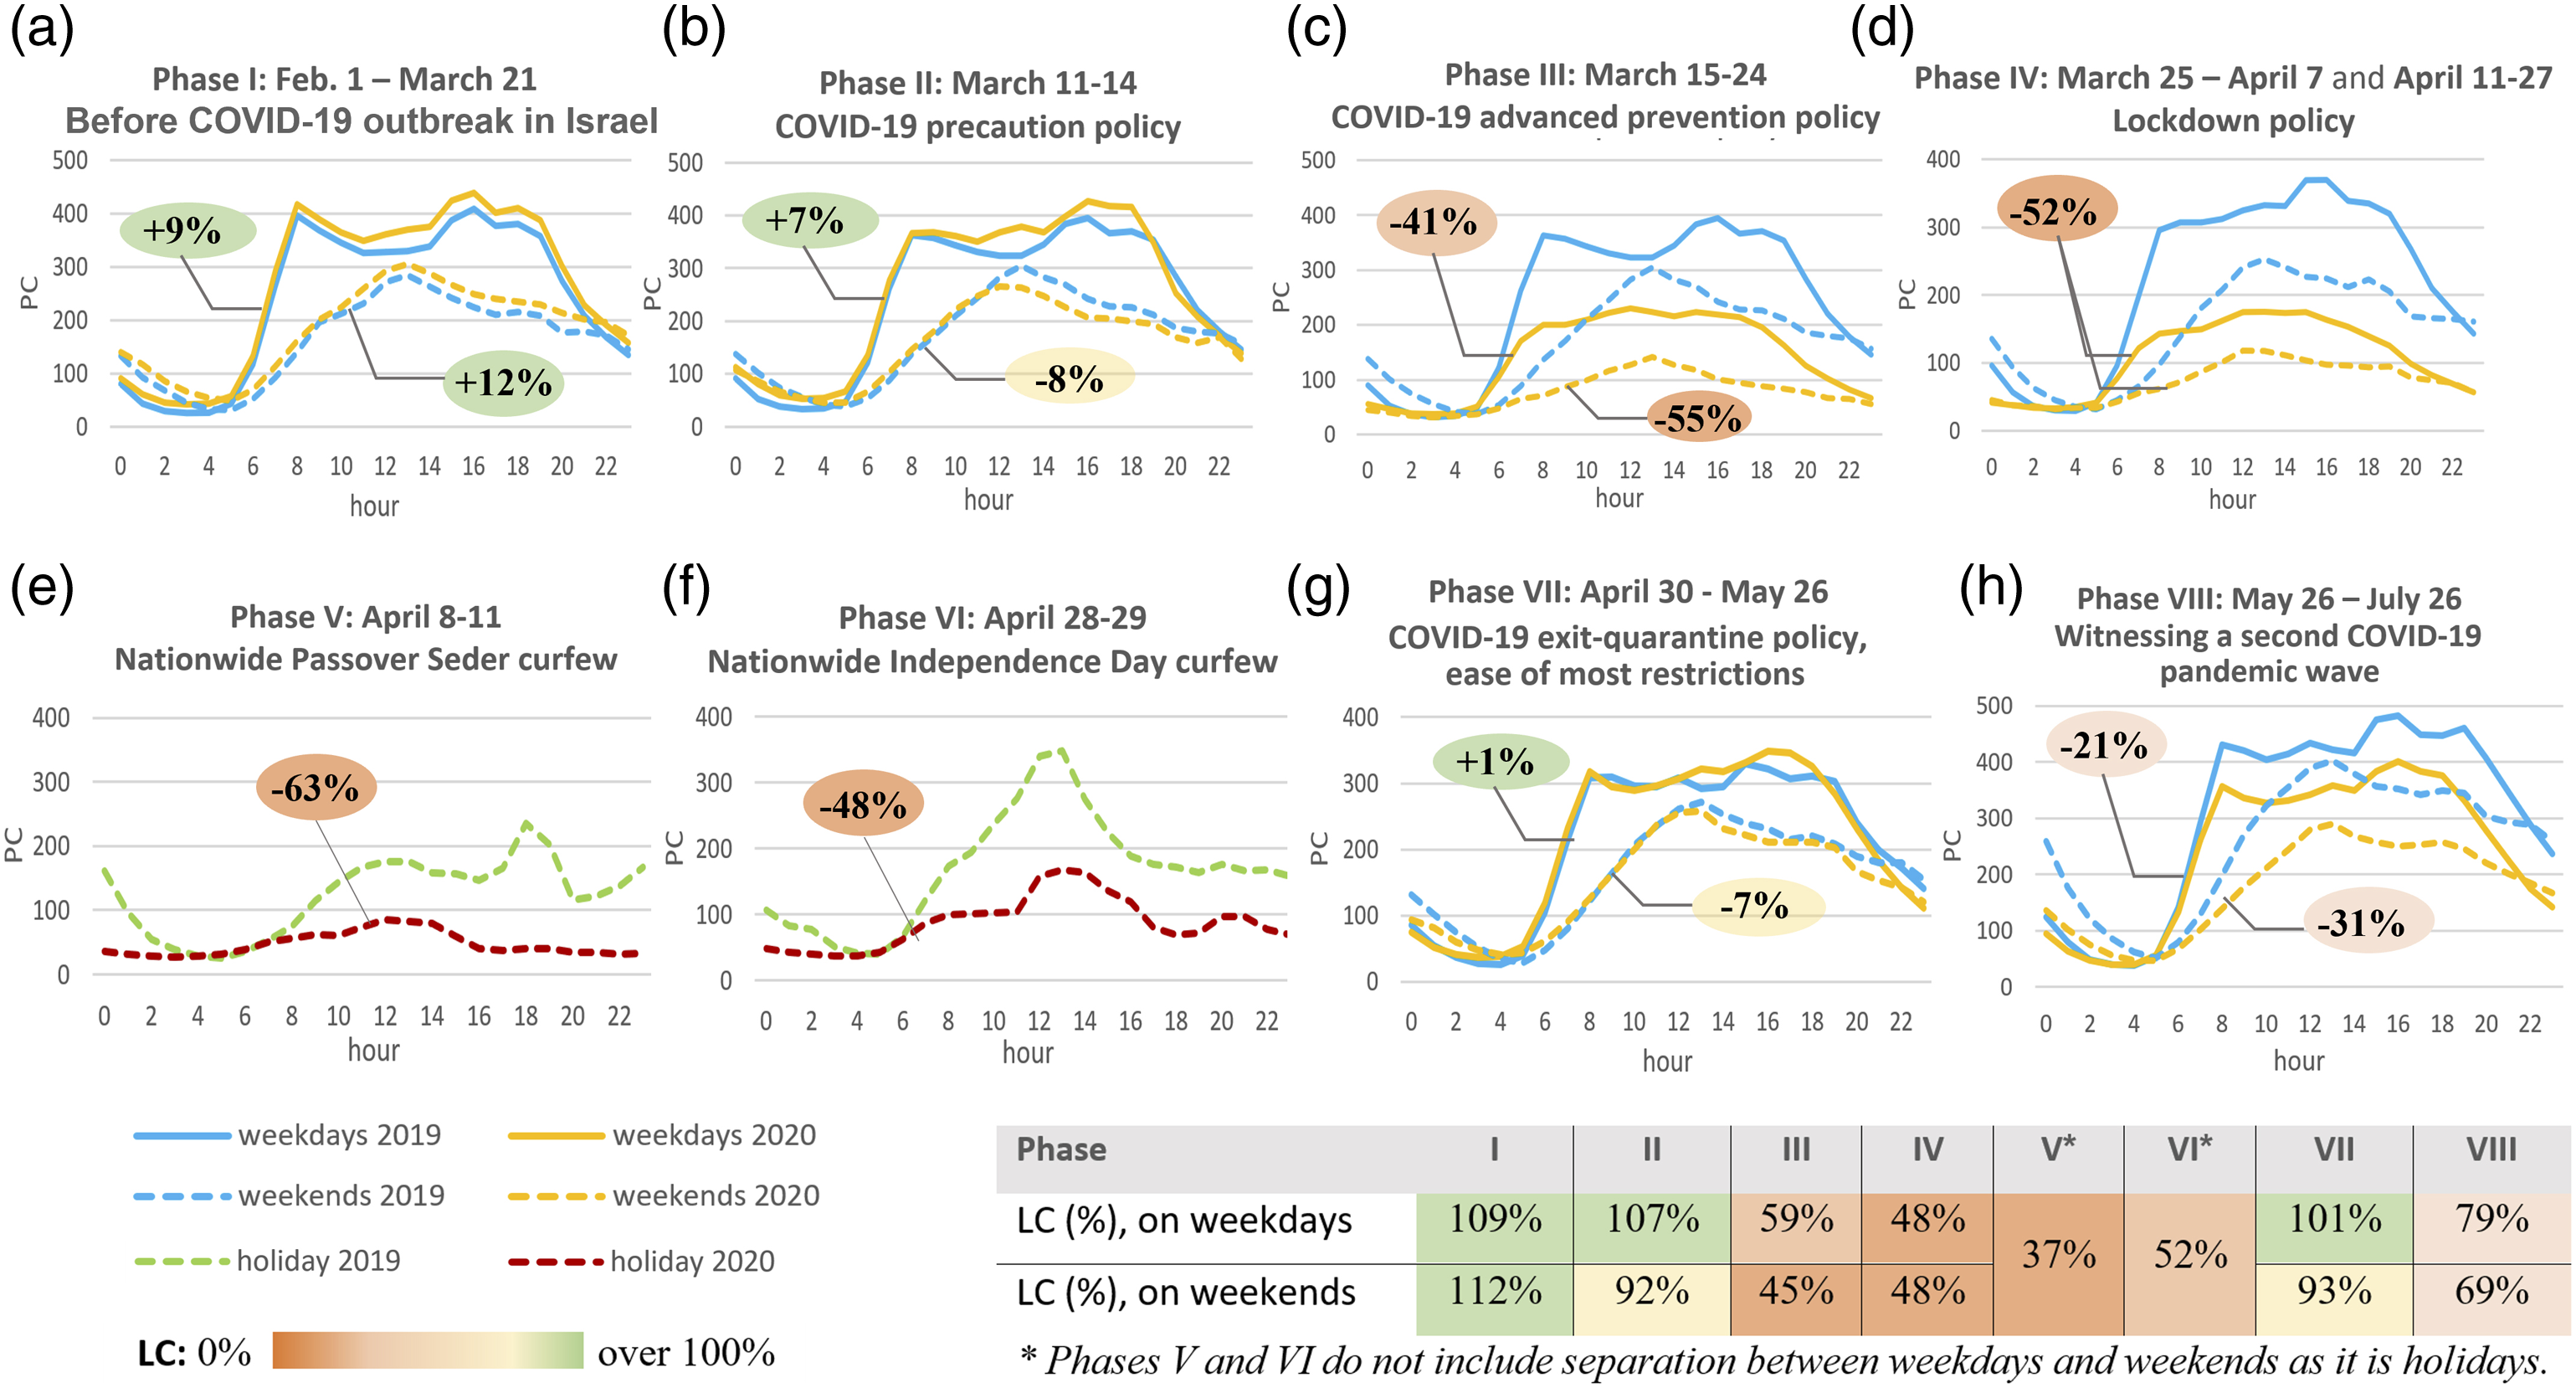
Pedestrian count
According to the Tel-Aviv census of 2021, the population change in Tel-Aviv in 2020 compared to 2019 was less than 0.7% 2 , mostly attributed to natural reproduction. Moreover, no new residence projects and industrial and commercial complexes were built during this period in the study area. Thus, we presume that there is no evident population change in terms of residents and travel to work. In relation to age distribution of smartphone users, according to the Israeli census, Israel shows similar values to North American and European countries, where there is a bias toward younger ages: in 2019, under the age of 64, 84–90% own a smartphone and above 65 this value is reduced to 73% 3 , while in 2020, these values are 90% and 82% 4 , respectively, showing an evident increase of smartphone usage for ages 65 and up. All other demographics, for example, gender and education, show similar smartphone usage.
The graphs in Figure 2 show a clear association between the different COVID-19 restriction policies and PC values in the study area. Before the initialization of the pandemic in Israel (phase I, Figure 2(a)), compared to 2019, the PC has increased by 9% and 12% during weekdays and weekends, respectively. We assume the increase in PC value is associated with the growing number of pedestrians who use BT-enabled devices over the course of the year, which is also age associated (more ages 65 and up who use smartphones); in general, we characterize changes of less than 10% as negligible. When the first restrictions are enforced (phase II, Figure 2(b)), there is still no discernible change in PC values during weekdays; however, a slight decrease of 8% on average during the weekends exists when compared to 2019. In the following time-period (phase III, Figure 2(c)), as an advanced prevention policy was enforced, a significant decrease in PC value is evident: 41% decrease over weekdays and 55% decrease over the weekends. Over a week, the daily average of PCs on weekdays has reduced to almost half. Pedestrian count values (hourly average for network link) in the study area, from 1.2.20 to 26.7.20 (weekdays).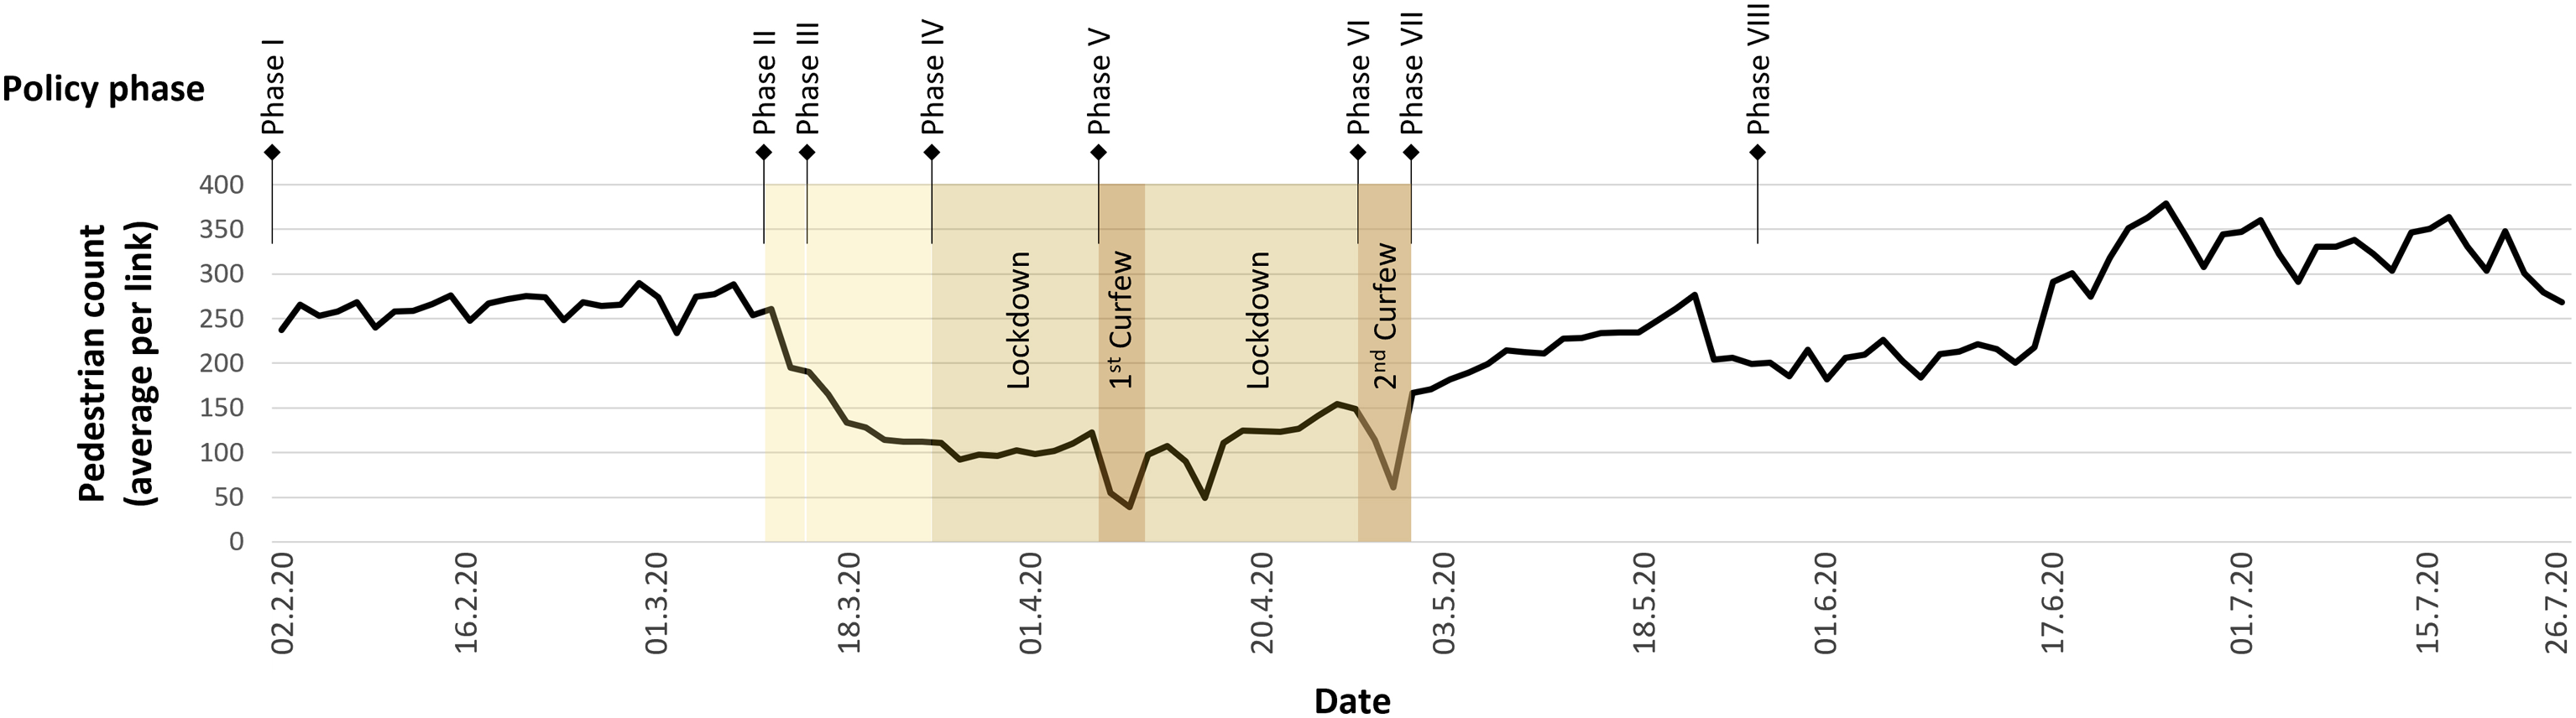
Pedestrian count continued to decrease (52% over weekdays and weekends) in the following period (phase IV, Figure 2(d)), as all citizens were prohibited to stay more than 100 m away from their homes. In the middle of this period (phase V, Figure 2(e)), a nationwide curfew was enforced, with the aim of minimizing potential gatherings during the Passover holiday. During the curfew, a decrease of 63% in PC is observed, when compared to 2019. Moreover, while in the previous year a significant increase in PC was observed in the evening hours, as this is the time of gathering for the big “Seder”—feast of Passover, in 2020, the results show no change in PC at this time-of-day. This corresponds with the fact that, due to the curfew policy, families were not able to gather and celebrate the holiday together as they normally do every year. A second curfew was imposed during Israel’s Independence Day (phase VI, Figure 2(f)) and the PC resulted in a 48% decrease when compared to 2019. We suspect that the difference in counts between the two curfews is to some extent derived by the significant change in new positive patients in Israel during the first curfew (338–359 cases per day), compared with the time of the second curfew (82–160 cases per day 5 ). Accordingly, it is possible that stress among the public was lessened as the number of newly verified patients decreased, allowing people to feel more confident to wonder the streets.
In the following period (phase VII, Figure 2(g)), while restrictions were gradually removed, the results show a rapid increase in PC values to the ones in 2019, although still not as the values evident in phase I. Subsequently, Israel started to witness a second wave of the pandemic, as the number of verified COVID-19 patients increased again, and the government decided to impose new restrictions. Accordingly, in the next 2 months (phase VIII, Figure 2(h)), we observe once again a decrease in PC: 21% decrease during weekdays and 31% during the weekends, compared to 2019. This might indicate that despite the improved situation of controlling the virus spread at that time, the societal impact of the pandemic was evident as people were more concerned, restricting their mobility due to the “new reality” conditions.
Figure 3 shows the PC values in the study area (hourly average per network link) during weekdays for all eight analyzed phases. It is evident that as restrictions instituted (from Phase II), a significant decline in PC occurred, with further ongoing decrease during the curfews. During ease of most restrictions and the exit-quarantine policy, PC values increased; however, while it seems as there was a major increase in PC toward July, we note that it is lower than the PC in the equivalent time of 2019 (see Figure 2(h)), meaning that the numbers do not resume their original values of before the pandemic spread in the previous year corresponding to the summer time, which to some extent might show tourism activity in 2019 that is missing in 2020.
Compared with other transport modes in Israel, our results show a similar trend to car traffic reduction during the lockdown policy. For example, in Ayalon Road, which is the busiest highway in Israel, car traffic was minimized by 60% during the lockdown policy 6 . Larger decreases were reported in public transportation usage in Israel, as according to Hopon 7 company’s data, the usage during the lockdown minimized by 83%; however, it should be emphasized that during that time public transportation services operated in only 25% capacity. A different trend was reported during the first curfew policy, as Netivei Israel company reported a remarkable drop of 99% in road traffic across 8500 km of intercity roads 8 . During that time, police forces set up checkpoints between cities to prevent residents from moving between localities. To the best of our knowledge, changes in cyclist traffic during that time in Israel were not reported.
Our results show substantial reductions in PC compared with U.S. cities. Hunter et al. (2020) studied walking patterns in 10 metropolitan areas in the US and reported the largest reductions in Miami (−33.7%), Los Angeles (−33.3%), New York (−25.1%), and San Francisco (−24.8%), whereas we found reductions at a rate of almost twice in Tel-Aviv. The significant difference in numbers might be related to—among others—the different policies enforced at each city, as well as the concern among the public across diverse cultures. Previous studies that were based on self-reports reported small reductions in walking activity (e.g., De Haas et al., 2020) or general reductions without a quantitative measure (e.g., Alomari et al., 2020), while our work provides empirical evidence of pedestrian movement revealing substantial reductions of more than 60% in PC. Moreover, by dividing and distinguishing data over the different policy phases, this study enables witnessing changes at micro-level and observe its effectiveness on walking mode of travel.
Walking patterns
The patterns of pedestrian traffic can provide insights into how people use streets. One prominent observation found in the results is that walking patterns in the study area were significantly affected by the quarantine policy during COVID-19 pandemic. In 2019 (“normal” times), two distinct walking patterns are seen during the day, depicted in Figure 4 (left). The first pattern, over the weekdays, is usually characterized by a curve with “two-peaks,” in which one peak occurs during the morning commute time and the second (a longer one) occurs in the evening commute time. The second pattern, over the weekends, is of a curve with “one-peak” at mid-day. As policy restrictions intensified, these two distinct patterns are almost undistinguishable and close to being identical, depicted in Figure 4 (right). More specifically, as the restrictions tightened, the walking pattern over weekdays gradually turned into a curve with “one-pick,” similar to the one on the weekends (see for example the graphs of phase IV in Figure 2(d)). A similar trend was found in (Hunter et al., 2020), who showed that at the time of policy restrictions most of the walking activity in U.S. cities during weekdays resembled that of weekends. During that time, education institutes in Israel were closed, and many workplaces shifted to work from home or sent employees to a non-paid vacation, making them registered as “unemployed.” This corresponds with the rate of unemployed citizens in the city that leaped from 2.66% in February to 21.61% in March and 25.24% in April 2020 (Data Gov, 2020). Finally, when most of the restrictions were removed, we observed a fast return to “regular” walking patterns (see Figure 2(h)). Walking patterns during the day (on average): before the quarantine policy (left) and during the quarantine policy (right).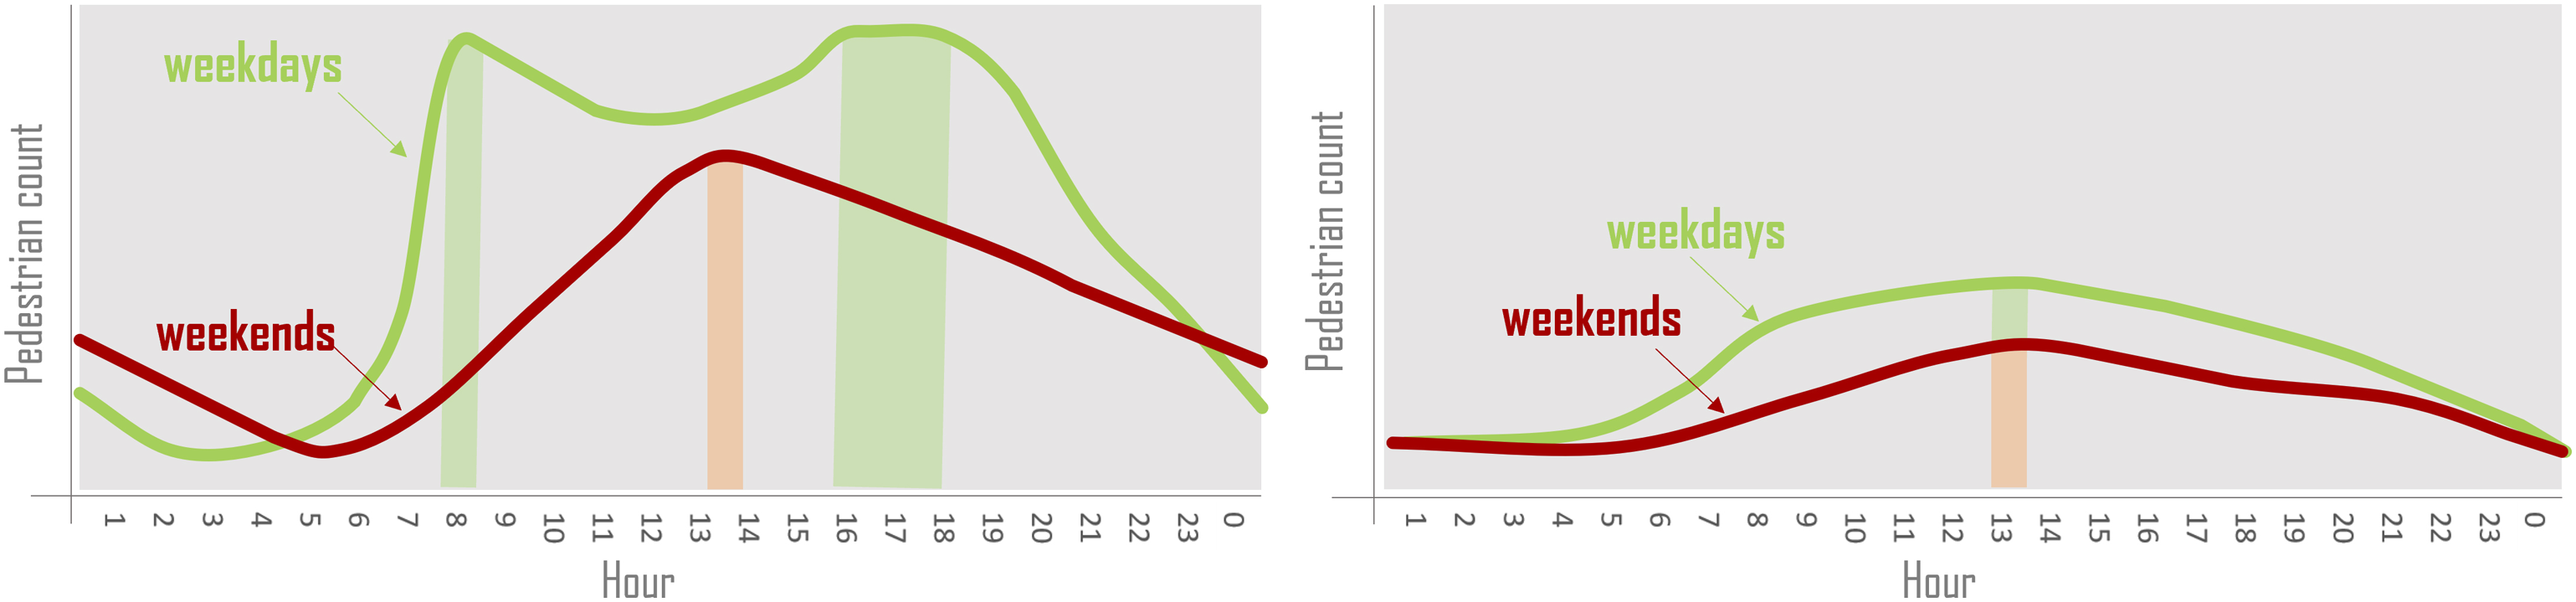
This observation indicates the significant and immediate impact of the policy restrictions on pedestrians’ traffic: not only in how many people walk the streets, but also in when they choose to walk them. The restrictions have logically modified the purposes behind people’s journeys, where education and work being the most prominent ones.
Street-level analysis
Following the study area-level analysis, PC was analyzed per link, shown in Figure 5
9
. The reduction in PC values is apparent in many links corresponding to the enforcement of new restrictions; however, some links maintain a relatively large PC value through all phases. Furthermore, when calculating for all phases the top 20 links with the largest PC values, we found that 15 of them appear in all, potentially pointing to these locations that continue to be highly attractive for pedestrians. These are mostly links that are within 200 m proximity to public open spaces (e.g., parks and squares) in the city. The most prominent example of such a place is Rabin Square
10
, an urban plaza surrounded by commercial facades with many eateries, which constitutes a space for leisure activities and gatherings. During policy enforcements, the number of pedestrians in the streets surrounding the plaza decreased; however, it remained large compared with other links in the study area, even though businesses around the plaza were closed during that time. This observation suggests that the plaza plays a significant role as an open and spacious public space in the heart of the city, which is within walking distance for many residents, allowing to meet other people and breathing “fresh air” while maintaining social distancing and adherence to the restrictions. Pedestrian count values during the different periods (hourly average during weekdays).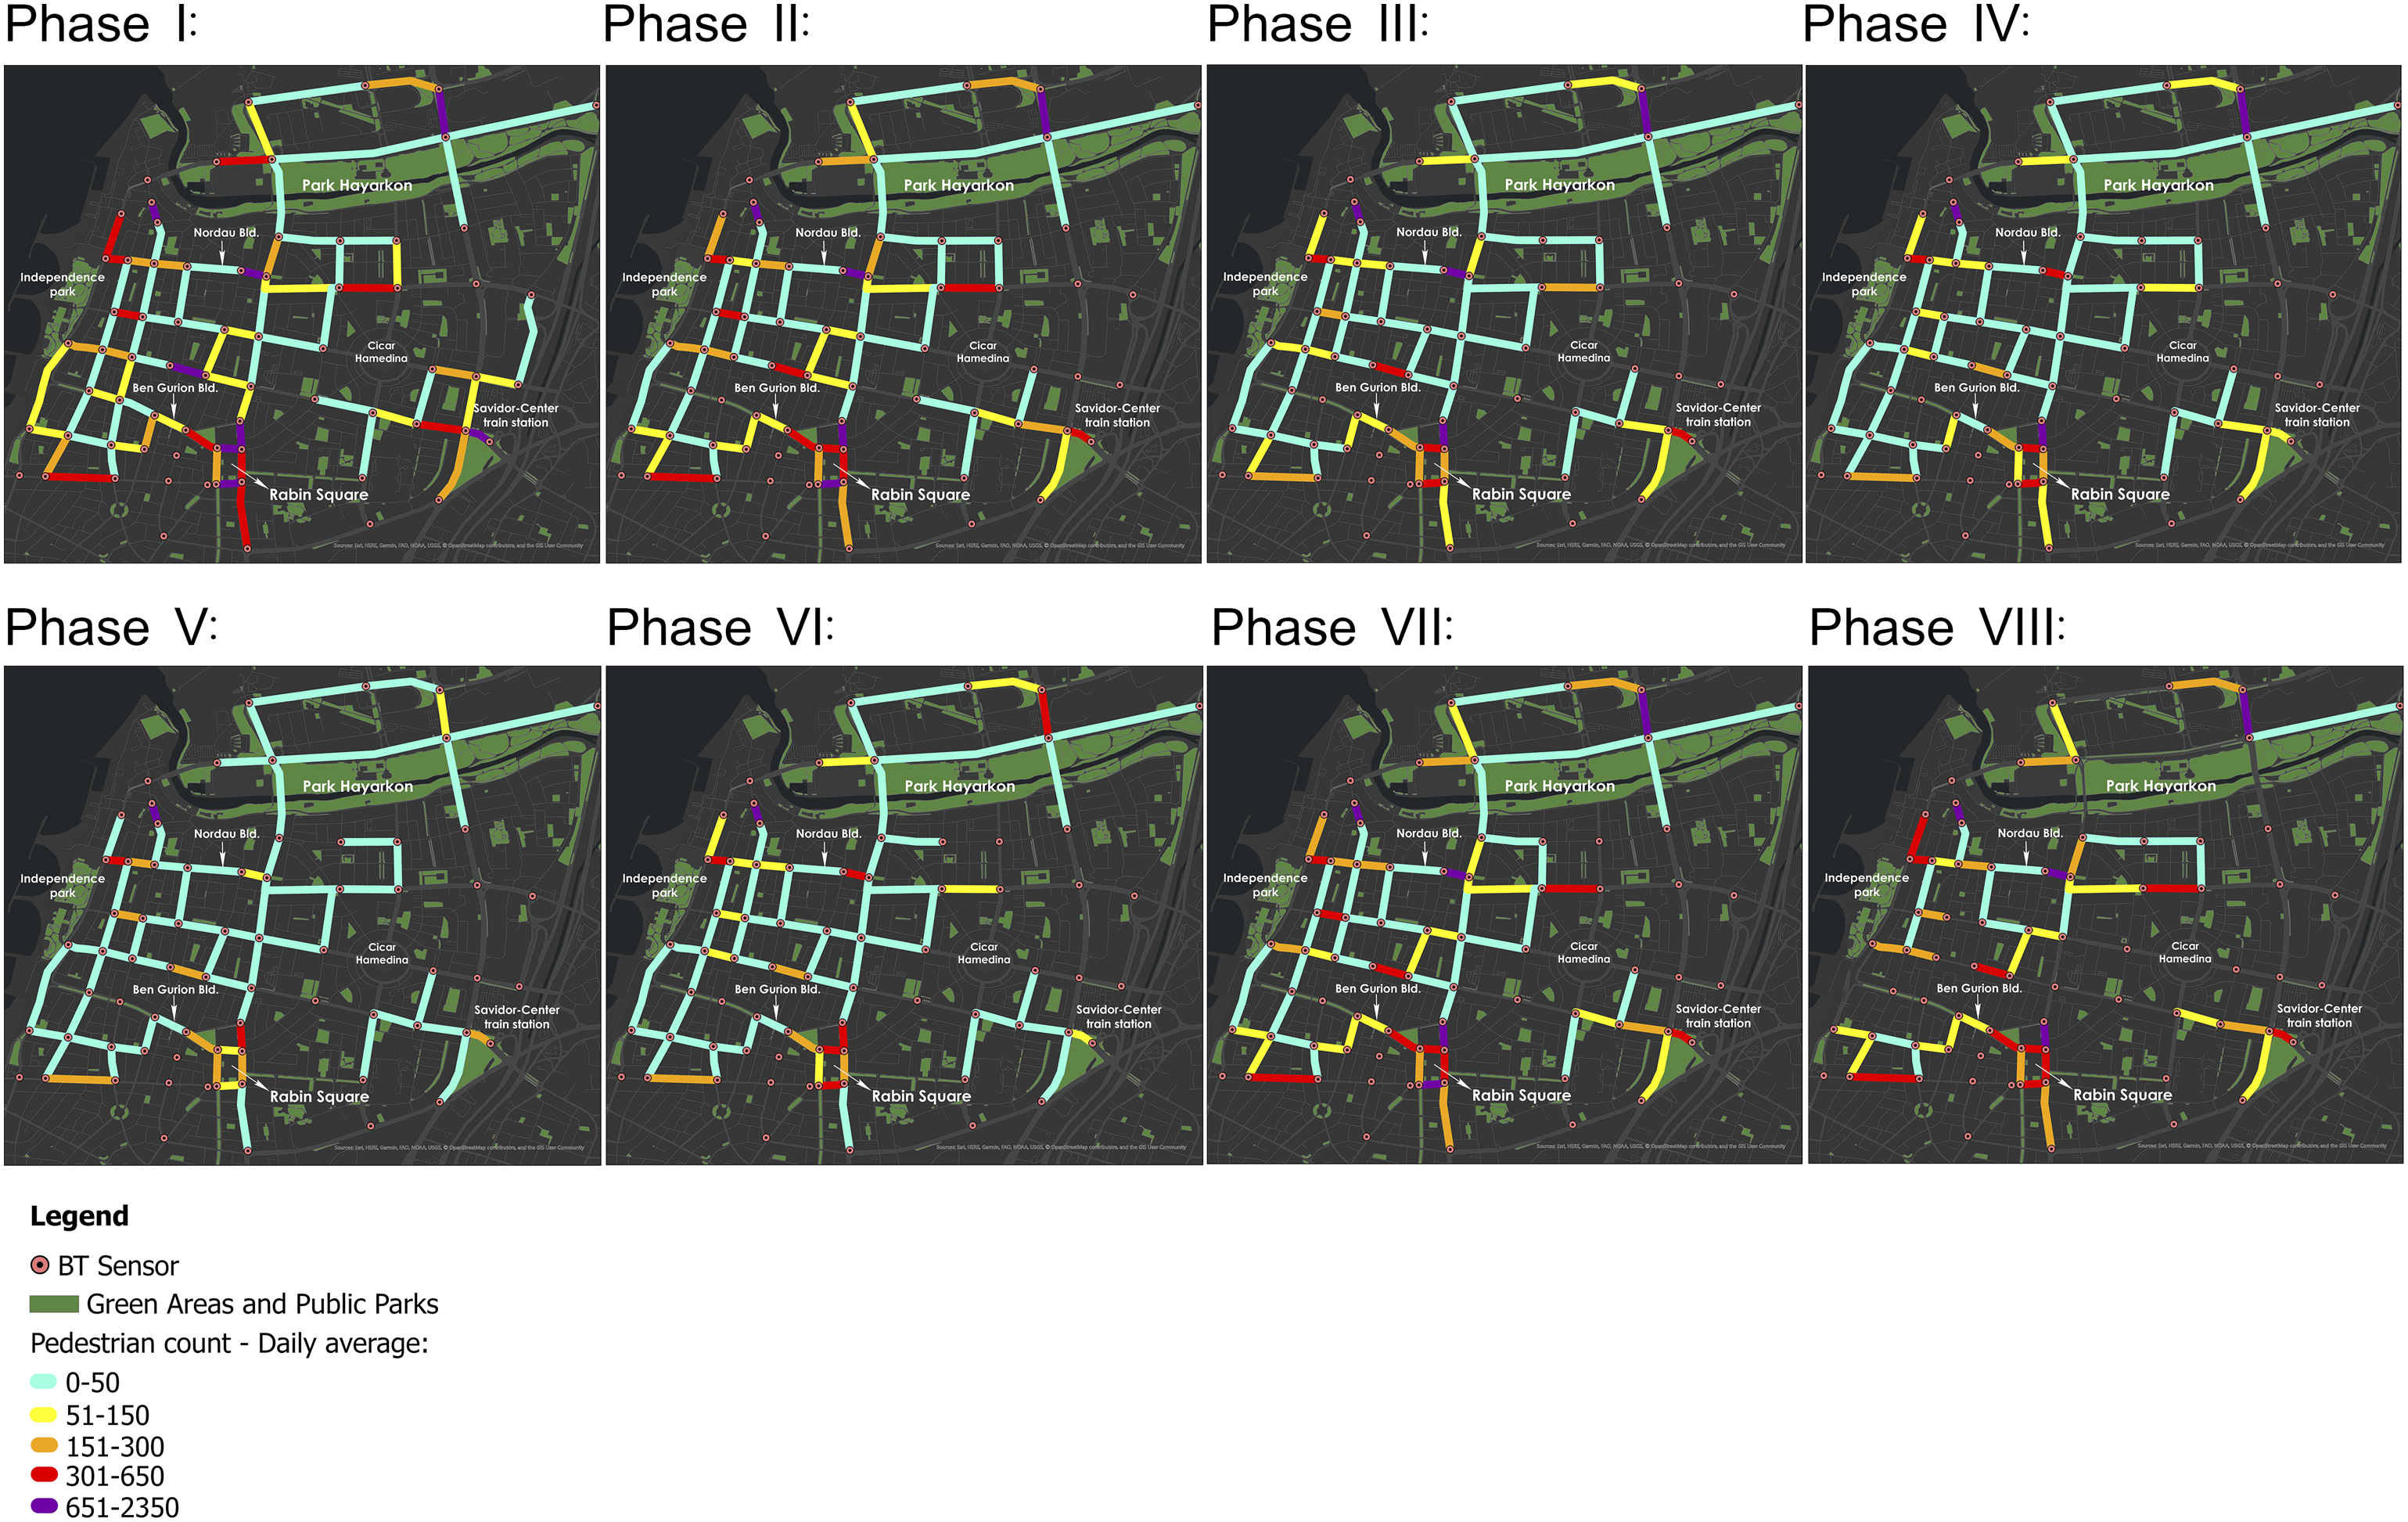
Accordingly, while the new restriction policy significantly influenced the volume of pedestrians and time they used the streets, it did not have the same impact on where they chose to walk, showing that policies aiming to avoid crowdedness did not seem to emanate even distributions of pedestrian traffic. This finding corresponds with existing literature suggesting that human mobility patterns and traffic distribution are mainly attributed to the underlying street network configuration (Jiang et al., 2009).
Figure 6(a) depicts the LC values per link during the lockdown policy (phase IV), showing that our expectation to find larger changes in PC in commercial links (compared with residential links) during this phase was partly realized. While close to 80% of the links with medium LC values on weekdays are residential, both commercial and residential links resulted with significant LC. Complementary to our expectation, two residential links were found with reverse LC. To statistically evaluate the difference in LC and PC between commercial and residential links, we used the Mann–Whitney U test and found no statistical significance at the p < 0.05 level (p = 0.37). Moreover, the test showed no statistical significance for all the other phases as well. LC values during phase IV on weekdays (a) and daily average of PC values per policy phase in commercial and residential links (b). *Commercial link = link with more than 50% of its façade is commercial. PC: Pedestrian count; LC: Level(s) of Change.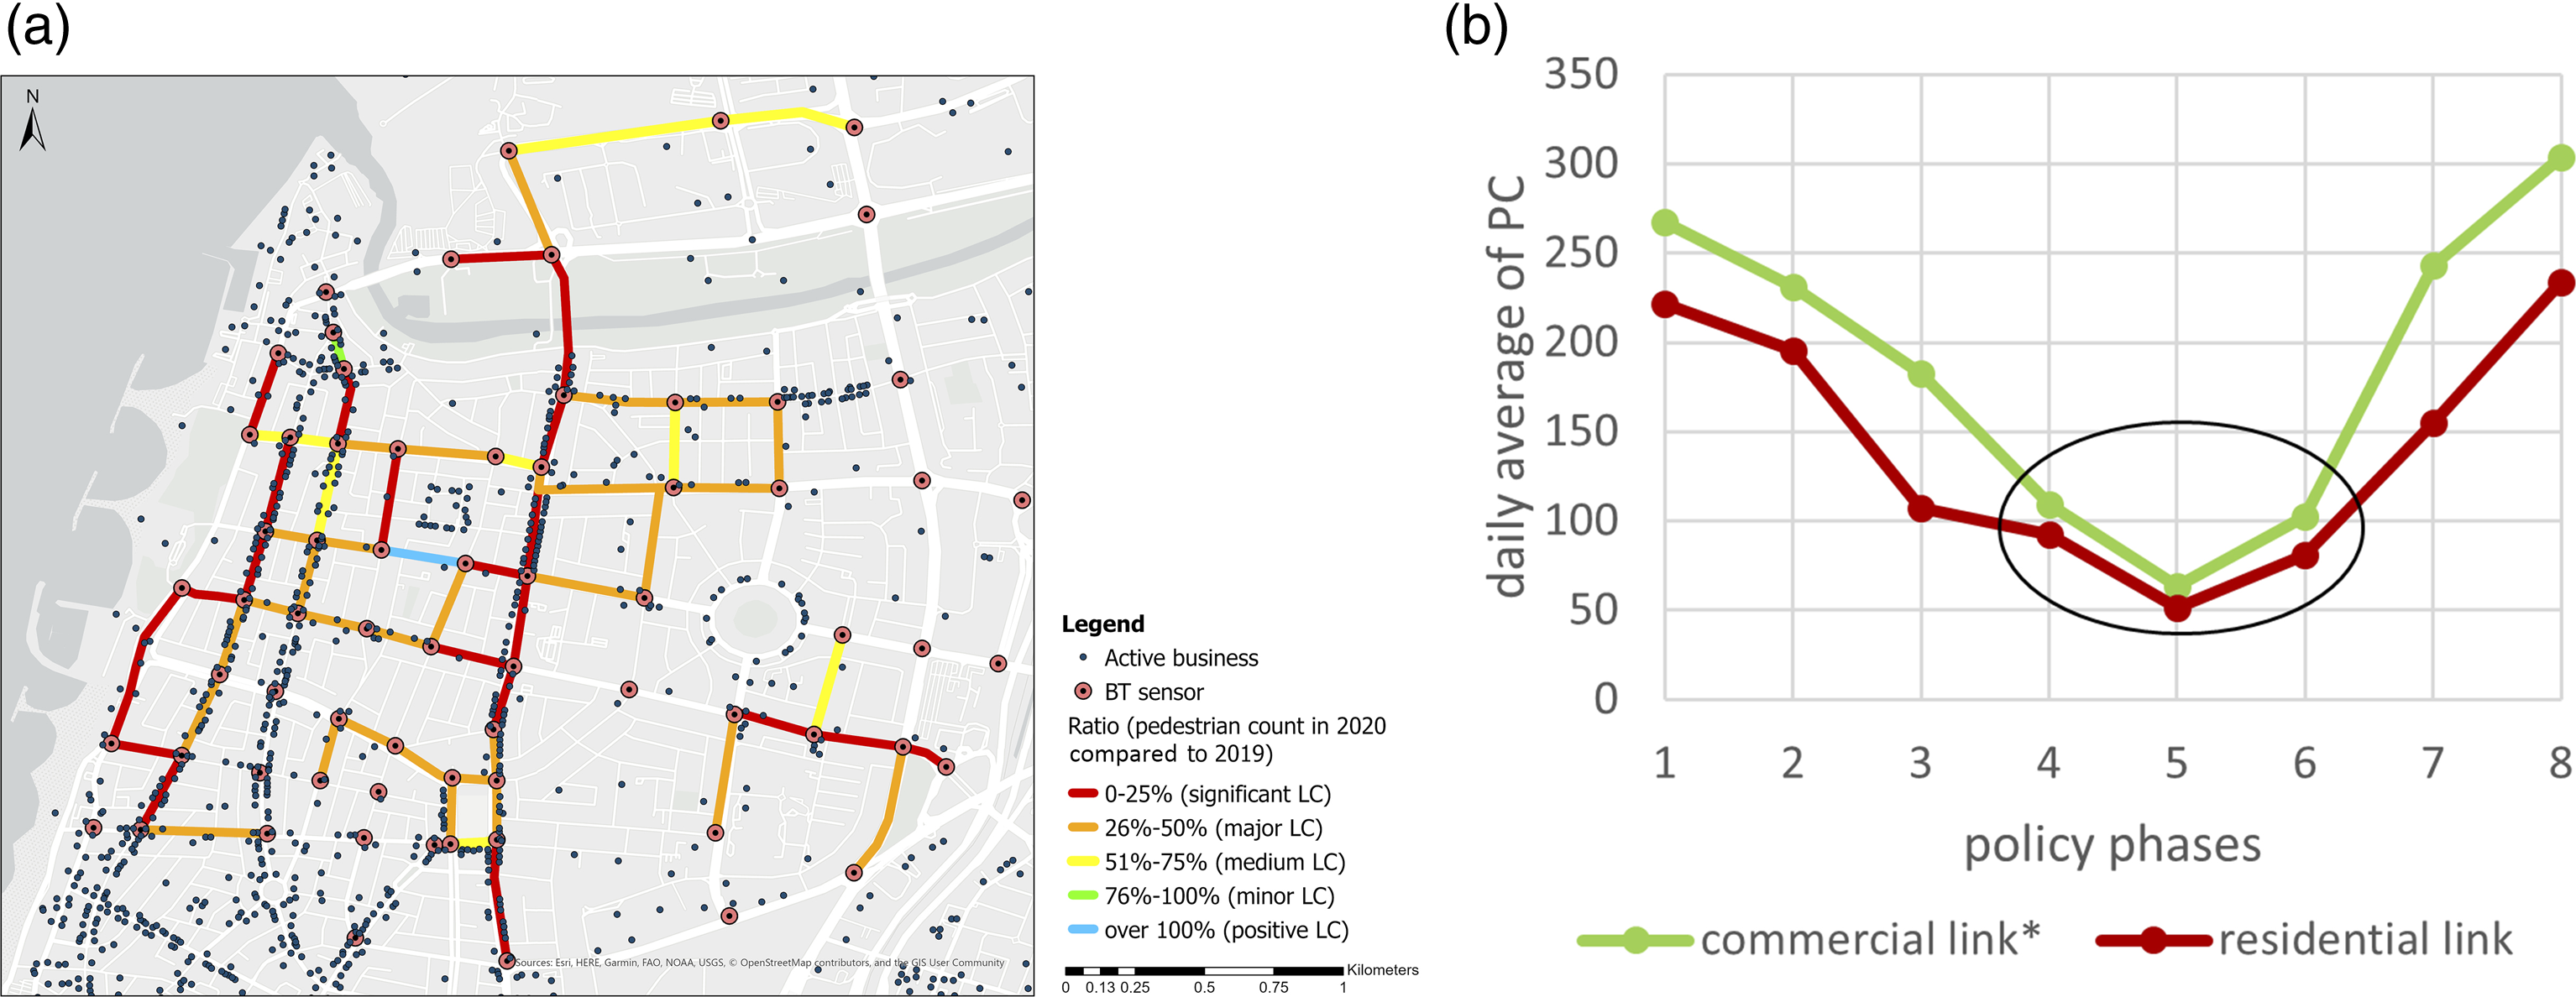
Nevertheless, PC values were found to be consistently higher in commercial links, compared with residential links, during all restriction policy phases (Figure 6(b)). Interestingly, the differences between the PC values in commercial and residential links were found to be insignificant during phases IV to VI, when the restrictions were most strict. In other words, while commercial links are regularly characterized by a larger number of pedestrians, when compared to residential links, the difference in counts between both street types minimized as the policy restrictions tightened, indicating the highest influence on PC values in commercial links during the lockdown policy.
The above might be explained by the fact that the streets in the study area are highly mixed land-use. Another reason might be that several commercial streets, such as Ibn-Gabirol and Ben-Yehuda, are artery links in the road network in the area, also serving as boulevards, and hence they were still used by pedestrians. Accordingly, while closure of businesses might reduce pedestrian traffic in commercial streets, a mobility distance restriction and navigation preferences might increase walking among these streets; therefore, it is difficult to determine what had a greater influence on the LC values.
Summary and conclusions
The spread of the COVID-19 pandemic provoked new policies and restrictions, which had an unprecedented impact on urban mobility and traffic on local and global scales. During the first wave of the virus spread in Israel, the Israeli government has pursued new policies, which included limited gatherings, travel distance restrictions, closure of businesses and leisure venues, lockdown, curfews—and more. This study investigated the impact of these policies on pedestrian street traffic and walking patterns in Tel-Aviv, while using over 116 million records of pedestrian movement recorded by BT sensor technology.
The first part of this work included a division to eight key policy phases that should have diverse effects on pedestrian movement. In the second part of this work, pedestrian traffic data and walking patterns were analyzed for each policy phase, both at area and street levels. The results showed a considerable impact of the COVID-19 policies on PC and walking patterns. Significant reductions in PC, ranging between 41% and 63%, were observed as the policy restrictions acted and tightened, together with a “recovery” in PC as soon as restrictions were removed. These prove that restriction policies were followed by the public, showing high correlation between the restriction type and the volume of pedestrian traffic.
A notable change in the walking pattern was observed during the weekdays, which transformed to behave similarly to weekends—from two evident daily peaks to one, meaning that pedestrians changed their common daily activity. Interestingly, while the policy affected walking volumes and patterns, it did not change the preferable locations of walking in the study area. Attractive streets, mainly around parks and squares, remained popular in relation to other links in the study area, proving their essentialness to citizens living in urban areas. These findings prompt further research on the characteristics of popular locations for pedestrians in the city during pandemic enforcements. Additionally, we documented the changes in pedestrian traffic during lockdown policies, while accounting for commercial and residential land-uses, and found an overall bigger influence on PC values in commercial links.
The administrative response to COVID-19 pandemic, which threatened the public health, has been reflected in decisive and swift restriction actions of governments around the world, which, as this study shows, have significantly affected pedestrian movement. Thus, the current reality creates an important momentum and an opportunity for the same governmental determination to make fundamental decisions to encourage walking and promote sustainable communities in cities. For example, at the peak of the first epidemic wave, some cities in Europe took immediate action to adapt the public realm to the new reality by, for instance, converting parking lanes to sitting areas or additional pavement area for pedestrians—as this research showed is sought by the public.
Ubiquitous BT sensor technology introduces advantages, such as the ease of sensor installation, individuals’ privacy protection and large-scale monitoring, both in area and time. Nevertheless, it introduces some limitations worth mentioning. First, BT sensors cannot distinguish between traffic on both sides of the street. Second, as all MAC addresses are anonymous, personal information (e.g., age and socio-economic data) is not included in the analysis. Finally, while the data is restricted to BT users, a penetration rate to deduce the number of pedestrians should be measured, yet it might change over time and therefor requires repeated measurements in future studies. Moreover, some minor age biases might be evident in terms of users who use BT-enabled devices.
To the best of our knowledge, this is the first study aimed at analyzing pedestrian traffic and walking patterns using a network of BT sensor technology on a city scale. The methodology and data provided in this study are valuable to inform urban planners and decision-makers on the magnitude of COVID-19 policies’ impact on pedestrian movement, as well as on the potential that automated PC technologies hold for monitoring walking behavior in real-time.
Footnotes
Acknowledgment
The BT data used in this work was provided by the Sustainable Mobility and Robust Transportation (T-SMART) Laboratory, Faculty of Civil and Environmental Engineering, The Technion – Israel Institute of Technology.
Declaration of conflicting interests
The author(s) declared no potential conflicts of interest with respect to the research, authorship, and/or publication of this article.
Funding
The author(s) disclosed receipt of the following financial support for the research, authorship, and/or publication of this article: This work was supported by The Israeli Smart Transportation Research Center, funding number 2029717.