
Abstract
Proliferation of Short Term Rental (STR) in cities has generated considerable debate as it was found associated with negative externalities, such as gentrification. Nonetheless, it signals urban qualities working as attractors at different geographical scales. STRs’ relation with urban form remains largely understudied. In this paper, we explore how urban form relates to STRs registered by the Airbnb platform in Amsterdam (NL). First, we identify urban types (homogenous patterns of form) through an ‘urban morphometric’ approach. Second, we assess the relation between urban types and density of Airbnbs via a composite machine learning (ML) technique. Third, we provide profiles of the urban types most strongly associated with it. Fifteen urban types explain up to 44% of Airbnb density’s variance. Compact and diverse urban types relate more strongly with Airbnbs. Conversely, repetitive, sparse and uniform urban types are inversely related. The proposed morphometric-based method is robust, replicable and scalable, offering a novel way to study the intricate relation between urban form, STRs and, in fact, any other measurable urban dynamics at an unprecedented scale. By identifying spatial features related to urban attractiveness, it can inform evidence-based design codes incorporating place-making qualities in existing and new neighbourhoods.
Introduction
Short Term Rental (STR) describes furnished properties that are let for periods of time which are usually shorter than the conventional residential rent. Short term rental became popular in 2008 with the establishment of Airbnb and the explosion of global tourism, boosted by globalisation and low-cost air transport. Proliferation of STRs registered by the Airbnb platform (Airbnbs from hereon) in cities generates considerable debate. On one side, it is associated with global commodification of world cities, resulting in higher rents and house prices (Ayouba et al., 2020; Garcia-López et al., 2020; Wachsmuth & Weisler, 2018), gentrification (Gravari-Barbas and Guinand, 2017; Wachsmuth and Weisler, 2018; Yrigoy, 2016) and cultural homogenisation (Oskam and Boswijk, 2016; Törnberg, 2019); on the other, it signals built environment qualities that attract visitors locally, nationally and internationally. Such qualities are related to locational (accessibility to city centre) (Ioannides et al., 2019; Sans and Dominguez, 2016) or symbolic (historical and cultural landmarks) (Gutiérrez et al., 2017; Guttentag, 2015) advantages. What also may arguably play a role is the somehow intangible ‘quality of place’, related to the tangible spatial character of the ordinary built environment (Venerandi et al., 2017).
Although these qualities seem to be indeed typical of historical/vernacular urban areas associated with bohemian lifestyles and characterised by a strong proliferation of Airbnbs (Monge, 2020; Rodriguez et al., 2020; Stors, 2020), they also inform the place-making design agenda, where they are associated with values of community sustainability and resilience (Romice et al., 2020). Since Jacobs and Alexander in the early 1960s (Alexander, 1968; Jacobs, 1961), traditional elements such as to-street building orientation, granular, independent development of plots and tight main street structure seem to contribute to more prosperous, diverse and resilient urban places and communities (Building Better Building Beautiful Commission, 2020; UN-Habitat, 2020; United Nations, 2015). However, a reliable understanding of this matter has always been hindered by lack of rigorous and detailed measurement of urban form at large scale. By investigating the urban form-Airbnb relation in Amsterdam, we contribute to methodological advancements and bring new evidence to the debate.
In this paper, we explore urban form and Airbnbs’ locations in the city of Amsterdam (NL) by applying urban morphometrics (Fleischmann et al., 2021). The method is designed to allow detailed and unsupervised classification of urban form at large scale. First, from input data on building footprint and street network, we generate 370 characters (or metrics) of urban form attributed to each building, and then cluster these characters to generate a numerical taxonomy of Amsterdam’s urban types (UT from hereon), that is, homogeneous patterns of urban from. Second, we obtain point-based data of Airbnb listings in Amsterdam for the year 2017. Third, we analyse UTs and density of Airbnbs via a composite ML method based on forward feature selection and gradient boosting. Finally, we provide detailed profiles of the most strongly associated UTs by reverse-engineering the clustering.
In the following sections we: first, illustrate the methodology, including datasets, morphometric approach and ML techniques used to model the relationship between UTs and density of Airbnbs; second, we present the application to the city of Amsterdam. We then provide information on resulting UTs – including the UTs most associated with density of Airbnbs – and analysis’ outcomes. Finally, we present method’s limitations, future developments and final remarks.
Methodology
Datasets
The methodology presented in this paper relies on three georeferenced vector datasets, containing building footprints at Level of Detail 1 (Biljecki et al., 2016), street network and points of Airbnb listings, respectively. All these datasets are today easily retrievable from a variety of official and non-official sources, depending on the location of the case study. In the United Kingdom, buildings can be extracted from Ordnance Survey (OS) OpenMap Local 1 and streets from OS OpenRoads. 2 In countries where official data is uneven or lacks, one may want to extract both datasets from OpenStreetMap (OSM), the first free crowd-sourced geodataset of the world 3 . Airbnb listings can be obtained from Inside Airbnb, a platform that provides this kind of data for research purposes. 4 To implement the analysis, street network and Airbnb listings need pre-processing. The former must be cleared of transportation-focused geometries (removal of junctions with complex geometries, combination of dual carriageways into single segments), using, for example, the method proposed by Krenz (2018). The latter needs to be cleaned of duplicated Airbnb listings, which may be present due to listing modifications happening over time (e.g. changes in the number of bedrooms, property status).
The morphometric approach
The morphometric approach is based on the quantitative description of multiple characters of urban form. A character reflects a specific dimension (e.g. building footprint), whilst their combination expresses patterns of urban form (or UTs). The description follows a principle of comprehensiveness: a rich set of primary morphometric characters is defined by including metrics established in the literature and few new ones (Fleischmann et al., 2021), minimising potential selection bias.
The plot is often taken as unit of analysis in urban morphology analysis. However, it is ontologically ambiguous (Kropf, 2018), less structural in most post-WW2 urban developments (Levy, 1999) and often just not available in many countries. As a result, we generate a Voronoi tessellation-based partitioning of space named ‘morphological tessellation’, identifying the area of pertinence of each building in relation to adjacent ones (Fleischmann et al., 2020). The resulting spatial unit, named ‘morphological cell’, carries spatial information at the plot scale while retaining consistency across geographical locations and patterns of development. Furthermore, by covering the entire study area with a contiguous mesh, it allows the identification of topological relations between individual cells and buildings. On the other hand, morphological tessellation cannot capture the full breadth of information plots can, especially that regarding private-public space distinction and position of buildings within a plot.
Morphological cells are generated from building footprints, block geometry and topological aggregations, from combinations of all spatial elements measuring characters. The approach relies on primary and contextual characters. Seventy-four primary characters are computed across six categories of elements and multiple scales (see Table S1 in the Supplementary Material) (Fleischmann et al., 2021). The method is designed as a reproducible, open-source, Python-based workflow called momepy (Fleischmann, 2019).
Since the goal is to detect patterns, characters’ local tendencies are quantified in spatial contexts around each morphological cell. A context is a topological aggregation of cells within a third order of contiguity, which is ‘an empirically determined value large enough to capture a cohesive pattern over a relatively wide spatial extent but small enough to generate sharp boundaries between different patterns’ (Fleischmann et al., 2021). From each primary character, four contextual characters are derived: (1) interquartile mean: a measure of central tendency; (2) interquartile range: an indicator of distribution’s spread in absolute values; (3) Theil index of inequality computed on the inter-decile range: it captures local diversity of values; (4) Simpson’s index: diversity of values within local context compared to the rest of the dataset. We therefore implement 296 contextual characters. The reason for omitting tails of distributions in contextual characters is due to presence of exceptions in urban tissues, for example, while a church within a square is part of a specific tissue, its presence should not result in a new tissue category. We are interested in a tendency of values describing a pattern, rather than single buildings.
The contextual characters, transformed in z-scores for comparability matters, are input in the Gaussian Mixture Model (GMM), output being morphologically homogenous clusters or UTs. Since GMM requires the number of clusters to be specified, the Bayesian Information Criterion (BIC) is used to assess the best fit. The resulting optimal value can be derived either conservatively, via elbow method (Thorndike, 1953), or aiming for granular classification, either as the first significant minimum, in cases where the BIC curve culminates, or as the flattening of the BIC gradient if the curve does not culminate. The final step is the derivation of the taxonomy of UTs, which uses cluster centroids as input for Wards hierarchical clustering. The resulting dendrogram captures the (dis)similarity between UTs, allowing flexible adaptation of the classification scale and easier understanding of the overall urban pattern. As the scope of this work is not to alter this methodology but to investigate the relationship between its output (i.e. UTs) and Airbnb, such methodology have been applied exactly as presented in (Fleischmann et al., 2021). For further technical explanations, we hence refer the reader to the original article.
Data aggregation
Airbnb listings from Inside Airbnb are made available with a displacement up to 150 m from their real location for privacy reasons. 5 This makes matching Airbnb listings to their respective buildings (and the analysis at this spatial level) impossible. For this reason, we aggregate the number of buildings belonging to each UT and Airbnbs for hexagons of 400 m width. This spatial unit is advantageous for three main reasons: (i) it subdivides the space regularly, unlike arbitrarily defined areas, such as administrative boundaries or postal code areas, which usually change in size and could even overlap; (ii) its size (i.e. 400 m) is aligned with the notional neighbourhood scale (Mehaffy et al., 2010); (iii) it allows aggregating information at a relatively small scale, reaching a compromise between an unachievable scale (buildings) and a too coarse one of officially designated neighbourhoods. Both the number of UTs and Airbnb listings in each hexagon are strongly affected by the built-up volume, that is, denser city parts tend to overrepresent specific UTs and Airbnb presence simply because they have a higher amount of built mass. To aggregate these quantities in a manner that allows comparability across a case study, we normalise both the number of UTs and Airbnb listings on the total built-up volume in each hexagon.
A composite ML approach
Sequential forward selection
Sequential Forward Selection (SFS) (Raschka, 2018) is used to narrow down the UTs, help the interpretation of the model, reduce data redundancy potentially leading to noise in the outputs and overfitting. This is a feature selection algorithm that tries to predict the output variable (density of Airbnbs) by adding one predictor (UT) at the time, based on a regressor performance (negative mean squared error), until an optimal set of features is achieved. Since the modelling step of the analysis is based on gradient boosting (see below), the same type of regressor must be used for evaluating the performance of the SFS iterations. Moreover, to achieve a statistically robust selection of UTs, a combination of randomly created train and test sets, containing 80% and 20% of observations, respectively, and tenfold cross validation is used. In brief, this divides the original dataset into tenfold and uses each fold nine times as train set and once as test set to be predicted. The performances of these sub-models guide the iterative process of the SFS technique, ultimately providing a robust selection of UTs to be used in the next step.
Gradient boosting and SHAP
Gradient boosting, a robust non-parametric ML technique (Friedman, 2001), is used to analyse the relation between UTs and density of Airbnbs. Gradient boosting belongs to the family of random forests, that is, algorithms relying on multiple decision trees for prediction. However, while the performance of random forests is the average of the performances of the single base models, gradient boosting progressively fits new decision trees to minimise the error made at each iteration and, ultimately, produce a better prediction. Since the purpose of this analysis is regressive (density of Airbnbs), the minimisation of these errors is based on a gradient descent that optimises a least squares regression cost function pointing to the negative gradient direction. As in SFS, gradient boosting is applied by splitting the original dataset in train (80%) and test (20%) sets and implementing a tenfold cross validation. Furthermore, to control the learning process and avoid overfitting, the maximum depth of each decision tree is set to a third of the number of predictors (the UTs selected via SFS), a value largely accepted in ML (Franklin, 2005). Finally, to evaluate model performance, an overall adjusted R2 value, representing the amount of variance of density of Airbnbs that is predicted from the UTs used in the model, is computed as the average of the partial adjusted R2 values computed for each cross validated test set.
Since the aim of this work is not purely predictive, but rather explorative, a further ML technique, that is, SHapley Additive exPlanations (SHAP) (Lundberg and Lee, 2017), is implemented to render the gradient boosting model interpretable. SHAP belongs to a set of algorithms (additive feature attribution) that explains a specific prediction by selecting interpretable features sampling and then fitting a linear model in the local area around such prediction. Though, unlike other methods, it is the only one that guarantees robustness and quality of local approximations. By collecting these local feature importance values across the entire dataset, SHAP can quantify the overall impacts (negative or positive) that the UTs have on explaining density of Airbnbs.
Reverse-engineering the clustering
To identify what specific characters are the most descriptive of each UT, the GMM clustering is reverse-engineered by computing, first, the means of contextual characters across all UTs; second, by calculating the means of same in each UT; third, by identifying the characters whose means diverge the most from their average values across UTs. This step allows the identification of a compact set of highly descriptive characters which can be used to profile the UTs most strongly associated with density of Airbnbs and provide rich visual and textual descriptions.
Implementing the combined morphometric and ML approach to Amsterdam
The 25th most visited city in the world in 2019 according to the Euromonitor International’s market research database (Rabia, 2019), with around 20 million international visitors every year, Amsterdam is a major international hub with an expanding overlook. Along with boosting growth, Amsterdam has long faced the downsides of ‘over-tourism’, to the detriment of local environment and population’s ability to live and prosper. Amsterdam is likely to take the opportunity to re-think a few fundamentals of its own model of development and seek a more balanced way of profiting from its own assets. These famously include some of the most impressive concentrations of historical and cultural heritage in Europe and the world.
For historical and environmental reasons, nowhere a compact and dense urban fabric has, like in Amsterdam, contributed to a living tradition of urbanity across all aspects of local culture, values, norms and habits. It is in line with this tradition and in consideration of the richness and diversity of its urban form that we explore in Amsterdam the essential characters of the city’s spatial structure together with Airbnb’s emerging geography.
Datasets
The data representing all 252,385 building footprints at the required level of detail were extracted from a nationwide open dataset available from Dukai (2018), based on official cadastral data. The street network layer was obtained from the national open data repository Basisregistratie Grootschalige Topografie, BGT 6 and processed to clear the network of transportation-focused geometries to derive a morphological representation of 38,963 street edges. Inside Airbnb’s data used in this work dates back to 2017 and consists of 23,107 geo-localised points representing all kinds of Airbnb accommodations (i.e. private rooms, entire homes, shared rooms) in the metropolitan area of Amsterdam. By visual inspecting the data, we observe a strong density in the area circumscribed by the canal Ij and the main ring road (i.e. A10), roughly corresponding to the historic core of Amsterdam and later urban developments until 1939. A relevant cluster of Airbnb accommodations is in IJburg, a recently developed residential area built on artificial islands raised from lake IJmeer. More scattered densities characterise peripheral areas, such as Bijlmermeer (southeast of the A10), Buitenveldert (south of the A10), Bluebanddorp and Noorderhof (both west of the A10).
A numerical taxonomy of Amsterdam
Having computed the 296 contextual characters, the GMM clustering is used to synthesise this information and output a set of interpretable and highly distinctive UTs. The GMM is tested for clustering solutions from 2 to 40 UTs. The gradient of BIC scores computed for the tested solutions suggests 21 as optimal number of UTs, representing the first plausible stable solution. The spatial distribution of resulting cluster allocation across Amsterdam is shown in Figure 1, top. The 21 UTs of Amsterdam (top) with relative dendrogram (bottom), colour-coded according to levels of similarity.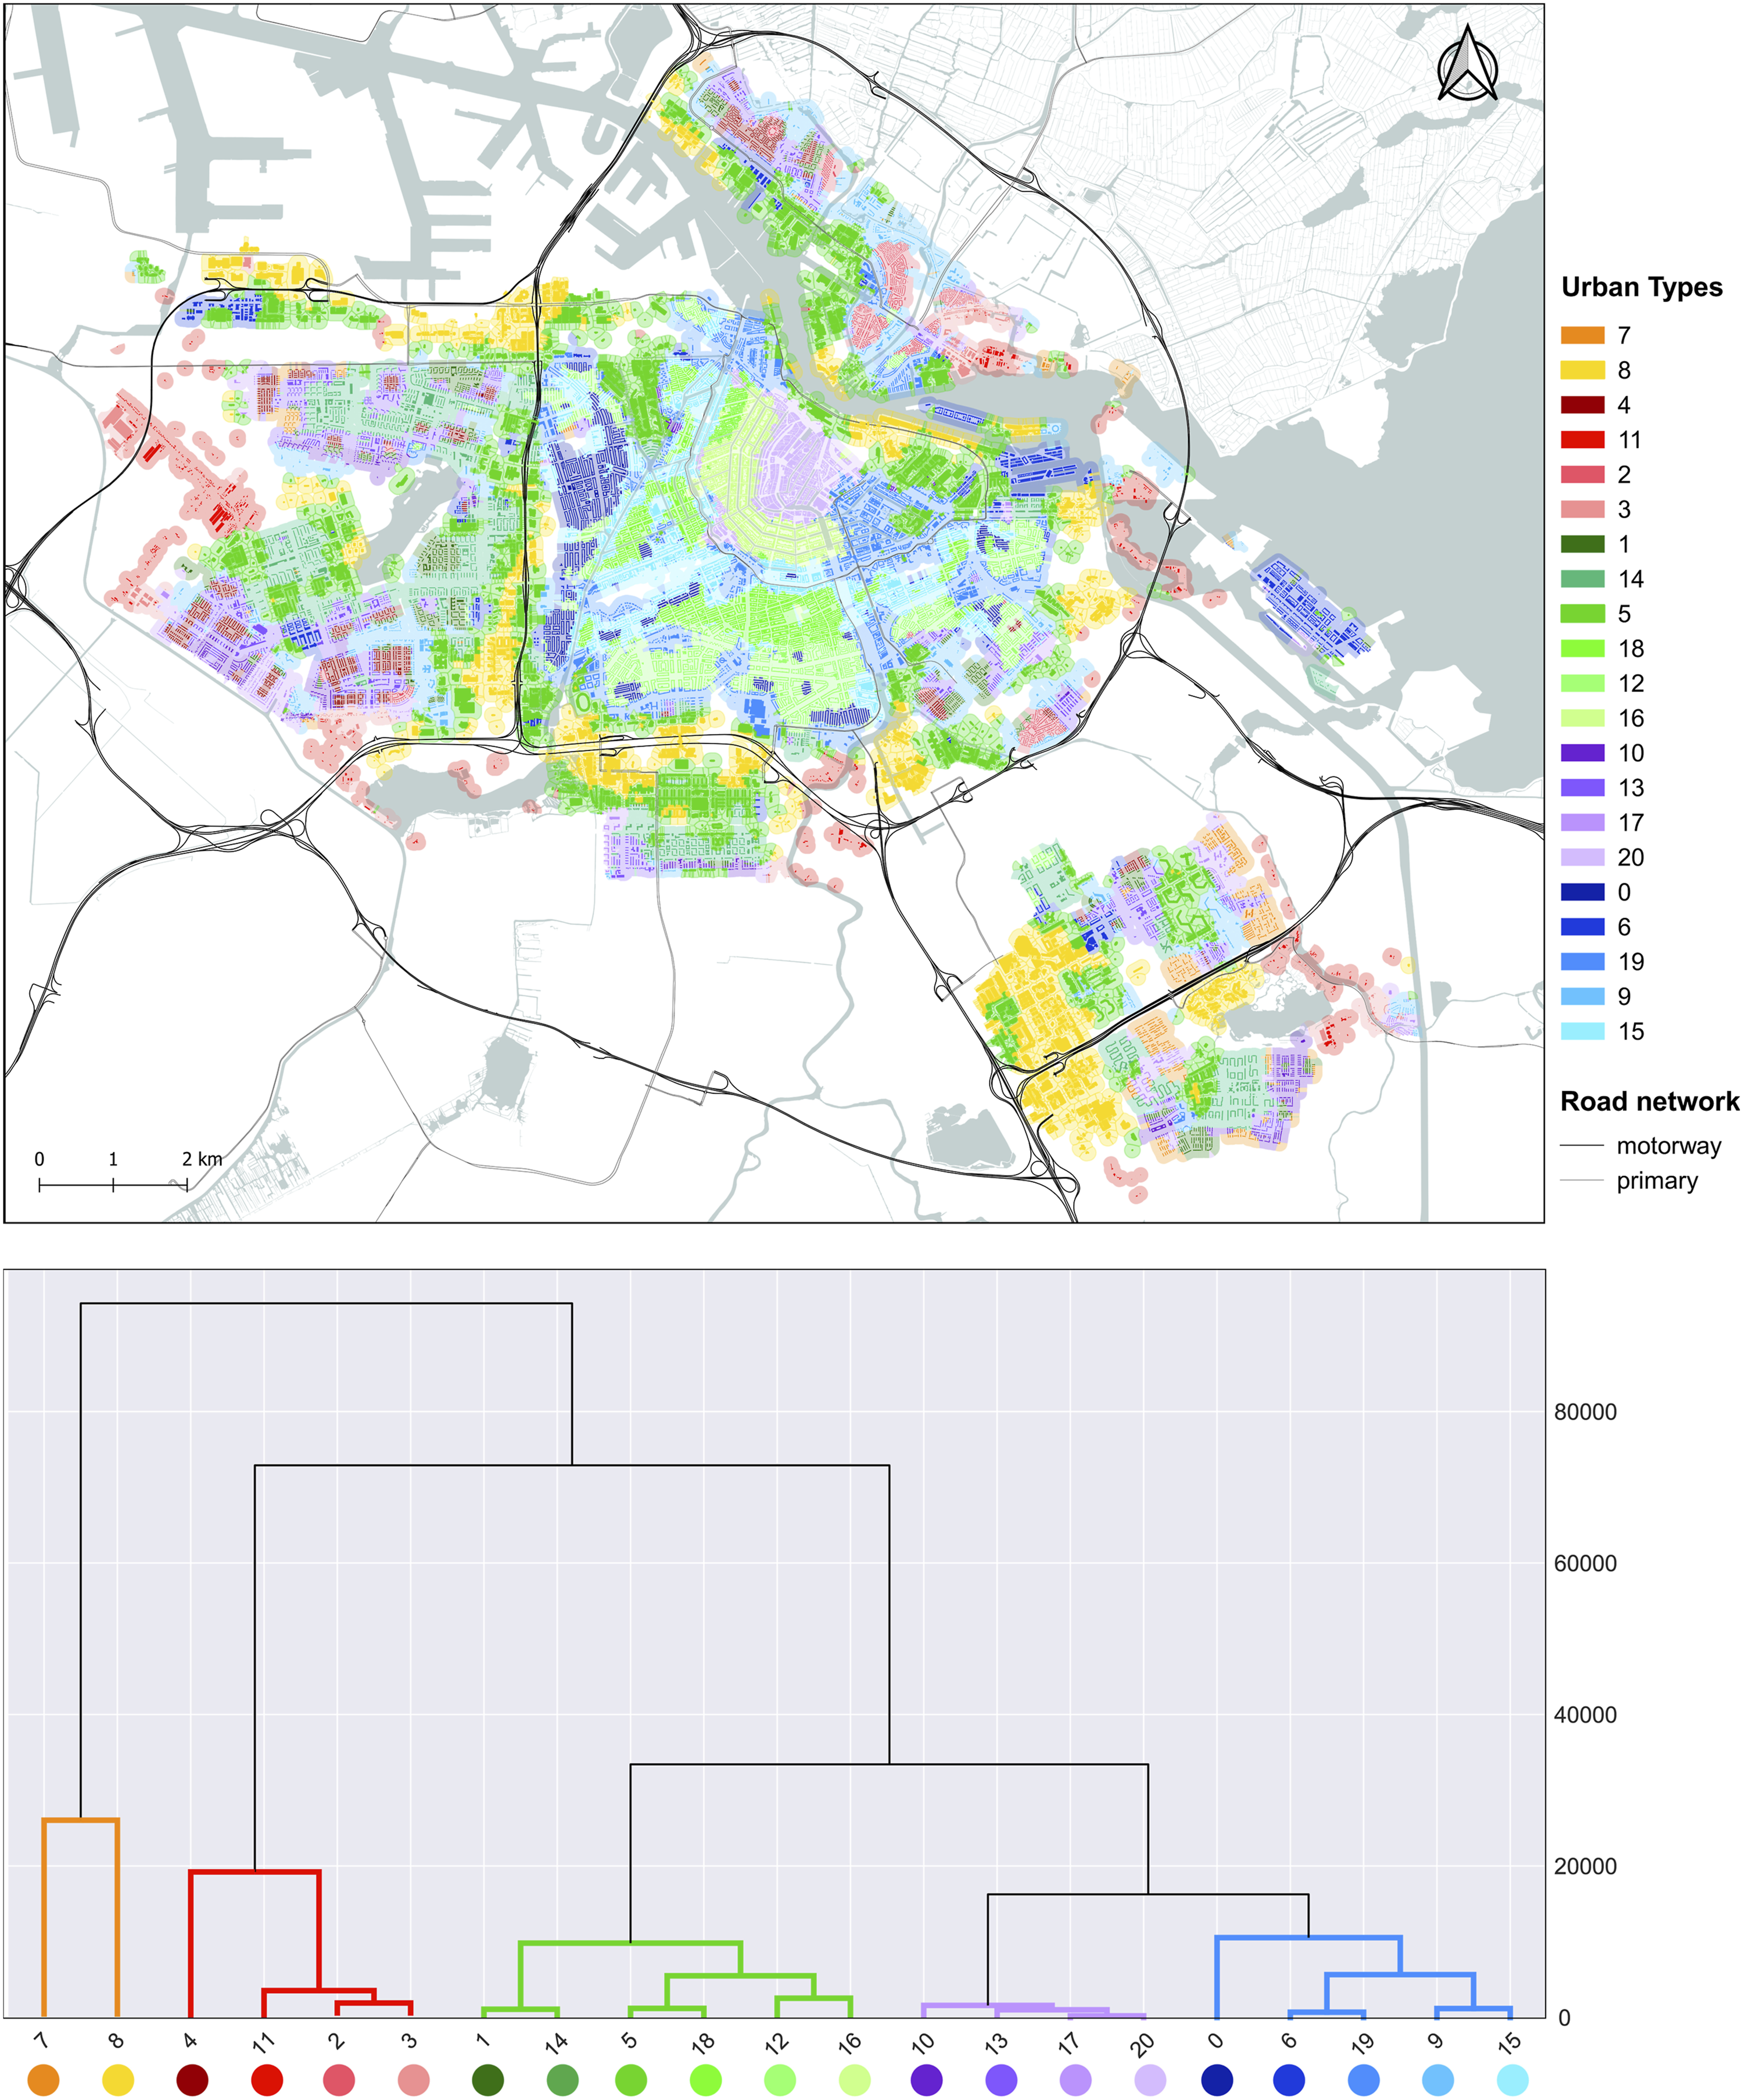
A preliminary visual observation of UTs’ spatial distribution and levels of taxonomic similarity allows us to verify whether UTs capture meaningful spatial patterns. By looking at the dendrogram in Figure 1 (bottom), we observe a clear high-level bipartition into two main groups: the first (orange), contains UT7 and 8, and the second includes all remaining UTs. The first group roughly corresponds to a high-level distinction between two very different urban fabrics of Amsterdam: on the one hand, a more irregular, coarse-grained, scattered (left branch) and, on the other hand, a more regular, structured and compact urban fabric (right branch).
A visual comparison of UTs and the historical development of Amsterdam (Figure 2) shows how the former broadly captures the main construction stages of the city. The footprint of Amsterdam up to the year 1850 (Figure 2(a)) shows a significant overlap with UT20: the dense, organic fabric of the ancient city core (i.e. De Wallen). Close to it, UT16, characterised by rectangular perimeter blocks, largely overlaps the canal district dating back to the 17th century expansion (Figure 2(b)). UT15 and UT18 neatly correspond to the regular fabric of perimeter blocks, characterising the 18th–19th century urban expansion, while UT19 occupies additional areas surrounding the ancient core, including the neighbourhood of Plantage to the east. We further distinguish the ‘Amsterdam school’ style, articulated super-block patterns typical of the 20th century expansion, including the southern and western neighbourhoods envisioned respectively in Berlage’s Plan Zuid (UT12), its continuation, the West Plan (UT0), and the more dispersed urban fabric making up the former worker’s village district of Volewijck (UT2). This group of UTs neatly match the development of the city up to the year 1950 (Figures 2(c) and Figure 2(d)). UTs (right column) capturing different phases of Amsterdam’s urban development up to 2019 (left) as reported in the Maps Dataset of the City of Amsterdam (https://maps.amsterdam.nl/bouwjaar/?LANG=en). a), c), e), d) main phases of the urban development of Amsterdam and b), d), f), h) corresponding UTs.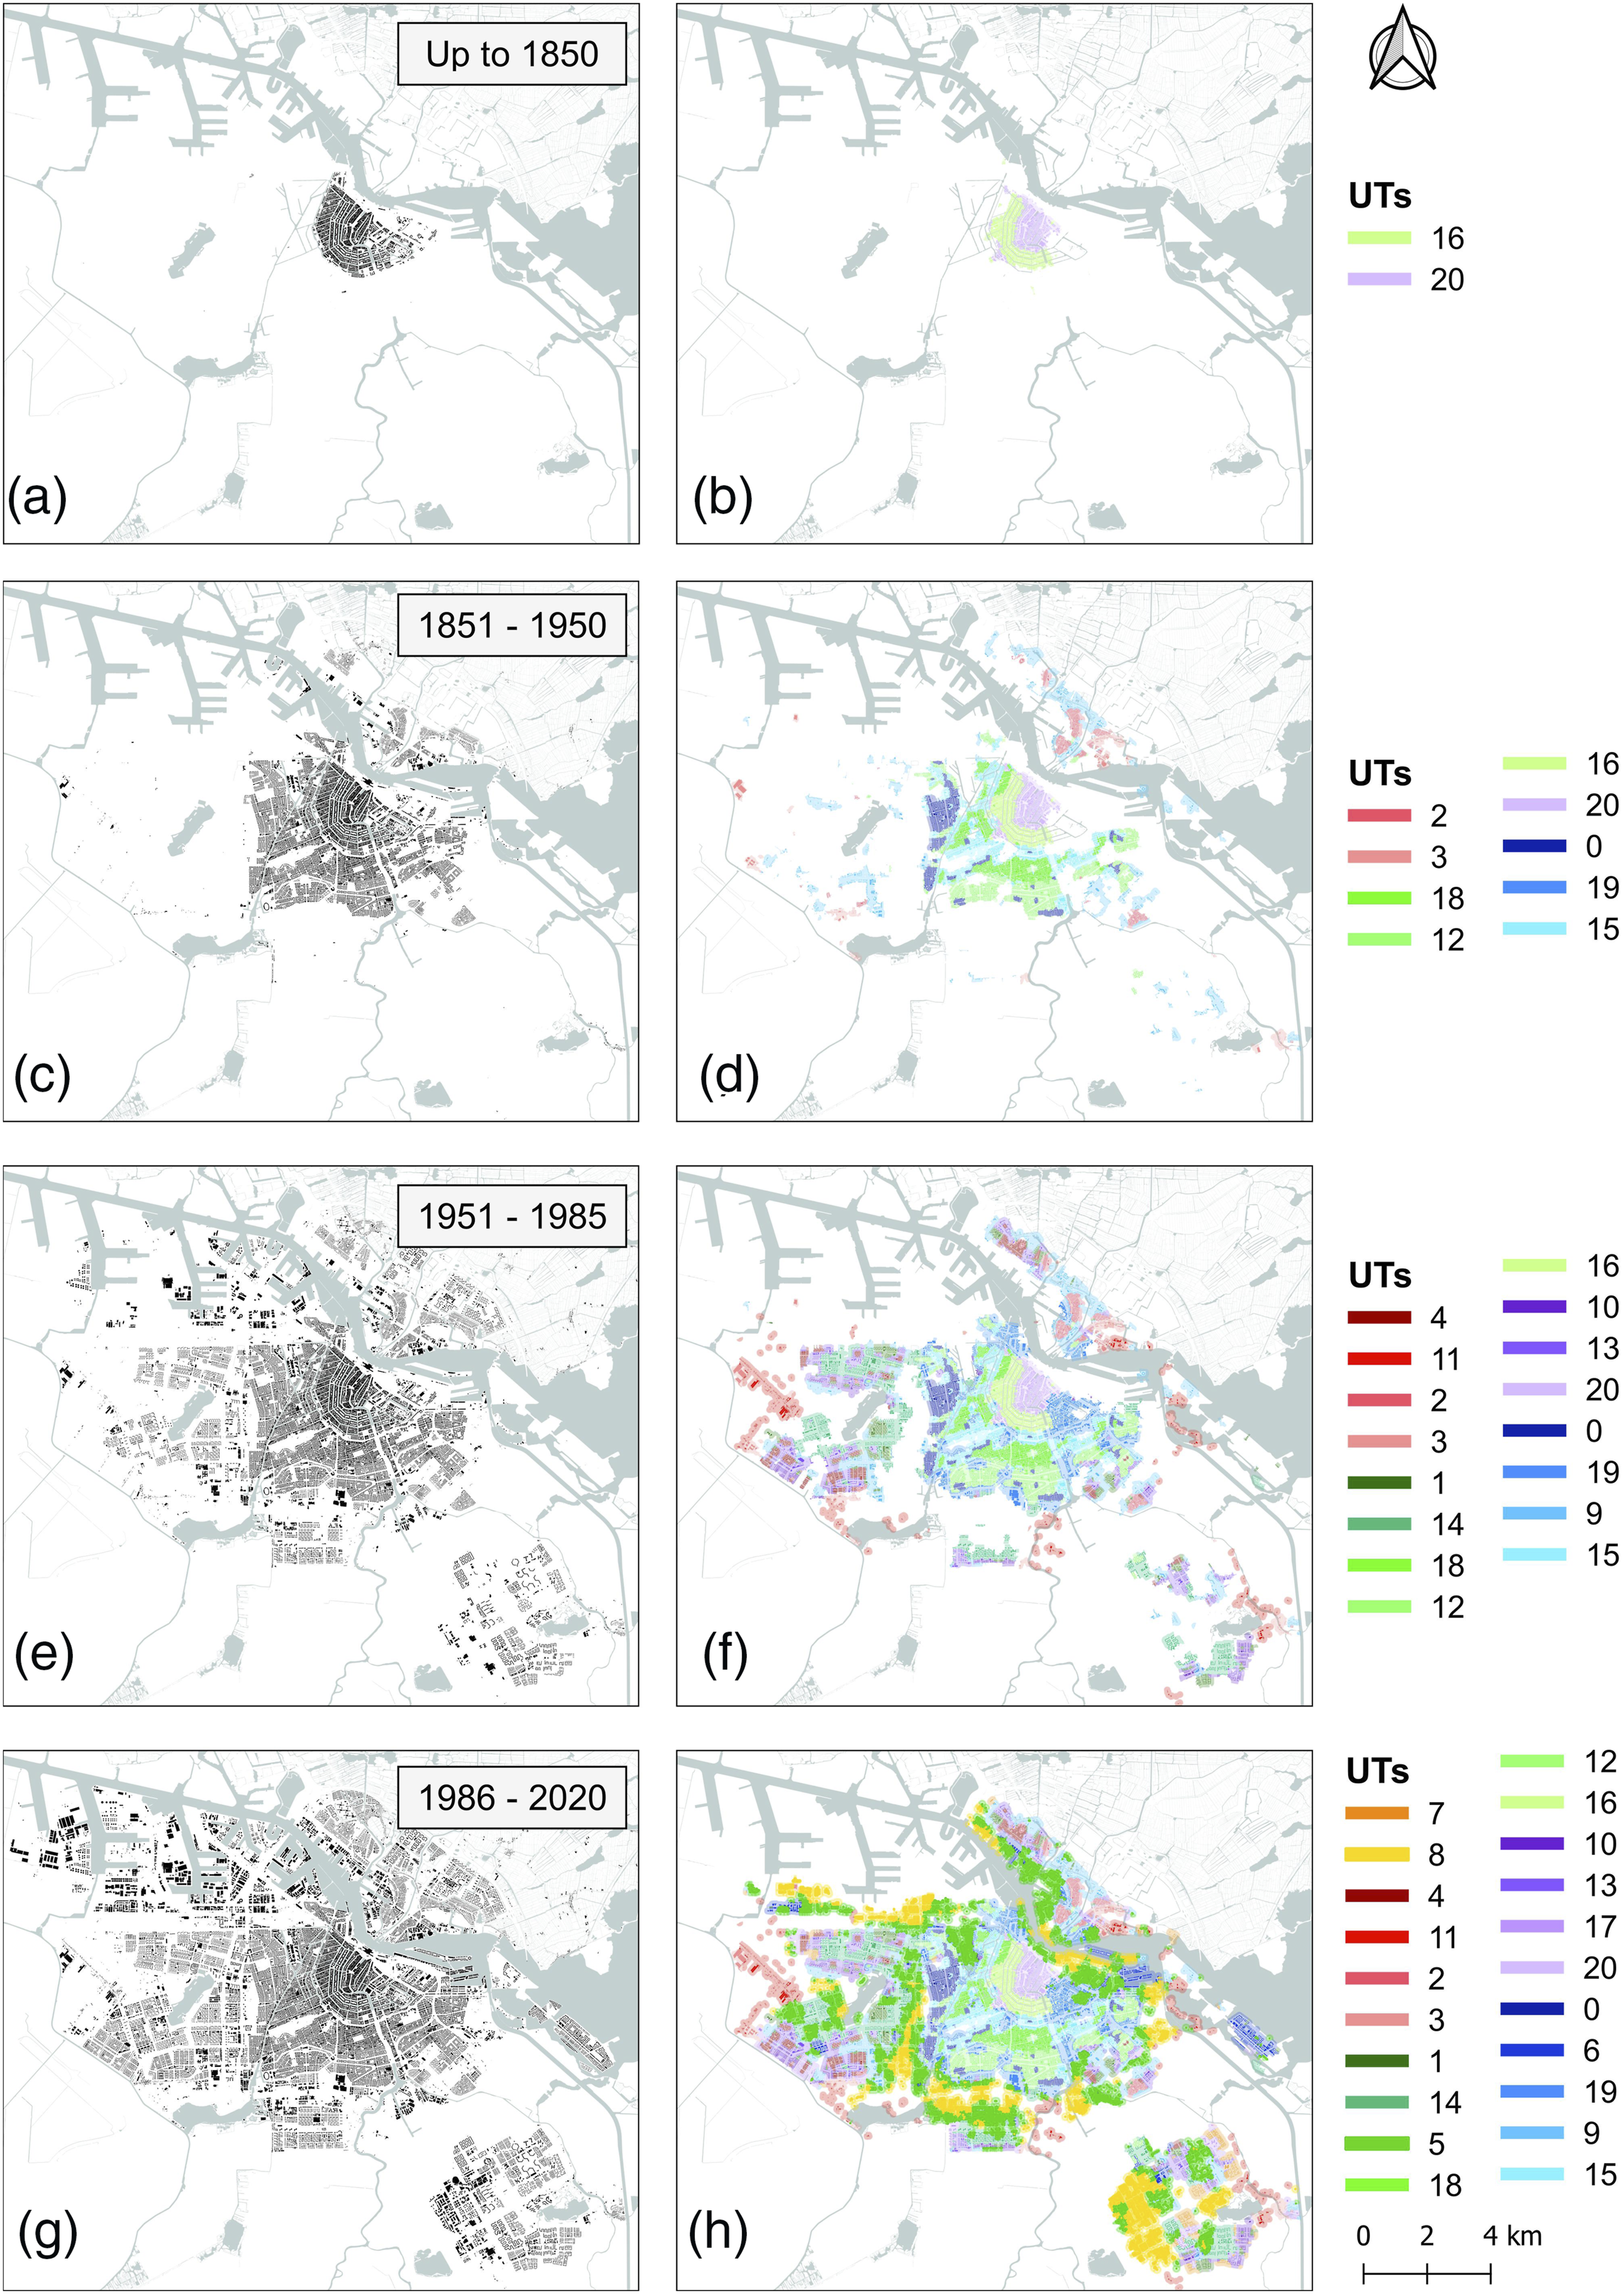
We also remark the correspondence between UT1, UT10, UT13, UT14 and industrial areas as well as several large-scale housing estates, designed and realised in the second half of the 20th century (Figures 2(e) and Figure 2(f)) according to the design theories of the modernist movement. Finally, UT6 largely corresponds to newer developments mostly built between the early 2000s and present day (Figures 2(g) and Figure 2(h)), including, for example, the neighbourhoods of Ijburg, Borneo-Sporenburg and Java Island.
Modelling urban types and density of Airbnbs
Selecting the most relevant urban types
Having created 1,317 hexagons covering the metropolitan area of Amsterdam and aggregated both number of buildings belonging to each UT and Airbnb listings for these spatial units, SFS is implemented to identify UTs that can best model density of Airbnbs. More specifically, SFS is set to use a gradient boosting regressor with a limited number of decision trees (i.e. 32), due to the relatively small size of the original dataset (i.e. 1,317 observations). Furthermore, SFS is set to explore the optimal number of UTs in the range 2–21. Outcomes (Supplemental Figure S1 in the Supplementary Material) show that 15 UTs (i.e. UT0, UT12, UT14, UT15, UT16, UT18, UT19, UT2, UT20, UT3, UT4, UT5, UT6, UT8, UT9) reach the top performance in the selection process. These are thus retained and used to model density of Airbnbs in the next step.
Modelling urban types and density of Airbnbs
The mean cross validated adjusted R2 on the test sets is 0.38, with a standard deviation of ± 0.06. In the best case, the selected UTs can explain up to 44% of the variance of density of Airbnbs in Amsterdam, 38% in the average case and 32% in the worst case. Considering that only urban form is accounted for in this model, this result is deemed satisfactory. The SHAP technique is then applied on the fitted gradient boosting model to measure the relative impacts, measured as percentages, that each UT has on the model output magnitude (Supplemental Figure S1 in the Supplementary Material). UTs 15, 19, 12 and 8 (four out of 15 UTs) explain around 60% of such a magnitude alone, with the first three being positively associated and the latter negatively. Of these, the three UTs most positively associated (15, 19, 12) are in the right branch of the dendrogram (Figure 1, bottom), which contains UTs featuring a comparatively more structured and compact urban fabric. The UT which is most negatively associated with density of Airbnbs (UT8) is found in the left branch of the dendrogram, characterised by more irregular, coarse-grained and scattered spatial patterns. A more detailed profiling of the top two most positively and top two most negatively associated UTs is provided in the following section.
Profiling the top associated urban types
To provide deeper insights on the UTs most and least related to density of Airbnbs, we selected the two most positively associated types, that is, UT15 and UT19 (Supplemental Figures S2 and S3 in the Supplementary Material), and the two most negatively associated ones, that is, UT8 and UT5, and profiled them (Supplemental Figures S4, S5 in the Supplementary Material) according to: (a) spatial location and historical origin and (b) their 20 most distinctive morphometric characters, identified by reverse-engineering the clustering.
In terms of overall urban character, UT15 and UT19 occupy peri-central areas and are characterised by an overall compact, well-interconnected urban fabric. They are similar, and indeed very close in the dendrogram (Figure 1, bottom). Specifically, UT15 surrounds Amsterdam’s Canal District along Vondelpark and within the Oud-West district (Supplemental Figure S2(a)); its buildings date back to late 19th and early 20th century (Supplemental Figure S2(b) and (c)). Some of the key metrics characterising UT15 relate to street layout, compactness of the built fabric, interconnectedness of the street network and geometric complexity of constitutive urban elements (Supplemental Figure S2(d)). Indeed, when compared to all other UTs, streets in UT15 appear to be homogeneously narrow, enclosed by compact building curtains of different heights. Furthermore, this UT features a higher-than-average degree of openness and permeability of the street front, which is due to proximity to urban parks (i.e. Vondelpark) and canals flanking one side of the street. Despite the variety of heights and openness of street profiles, however, the relationship between buildings and streets maintains a degree of consistency of orientation and alignment. A similar consistency characterises the geometry of buildings, cells and blocks, which all share relatively simple, square-shaped geometries (reduced shape complexity and relatively regular perimeters), although ‘animated’ by a certain local diversity of cell areas.
UT19, in turn, is mostly concentrated in the eastern section of the Centrum district, largely coinciding with the Oosteljke Eilanden and Weesperburt en Plantage areas, and in the western section with the area of Haarlemmerburt, while smaller pockets of this UT are also found more sparsely in the Zuid, Oost and West districts (Supplemental Figure S3(a)). The urban fabric in this area is generally more recent but maintains many of the spatial qualities typical of older areas in terms of compactness, scale and connectivity (Supplemental Figure S3(b) and (c)). The top positive and negative 10 descriptors of UT19 highlight several key features of its spatial character (Supplemental Figure S3(d))): gridded street pattern and homogeneity of number and length of cul-de-sacs whose combination implies both prevalence of four-way intersections and low presence of cul-de-sacs throughout. This pattern is also reflected in the geometry of blocks. Block perimeter length, block footprint complexity and block squareness all indicate a relatively homogeneous block pattern, where most elements are similarly sized and shaped and are overall characterised by higher-than-average shape articulation. A more diverse pattern emerges at the building level, with a greater variety of footprint elongations. However, the overall building pattern maintains strong compactness and coherence, expressed as degree of building adjacency (higher than average), porosity of the street edge (lower than average) and homogeneity of building orientation (higher than average). Compactness is further reinforced at the level of cells. Here, we observe that they not only consistently align with streets, but also show small areas and are closely packed together, hence highly accessible.
UT8 and UT5 are, by contrast, the two types most negatively associated with density of Airbnbs. Both are geographically located in peripheral areas of Amsterdam and near major arterial roads, such as the A10 ring road encircling the city centre and other A-level roads (i.e. A2, A5, A9) (Supplemental Figures S4(a) and S5(a)). The urban fabric of these two UTs is developed much later compared to the ones described earlier and is characterised by a mix of large-scale residential estates interspersed within extensive industrial and tertiary areas, mostly built during the outward expansion of the city in the 1980s (Supplemental Figures S4(b)-(c) and S5(b)-(c)). Their quick development in the span of a single decade has deeply affected the morphology of both types albeit in different ways, as it emerges from the top descriptors of each type. Indeed, whilst UT8 and UT5 are relatively distant in the hierarchical dendrogram (Figure 1, bottom), the two are spatially adjacent to one another, share many of the top 10 and bottom 10 descriptors, all of which point to a strong sense of uniformity, repetition and regularity.
In UT8 (Supplemental Figure S4(d)), blocks tend to be large (higher-than-average block perimeter lengths), square-shaped (high degree of squareness) and contain a high number of cells, although this number varies substantially when compared to the city average. Blocks are quite homogeneous in terms of perimeters and footprint complexity, although displaying a diversified range of cardinal orientations. Homogeneity is also found in the street layout, with streets characterised by similar lengths and widths. Cul-de-sacs are uniformly spread throughout and tend to cut deeper into the block compared to all other UTs. Even at the scale of morphological cells and buildings, we find again a similar degree of homogeneity: cells have low diversity in terms of size, distances between neighbouring buildings are overall similar, and their geometry tend to be characterised by repetitiveness, as expressed by the low variation in the mean distances between building centroid and corner of the building footprint. Like for blocks, however, buildings in this UT show a variety of alignments: this is observed both in relation to buildings located near each other and, more generally, as overall variety of building orientations found throughout the UT.
In UT5 (Supplemental Figure S5(d)), the top 10 and bottom 10 descriptors highlight characters that are very similar to those already found in UT8. Blocks tend to be square-shaped – a pattern that is consistently repeated throughout – and contain a relatively high number of cells, although this number varies considerably compared to the city average. Like for UT8, blocks show a higher-than-average variety of orientations. Streets are overall like each other in terms of geometry – street length and width – and there is a relevant presence of cul-de-sacs with homogeneous lengths, consistently distributed throughout the UT. Buildings are generally small, similar in terms of footprint geometry and, unlike what observed for UT8, orientation, as expressed through the variables capturing the building centroid-corner length deviation (lower than average), the complexity of footprint geometry (lower than average) and the diversity of building alignments (lower than average).
Discussion
Findings suggest that the proposed methodology based on urban morphometrics and ML can help to better understand what specific UTs and physical characters are associated with unique and internationally renowned urban qualities of Amsterdam’s built environment. Such qualities are identified via their positive association with Airbnb locational choices. In line with previous research (Monge, 2020; Rodriguez et al., 2020; Stors, 2020), attractive spatial patterns that are typical of pre-modern urban areas exert a strong influence on Airbnbs’ locational choices. A novelty aspect is that this very same attraction is also exerted when these pre-modern spatial patterns are reproposed in recently regenerated areas (e.g. UT6 largely corresponding to Ijburg, Borneo-Sporenburg and Java Island) but the architectural style at the building level is contemporary. The proposed method seems to capture patterns of spatial organisation that are distinct from those emerging at the building level, such as windows or roofs’ shape, construction materials or colours. This finding suggests that there exists in cities an ‘order of space’ that can be captured numerically, which may actively contribute to shaping the social and economic performance of urban places and does not go to detriment of creative design thinking at the building scale. We can see here the clues of an interplay between unity and diversity across scales that is the signature of evolution in complex adaptive systems (Capra and Luisi, 2014; Salat et al., 2017). The detailed profiling of UTs allows a rich and rigorous understanding of the design components that come into play in generating the wholesome attractiveness that influences Airbnbs’ locational choices.
The same information raised to describe urban form may inform strategies for generating it. Innovative evidence-based design codes based on large-scale information may support urban regeneration or expansions which make value of the ‘collective intelligence’ stored in the spatial structure of existing urban areas. The formulation of these design codes can be informed by the morphometric profiles of UTs that seem to be working and are desirable, as ascertained through the methodology presented in this paper. A larger supply of attractive urban places which are sought-after by Airbnbs may be conducive to their more even distribution across space, which, in turn, could help to alleviate negative externalities, for example, increased house and rent prices (Ayouba et al., 2020; Garcia-López et al., 2020) and gentrification (Wachsmuth and Weisler, 2018), both due to their concentration in specific city areas. UT’s descriptors that can potentially inform design codes are several and relate to different spatial elements (i.e. buildings, cells, streets, blocks), e.g. mean buildings footprints, homogeneity of cell areas, mean proportion of cul-de-sac, local diversity of street lengths, mean of block footprint complexity. To strengthen the basis for design coding, future work might also investigate whether UTs positively associated with urban attractiveness also relate to better socioeconomic and well-being levels of local communities.
Furthermore, the same methodology that is here applied to the relation between urban form and Airbnb can be replicated towards any pattern of social, environmental and economic nature. This corresponds to an increased understanding of urban form potential contribution to practically everything that occurs in cities: place economy, environmental performance, community identity, health, wellness and lifestyles. The only limit in this avenue of research is availability and quality of data.
The study presented in this paper investigates the relationship between urban form types and density of STRs registered by the Airbnb platform normalised on the built-up volume. However, further aspects, such as number of reviews, size and price of Airbnb accommodations, might be investigated in separate models to obtain even more insights on the matter. Given the widespread availability of Airbnb and spatial data, future work may replicate this study (i) to other cities, to understand whether similar patterns of association with density of Airbnbs hold in different geographical and cultural contexts, (ii) by scaling it up to the regional, national and super-national level.
Finally, we acknowledge the following limitations for methodology and results. First, although the results presented in this work can be considered statistically robust due to the use of feature selection, train and test sets, and cross validation, they do not imply causation. Second, urban form can be a proxy for other urban phenomena, such as socioeconomic levels and cultural mix of residents. Understanding the relative importance of all these factors in explaining the density of Airbnbs would be of great scientific relevance. However, due to lack of data at the required level of spatial granularity, it was not possible to account for factors other than urban form in this paper. Third, selecting the optimal number of clusters (UTs) is always a challenging task as the available techniques are heuristic (e.g. visual inspection of the gradient function, trial and error tests). 21 might thus not be the correct number of UTs for Amsterdam. However, several clustering solutions were mapped in the experimental phase of this work and the solution with 21 UTs seemed to be optimal based on expert knowledge gathered in the process (i.e. urban design literature and comparison between UTs and main phases of the urban development of Amesterdam). Furthermore, UTs spatial patterns were relatively stable across tested clustering solutions. A fourth limitation concerns the metric of density of Airbnbs. As we mentioned above, Airbnbs are displaced up to 150 m for privacy concerns. This might have introduced a potential bias in the computation. However, we argue that the selected spatial unit of analysis (hexagon of 400 m width), by being larger than the maximum Airbnb displacement distance, minimises this bias. Fifth, the UTs might not be perfectly homogenous and contain misclassified buildings. This is likely the result of geometrical inaccuracies in the input data, which might have affected the values of some characters and clustering. However, a visual inspection of Figure 1 reveals relatively neat UTs with only few misclassified buildings within them. Sixth, the hyperparameters of the GB algorithm used to model the relationship between UTs and Airbnb in Amsterdam were manually tuned by trial and error. While this proved to work in this study, it is not the most efficient way of carrying out such a task. Cross validated grid search (Bergstra and Bengio, 2012) might help, for example, to select the maximum number of features that the GB algorithm utilises at each split. Finally, the outputs presented in this work might be affected by the Modifiable Areal Unit Problem (MAUP) (Openshow and Taylor, 1979), a common issue in spatial studies, related to the variability of metrics depending on the choice of the spatial unit of analysis. While we acknowledge the potential presence of this issue, we believe that the spatial unit used in this work, being both theoretically and methodologically sound, still provides reliable results.
Conclusions
Although the proliferation of STRs registered by the Airbnb platform in urban contexts is related to potentially negative externalities like gentrification, rising rents and housing prices potentially leading to displacement of local population, it is nevertheless a signal of a ‘quality of place’ that is acknowledged locally, nationally and internationally. This quality relates, for example, to historical characters of the built environment’s spatial structure, that is, the set of intrinsic physical and spatial characteristics of the ordinary built environment. Such characteristics are central in the place-making urban design agenda for their capacity to support more prosperous, diverse and resilient local communities. However, these urban qualities are yet to be fully unveiled. In this work, we thus propose a method to characterise cities through homogenous patterns of urban form (UTs), extracted from a comprehensive set of morphometric descriptors, and investigate their relationship with density of Airbnbs, as a proxy of urban attractiveness, in the city of Amsterdam. Through GMM, we identified 21 different UTs aligned with specific city planning styles and main phases of urban development of the city. A composite ML approach, based on feature selection, gradient boosting and SHAP, was then used to investigate the relationship between UTs and density of Airbnbs. The best model could explain up to 44% of the variance of the latter, with UT15, UT19, UT12 and UT8 accounting for 60% of such explanatory power. UTs featuring a comparatively more diverse and compact urban form, with a well-interconnected street network, were found to be positively associated with density of Airbnbs. Conversely, UTs characterised by a uniform and repetitive urban fabric, made of large-scale residential estate and single, complex, bulky buildings were found to be inversely associated with it. The use of urban features associated with attractive places in city planning might help to redistribute Airbnbs in cities and potentially alleviate negative externalities related to their concentration in ‘hubs’ of exceptionally sought-after places.
Supplemental Material
Supplemental Material – Urban form character and Airbnb in Amsterdam (NL): A morphometric approach
Supplemental Material for Urban form character and Airbnb in Amsterdam (NL): A morphometric approach by Alessandro Venerandi, Alessandra Feliciotti, Martin Fleischmann, Karima Kourtit and Sergio Porta in Environment and Planning B: Urban Analytics and City Science
Footnotes
Declaration of conflicting interests
The author(s) declared no potential conflicts of interest with respect to the research, authorship, and/or publication of this article.
Funding
The author(s) disclosed receipt of the following financial support for the research, authorship, and/or publication of this article: This work was supported by the Agence Nationale de la Recherche (ANR-15-IDEX-01), Axel and Margaret Ax:son Johnson Foundation (GEN2971-100) and the Ministry of Research, Innovation and Digitization, CNCS - UEFISCDI (PN-III-P4-PCE-2021-1878: Institutions, digitalization and regional development in the European Union, within PNCDI III).
Supplemental Material
Supplemental material for this article is available online.
Notes
References
Supplementary Material
Please find the following supplemental material available below.
For Open Access articles published under a Creative Commons License, all supplemental material carries the same license as the article it is associated with.
For non-Open Access articles published, all supplemental material carries a non-exclusive license, and permission requests for re-use of supplemental material or any part of supplemental material shall be sent directly to the copyright owner as specified in the copyright notice associated with the article.