
Abstract
Compact settlements take advantage of economies of scale by sustaining a system of high-quality socio-economic services at close proximities. Urban density with a balanced mix of uses also benefits walking and cycling as mobility modes that provide sufficient access to urban amenities, especially when combined with effective public transport. Indeed, walking and cycling can decrease the use of cars for short-distance trips. From this perspective, urban density can help to reduce pollution, optimise energy consumption and decrease infrastructural expenditures while contributing to more attractive urban environments. These ideas have induced a new wave of time geography planning concepts, such as the ‘10-minute city’, to enhance urban sustainability. For these concepts to move beyond visionary narratives, they must be expressed in specific empirical frameworks. Thus, the current research focuses on accessibility to grocery shops, as an essential urban service, in the Stavanger metropolitan area (Norway) using 10 minutes isochrones for walking and cycling. The study integrates open data, GIS network analyses, statistical regressions and bivariate representations of the results. The research estimates the level of serviceability by quantifying the number of shops that are accessible for each location and interrelates this estimation with spatial and population densities. The paper also presents a method to detect spatial inequalities by visualising over/under-serviced areas. This visualisation can become a tool to support strategies to rebalance such imbalances. Moreover, this study offers a practical approach towards the ‘10-minute city’ concept, as it can be adjusted to different isochrones at different spatial scales. In general, this approach can serve both to analyse existing contexts and to model strategies to support sustainability policies, such as urban densification and the promotion of environmental-friendly transport.
Introduction
The idea of a sustainable city, beyond environmental frugality and economic optimisation, relies strongly on enhancing proximity and accessibility to working destinations and everyday services for all inhabitants. The relation space-time is fundamental in this process. From this perspective, a city that prioritises an adequate distribution of functions and services across space is more likely to support higher efficiencies, expressed by fewer travel demands and shorter trips to access amenities. Such efficiency optimises individual inhabitants' time budgets, enhancing their possibilities of spending time with family, on leisure activities or self-development. Indeed, the notion of incorporating time as a fundamental resource within cities as socio-economic systems led to the inception of the concepts of the functional economic area (Fox and Kumar, 1965) and time geography (Ellegård et al., 1977; Hupkes, 1982; Hägerstrand, 1970; Thrift, 1977). These ideas revolve around understanding that what a person can access within a specific timeframe depends on the available means of transport, its velocity and the proximity of the points to reach. Aligned with population growth and economic expansions in many urban regions, until the end of the 20th-century, transport planners in numerous contexts had tried to materialise these ideas by enhancing mobility. For decades this ambition had resulted in optimising vehicular transport modes and expanding physical infrastructures to increase their reach within a specific timeframe (Metz, 2010).
Today, decades later, the fundaments of time geography are still incorporated in planning approaches although integrating the perspectives of sustainability, climate change awareness and social equity (Bannister, 2008). Thus, this new wave of time-orientated planning focuses on enhancing accessibility in the most time-efficient, economically effective and environment-friendly ways possible; and also on reducing the need to travel. Many sustainable transport efforts seek to curb car dependency while promoting walking and cycling as individual transport modes. The latter are highly flexible, active forms of mobility that provide numerous individual and collective benefits in cities. Walking and cycling allow door-to-door commuting, at a minimum cost, with minimal waiting times and at the lowest possible energy consumption, while also demanding less infrastructure. Moreover, walking and cycling provide health benefits, lower noise levels, and minimise air pollution and CO2 emissions in cities (Brand et al., 2021; Nieuwenhuijsen, 2021). Walking, in particular, also improves traffic safety and allows for various social interactions within the urban environment (Hermann-Lunecke, Mora and Sagaris, 2020; Hillnhütter, 2021). However, these transport modes have a limited range because of velocity and because most people do not find it acceptable to do these activities for too long. Several researchers (McNeil, 2011; Rahul and Verma, 2014; Tsunoda et al., 2021) claim that walking and cycling can provide sufficient accessibility if reasonable time limits are considered. All these notions led to the rise of the 20, 15, 10 or even 5-min city/neighbourhood concepts (Da Silva et al., 2020; Levinson, 2020; McNeil, 2011; Moreno et al., 2021; Øksenholt et al., 2016) 1 . A process that has been reinforced by the restrictive circulation measures to contain the COVID19 pandemic in the 2020s.
The prioritisation of walking and cycling creates synergies with other ideas about environmental quality and the promotion of the human scale in cities, values that are strongly advocated by influential urban planners and urban designers (Gehl, 2010; Sim, 2019; Speck, 2012). Nevertheless, the implementation of sound walking and cycling plans beyond the visionary narratives requires understanding urban areas from a functional perspective. Concepts such as the 20/15/10/5-min city provide an operational framework that is easy to understand since people, in general, are more aware of time than distance (Thrift, 1977). The time perspective can help uncover disbalances affecting the urban system, especially from a social standpoint considering equitable access to urban amenities. The study presented in this article measures accessibility to urban services by using the framework of the 10-minute city concept as a time isochrone threshold. More precisely, it focuses on the physical accessibility to grocery shops by walking and cycling in the metropolitan region of Stavanger (Stavanger MA), Norway. Although going to the supermarket does not consume the most substantial part of personal time budgets compared to other types of daily travel (Hjorthol, 2014), it is a necessary activity for every household.
The study pursues two primary empirical aims. First, it estimates the level of serviceability based on an index corresponding to the number of accessible grocery shops within 10 minutes of walking or cycling from each location in Stavanger MA. In this way, the analysis does not simply explore whether the different areas have access to the service of interest but also quantifies the number of objects that are reachable. Second, the level of serviceability is interrelated with the existing spatial structure and the concentrations of inhabitants in Stavanger MA through statistical regressions and a bivariate representation of the processed analytical outcomes. As a result, the study identifies specific over/under-serviced areas and empirically explores the potential of the 10-minute city concept for grocery shops.
The rest of the paper is organised as follows. The Walking and cycling, acceptable distance, velocities and time isochrones section develops a short literature framework addressing the specifics of walking and cycling as urban mobility modes. There, we justify the concrete parameters, that is, velocities, acceptable travel distances and time isochrones, to execute the analyses of interest. Following this, the utilised methodology is described in the Methodology section, including the data preparation process, GIS network analyses, estimation of the serviceability levels and the linear regression operations. Then, the generated results are presented in the Results section. Subsequently, in the Discussion section, these outcomes are analysed further to outline the developed approach’s potentials and limitations. Lastly, in the Conclusion section, we conclude the paper by summarising the study results and suggesting further research directions for the introduced research method.
Walking and cycling, acceptable distances, velocities and time isochrones
The literature on walking and cycling acceptable distances offers a complex picture. This acceptability is affected by factors such as the purpose of the trip, if this is a primary or complementary transport mode, the quality of the infrastructure, the weather and the attractiveness of the area, or if the trip implies carrying things, such as trips to the grocery shop. A literature review developed by Schaap et al. (2016), primarily based in the Netherlands, shows that the shortest acceptable walking distance is from the parking place to home, that is, 150 m. According to cited sources, the longest acceptable distance to walk is to a train station, ranging up to 2.2 km. For grocery shopping, the study develops a graphic indicating that 80% of the respondents find it acceptable to walk 200 m. In comparison, only 50% consider 400 m an acceptable distance to be covered by foot. The figure drops to 20% when 600 m is the distance to walk. The study estimates the average walking speed for healthy adults at 5 km/h; according to this, it estimates that the radius of influence of train stations is around 1 km, the distance an adult can walk in 12 minutes.
Regarding walking velocity, it is long established that it is influenced by the surrounding environment (Gehl, 2010; Whyte, 1988). However, both scholars argue that this relationship is weaker when pedestrians perform 'necessary’ activities whose purposes are well-determined to travel from A to B. In these cases, trip detours are unlikely and walking speed tends to be constant. Furthermore, Hillnhütter (2016) addresses the complexities of calculating average walking speeds if the barrier effects of streets are considered in precision, that is, causing the waiting times while crossing high-traffic junctions and streets. In specific cases, this aspect can distort analyses that focus on distance reaches within a particular timeframe. The presented study does not focus on such details, but considering the contextual specifics of Stavanger, crucial empirical distortions on the examined metropolitan scale are highly unlikely. The high-traffic streets in the region tend to be crossed: (1) by over-/underpasses, whose length and connecting points are incorporated in the utilised network dataset or (2) on junctions prioritising pedestrians via crosswalks or traffic lights signals, which respond promptly to crossing demands. However, it is worth acknowledging that, in general, average speeds can be affected by congested areas or by the fragmentation of pedestrians and cyclists networks due to road traffic.
On the other hand, cycling allows covering a larger distance per time unit than walking. Moreover, this has been expanded by the growing usage of electric bikes. The analysis of Schaap et al. estimates the average trip segment on an electric bike in the Netherlands at 5.7 km, almost 2 km more than on a regular bike. A study developed in Trondheim, Norway, by Pritchard et al. (2019) offers similar results using a different approach. This study’s stated acceptable distances for home-to-work commuting are 6.0 km for cyclists and 1.5 km for pedestrians. This research, however, does not consider the acceptable distance difference between electric or conventional bicycles. Estimations for Shanghai, a denser and larger urban environment, calculate the average free-flow operating speed (stops not included) for cycling on a conventional bike at 13.0 km/h and 18.2 km/h for an electric one (Lin et al., 2008). Despite the frequency of hilly routes, these speeds can be higher in Norwegian cities because bikes enjoy a high percentage of separated lanes, and traffic congestions for cyclists are low. Based on these figures, a cyclist’s accepted travel time by trip segment in Norway is 20–30 minutes. We estimate the covered distance in 10 minutes for a cyclist at 2.5 km based on these sources.
The details of acceptable distances, average velocities and, respectively, time isochrones are fundamental for operationalising the notions of 20, 15 or 10-minute cities. However, as the previous paragraphs indicate, the exact walking/cycling distances and time range to be considered as a threshold seem to be a contextual question. In large and rather sprawl urban agglomerations, such as cases in North America, researchers seem to utilise the 20-min city (Da Silva et al., 2020; McNeil, 2011). In large but more compact cities, such as Paris, planners prioritise the 15-min city (Moreno et al., 2021). While in the Norwegian context, characterised by smaller urban settlements, the thresholds of 15, 10 or even 5 minutes are considered (Øksenholt et al., 2016). The latter group of researchers conclude that 10 minutes should be regarded as the most extensive time isochrone of travelling to urban services if the aim is to facilitate a high share of pedestrians and cyclists. In addition, according to the Norwegian travel survey from 2014, most people (68%) walk for trips shorter than 1 km (approx. 12 minutes), while the percentage drops significantly for longer distances (Hjorthol et al., 2014). The shares regarding cycling follow a similar trend, particularly for trips under 3 km (approx. 12 minutes). Although cycling represents only 7% of the daily travels within 3 km, 54% of all bike trips are executed within this distance; for longer distances, this percentage drops (Hjorthol et al., 2014). Based on these considerations and data, we accept 10 minutes as a reasonable time isochrone to be employed in the following empirical study to measure accessibility to grocery shops in Stavanger MA.
Methodology
The method applied in this research combines a multivariable quantitative approach to explore relationships between the built environment characteristics, the location of the particular points of interest (POIs), that is, grocery shops, and their connectivity within the walking/cycling mobility networks. We use GIS software (ArcMap) to gather, classify and visualise the analysed variables. Furthermore, we explore the geospatial relationships of interest through further data processing and regression analysis. The method consists of three main steps: (1) data preparation, (2) executing GIS analysis and (3) processing linear regressions. These stages are explained in greater detail in the following paragraphs and the paper’s Supplementary Materials.
Data preparation
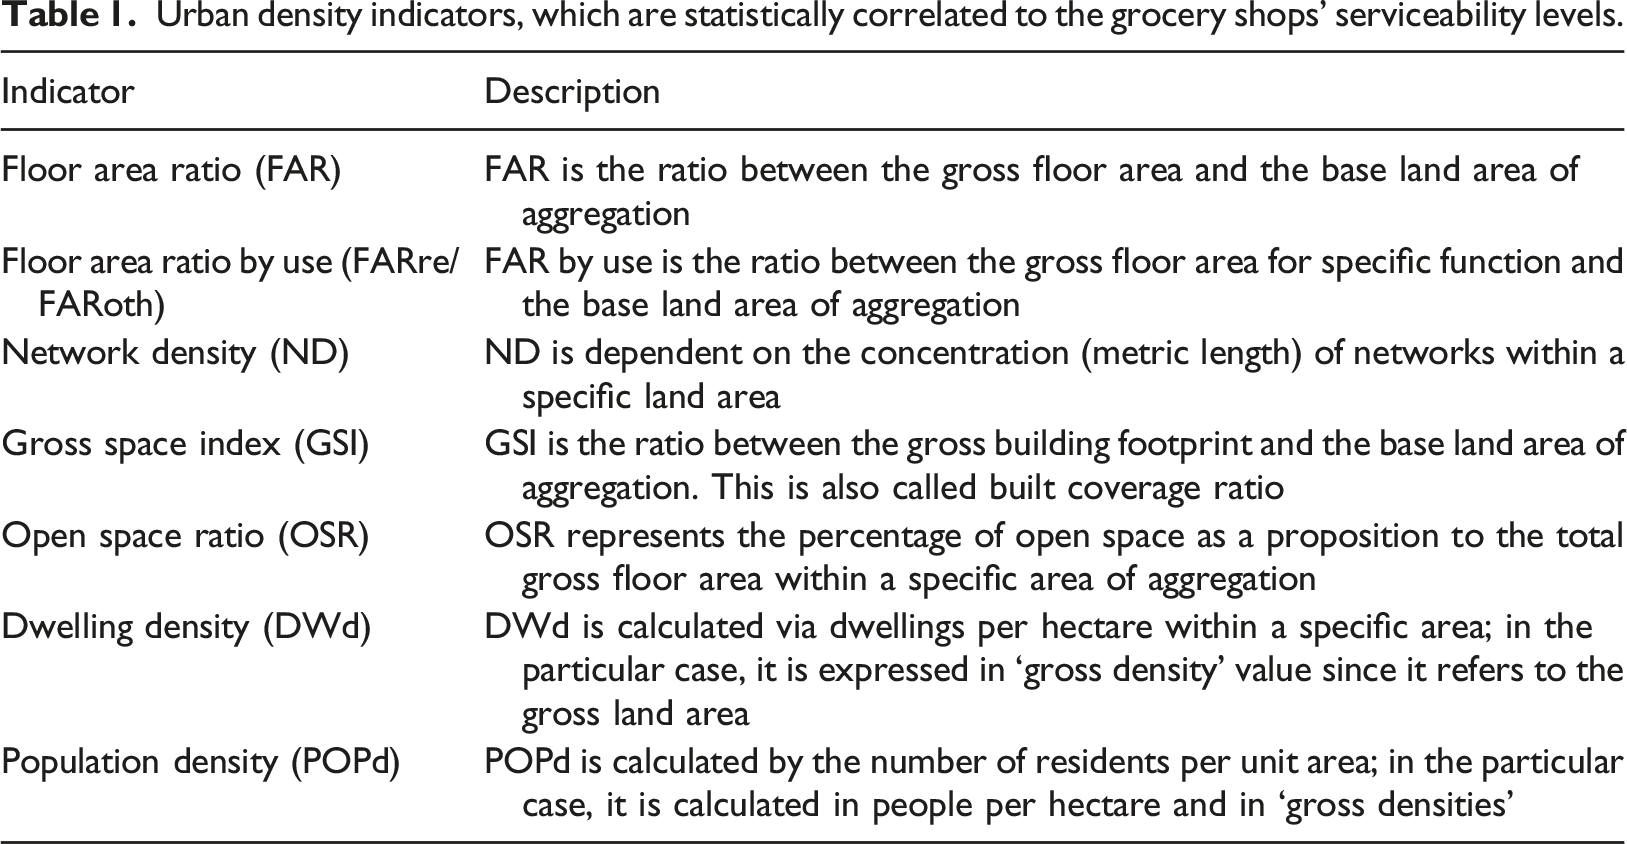
The data preparation includes collecting, integrating and preparing the utilised datasets from various sources (see Supp Table 1). The three most significant data processing operations, part of the preparatory step, are as follows: • Integration of FKB-Bygning and Cadaster building data datasets to set up the basis for calculating built densities indicators. • Modification of the transport networks (Elveg 2.0 dataset) to serve cycling and pedestrian accessibility analyses. • Cleaning up and categorising the OSM data (Norway-latest.osm) concerning service points of interest (POIs), that is, the grocery shops within Stavanger MA. Urban density indicators, which are statistically correlated to the grocery shops' serviceability levels.
Section 1 of the paper’s Supplementary Materials provides further details regarding these operations, including specific data processing of the original datasets and the identified inconsistencies concerning them.
Processing GIS analysis
The second step of the research process is completely implemented within the ArcGIS environment. It consists of the execution of subsequent operations: • Running Network Analyst to estimate service areas around the selected POIs within 10-minute isochrones. • Processing the overlays of the service areas of each POI to evaluate serviceability levels for the whole geographic extent of the Stаvanger MA. • Combining the service area estimation, census data and building characteristics.
The following paragraphs describe in detail these actions. Section 2 of the paper’s Supplementary Materials provides additional information.
Running the network analysis
First, we create a network dataset based on the adapted transport infrastructure data (Elveg 2.0) for cycling and walking. As part of this operation, the model’s primary analytical parameter is also set up: travel time for passing through each network’s segment.
The research framework specifies a single travel time threshold of 10 minutes each way but identifies two mobility modes, that is, walking and cycling. Thus, the need to define different average speeds for the individual transport modes. The average speeds we use in these calculations are based on the works of Schaap et al. (2016), Pritchard et al. (2019) and Lin et al. (2008). The former estimate a walking speed of 5 km/h as an average for healthy adults, while based on the observations of the three studies, an average cycling speed of 15 km/h for non-electric bikes can be adopted in the context of Norway. We rely on these speeds as constant variables to calculate travel ranges since we consider the grocery trips as 'necessary’ activities (Gehl, 2010) and examine them as solely purpose trips.
As a result of using a constant average speed of 5 km/h for walking and 15 km/h for cycling and considering the absence of time barriers in the calculations, the 10-minute isochrones convert into two distance (reach) ranges of 833 m and 2500 m, respectively. Then, two service area polygons away from each facility of interest are generated, referring to the distance ranges. This operation generates two initial polygon shapefiles, one for each mobility mode, including 275 shapes that equal the number of POIs, representing the 10-minute service reach away from each object by foot and bike.
Estimating the level of serviceability
After the service areas for each object (POI) are calculated upon the street network for the two mobility modes, we execute an overlay analysis to process the data further. This is necessary to deal with the numerous overlapping polygons (service areas around each POI). The greater the number of overlapping polygons, the greater the serviceability within 10-minute isochrones for the respective area is. Traditionally, the overlay analysis within the ArcGIS environment is a method to combine different inputs and generate an integrated value concerning optimal site selection or suitability modelling. We develop a simplified overlay analysis for this study since the input is technically coherent and integrating different information is not required. As a result, these operations allow us to specify the number of POIs reached from each geographic location within the Stаvanger MA. This way, we can develop analytical correlations between serviceability levels and other urban characteristics, such as density indicators.
The process is executed for walking and cycling separately. A full description of the operations and steps within the ArcGIS environment is presented in Section 2 of the accompanying Supplementary Materials. The latter also includes the description regarding the process of correlating the estimated serviceability, the incorporated census data and building characteristics within the ArcGIS environment (see Supplementary Materials Section 2C). This technical step is key in achieving the study’s objectives to analyse the primary relationship of interest between serviceability levels of grocery shops and urban densities.
Processing the linear regressions
After the GIS operations are managed as described in the previous section, the last analytic step is processing a series of linear regressions. This activity is realised by employing the estimated levels of serviceability as a dependent variable (DV) and eight urban density indicators as independent variables (IVs). The latter are outlined in Table 1 and presented in detail in Section 3 of the Supplementary Materials. To reduce the shortcomings of the undertaken approach, we execute the multiple regressions by relating the level of serviceability by walking and cycling as two individual DVs to each of the urban density indicators (IVs) separately. In its essence, this analytical step aims at exploring statistically to what extent the levels of serviceability of grocery shops can be associated with the concentrations of residents, the urban spatial form or its functions.
Results
The following section presents the outcomes from the data processing. They are further specified to reveal practical insights regarding the 10-minute isochrone for grocery shops within Stavanger MA. Thus, we organise the results in two main perspectives: • Serviceability within the Stavanger MA, based on the POIs (grocery shops), generated service areas and processed overlay analysis; • Statistical correlations between grocery shops' serviceability levels and urban densities parameters.
Serviceability of grocery shops - coverage and number of POIs reached
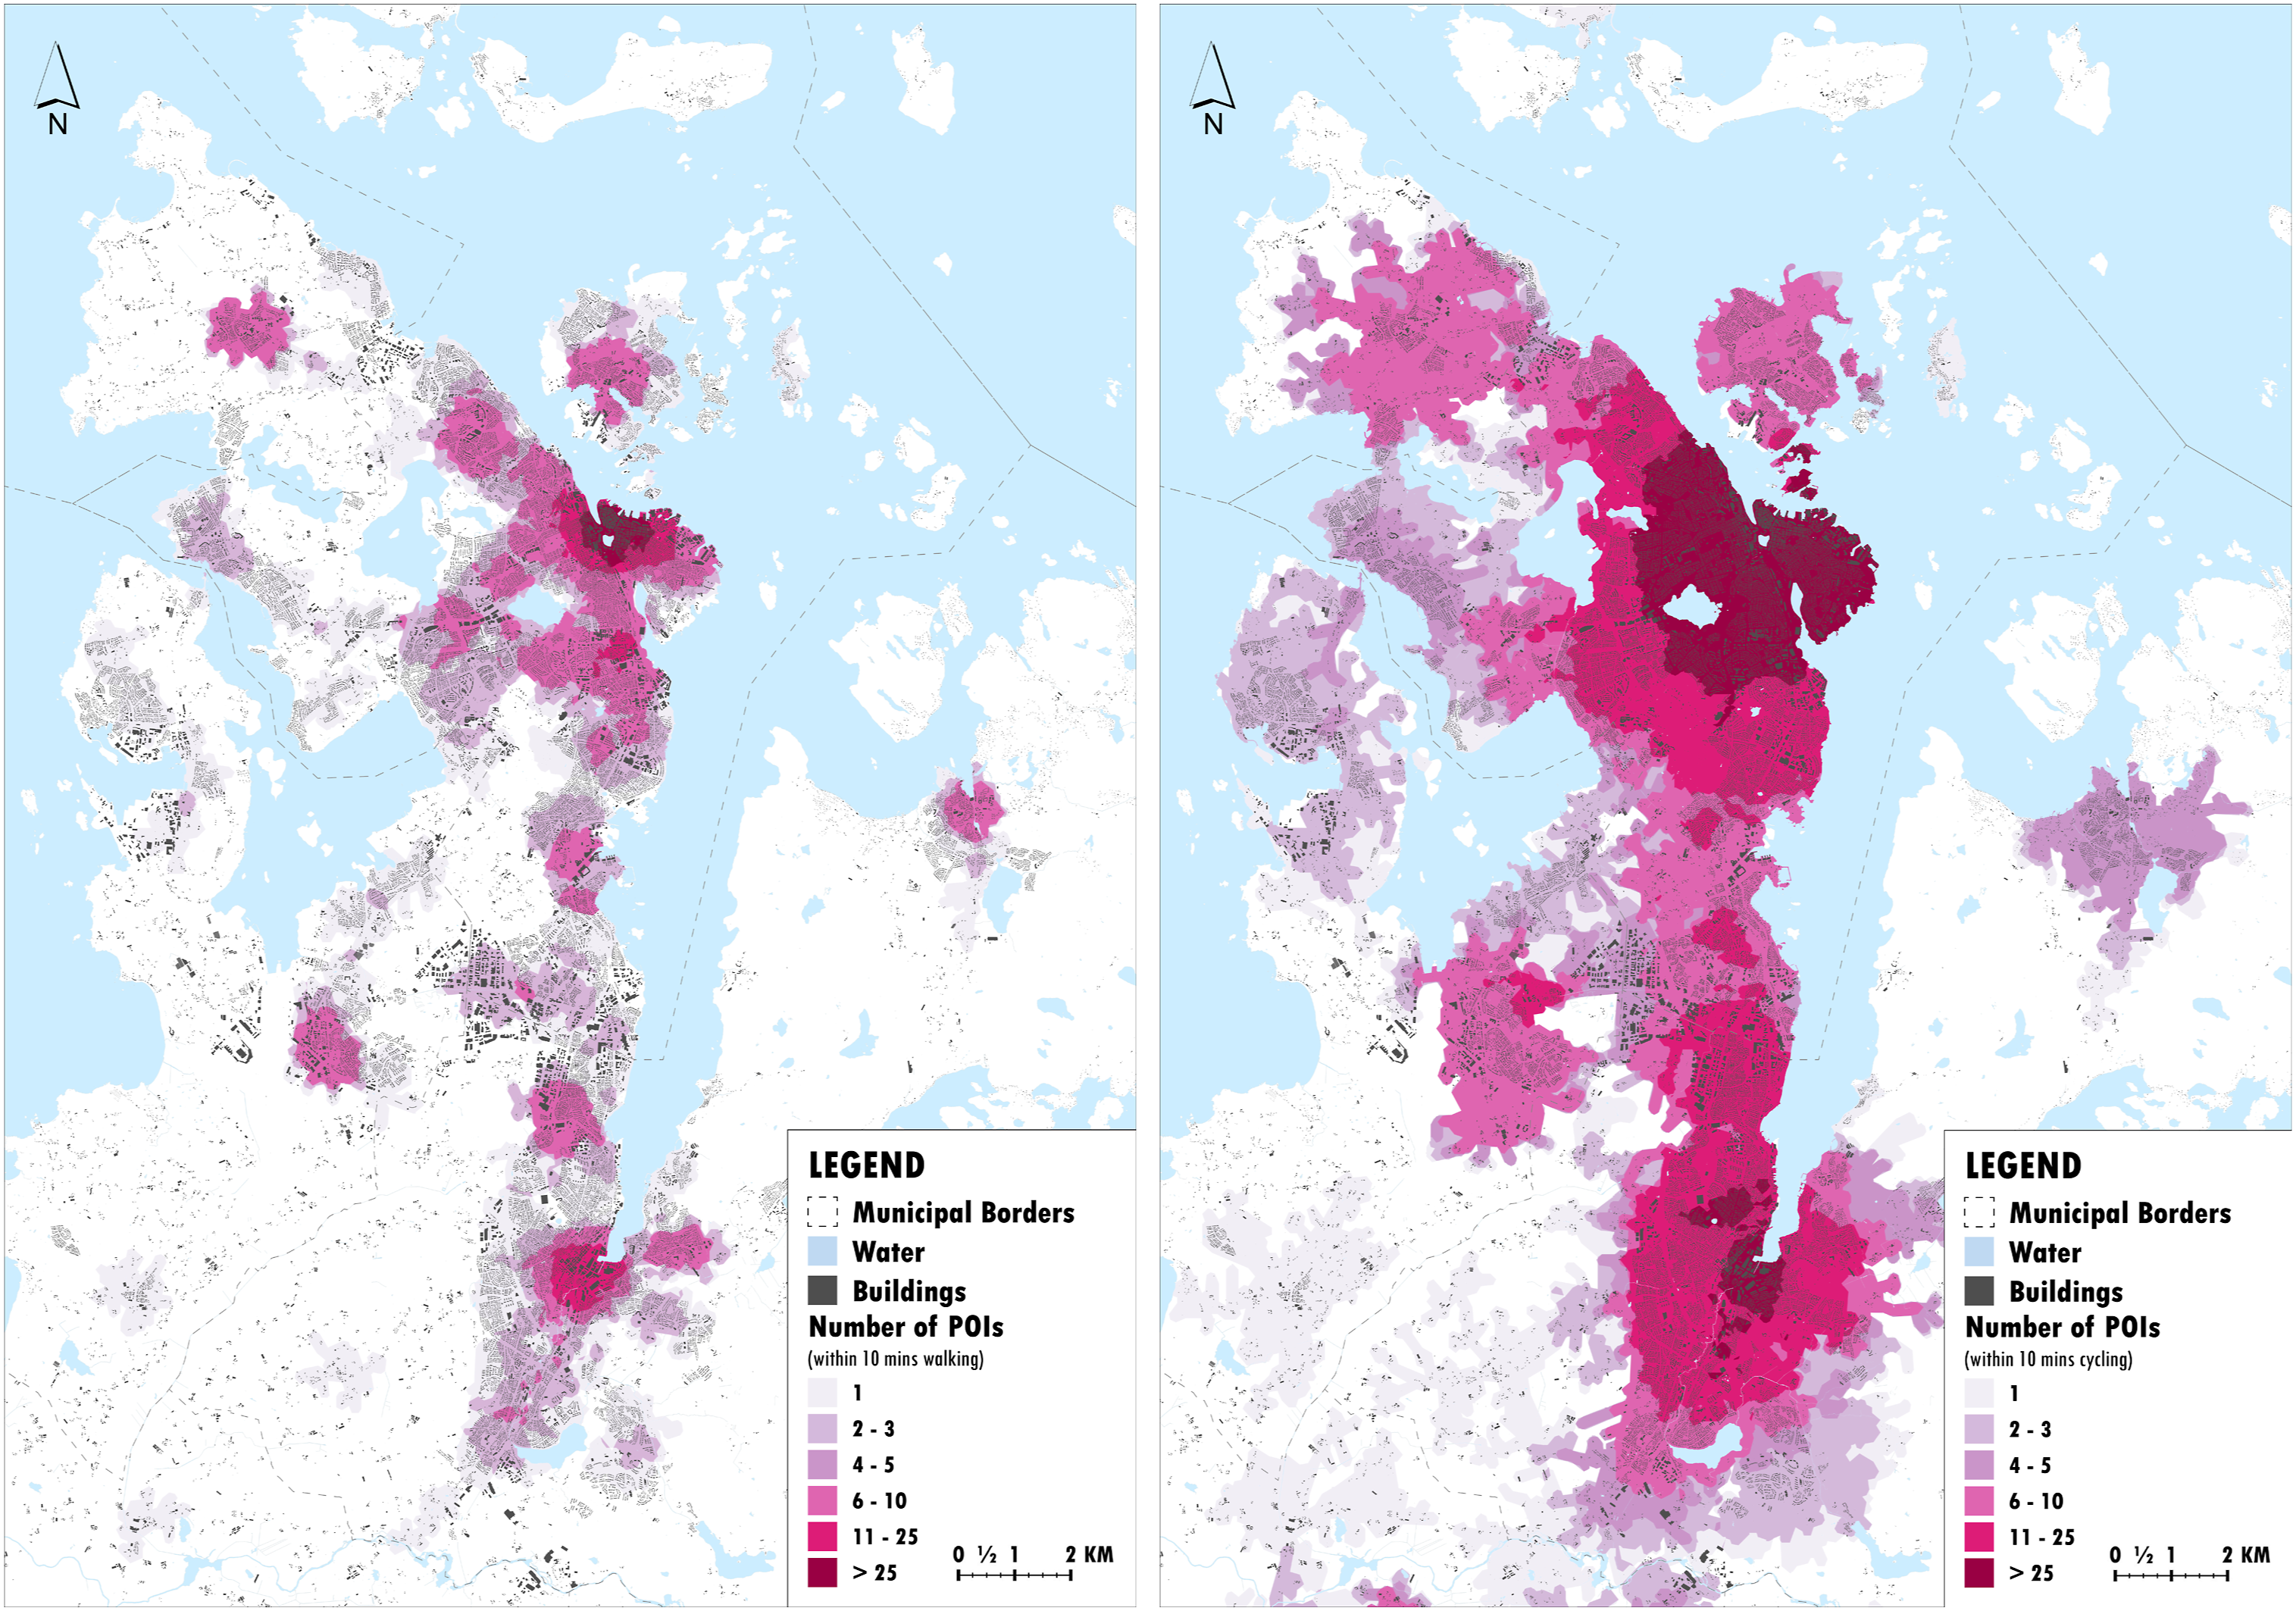
The first perspective focuses on the results achieved through the proposed research method described in section 'Processing GIS analysis'. Figures 1 and 2 illustrate the visual outcome from the computations, as particular highlights for the core of the Stavanger MA (the municipality of Stavanger and its surroundings) are included to enhance the result representations. To produce the different maps, we apply further classifications of the processed data. Figures 1 and 2 refer to the thresholds of serviceability levels or the number of POIs reached within 10-minutes. Based on the generated service area polygons around the grocery shops; we define the areas as such with access to 1 object within 10-minutes of walking (833 m) and cycling (2500 m), and respectively, 2–3, 4–5, 6–10, 11–25 and more of 25 objects within the same time isochrone. The representation also depicts the areas where there are no objects reached within 10 minutes. A representation of serviceability of grocery shops in the Stavanger MA within 10-minute isochrones of walking (left) cycling (right). A representation of serviceability of grocery shops in the core of Stavanger MA within 10-minute isochrones of walking (left) cycling (right).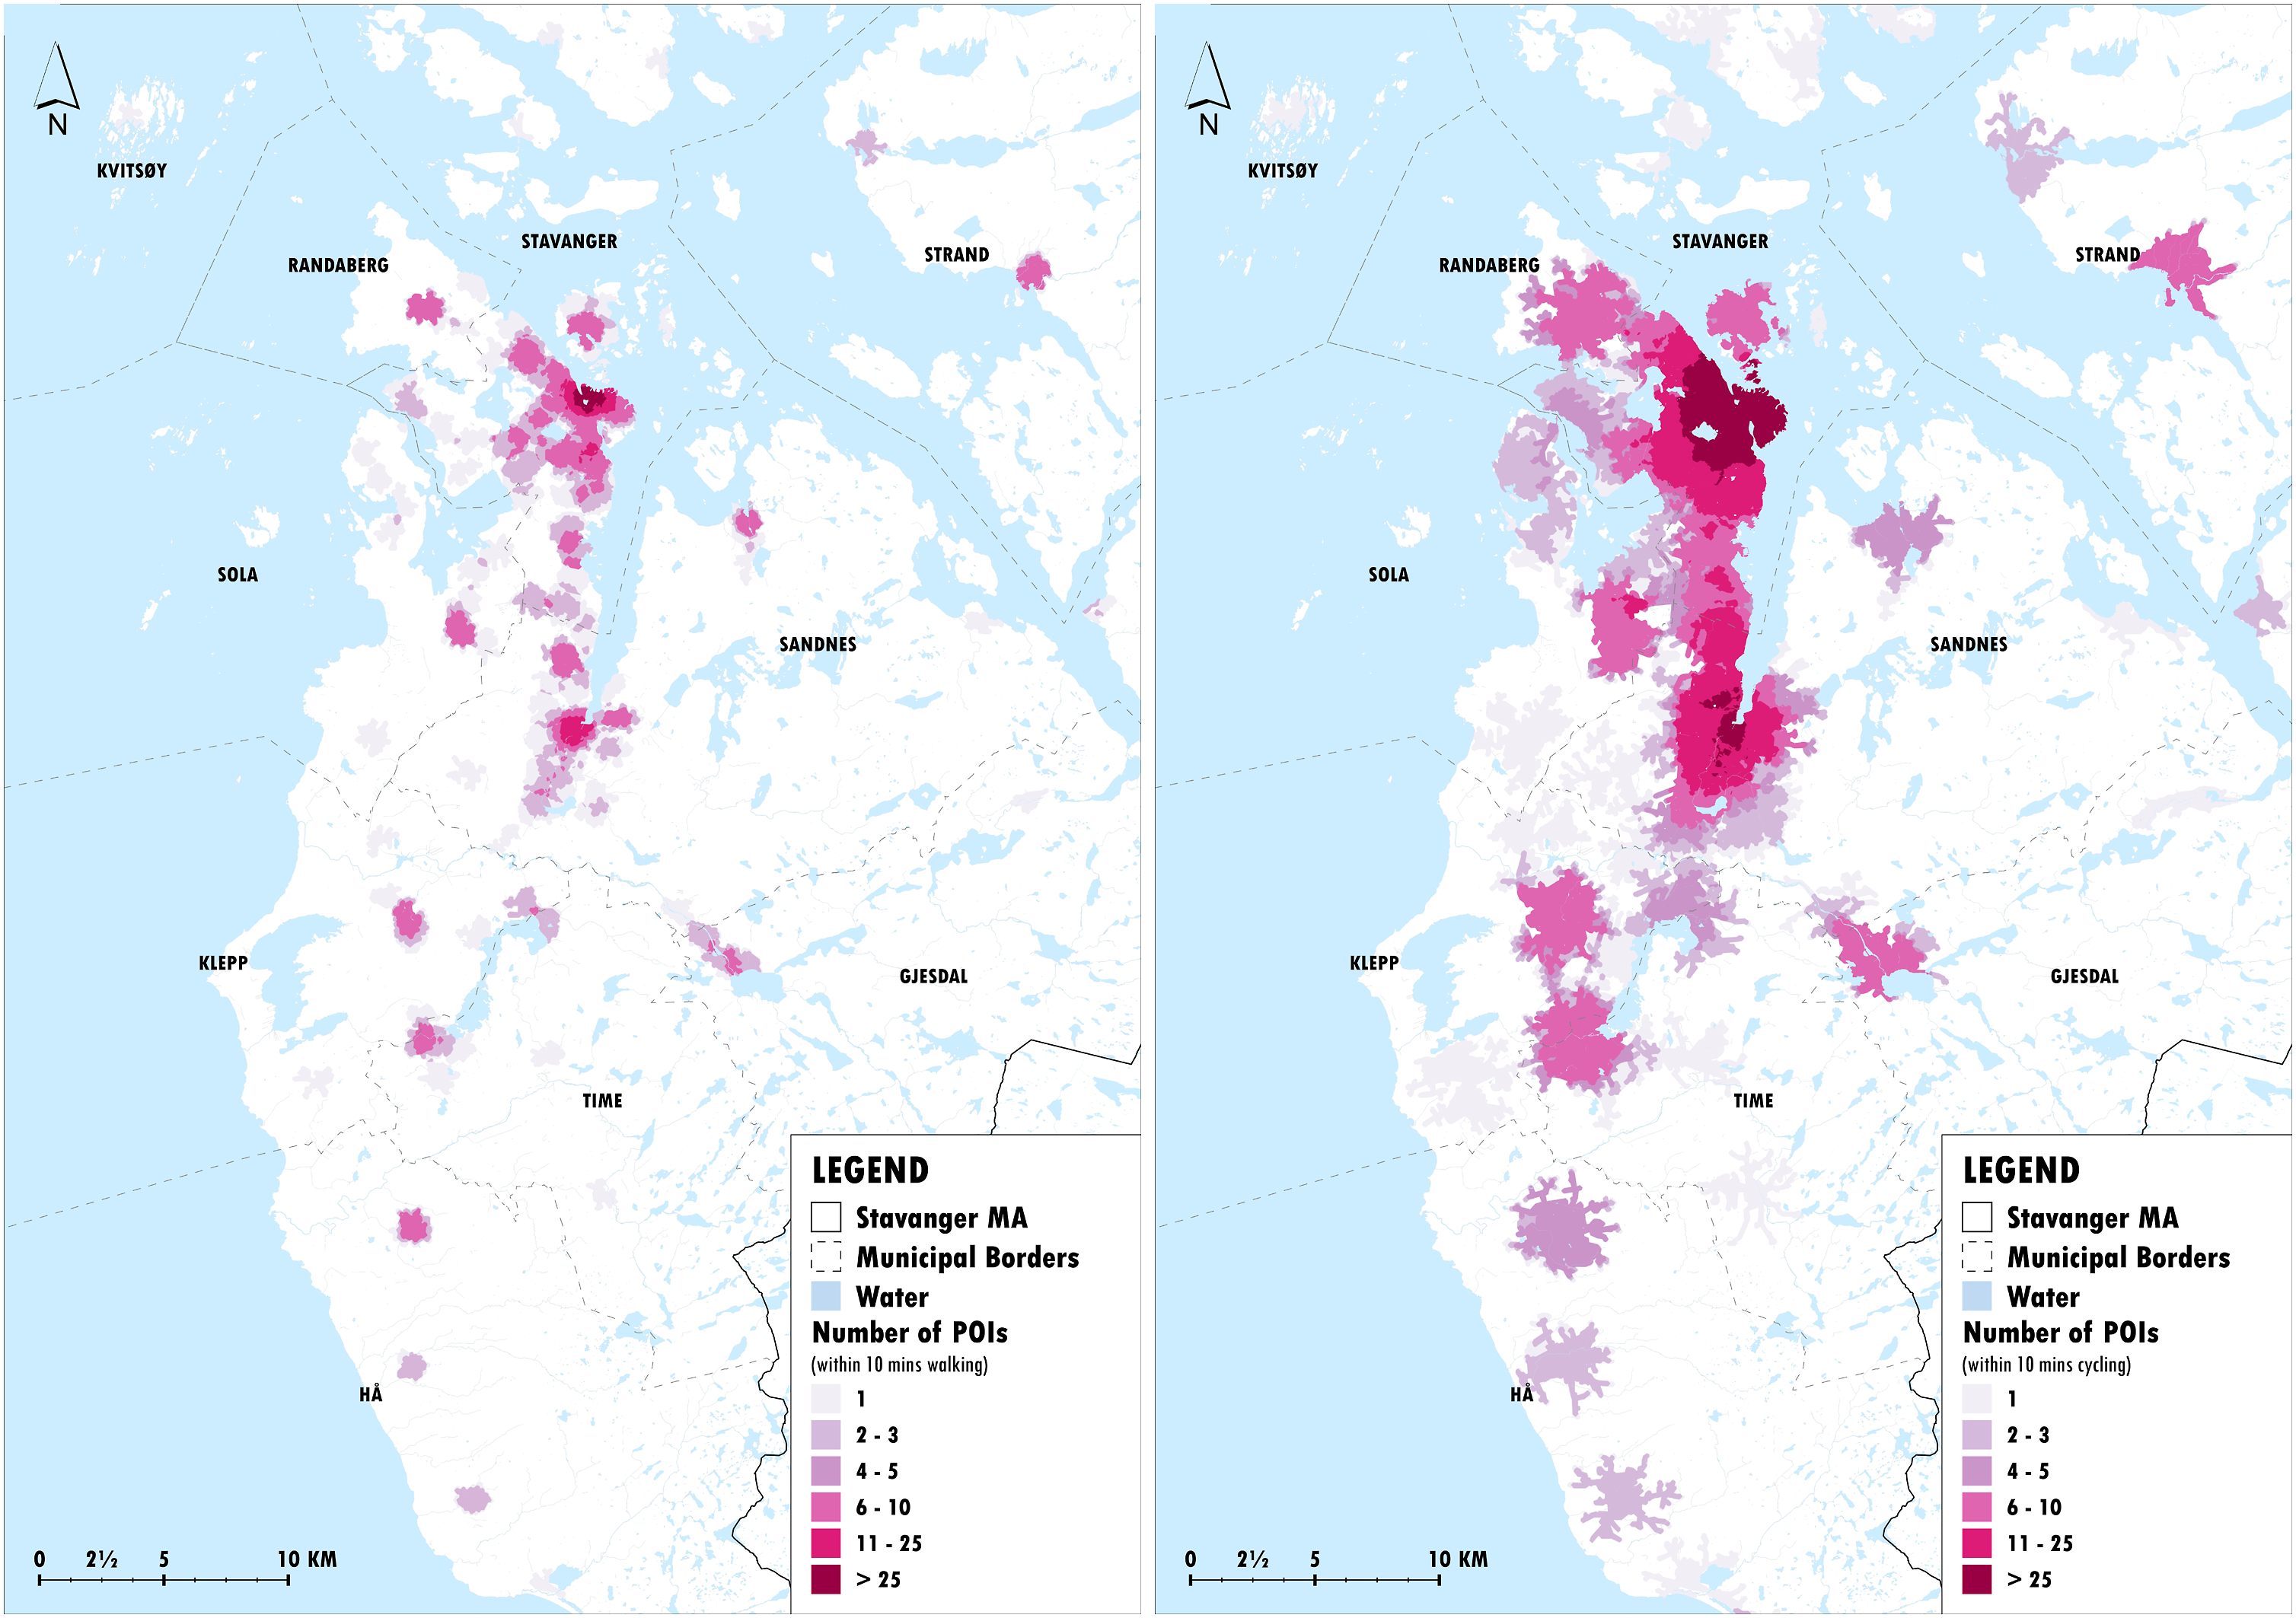
Spatial coverage serviced population and technical details of the time isochrones of interest away from grocery shops, organised regarding the defined classes.
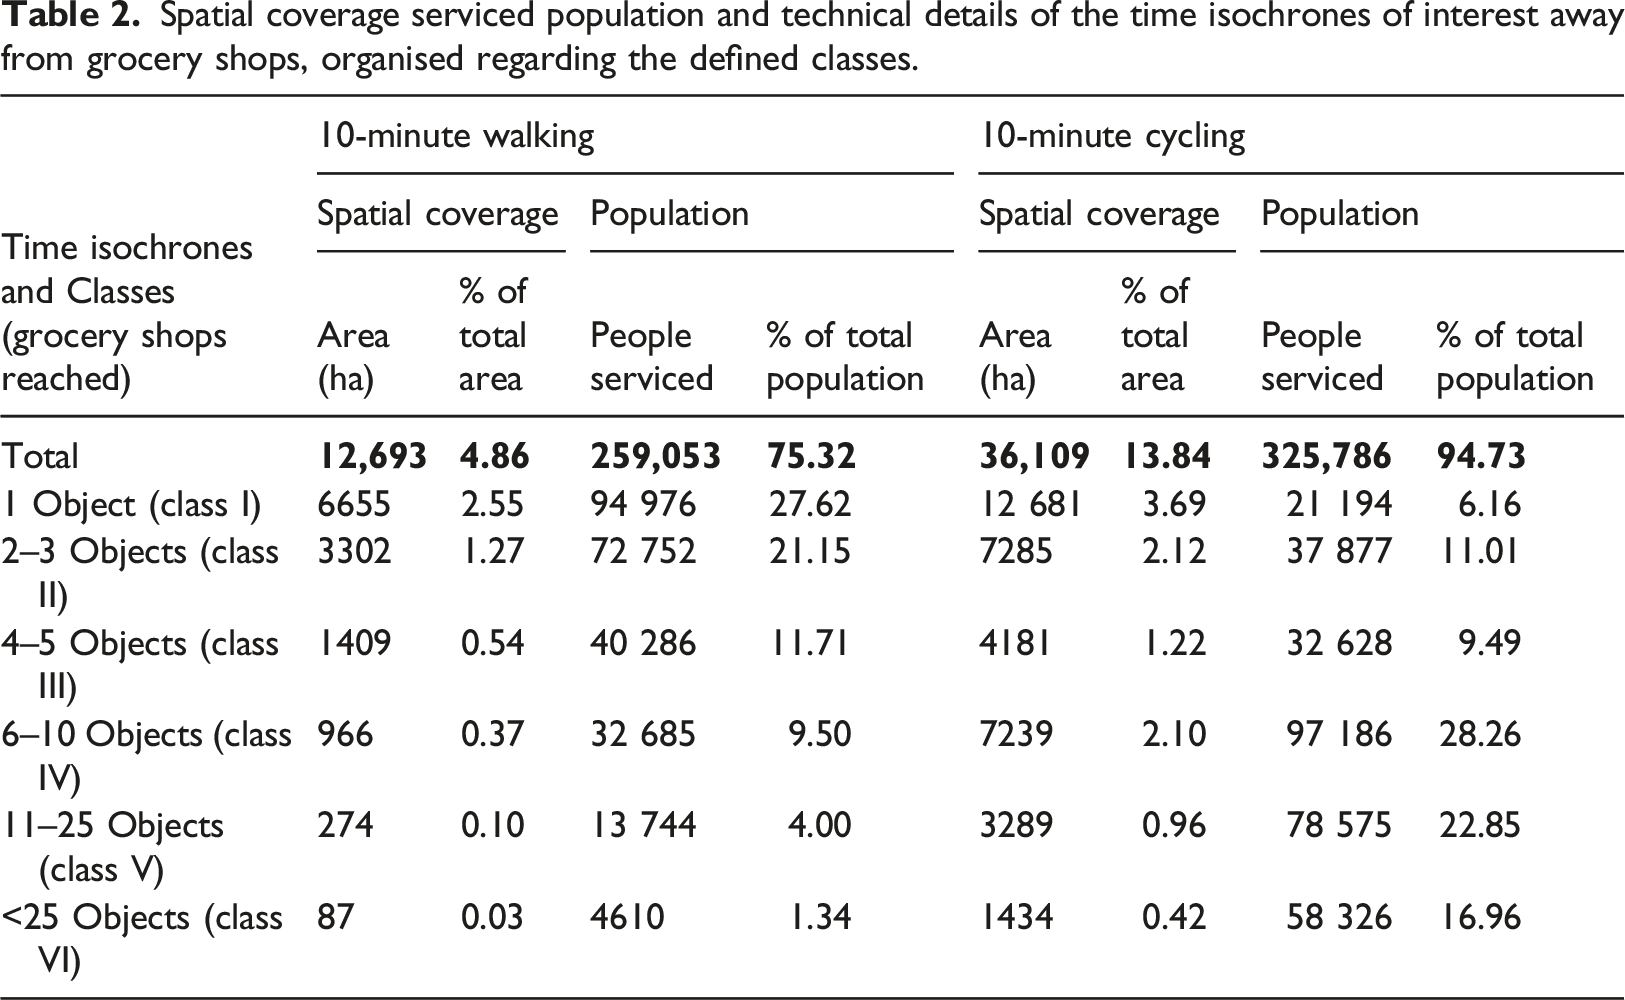
Based on the generated results and Stavanger’s spatial characteristics, it seems reasonable to focus on interpreting the results of serviced inhabitants within the 10-minute isochrones. Then, it is worth outlining that 60% (208 014) of the citizens have access to five or fewer shops within 10-minutes by foot. As Table 2 illustrates, this estimates around 15% of the population with access to more than five shops, 5% to more than 10 and just 1.3% with access to more than 25 shops within this isochrone. This separation is essential to be outlined in the analysis within the context. Due to the smaller sizes of supermarkets in Norway, people tend to use several shops to satisfy their needs.
Looking at the generated cycling isochrone, the distribution of population regarding its levels of serviceability look different. A little over a quarter of the people, 27% (91 699), can reach less than five shops within 10 minutes of cycling, while a more significant proportion, 68% (234 000), can access six or more grocery shops. The extreme range appears significantly different compared to walking accessibility. Around 17% (58 326) can reach more than 25 shops within 10 minutes. These results reveal significant differences in access to grocery shops and serviceability levels, depending on the utilised mobility mode in favour of cycling.
Linear regressions of serviceability levels with density indicators
As described in the methodological section, a series of linear regressions between grocery shops' serviceability levels and urban densities indicators (FAR, GSI, ND, OSR, DWd, POPd, FARre and FARoth) are executed. They are based on the coefficient of determination (R2) and the probability value (p-value). The former serves as an indicator of the model’s strength, while the latter represents the probability that the observed relationship might have occurred by random chance. In other words, R2 identifies to what extent any of the density indicators is associated with grocery shops' serviceability levels, whereas the p-value indicates whether these empirical relationships are statistically significant. The details of the regression analysis are presented in Table 3, as the results illustrate the following correlations: • The strongest relationship between the level of serviceability within 10-minutes of both walking and cycling is with the variable of network density (ND). • There is a strong relationship between the intensities of grocery shops' provisions and floor area ratio (FAR) within walking and cycling time isochrones. Regarding the variables of gross space index (GSI) and open space ratio (OSR), the relationship with serviceability level is moderate for both walking and cycling. • Considering the population density (POPd), residential floor area ratio (FARre) and the intensities of grocery shops' serviceability, there is a strong relationship within 10-minute cycling isochrone. The correlations between these density indicators and the serviceability levels are statistically insignificant for walking. Furthermore, there is also a strong relationship between the number of reachable shops and dwelling density (DWd) within 10 minutes of cycling. In contrast, this relationship is estimated as weak within 10 minutes of walking. • In respect to the relationship between floor area ratio for non-residential uses (FARoth) and the number of accessible grocery shops within 10 minutes, there is a moderate relationship in the case of walking and a weaker one in the case of cycling. Coefficient of determination (R2) and p-value concerning the level of grocery shops' serviceability and urban density indicators for the two time isochrones of interest.
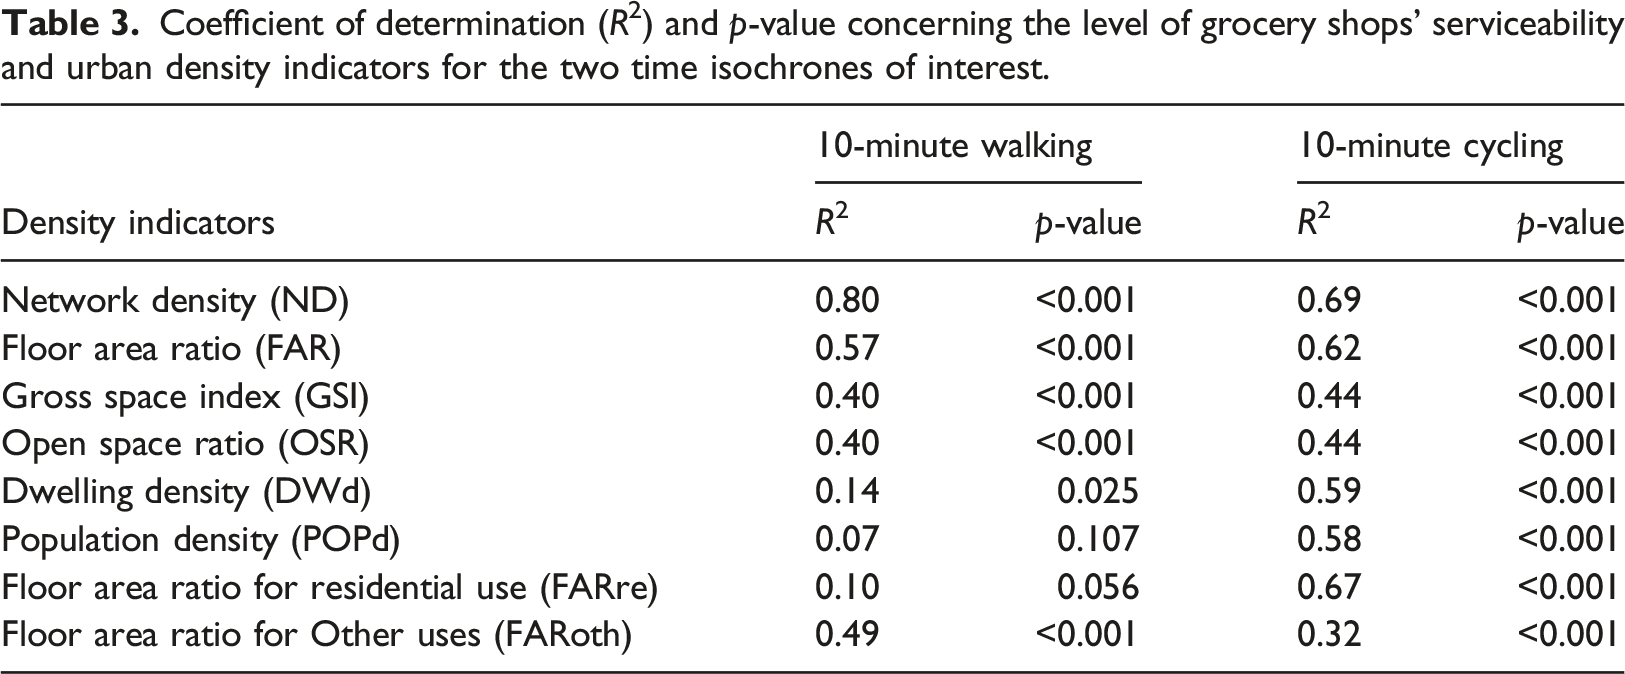
The results presented above demonstrate several interesting notions worth outlining. First of all, most of the drawn correlations are identified as statistically significant with a p-value <0.05; excl. the correlations of serviceability levels with POPd (p = 0.107) and FARre (p = 0.056) in the case of 10 minutes walking. Second, both in terms of walking and cycling, the strongest relationship between the number of accessible grocery shops is with the indicator of ND. This is somewhat logical because the service areas are generated along the network. Still, this result also refers to the importance of permeability of urban form that can enhance highly flexible mobility modes. Third, we can outline that the location of the grocery shops correlates consistently with the density of the buildings, expressed by the indicator FAR within 10 minutes travel time, regardless of the mobility mode of interest. Fourth, the results provide us with an intriguing differentiation concerning the relationship between the intensities of grocery shops' provisions and residential densities (expressed in DWd, POPd and FARre) within the time isochrone of cycling in comparison to walking. In the context of cycling, there is a strong relationship underlining the notion that the grocery shops are positioned favourably in respect to residential densities. In contrast, the results reveal a much weaker relationship between the accessibility to grocery shops and residential densities for the travel time of 10 minutes walking. Last but not least, we can develop this notion even further by looking at the strength of relationships between serviceability levels and FARoth indicator. They illustrate a significantly more robust connection between the access to POIs with concentrations of other uses (FARoth) than DWd when we examine the isochrone of 10 minutes walking. On the contrary, for cycling, the serviceability level correlates weaker with FARoth than with residential densities (POPd, DWd and FARre).
Spatial correlation of serviceability levels with other urban parameters
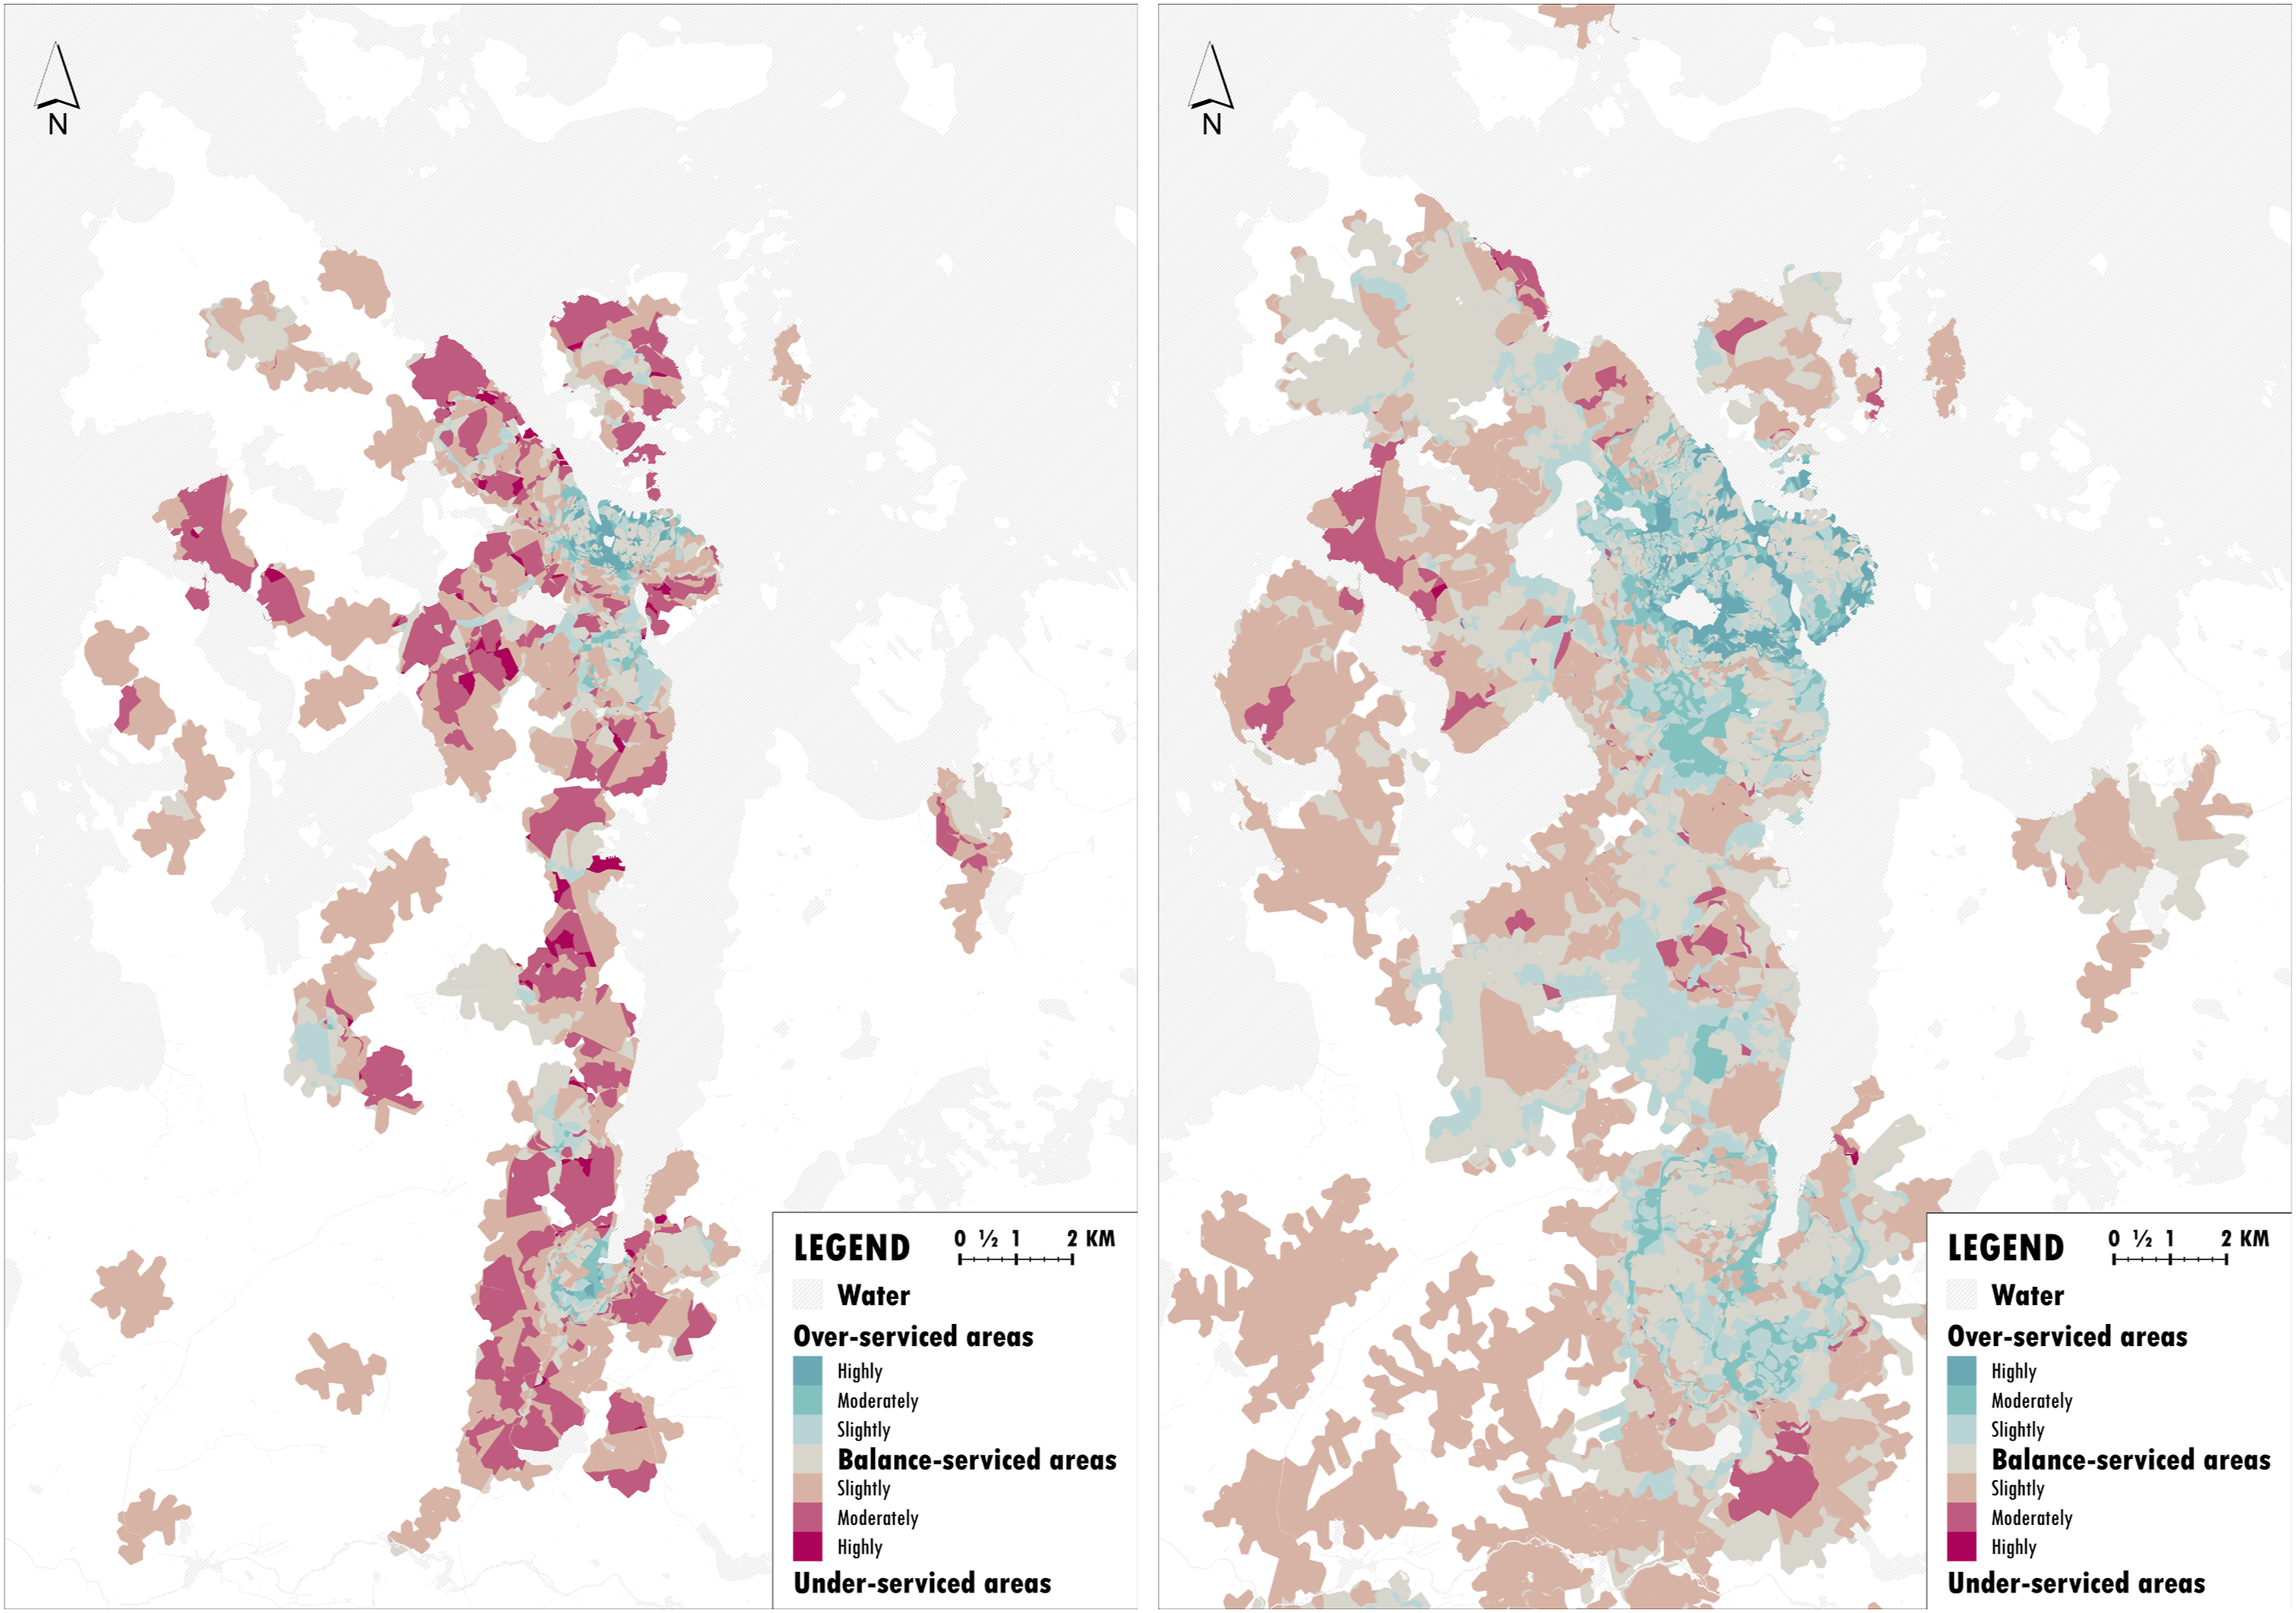
The additional potential of the approach is to interrelate the different urban parameters by visualising their relationship spatially. Figures 3 and 4 illustrate a bivariate representation of the processed data, as it cross-refers the levels of grocery shops' serviceability and the concentrations of people serviced within the 10-minute isochrones. For this article, these two parameters are selected as exemplary. Still, it is essential to mention that one can utilise the approach with any particular urban aspect at hand, representing an interest to correlate. We use a quantile classification method to distribute the data regarding both parameters, for example, the number of grocery shops reached (Y) and the population densities (X) within each polygon. This classification approach ensures well-suited, linearly distributed data, where each class contains an equal number of features. Based on this quantile matrix, we can identify the balance-serviced areas, as well as the over/under-serviced territories. To support the clarity of the approach while executing this correlation, we add the threshold values, which define the different quantiles. This is done both for walking and cycling isochrones, respectively. A bivariate representation of the serviceability of grocery shops intertwined with the population in the Stavanger MA within 10-minute isochrones of walking (left) cycling (right). A bivariate representation of the serviceability of grocery shops intertwined with the population in the core of Stavanger MA within 10-minute isochrones of walking (left) cycling (right).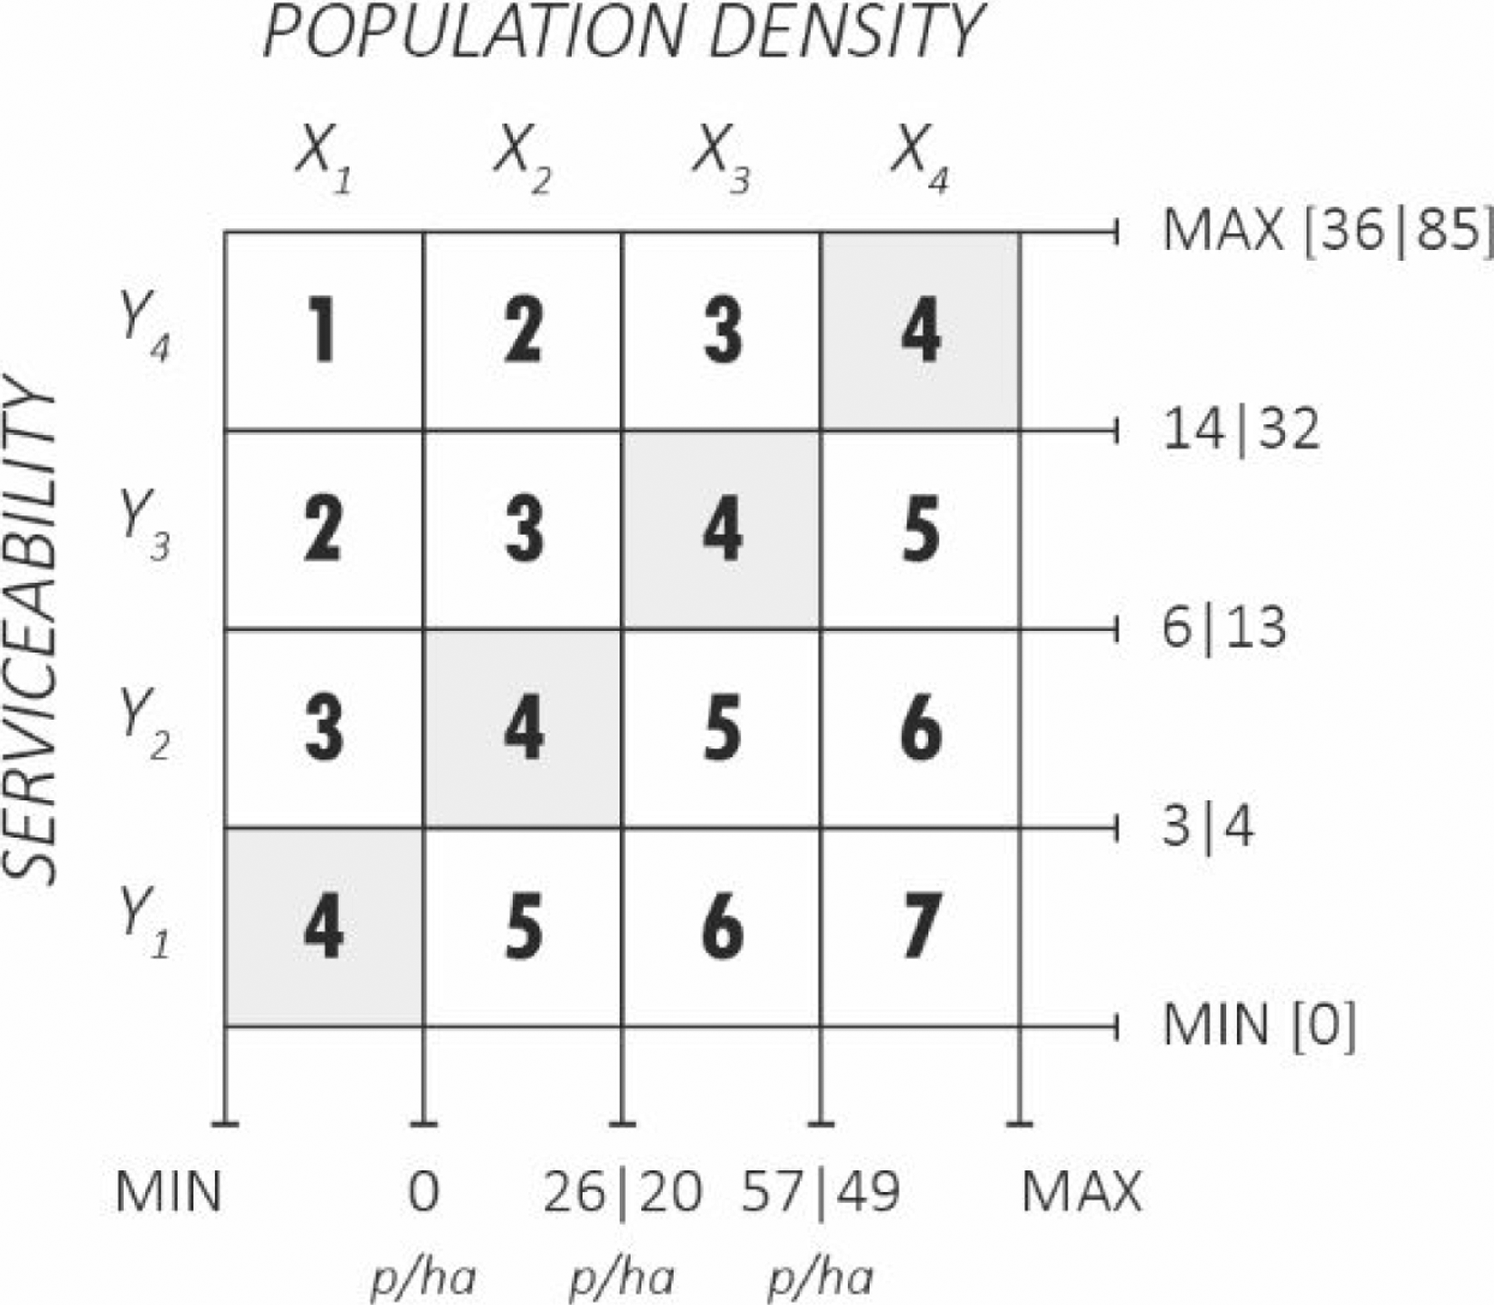
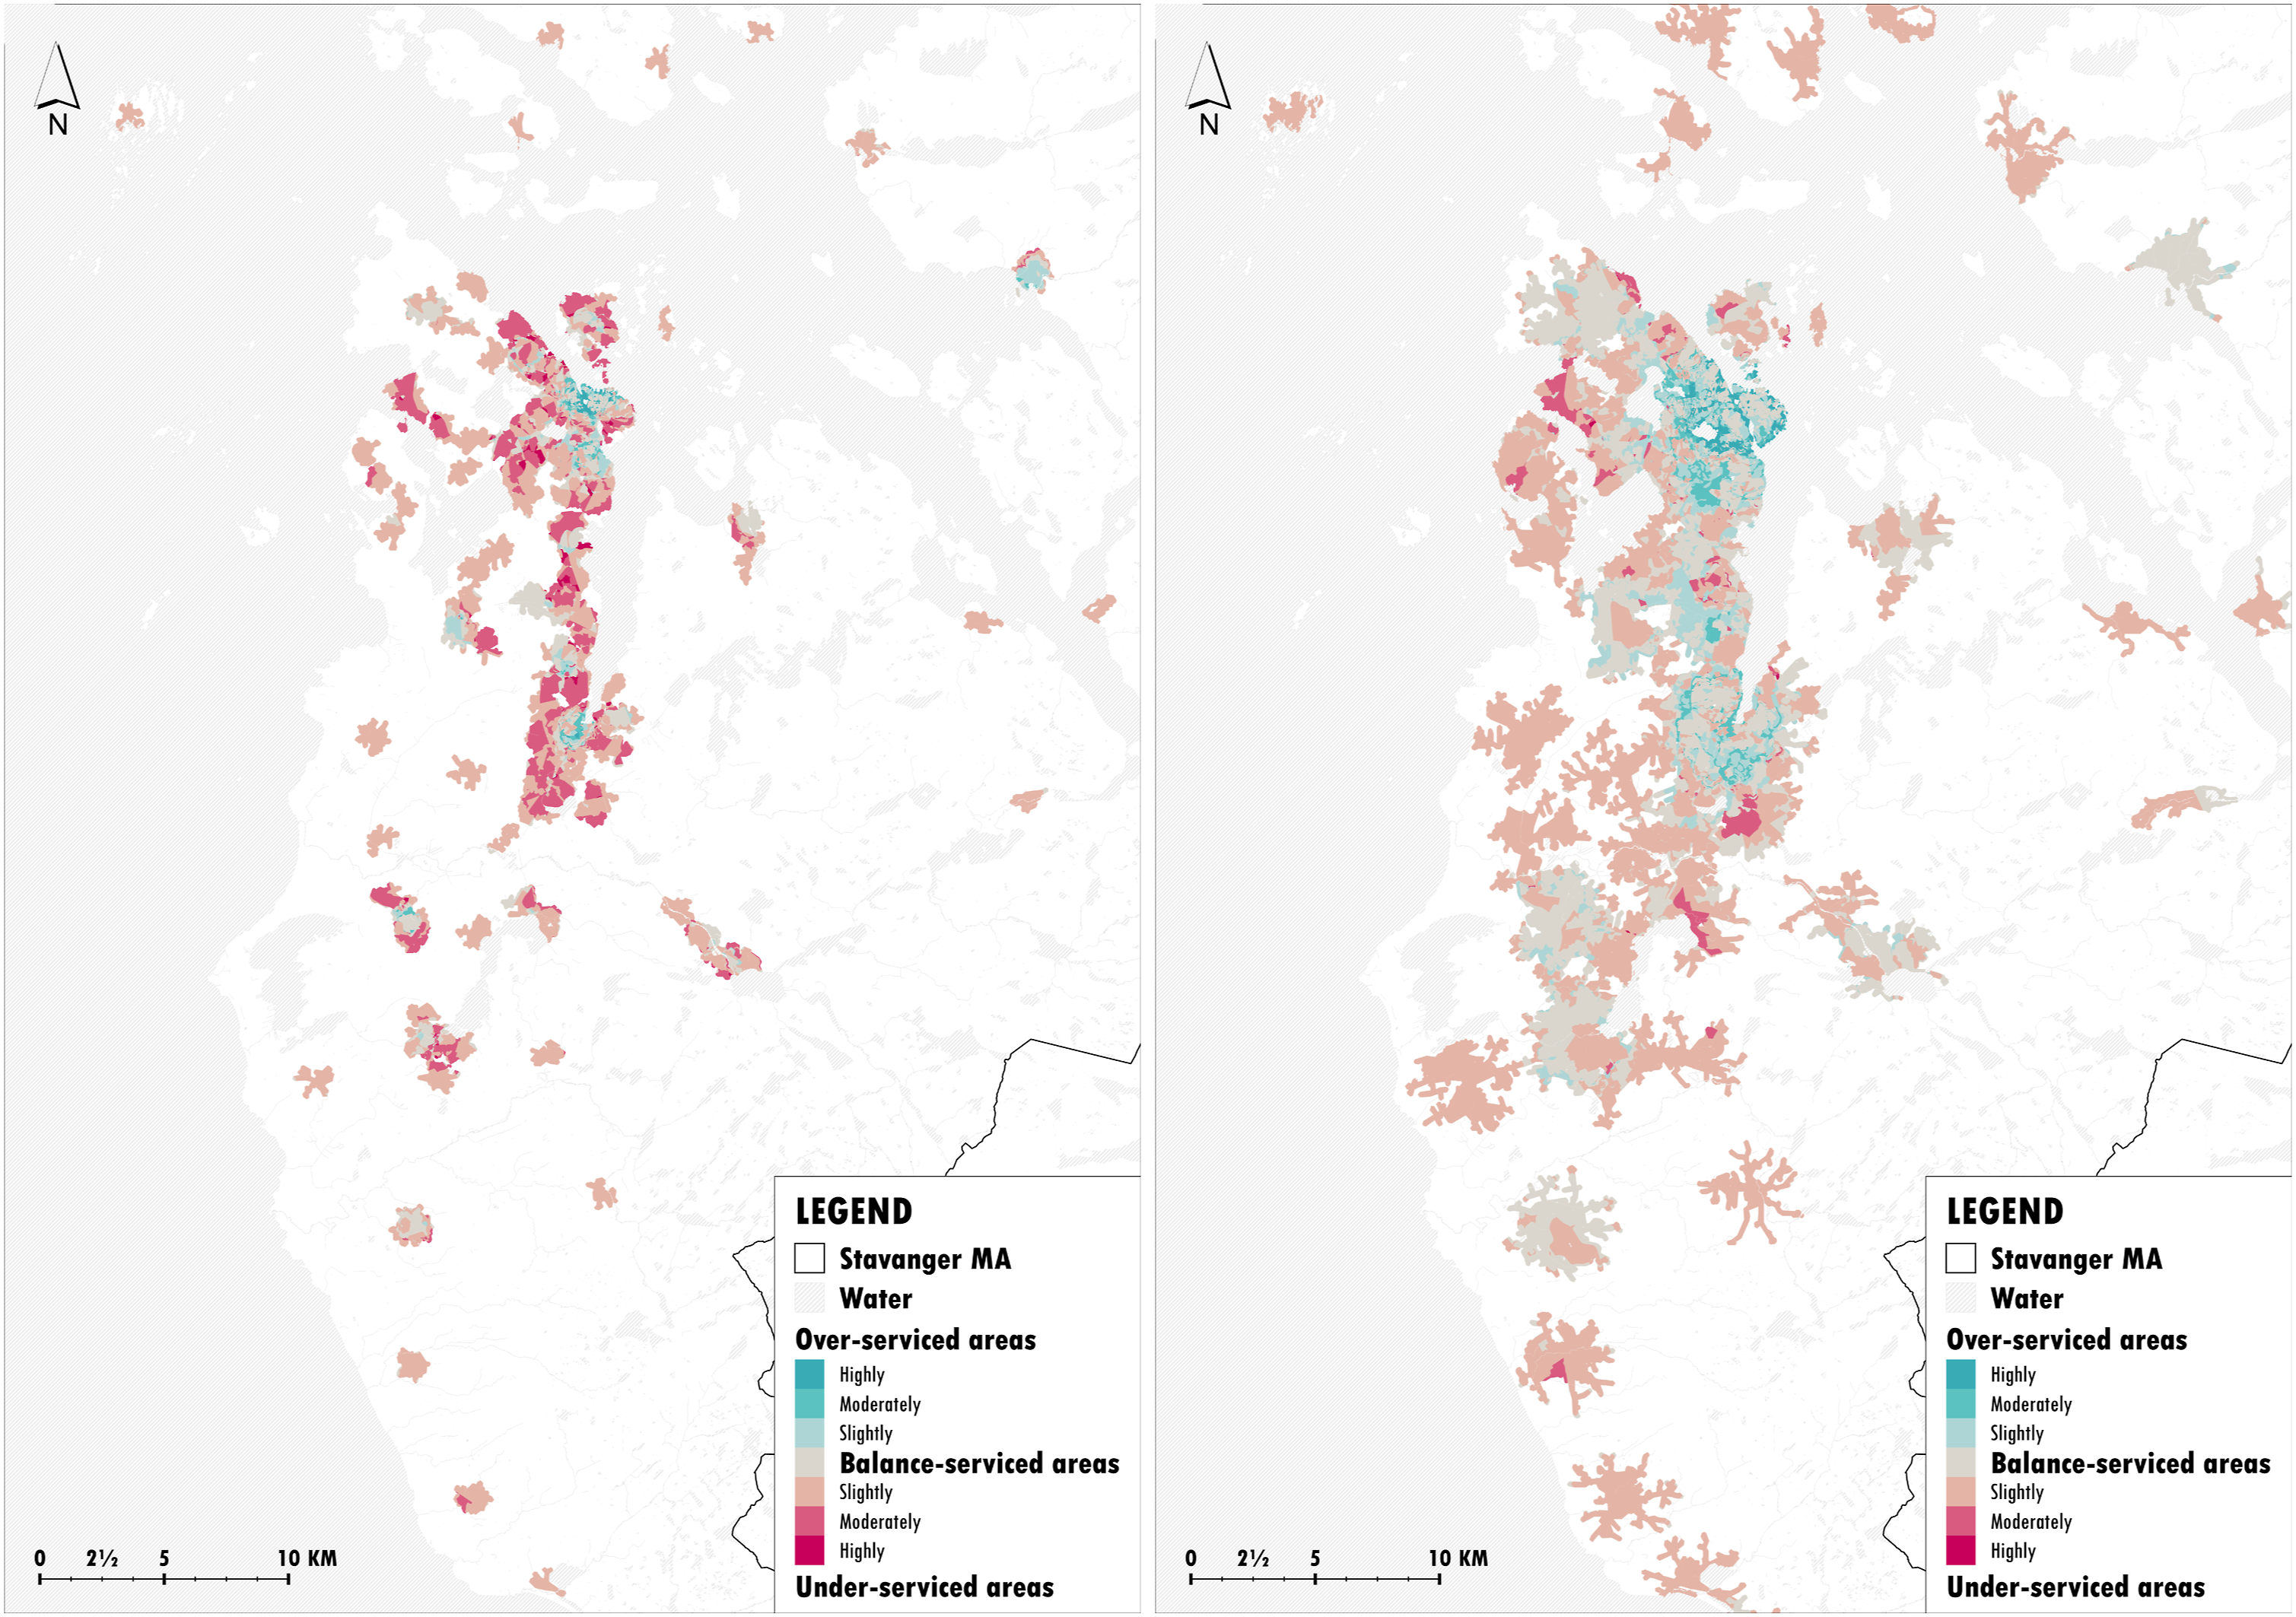
This representation approach allows exploring possible associations between different variables. Moreover, it makes visible the spatial correlations between the selected attributes and facilitates a generation of empirical assumptions bound to the particular context. For example, analysing Figures 3 and 4, one can trace specific areas which can be defined as over-serviced or under-serviced based on the bivariate matrix. However, to develop comprehensive claims in this regard, one should consider other parameters, for example, the location of urban parks, protected areas, amount of jobs, visitors, etc.
Discussion
This study implements a yardstick to quantify and map isochrones to access urban services. The more isochrones overlapped in a given area, the highest the serviceability level. The approach also correlates this estimation with urban characteristics such as built density and population density. Moreover, the study visualises the explored correlations through a bivariate representation of the grocery shops' serviceability and population densities. By doing so, this approach can be deployed to implement and monitor urban planning strategies originating from the concept of time geography, such as 20, 15 and 10-minute cities proposed in the works of Da Silva et al. (2020), Levinson (2020), McNeil (2011) and Moreno et al. (2021). As demonstrated, the contemporary technical capacities can allow us to do so at a large, metropolitan scale even through publicly accessible data. Based on the perspective of time-oriented planning, the approach proposes a method for measuring the efficiencies and functionality of cities and eventually optimising the built environment or service provision. We use access to grocery shops within 10 minutes of walking and cycling as an example. This approach allows to elaborate further on the level of serviceability of these objects and correlate the results with other urban characteristics, such as demographics and spatial densities. The results are presented visually, for example, the serviceability maps (Figures 1 and 2) and bivariate maps (Figures 3 and 4), and numerically (Tables 2 and 3).
This empirical exploration in the context of Stavanger MA allows us to reflect on specific strategies to improve the distribution of urban services. Likewise, it can indicate where to enhance the pedestrian and bicycle infrastructure. Thus, the study can also contribute to the work of Øksenholt et al. (2016) to identify functional service ranges for green mobility modes in Norwegian cities. By interrelating density indicators and serviceability levels upon the existing networks, the analysis can contrast the intricate relationships between density and connectivity that enrich urban space. This could serve as a basis for quantitatively analysing many of the urban quality principles outlined in the works of Gehl (2010), Speck (2012), Sim (2019) and other theorists of urban quality.
The results highlight the importance of the permeability of spatial form to increase connectivity and accessibility. The model displays high correlations between serviceability and network density for walking and cycling. Although a similar relationship between the density of the built environment expressed in FAR and the number of grocery shops reached by cycling and walking, there is also a significant discrepancy. Indeed, the correlation between residential densities and serviceability seems robust for cycling but weak for walking. In other words, the network of grocery shops within Stavanger MA is organised so that it does not correspond with where people live, considering the threshold of 10 minutes walking. From this observation, one can argue that the urban form is structured unfavourable for people to do their domestic groceries on foot. On the contrary, the range of 10 minutes cycling seems to be very appropriate to ensure sufficient access to supermarkets regarding housing densities. However, the interconnectivity between serviceability and residential density is not the only factor determining the mobility choice for this service. Therefore, this claim can become a hypothesis to be further explored by looking at specific shops and observing the users' behaviour in future research.
Besides identifying specific relationships between the variables mentioned above, the study also offers an approach to visualise over/under-serviced areas through the bivariate representations of the analyses (Figures 3 and 4). This visualisation can help depict imbalances relevant for social equity and just distribution of resources in the urban space. In addition, focussing on measuring (the degree of) accessibility to particular POIs, this analysis can become a tool for planning more sustainable mobility (Bannister, 2008) based on cycling and walking. This approach constitutes a rounded perspective beyond the merely spatial by also considering socio-economic aspects. Furthermore, the bivariate visualisations of these complex phenomena can make communication more apparent to professionals dealing with holistic planning and experts focussing on the performance of individual objects of interest, that is, grocery shops.
Conclusion
The approach we present in this article is a method to study accessibility to urban services that can incorporate several urban parameters related to spatial form, transport networks and demographics. Furthermore, thresholds of time and distance can easily be adjusted to different mobility modes. This method can be replicated in various contexts because open-source data for urban services are widely available, and an increasing number of cities have robust GIS repositories.
However, we have not used the method with other means of transport, such as public transport. We recognise that this brings additional challenges, such as incorporating waiting times for connections. Moreover, as used in this article, the approach has limitations for considering the quality of walking/cycling conditions in different urban areas and the velocity variations for diverse population groups. Facing such challenges demands more detailed information. A thorough information for walking can consider waiting times for pedestrians on crossing high-trafficked streets and the attractiveness of the surroundings; for cycling, details such as motorised traffic intensities, separate cycling lanes and slope inclinations can be included. Another limitation of the dataset we have used is the absence of depth regarding the individual grocery shops. The employed approach assumes an equal significance value to each object without considering their characteristics. Applying different weights based on each shop’s attributes can enrich the empirical validity by strengthening the correlations between serviceability and other urban aspects, including densities. Similarly, if considered relevant, one can include additional density indicators to correlate with, for example, job densities or commercial densities. Experimenting with these notions will eventually reveal further details regarding the method’s potential and limitations.
Future work will be based on these notions to develop the approach further so its results can provide a coherent practical input to concepts such as the 20, 15, 10-minute city. The latter can reinforce the idea of sustainable development in multiple perspectives, including environmental frugality, economic optimisation of urban structure and enhancing the quality of life of urban populations by improving accessibility and serviceability. Thus, research methods, such as the one presented in this study, to support the practical application of these concepts might provide the capacity to visualise and define the essential pieces of empirical knowledge necessary in the process.
Supplemental Material
Supplemental Material - Time, the other dimension of urban form: Measuring the relationship between urban density and accessibility to grocery shops in the 10-minute city
Supplemental Material for Time, the other dimension of urban form: Measuring the relationship between urban density and accessibility to grocery shops in the 10-minute city by Todor Kesarovski and Fabio H Palacio in Environment and Planning B
Footnotes
Acknowledgements
The authors would like to thank Dr. Ray Pritchard from Norce Research Institute for reviewing an initial version of this research paper and his constructive suggestions. The authors would also like to express great appreciations to Dr. Sindre Lorentzen for supporting the regression analyses development as part of this research work. His willingness to give his time so generously has been very much appreciated.
Author note
An earlier version of this study has been presented at the 'Urban Form and the Sustainable Prosperous City’ Conference (ISUF) at Glasgow (United Kingdom), 29 June–03 July, 2021.
Declaration of conflicting interests
The author(s) declared no potential conflicts of interest with respect to the research, authorship, and/or publication of this article.
Funding
The author(s) received no financial support for the research, authorship, and/or publication of this article.
Supplemental Material
Supplemental material for this article is available online.
Note
References
Supplementary Material
Please find the following supplemental material available below.
For Open Access articles published under a Creative Commons License, all supplemental material carries the same license as the article it is associated with.
For non-Open Access articles published, all supplemental material carries a non-exclusive license, and permission requests for re-use of supplemental material or any part of supplemental material shall be sent directly to the copyright owner as specified in the copyright notice associated with the article.