
Abstract
This second progress report critically reviews the intersection of GIS and disability, tracing its evolution from a few isolated studies toward modest growth in recent scholarship. Through a contemporary literature analysis (N = 240) structured around four themes—wayfinding, spatial accessibility, cartography, and spatial epidemiology—we identify persistent conceptual and methodological gaps, including differing terminology and limited representation in leading journals. The advancement of disability GIS requires not a retrofit but a redesign that hinges upon explicitly integrating embodiment, participation, intersectionality, and meaningful engagement with disability studies.
Introduction
Within geographic information science (GIScience) and transportation geography, spatial accessibility refers to the ease of which people can reach opportunities, calculated using models of distance, travel time, or friction-of-distance cost surfaces (Ahmed et al., 2025; Khakh et al., 2019; Milias and Psyllidis, 2022). This metric is methodologically elegant but conceptually agnostic: grounded in assumptions of normative mobility and largely indifferent to disability. Even recent attempts to broaden the scope of spatial accessibility to “ensure accessibility for people of all ages and abilities” (Büttner et al., 2024, 3; see special issue) stop short of centering disability as a dimension of access.
Outside academia, however, accessibility is anything but neutral. The term refers to a legal right and a design imperative; codified in legislation such as the Bill C-18 Accessible Canada Act (2019) and European Parliament and Council of the European Union (2019); embedded in standards like A11yJSON, a standard to describe the accessibility of the physical world (Sozialhelden e.V. 2025) and W3C Web Content Accessibility Guidelines (World Wide Web Consortium, 2025); and visualized through mapping platforms that center the needs of disabled populations such as AccessNow (2025) and AXS Map (2025). In these contexts, accessibility inherently presumes disability.
This contrast creates a semantic rift: in GIScience, accessibility is treated as a neutral, technical attribute, stripped of its social, legal, and embodied context. Outside academia, accessibility is inseparable from the rights, experiences, and needs of disabled people. As a result, GIScience and disability communities are often speaking past one another, using the same language but meaning fundamentally different things. The proliferation of academic definitions of access that exclude disability, which is not exclusive to GIScience (Wolbring and Fast, 2025), are hard to justify when 1 in 6 of the world’s population (WHO, 2023) live with significant disabilities, and uncounted others experience neurodiversity, mobility-diversity, and age-related impairments. This gap highlights a profound underrepresentation of disability-related topics in GIS literature relative to its societal significance.
A closer look at how spatial accessibility is applied in GIScience exposes this troubling rift. While a few authors use spatial accessibility to investigate disabled access through mapping barriers (Andrade et al., 2012; Koustriava and Koutsmani, 2023) and a few dozens more use GIS-based spatial accessibility techniques to study disabled populations, this is a mere fraction of the modestly estimated 4000 GIScience-related research papers where accessibility has been emptily codified to treat all bodies, often aggregated to a geographic area, as frictionless points on a cost surface. Staking out this meaning of spatial accessibility leaves no methodological, conceptual, or terminological space for GIScientists to embrace the embodied, sensory, or social barriers that disabled individuals navigate every day.
It is no surprise, then, that Elwood (2022) observes that disabled perspectives remain absent from the fourth wave of critical GIS, which interrogates power and inequality through the lenses of critical race, gender, and sexuality theory. In fact, disability has been sidelined across all waves of critical GIS: the first wave’s focus on technical and positivist foundations (Kwan, 2002; Schuurman, 2000), the second wave’s participatory turn (Corbett et al., 2016; Dunn, 2007), and the third wave’s expansion of epistemologies and representations (Leszczynski and Elwood, 2015; Schuurman, 2006) have rarely engaged disability meaningfully. Without the language to describe disability or the data to measure it, progress remains stuck at the margins of critical GIS.
This omission becomes particularly evident when compared to broader developments in disability geography (Crooks et al., 2008; Imrie and Edwards, 2007), a subfield that evolved from viewing disabilities as technical issues solvable through infrastructure (Wolpert et al., 1975) toward research that advocated for “the adoption of a social model of disablement as the epistemological basis for research production” (Stone and Priestley, 1996, 706 and advanced by Kitchin, 2002b). This social model recognizes how spatial arrangements actively produce exclusion and marginalization, and is enhanced by relational frameworks that illustrate how disability is co-constituted through interactions among individuals, institutions, cultural norms, and physical environments (Gleeson, 1998; Hall and Wilton, 2017; Jacobson, 2013; Wang et al., 2025). Across related fields, creative efforts to implement disability-inclusive approaches and frameworks are gaining traction in urban planning (Ross et al., 2023; Terashima and Clark, 2021), big data studies (Deitz, 2023; Deitz et al., 2021; Makkonen and Inkinen, 2024), and computer science (Froehlich et al., 2019, 2022; Shew, 2023).
Building on these cross-disciplinary developments, this progress report turns to GIScience to critically assess how disability has been taken up in the field. We begin by tracing the development of GIS and disability research over time and examining its coverage across leading journals. We then analyze four thematic areas—wayfinding, spatial accessibility, cartography, and spatial epidemiology—situated within a broader consideration of disability types and research approaches, and conclude by suggesting directions for advancing disability GIS.
Methods
To systematically review the literature at the intersection of disability and GIS published by December 2024, we conducted a multi-phase search and selection process. Initially, we searched the Web of Science database using a comprehensive query applied to all fields. The search strategy combined disability-related terms (see Wolbring and Fast, 2025)—“disabled,” “disabilit*,” “impair*,” “deaf,” “neurodiv*,” “dyslexia,” “ADHD,” “autism,” “ASD,” “attention deficit,” “autistic,” and “wheelchair*”—with GIS-related terms—“geographic information system*,” “geographic information science,” “GIS,” “GIScience,” “cartograph*,” and “spatial data.” This query yielded a total of 1,241 records. We iteratively refined our search terms based on our knowledge of the field.
Subsequently, the records were imported into Covidence for a scoping review. During the screening process, we identified and removed 23 duplicate entries. Further assessment led to the exclusion of a substantial number of articles: 1,044, often due to the use of term “impairment” in contexts unrelated to disability (the impairment of an ecosystem in physical geography) or misinterpretations of the acronym “GIS” (gastrointestinal system). This resulted in 218 articles deemed suitable for analysis.
We augmented the database search by incorporating additional records identified through snowballing (tracking citations from relevant authors), expert recommendations based on prior knowledge of the research area, and targeted searches in the top journals in the field of GIS (see Caron et al., 2008). These supplementary methods increased the total number of articles included in the review to 240.
Following Zimmermann-Janschitz (2018) and others, we adopted a structured, systematic approach to transform the raw set of references into coherent themes: wayfinding, spatial accessibility, cartography, and spatial epidemiology. In a slow human process, spanning over a year, both authors reviewed, read, and categorized all papers. Where there was a disagreement, we discussed and decided the best fit. These categories are not mutually exclusive, nor are they identical to those in previous research. 1 While we recognize that this body of the literature may be missing key citations, it offers a solid foundation for investigating the progress in disability and GIS. Researchers can access the complete set of references in an open Zotero database via Borealis (Fast et al., 2025).
GIS and disability
Development over time
Disability-focused GIS scholarship has expanded from little to no output in the early 1990s to 29 papers in 2024, but its ascent has been inconsistent (Figure 1). During the formative years (1991–2005), annual publications rarely exceeded five and were dominated by cartography. A transitional phase (2006–2013) saw total output inch into the 5 to 10 range, notably as spatial accessibility (presumed to be enabled by the tools of the software) began to surface. Momentum accelerated after 2014: totals climbed into the mid-teens by 2017, topping at 24 by 2019. Except for 2020 and 2022, more than 20 articles have been published per year each of the last 6 years. Disability and GIS over time.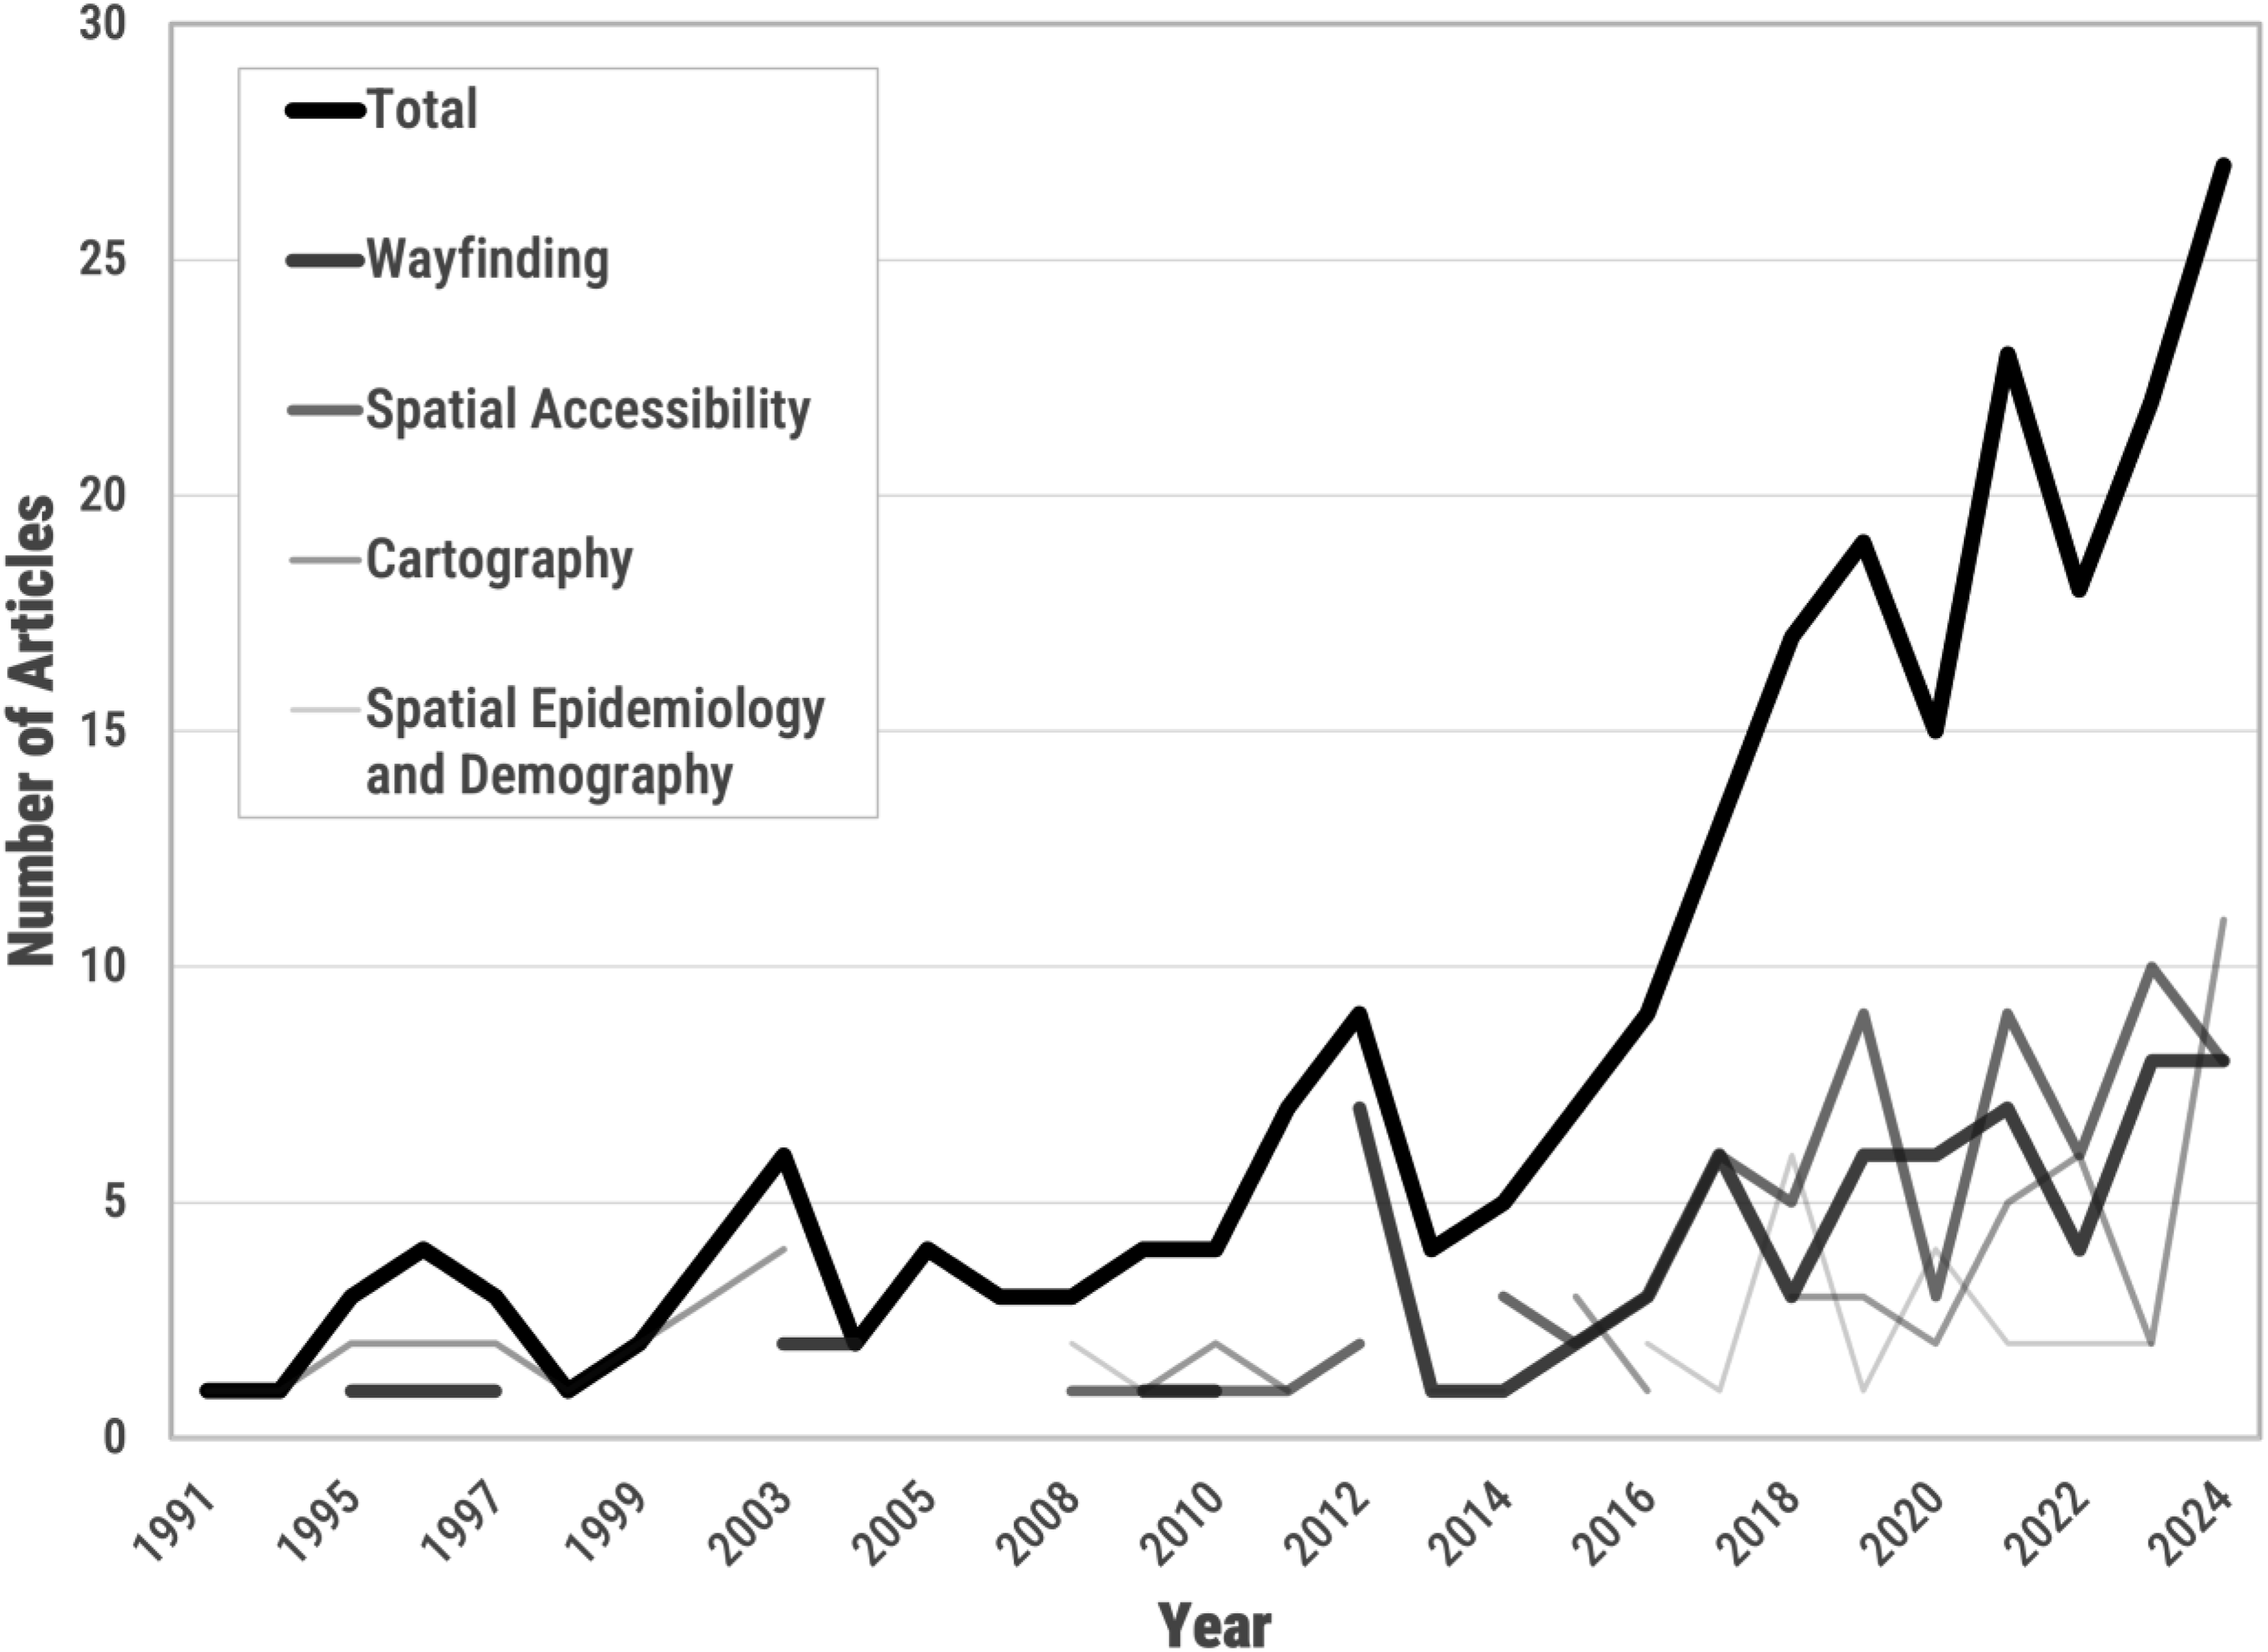
A field once centered on technical mapping and wayfinding evolved into a more diversified domain that foregrounds accessibility metrics and spatial epidemiology. Before 2015, 70% of articles on GIS and disability were about cartographic methods (39%) and wayfinding (31%). Since 2015, the majority have been focused on spatial accessibility (36%) and wayfinding (31%).
Journal coverage
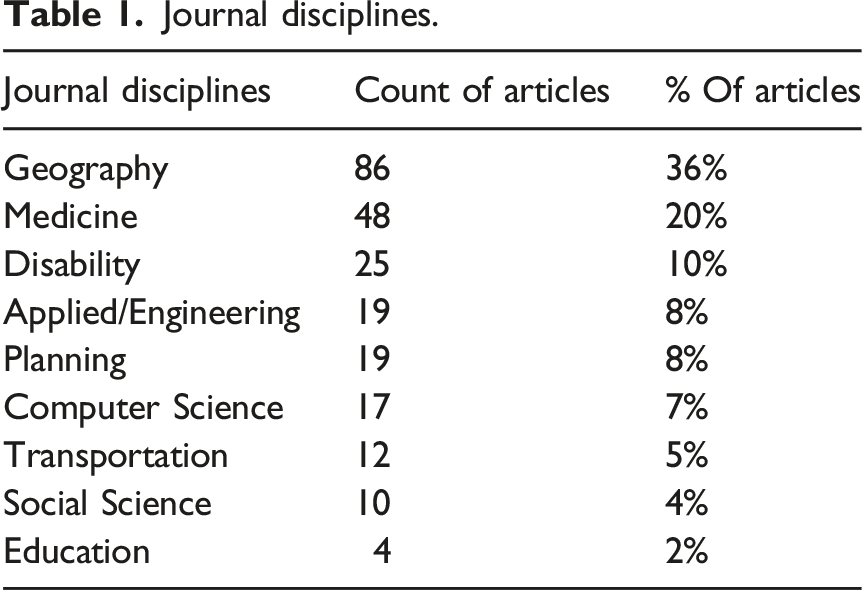
Journal disciplines.
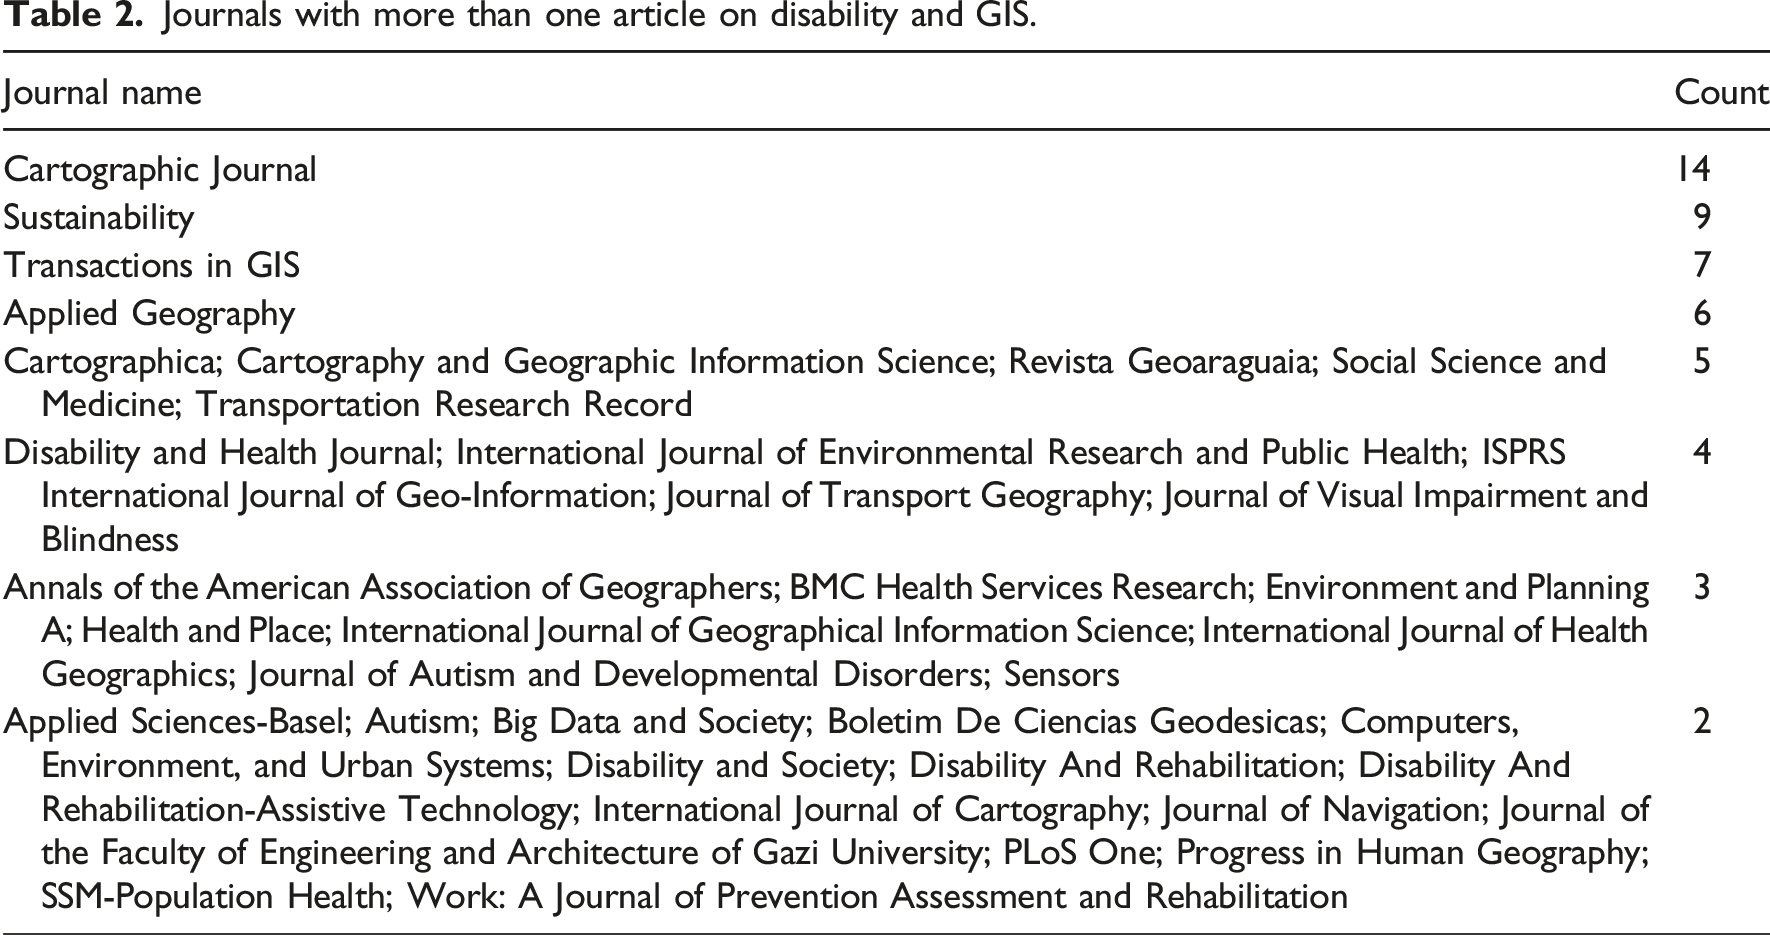
Journals with more than one article on disability and GIS.
Types of disability and themes
Distribution of articles by theme and disability type (N = 240).
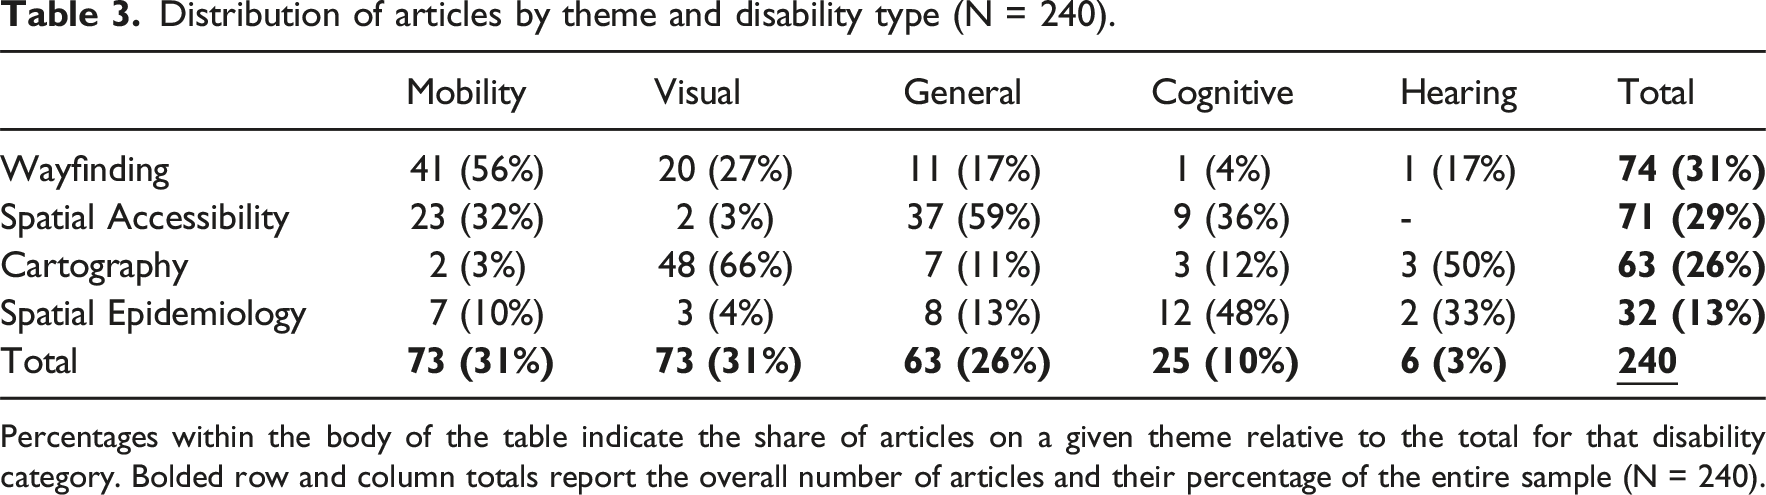
Percentages within the body of the table indicate the share of articles on a given theme relative to the total for that disability category. Bolded row and column totals report the overall number of articles and their percentage of the entire sample (N = 240).
Research concerned with mobility impairments is in the field of wayfinding (56%), spatial accessibility (32%), and marginally in spatial epidemiology (10%), and cartography (3%). Research concerned with visual impairments is mostly in the field of cartography (66%). There are a few articles focused on wayfinding (particularly in assistive technology) for blind or low-vision individuals (27%), and a handful focused on spatial epidemiology and spatial accessibility (4% and 3%, respectively). Research that does not specify disability group is largely in spatial accessibility (59%), followed by wayfinding (17%), spatial epidemiology (13%), and cartography (11%). Cognitive differences and hearing impairment are marginally included in GIS studies. Among the articles on cognitive difference, 48% are in spatial epidemiology, followed by spatial accessibility (36%), cartography (12%), and wayfinding (4%). All six articles centering populations with hearing impairment have been published in the last 5 years (2019–2024), with most focusing on cartography.
To explore these trends in greater depth, we next discuss the literature by thematic area. In these sections, in-text citations are omitted due to word limits. A comprehensive list of the 240 works reviewed is provided in the supplemental material and open-access Zotero library (Fast, Deitz, & Drew, 2025).
Wayfinding
The largest category in our search (31%), wayfinding, focuses on how geospatial tools including routing and digital interfaces can improve travel for people with disabilities in both physical and digital environments. Early work in the area focused on identifying mobility barriers, modeling those barriers, and providing assistive technology for populations in context. Later work developed barrier modeling with many studies emphasizing embodied experience through participatory research that systematized asset mapping to fill in missing data and inform routing.
Since the early 2000s, research has built on the development of measurement tools and indices, with many studies drawing on the network analyst spatial toolkit. Studies have also contributed to the development of routing tools and web-based platforms. Between 2014 and 2020, research began to integrate community perspectives using volunteered geographic information systems and in recent years, GeoAI. Approximately 20% of these studies have been participatory, while others rely on barriers identified in previous studies or outlined in legislation, including the Americans with Disabilities Act (ADA) which includes detailed accessibility criteria.
Several studies examine the use of new data sources including light detection and ranging (LiDAR), global positioning systems (GPS), radio frequency identification devices (RFIDs), photogrammetry, and sensor networks. Except for indoor routing and emergency preparedness, scholars have only just begun to examine routing and navigation within specific contexts. These include tourist attractions, universities, understudied kinds of urban areas such as those in the Global South, rideshare platforms, and parks.
While most studies focus on populations with mobility impairments, a rich body of the literature also explores the development of assistive technology for blind and low vision users including real-time routing applications, tactile tiles, magnetic tensor sensors, wearable technology, and smart canes. One study looks at routing assistance for users with cognitive disability, an otherwise understudied area. Future work might continue to expand navigation for a diversity of embodied experiences in varied contexts, while recentering participation in the evaluation of new technologies. There is space in this field to expand to consider a greater diversity of embodied experiences in context. Further, as the potentialities of new technologies to facilitate data interpolation and routing are developed, a return to the early focus on participatory research is paramount.
Spatial accessibility
The fastest-growing theme in the dataset, spatial accessibility (29%), investigates how disabled populations access health, education, and social services, as well as urban infrastructure. More than half of these studies examine access to health and medical services, with a smaller share addressing education and child/adolescent programs, and another cluster focusing on urban infrastructure and mobility. In many papers, a specific condition is under study, such as infants with spina bifida or children with autism spectrum disorder. In others, disability is treated as a segment of the general or specialized population including children, adolescents, and older adults.
We speculate that sudden growth in this category from 2017 onward is less a result of a conceptual turn toward disability and more the outcome of practicality: spatial accessibility functions are now widely available in most GIS software, making them a convenient choice for researchers and trainees. As a result, much of the work on disability in spatial accessibility applies established methods in GIS to evaluate proximity, travel time, service density, and availability, with early contributions relying on Euclidean distances or buffers and more recent studies employing network analysis, multimodal travel estimation, gravity models, and spatial optimization. This methodological evolution reflects broader trends in GIScience toward more precise and context-sensitive modeling.
While this work has generated valuable insights into where services are located and which populations face inequities in reaching them, it extends conventional spatial accessibility models to disabled populations rather than reconfiguring those models through disability-centered perspectives. Consequently, questions of accessibility are framed around geographic distribution and system efficiency, adhering to the medical and social models of disability. We see an opportunity for future work to build on spatial accessibility methods with approaches that recognize access as a lived and situated experience, capture the barriers and facilitators that matter most to disabled people, and draw on participatory approaches such as go-along interviews and experiential mapping to inform modeling.
Cartography
This category (26%) addresses methods and tools for spatial representation, map creation, and visualization to include and represent people with disabilities. This category focuses on innovative techniques that enhance spatial understanding through accessible cartographic designs. More than half of the articles cover tactile mapping for blind people (59%), and a sizable number of the remainder (14%) focus on accessible color schemas for color blindness.
Some studies explore tactile color representation, while others explore the development of tactile symbols. New technologies for generating tactile maps have evolved over the years, ranging from microcapsule paper to inkjet printers, and most recently, 3D printing. Over the past 5 years, many studies have explored the potential automation of tactile map generation. While most studies are general, some have focused on specific contexts such as parks, flood mitigation, and applications in education. Color blind map schemas have been explored in the domains of health, web mapping, flow maps, and unique urban contexts.
A small body of the literature examines sound maps to represent demographic data, on the web, for hiking and as a means of including aurally sensitive populations. A few scholars have also explored accessible web maps. Many studies focused on improving map design have included participants in an experimental setting to test cognition through eye-tracking or brain wave measurements. A smaller subset pursued deeper participation in the early years as they developed symbology schemas. Scholars in this field continue to follow more participatory research designs in education and field research training. A generative slice of cartography studies pursues efforts to rethink the map through the perspectives of disabled populations, encouraging us to see that maps are not neutral backdrops but instruments capable of expressing care needs, navigating diverse bodies, and surfacing the invisible.
Spatial epidemiology
This theme captures the 13% of the literature that use geospatial tools to map, analyze, and explain spatial disparities in disability prevalence and distribution. These studies often move beyond simple descriptive mapping to interrogate the underlying demographic, environmental, and social factors contributing to uneven patterns. Several papers employ spatial statistics—such as spatial regression, kernel density, and hotspot analysis—to identify clusters of disability prevalence and their associations with factors like aging, environmental hazards, hurricane vulnerability, urbanization, and access to services.
Much of this work draws from spatial epidemiology and demography, with researchers identifying exposure patterns (e.g., toxins, air pollution, or noise) as potential drivers of disability outcomes. Others take a more demographically focused approach, analyzing aging populations, racial disparities, or gender differences in disability prevalence across scales—from neighborhoods to national populations. Some studies also explicitly investigate environmental injustice, linking the spatial distribution of disability with marginalized communities’ exposure to systemic risk and infrastructural neglect.
Recent contributions have incorporated qualitative and mixed-methods approaches, highlighting lived experiences and expanding the scope beyond medical models of disability. These include spatial storytelling, vulnerability mapping, and community-led analyses that situate disability within broader social determinants of health.
Overall, this body of research reinforces that disability is not randomly distributed but shaped by intersecting spatial, demographic, and structural forces. It informs the development of targeted public health interventions, emergency planning, accessible infrastructure, and inclusive urban policies. In doing so, it supports a shift from reactive, individual-level responses to proactive, systems-level strategies; grounded in spatial evidence and tailored to the needs of disabled populations.
Conclusion
The literature reviewed here outlines the contours of a nascent disability GIS, integrating the technical rigor of GIScience to work with, and for, disabled populations. Yet much of this work remains additive rather than integrative: technically proficient but undertheorized beyond a handful of conceptual contributions (Roszewska, 2021; Walczak et al., 2023; Zimmermann-Janschitz, 2018). An instrumental view that treats GIS as merely “a set of analytical tools and methods” to be applied uniformly across contexts such as disability (Roszewska, 2021, 25) risks constraining the field. To advance disability GIS, we invite the field to draw on, and extend, the commitments of all four waves of critical GIScience.
Tools and logics: What are we doing and why?
First-wave critiques confronted the dominance of positivist, tool-centric GIS. For disability GIS, this means explicitly naming technoableism: the assumption that technology “fixes” disability and that disabled people aim to be “normalized” (Shew, 2023). Disability GIS needs to interrogate how computing capabilities—network analysis, service areas, cost-distance, and GeoAI—and data determinism (Deitz et al., 2021; Miller and Goodchild, 2014) pre-shape questions, metrics, and results. A critical disability GIS rejects compulsory non-disabled norms and foregrounds problem framing: clarify purposes, beneficiaries, trade-offs, and potential harms before choosing methods or measures.
Participation and power: With whom and how?
Second-wave work foregrounded participatory methods (Sieber, 2006). If Wave I clarifies purpose, wave II then asks who defines those purposes, with what power, and how governance is shared. Early calls for participatory disability research (Kitchin, 2002a) remain only partially realized; many projects still produce solutions for rather than with and by disabled people, and “participation” is often limited to late-stage evaluation. Disability GIS must center disabled leadership and embodied expertise, asking whose bodies are recognized, on what terms, and with what accountabilities. It insists on co-creation across design, data governance, consent, compensation, and evaluation, shifting the frame from research on disability to research with and by disabled people (see Garland-Thomson, 2002).
Representation and ontology: With what concepts and categories?
The third wave expands epistemologies and representational practices. For disability GIS, this means acknowledging that standard data models and software often lack the conceptual and ontological flexibility to represent disability. As we’ve shown, there is a glaring gap between practitioner definitions of accessibility and those used in GIS research. “Access” has already been operationalized; the task now is to open representational space by developing categories, metrics, and frameworks that capture dynamic needs, care relations, temporality, sensory/cognitive variance, and context-specific exclusions (Burgos-Thorsen, 2025; Davidson and Henderson, 2010; Duarte and Bortoletto, 2024; Smith, 1999). The methodological toolkit enables certain knowledge and forecloses others; the third wave therefore turns to rebuilding that toolkit so these differences become computable, comparable, and consequential.
Justice and coalition: Toward what futures and whose liberation?
Wave four foregrounds intersectional praxis, rooted in Black, Indigenous, feminist, and queer traditions and in community struggles against structural violence (Elwood, 2022). For disability GIS, this entails anchoring the field in disability justice: understanding disability as co-constituted with race, gender, sexuality, class, and other axes of difference (Berne et al., 2018). Disability justice calls for research that is intersectional; centers those most impacted; resists carceral and capitalist logics; builds cross-movement solidarity; recognizes wholeness and interdependence; and organizes for collective access and liberation (Berne et al., 2018; Piepzna-Samarasinha, 2018). To crip GIS is to apply this framework: treat disability as a generative analytic that contests compulsory able-bodiedness, the governance of “the normal,” and liberal assimilation (Hamraie and Fritsch, 2019; Kafer, 2013; McRuer and Bérubé, 2006).
Practically, disability GIS redirects GIS to interrogate—rather than merely accommodate—the structures that produce spatial inequities. This includes reframing problems with disabled leadership; expanding data models and ontologies to encode care, variability, and temporality; selecting methods and metrics that surface exclusion and harm, not only efficiency; instituting participatory governance, consent, and compensation; and building infrastructures for accessible, accountable dissemination. Wave four, then, is not technical inclusion but structural transformation: rebuilding how GIS knows, for whom it works, and what futures it makes possible.
Taken together, these waves point to disability GIS not as an additive subfield or a new toolbox but as an open, generative approach grounded in ongoing dialogue, collaboration, and the leadership of disabled communities. As contemporary GIScience calls for impactful open science, convergence, and diverse partnerships (Nelson et al., 2025), disability justice reminds us that “nothing has to be the way it is” (Piepzna-Samarasinha, 2022). These fields have much to learn from, and with, each other.
Supplemental Material
Supplemental Material - GIScience II: Disability GIS
Supplemental Material for GIScience II: Disability GIS by Victoria Fast and Shiloh Deitz in Progress in Human Geography.
Footnotes
Funding
This research was supported in part by funding from the Social Sciences and Humanities Research Council of Canada (grant 435-2024-0750: Computational Urban Accessibility).
Declaration of conflicting interests
The authors declared no potential conflicts of interest with respect to the research, authorship, and/or publication of this article.
Supplemental Material
Supplemental material for this article is available online.
Note
References
Supplementary Material
Please find the following supplemental material available below.
For Open Access articles published under a Creative Commons License, all supplemental material carries the same license as the article it is associated with.
For non-Open Access articles published, all supplemental material carries a non-exclusive license, and permission requests for re-use of supplemental material or any part of supplemental material shall be sent directly to the copyright owner as specified in the copyright notice associated with the article.