
Abstract
Marked crosswalks are the primary means of safeguarding pedestrian travel at intersections in American cities. In the face of decades-high pedestrian fatalities nationwide, the provision of adequate crosswalks is highly salient. Though, how they are spatially distributed across an entire city, and vary by neighborhood, has drawn little academic scrutiny. Given that, this study utilizes satellite imagery to map the presence of marked crosswalks throughout San Francisco, a dense, walkable city that has struggled to reach its pedestrian-safety goals. For the first time, this allows for a calculation of “crosswalk coverage” for the city as a whole. Manual review of satellite imagery documents that crosswalks are present at 58% of San Francisco’s roughly 6,400 intersections, though they are not evenly distributed across neighborhoods. Both hotspot analysis and comparing crosswalk coverage by Census tracts demonstrates that northern neighborhoods—even outside of the downtown core—maintain higher percentages of intersections with crosswalks than those in the southern half. Intersections exhibit crosswalk “corridor effects,” in that crosswalks often cluster along certain streets, including (but not limited to) commercial areas. In addition, crosswalks in four neighborhoods were analyzed to a deeper extent, including category (e.g., ladder, continental, and standard), condition, and “completeness” or the number of adjacent blocks with a connecting crosswalk. Across these roughly 1,000 intersections, coverage varied from 51% in the Bayview (a historic African American community) to 83% in Pacific Heights (a high-income, majority-white neighborhood). Though these patterns track somewhat with local pedestrian and automobile volumes, crosswalk coverage diverges from these data in many ways, indicating other factors at play in their distribution. Overall, satellite imagery can be used to identify marked crosswalks at scale, evaluate their quality, and probe geographic variation. Armed with such granular data, planners can consider the ways in which crosswalks are present throughout cities—and where notable gaps exist—in their pursuit of Vision Zero goals.
Keywords
Introduction
In U.S. cities, a common approach to safeguard pedestrians at intersections is marked crosswalks, 1 which visibly signal where crossings may occur on foot. Crosswalks are often accompanied by other safety features, such as traffic lights, pedestrian signals, wheelchair-accessible curb ramps, stop signs, and refuge islands, among others. However, many urban intersections feature none of these amenities, or only provide crosswalks worn to the degree that renders them ineffective. There is evidence across multiple studies that crosswalks increase pedestrian-safety (detailed in the literature review), though transportation scholars have yet to examine their spatial provision, including within urban areas. This gap in scholarship raises several pertinent questions: In cities, where are marked crosswalks provided and where are they not? How can we accurately measure their geographic distribution at scale? Are marked crosswalks provided at similar levels across neighborhoods?
Although marked crosswalks are in some cities recorded in public datasets, the availability of high-resolution satellite imagery provides a scalable method of cataloging their spatial distribution, regardless of the state of municipal records. This approach allows for “crosswalk coverage”—the percent of all intersections in a given area with marked crosswalks—to be calculated for the first time. San Francisco, a city of roughly 900,000 in Northern California, represents an ideal case for crosswalks to be mapped. First, compared to other U.S. municipalities, it is quite dense (Florida, 2012), and has a high walk mode-share (22% as of 2019; “City-Performance Scorecards” 2020). Second, San Francisco has launched a Vision Zero program in the face of rising roadway fatalities, with the goal of eliminating traffic deaths by 2024 (Moench, 2020). This indicates a municipal government both taking steps to further protect pedestrians and likely receptive to quantifying pedestrian amenities and potential disparities.
With this context, this paper proceeds with a literature review on the role of crosswalks and pedestrian-safety, the recent increase in traffic fatalities nationwide (negating several decades of improvements), the gap in terms of spatial analysis of crosswalk distribution, and how satellite imagery has been employed to evaluate urban form. This is followed by a description of the methods used to identify and appraise crosswalks, results as to San Francisco’s crosswalk coverage citywide and within four distinct neighborhoods, and a discussion of what such findings mean for transportation planners pursuing both Vision Zero specifically and transportation equity more broadly.
Literature review
Cities have been traversed by foot as long as they have existed. The rise of automobiles in the early 20th century increased the danger of urban walking dramatically. Norton (2011) tracks the growing tension between pedestrians and cars in American cities during this period, which included the initial establishment of designated-crossing areas, as opposed to the prior norm wherein pedestrians crossed streets wherever they saw fit (Miles, 1906; Loukaitou-Sideris and Ehrenfeucht, 2009). The transition to marked crosswalks was not entirely smooth; pedestrians often flouted such rules, and the associated social reconstruction of the street as the primary domain of automobiles (Norton, 2007). This acrimony led to the pejorative term and new municipal infraction known as “jaywalking.” (Millington, 2014).
In the decades since the crosswalk’s introduction, it has become a standard component of American urban planning. The U.S. Department of Transportation’s “Manual on Uniform Traffic Control Devices” (MUTCD) writes: “Crosswalk markings help to alert road users of a designated pedestrian-crossing point across roadways” (2009). Though, the MUTCD only deems marked crosswalks as warranted when certain pedestrian-crossing thresholds are met, meaning a specific number of walkers over a given amount of time. Of course, this prevailing logic fails to take into account that individuals may be reticent to cross intersections unless and until marked crosswalks are provided. This car-centric bias at the foundation of pedestrian-crossing warrants—which prioritize automobile throughput—has been noted by others (Fitzpatrick et al., 2006; Schmitt, 2020; Todd, 1992; Zegeer et al., 1983). Yet, such guidelines still remain prominent in transportation planning and are echoed in state and municipal materials (“Crosswalk Policy and Design Guidelines,” 2014).
Researchers have probed the safety effect of marked crosswalks for at least six decades (Jacobs and Wilson, 1967). Studies have compared collisions at and outside of crosswalks, finding statistically significant reductions (Keall 1995; Feldman et al., 2010), and that motorists decrease their speeds when approaching crosswalks (Mitman et al., 2008). Other analyses have provided evidence that crosswalks also induce more walking, increase perception of safety among pedestrians, and decrease injury severity when collisions do occur (Havard and Willis, 2012; Schultz et al., 2015; Pfortmueller et al., 2014).
However, the conclusion that crosswalks improve pedestrian-safety is not unanimous. Indeed, a study of 282 crossings within six U.S. cities found an increase in collisions among older adults at sites with marked crosswalks (though without stop signs or traffic signals), compared to unmarked locations (Koepsell et al., 2002). That said, several articles which found negligible benefits of crosswalks have been critiqued for not adequately controlling for traffic volume and the number of traffic lanes (Mead et al., 2013). More broadly, there is some debate over which pedestrian amenities provide the greatest marginal benefit in terms of reducing collisions, with evidence that raised medians (also known as “speed tables”) may offer more protection than crosswalks on multilane roads (Zegeer et al., 2001).
Aside from the infrastructure itself, it is important to note that race may play a role in the efficacy of marked crosswalks. An experiment involving three White adults and three Black adults documented that the latter group was twice as likely to have drivers not yield to them at crosswalks, and had to wait 32% longer in order to cross (Goddard et al., 2015). Relatedly, in the United States people of color are overrepresented in terms of pedestrian collisions and fatalities (Atherton et al., 2016; Campos-Outcalt et al., 2002). These distressing trends add salience to the issue of how crosswalk provision relates to racial variation in American cities.
As to the spatial distribution of crosswalks, multiple queries within Google Scholar, Elsevier, JSTOR, and EBSCO (alternating search terms) uncovered few peer-reviewed articles. This is surprising in part because there are a number of studies on the geographic patterns of other transportation amenities, such as transit stops (Moran, 2021; Welch, 2013), sidewalks (Osama and Sayed, 2017; Woldeamanuel and Kent, 2016), and even street trees (Brooks et al., 2016). Indeed, there has been scrutiny of where pedestrian fatalities have occurred (Grisé et al., 2018; Loukaitou-Sideris et al., 2007) including clusters within communities of color (Cottrill and Thakuriah, 2010; Pharr et al., 2013). Though, these do not correspondingly evaluate the footprint of crosswalks. This is also true in terms of work on urban form more broadly; Ewing and colleagues (2003) detected a positive correlation between the level of sprawl in a metropolitan area and the number of pedestrian fatalities, though this analysis omitted crosswalks. One study did examine differences in pedestrian amenities in three cities (including crosswalks), but it compared just quarter-mile stretches in each as opposed to broader neighborhoods or entire municipalities (Thornton et al., 2016). Related work by Zhang and Zhang (2019) sought to determine how pedestrian-network analyses could be improved by transitioning from simple street networks, to “formal pedestrian facilities,” including manually identified crosswalks. In four neighborhoods, they found that incorporating a range of variables beyond the grid itself generated deeper understanding of pedestrians’ options, particularly in lower-density areas.
Following progress in decreasing pedestrian fatalities between the 1970s and 2000s, there has since been an increase in such deadly collisions in the United States (Schneider, 2020). Unfortunately, pedestrian fatalities nationwide have increased by 46% between 2009 and 2016 (Hu and Cicchino, 2018), and gone up further since the onset of COVID-19 (Retting, 2021). Safety researchers have identified several reasons for this trend, including population growth in the Sunbelt—where car use and pedestrian deaths are highest on a per-capita basis (Retting, 2020)—increases in the proportion of automobiles which are Sport Utility Vehicles (Hu and Cicchino, 2018), and drivers distracted by electronic devices (Stimpson et al., 2013). This surge in pedestrian deaths has led many U.S. cities to adopt “Vision Zero'' initiatives, which take inspiration from Sweden’s success in reducing traffic fatalities by redesigning streets with safety in mind (Fleisher et al., 2016).
San Francisco has been examined specifically in terms of pedestrian-safety. Two decades ago, its pedestrian collisions were spatially analyzed, with the authors finding positive correlations between collisions and traffic flows as well as population density (LaScala et al., 2000). Another study developed a pedestrian-volume model for the city, finding higher walking levels near “activity centers” (places with a high number of offices and shops), in less-hilly areas, as well as at intersections with controlled traffic signals (Schneider et al., 2013). This research does not distinguish between marked and unmarked crosswalks. Another local project sought to determine the effectiveness of different pedestrian “countermeasures,” such as speed bumps, medians, and turn restrictions (Ford et al., 2008), concluding that in-street “Yield to Pedestrian” signs and pedestrian countdown signals (displaying time remaining) were particularly cost effective. Building on this work, a research team allocated a potential budget allotment for Vision Zero projects in San Francisco into a street-specific package of countermeasures (Kronenberg et al., 2015). By assessing the city’s high-injury network (streets where a disproportionate percent of collisions occur), it recommended installing new pedestrian amenities at 195 intersections, though this did not include adding crosswalks where none were present.
In terms of the methods employed here, there is considerable research utilizing satellite imagery to identify urban features. This has included street networks (Xin et al., 2019), urban tree canopies (Moskal et al., 2011), sidewalks (Senlet and Elgammal, 2012), and parked cars, among others (Moran, 2020; Scharnhorst, 2018). Most germane to the question at hand, several groups have detected crosswalks from satellite imagery (Ahmetovic et al., 2017; Berriel et al., 2017a; Kasemsuppakorn and Karimi, 2013), indicating available sensor resolutions are adequate. These studies largely deal with the issue of classification accuracy, and do not delve into the issues of crosswalk-specific variation by geographical units, condition, or type. Perhaps most germane to the study at hand, Proulx and colleagues (2015) built a pedestrian-infrastructure database for roughly 100 miles of highways in California by manually digitizing crosswalks based on Google imagery (both satellite and street level).
Methods
Prior to analyzing satellite imagery for this study, attempts were made at obtaining records on the spatial distribution of crosswalks from relevant public agencies in San Francisco. Staff at the Municipal Transportation Agency (hereafter SFMTA) helpfully provided a geospatial dataset that included some information on intersections, though it did not cover the entire city, document what kind of crosswalks are present (ladder, continental, etc.), or allow for analysis of crosswalk condition in terms of quality and “completeness” (i.e., how many adjacent blocks are connected).
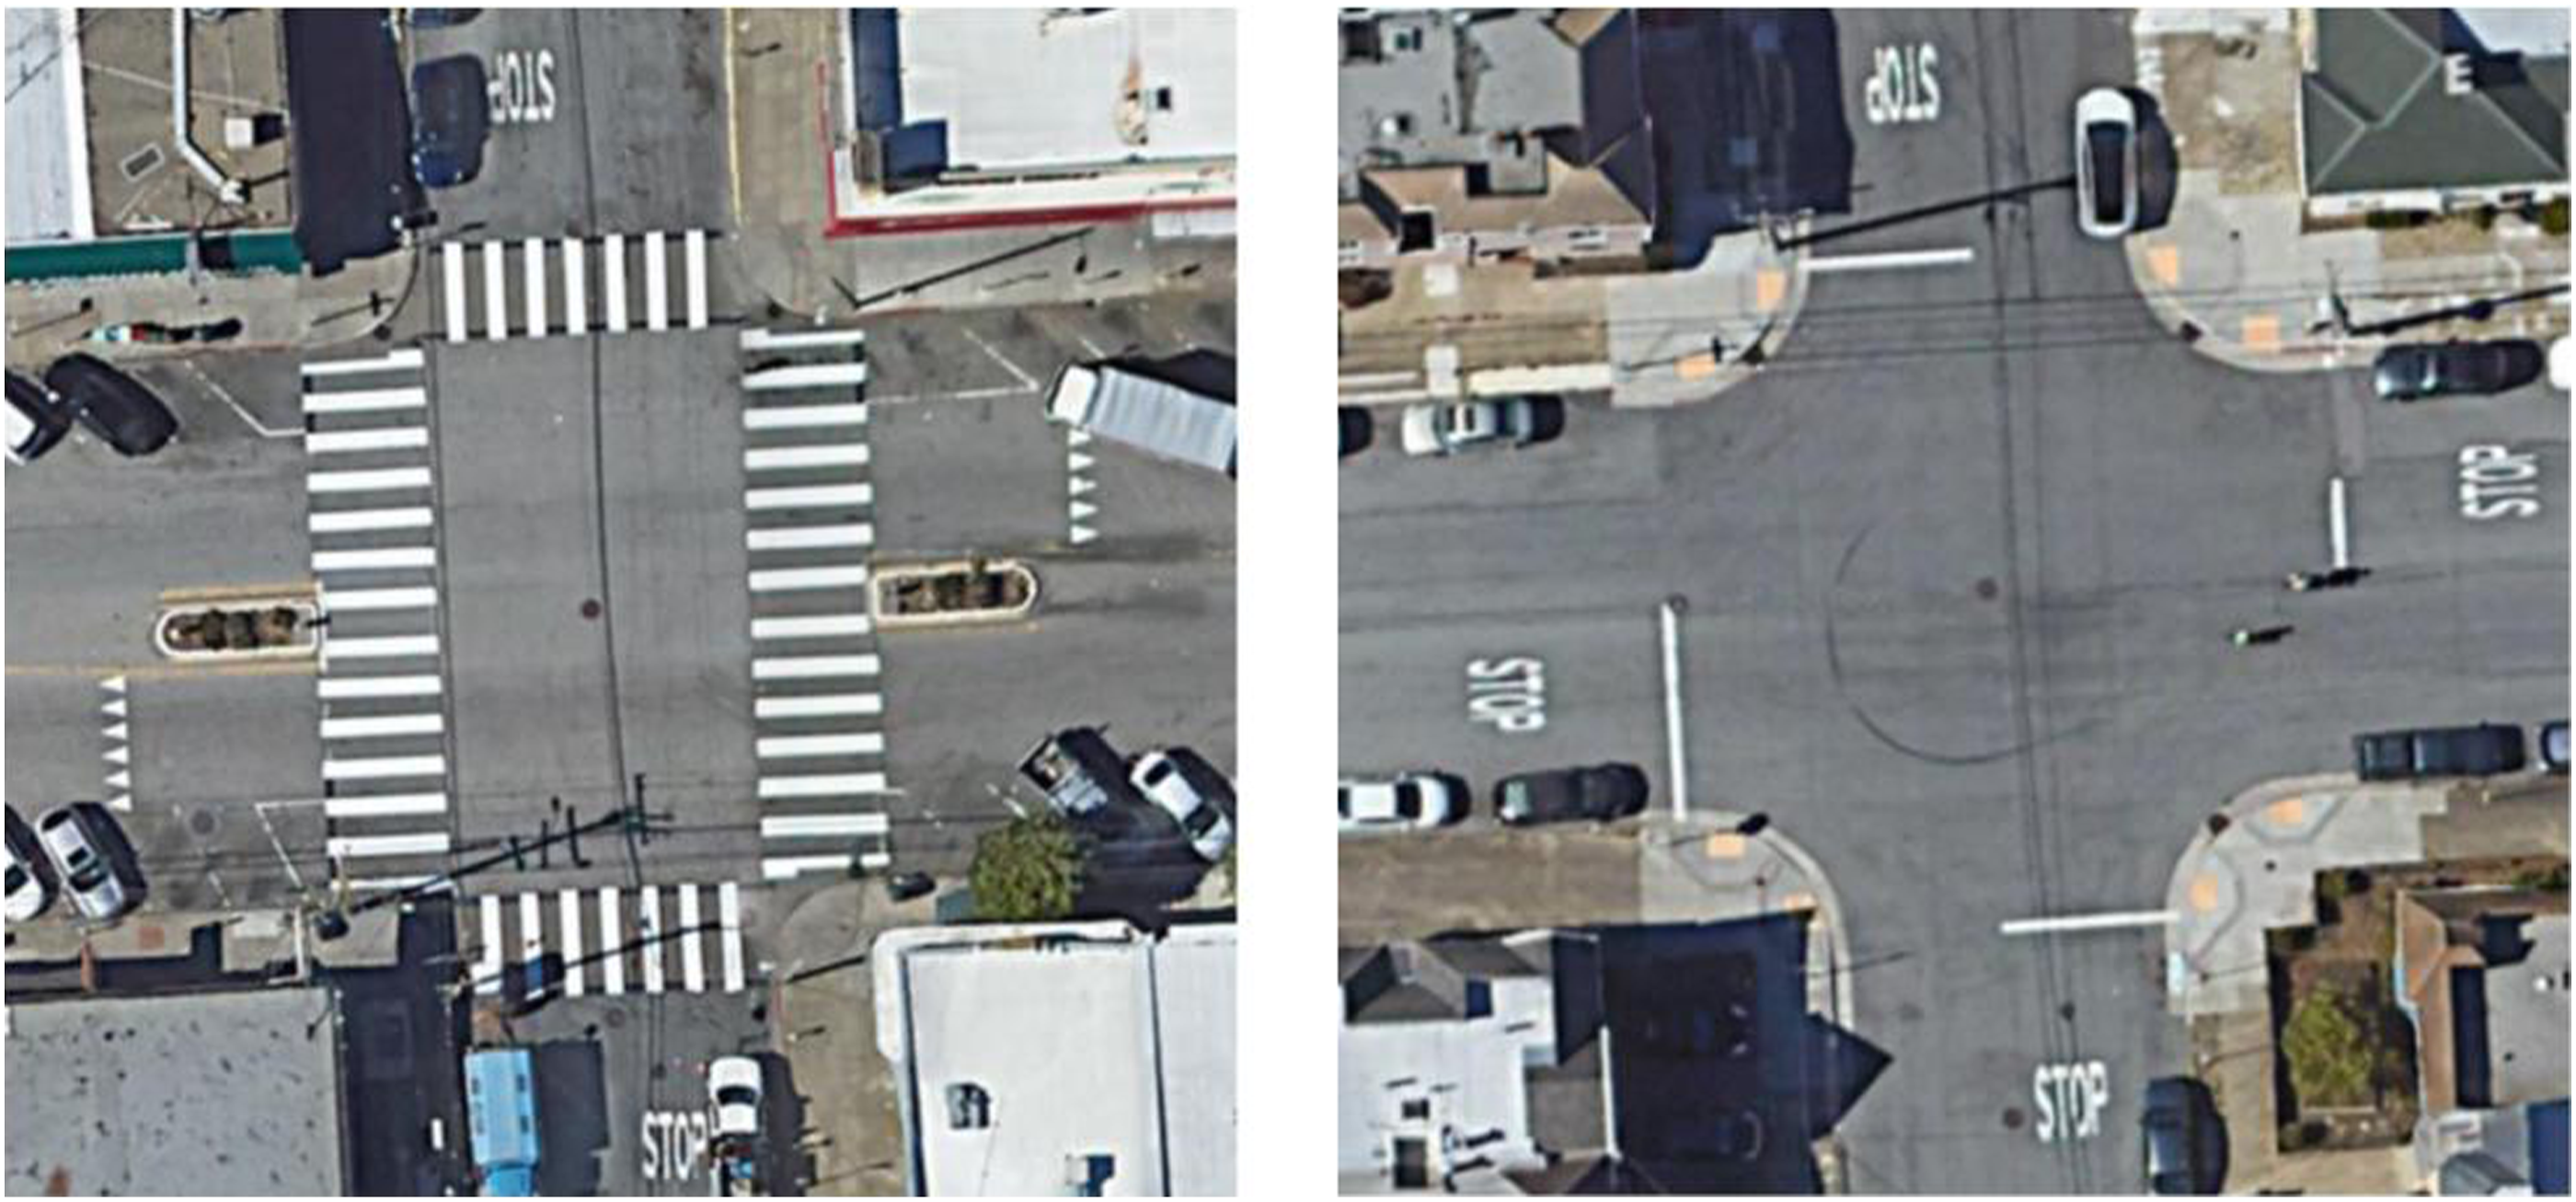
Given this, satellite imagery of every intersection in San Francisco (viewed within the Google Earth application) was manually inspected. First, a binary crosswalk vs. no-crosswalk decision was made for roughly 6,400 intersections (see Figure 1), which forms the basis of the spatial analyses that follow. Second, in four distinct neighborhoods—Pacific Heights, the Mission, the Bayview, and the Outer Sunset—more detailed scrutiny of crosswalks was undertaken. For this subset of intersections (roughly 1,000 in total), the following attributes were recorded for each marked crosswalk: - Category (standard, continental, or ladder), see Figure 2(a); - Condition, see Figure 2(b); - “Completeness,” or how many adjacent blocks are connected by a crosswalk (e.g., 1/4, 2/4, 3/4, 4/4), see Figure 2(c). Satellite imagery of intersections in San Francisco with (left) and without marked crosswalks (right). (a) Examples of three marked crosswalk categories in San Francisco visible from satellite imagery (top). (b) Marked crosswalk condition rating scale, based on satellite imagery of San Francisco (middle). (c) Examples of marked crosswalks varying in ‘completeness’ (bottom).
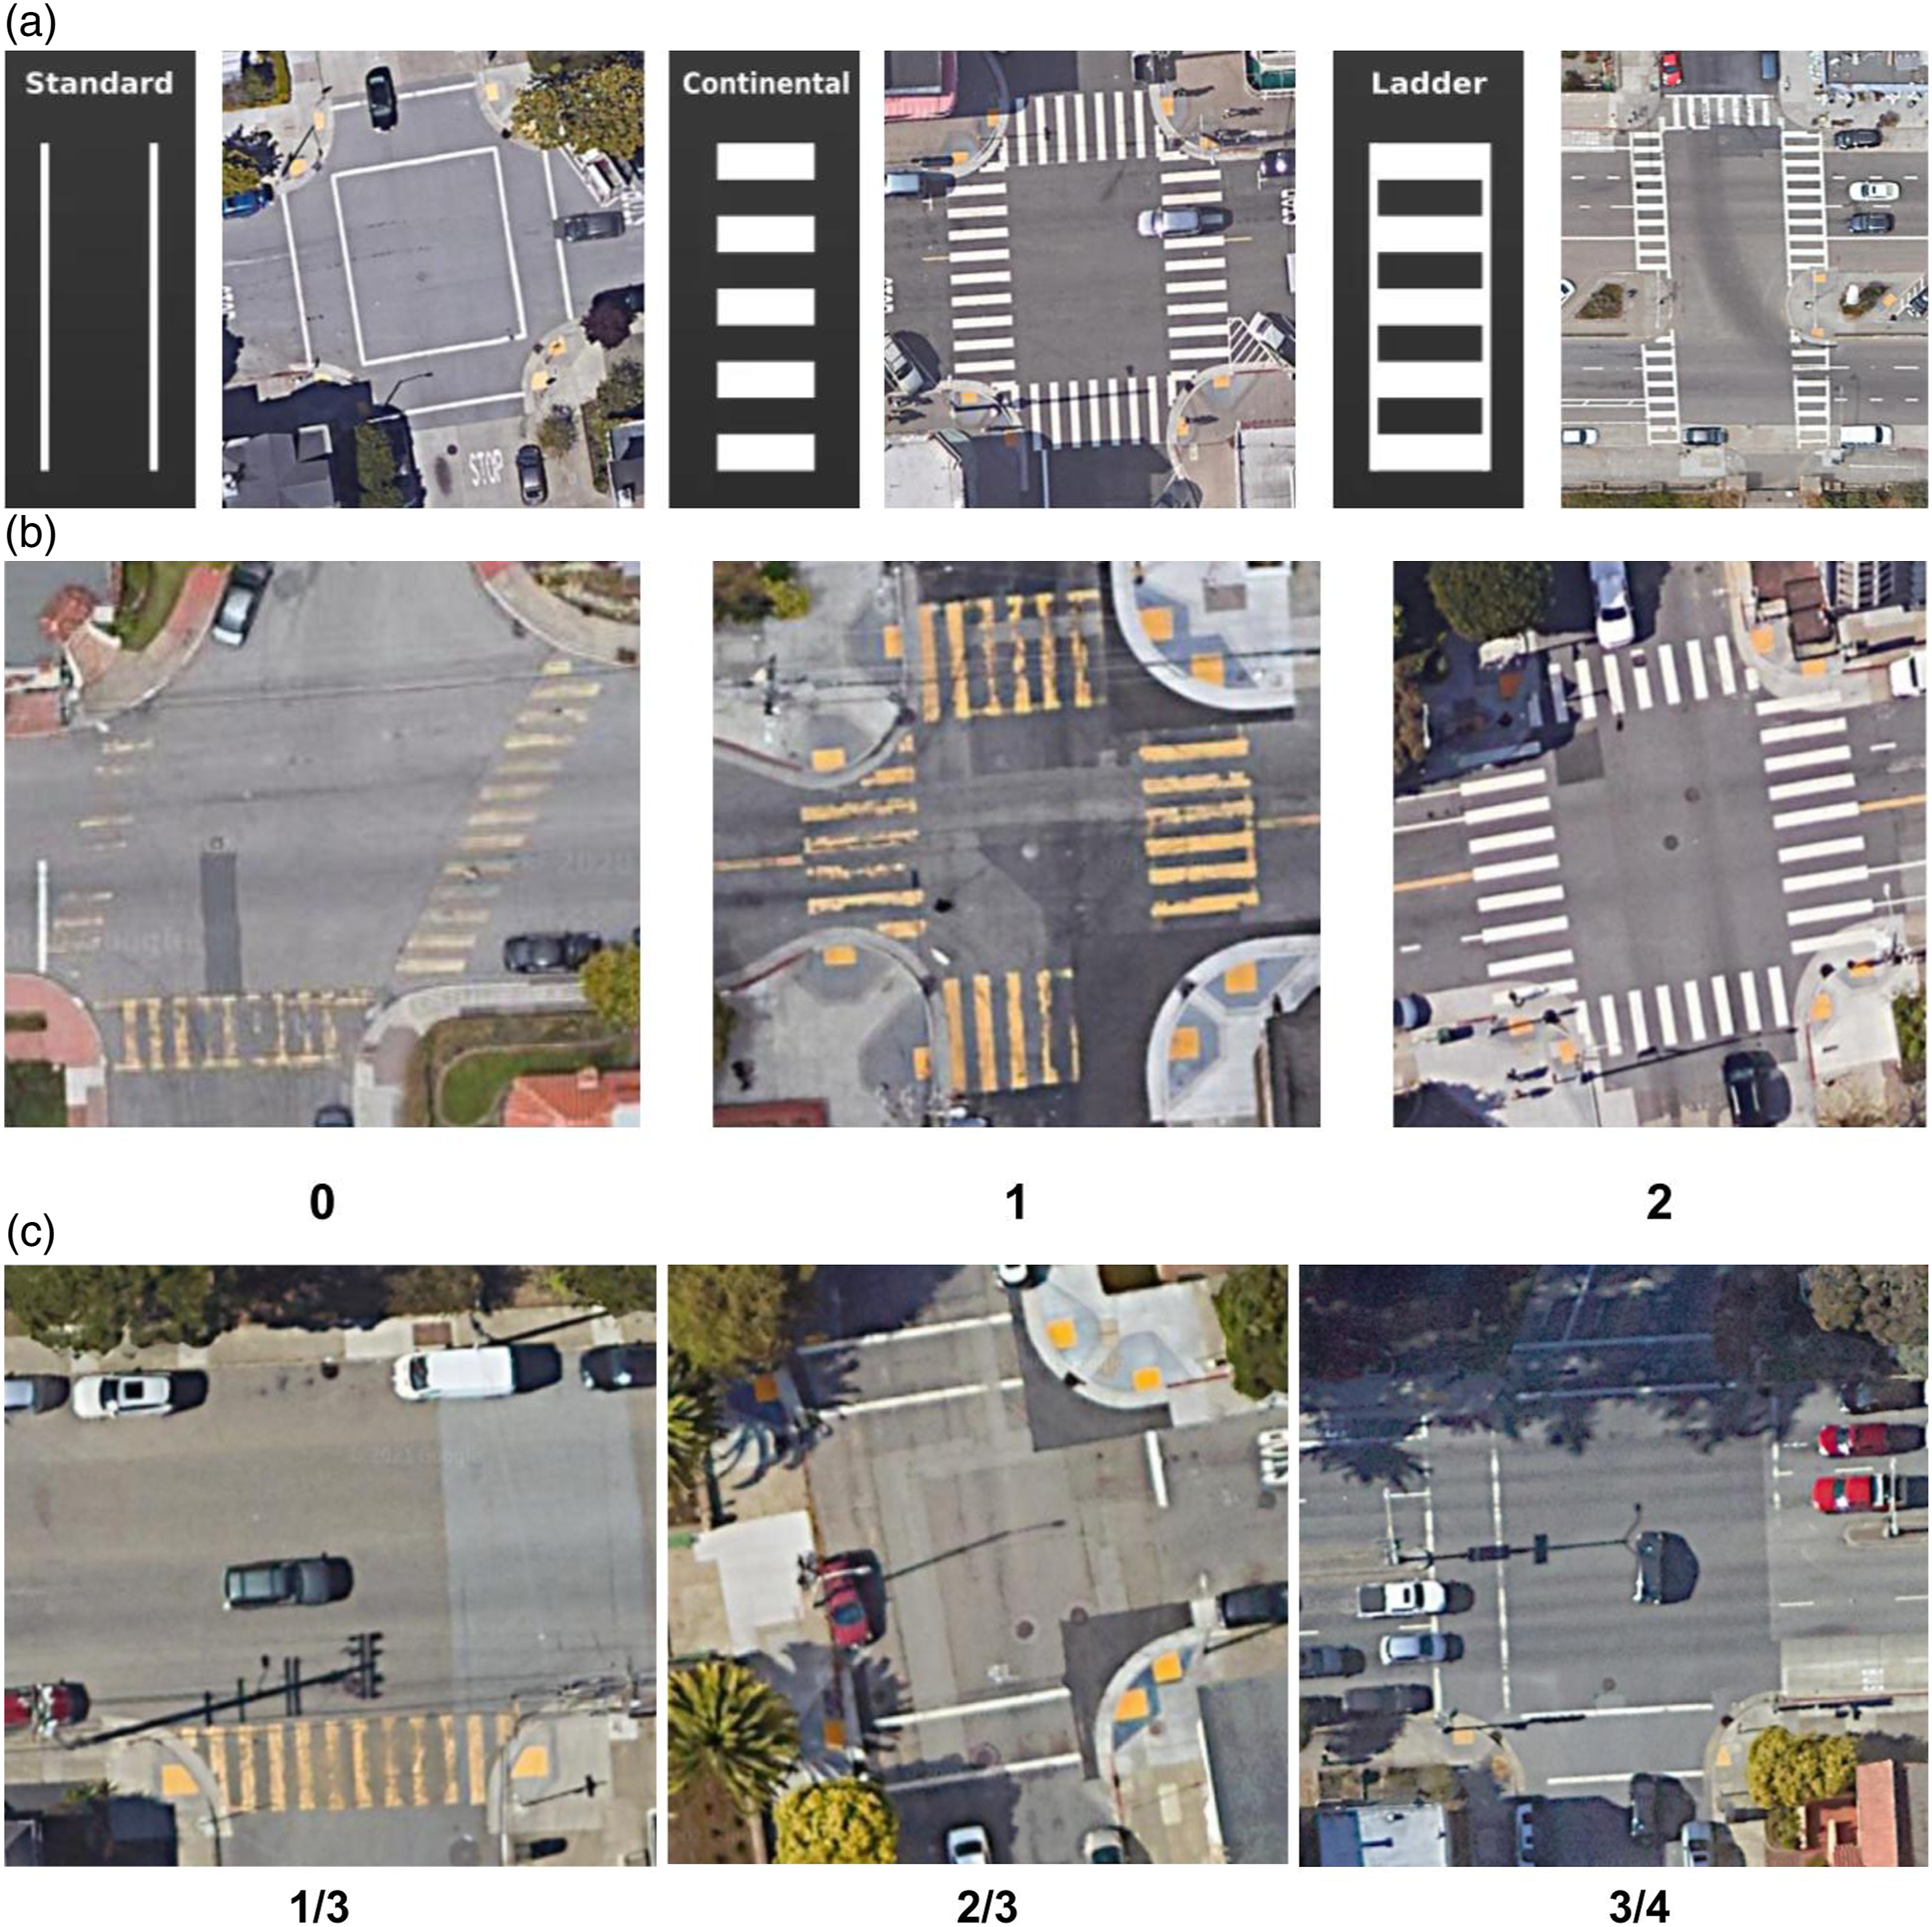
Crosswalk condition within these neighborhoods was manually coded in terms of a three-point scale (0, 1, or 2) with 2 being the highest rating (no visible issues), 1 indicating visible issues (such as worn markings), and 0 indicating poor condition to the extent that crosswalks may be difficult to detect at all. Road intersections without sidewalks (such as highway interchanges) were excluded, and do not factor into the calculation of crosswalk coverage at any scale. Satellite imagery of intersections was combined with municipal datasets which contain the polygons distinguishing both neighborhood and Census-tract boundaries (obtained from San Francisco’s official open-data portal). The methodology employed here focuses on the provision of crosswalks at intersections, and does not include midblock crosswalks. Manual classification was completed by a single researcher, which entailed approximately 90 hours of intersection review (roughly one minute of analysis per intersection). There is no financial cost involved to using the Google Earth platform, beyond a personal computer and broadband internet access. Though time-consuming, manual classification was used for both the binary “crosswalk vs. no crosswalk” determination citywide, and the more detailed four-neighborhood analysis, in order to ensure the highest-possible level of accuracy.
The four neighborhoods chosen for the secondary, deeper analysis vary in location, density, and socio-demographics (based on 2019 American Community Survey data, 5-years estimates); Pacific Heights is a generally high-income area with a majority of residents being white (67% of residents), the Mission District is home to a large Hispanic population (42% of residents, though facing gentrification pressures; Mirabal, 2009), the Bayview is a historic African-American neighborhood (34% of residents), and the Outer Sunset is relatively middle income (for San Francisco) and maintains a large Asian-American population (53% of residents). All four include both residential areas and commercial corridors, lie within different regions of the city (north, west, southeast, and central), and do not border each other. Residential density (measured as persons per square mile, 2019 ACS, 5-years estimates) is the highest in the Mission (38,706), followed by Pacific Heights (27,413), the Outer Sunset (21,694), and the Bayview (16,739).
In order to understand how pedestrian volume may influence crosswalk provision, data from the San Francisco pedestrian intersection volume model (Schneider et al., 2013) was extracted from the report’s included table, geocoded, and digitally mapped. This includes 2-hr observation of pedestrian crossings at 50 intersections across the entire city (with extrapolations from that research team as to total weekly crossings). Geo-coding existing data were also undertaken for automobile volume, drawn from San Francisco’s traffic count between 2014 and 2018, which involved observations at roughly 4,000 intersections (“SFMTA Traffic Count Data, 2019). These datasets represent the most spatially-expansive (and recent) pedestrian and automobile volumes for San Francisco, which can then be compared to the resulting crosswalk coverage figures.
Results
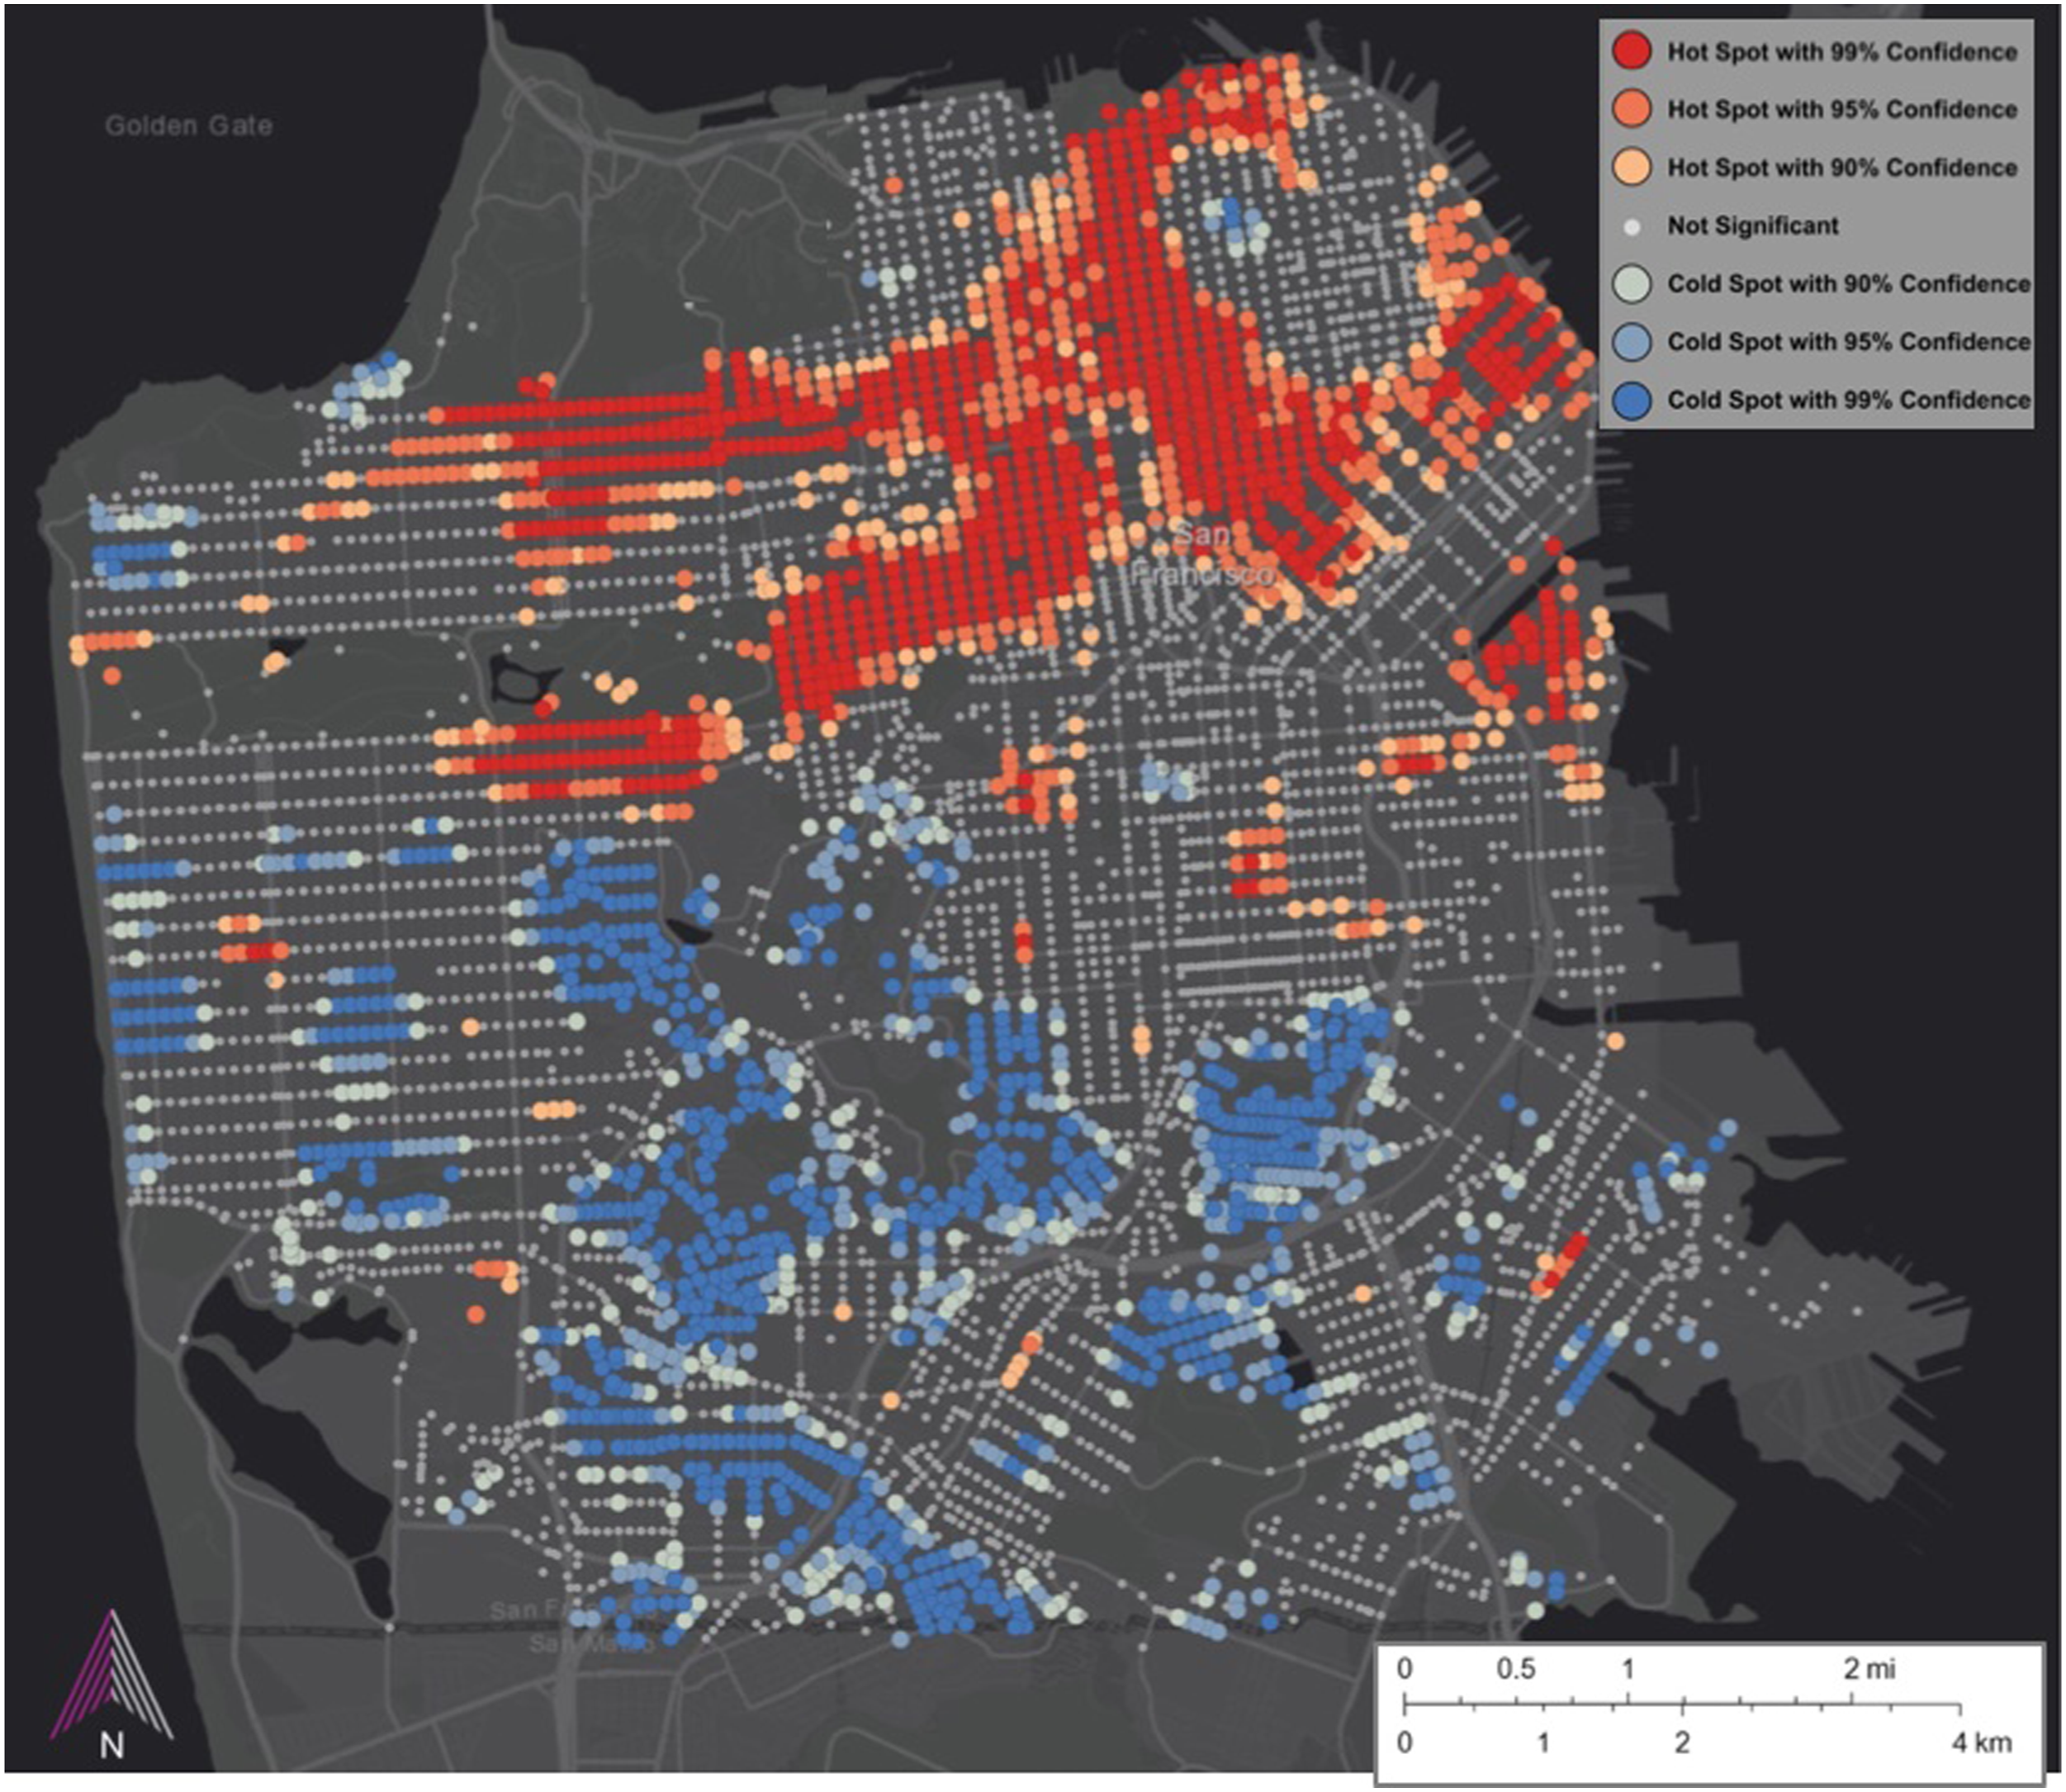
Satellite-imagery based analysis of 6,399 intersections across San Francisco calculated an overall crosswalk coverage of 58%. Review of spatial patterns of these data indicate the highest percentage of intersections with marked crosswalks occur in San Francisco’s dense northeast quadrant (which includes the central business district), with decreasing proportions of intersections with marked crosswalks in neighborhoods to the south (see Figure 3). Outside of the northeast quadrant, crosswalks are present to a greater extent in other northern neighborhoods running westward toward the Pacific Ocean, compared to those in the southern half. Rather than isolated intersections, non-marked crosswalks generally appear in clusters, meaning adjacent to at least one other intersection also lacking a crosswalk, which grow in size in the city’s southern half. Indeed, a hotspot analysis of crosswalk coverage (Getis-Ord Gi*) illustrates that intersections with marked crosswalks cluster across the city’s northern half (starting from the downtown and running westward), and that clusters of intersections without marked crosswalks (“coldspots”) nearly all lie within the city’s southern half (see Figure 4). Presence of marked crosswalks at intersections in San Francisco, CA. Hotspot analysis of intersections with marked. crosswalks in San Francisco, CA. “Hotspots” indicate clusters of intersections with marked crosswalks, whereas “Coldspots” indicate clusters of intersections without marked crosswalks.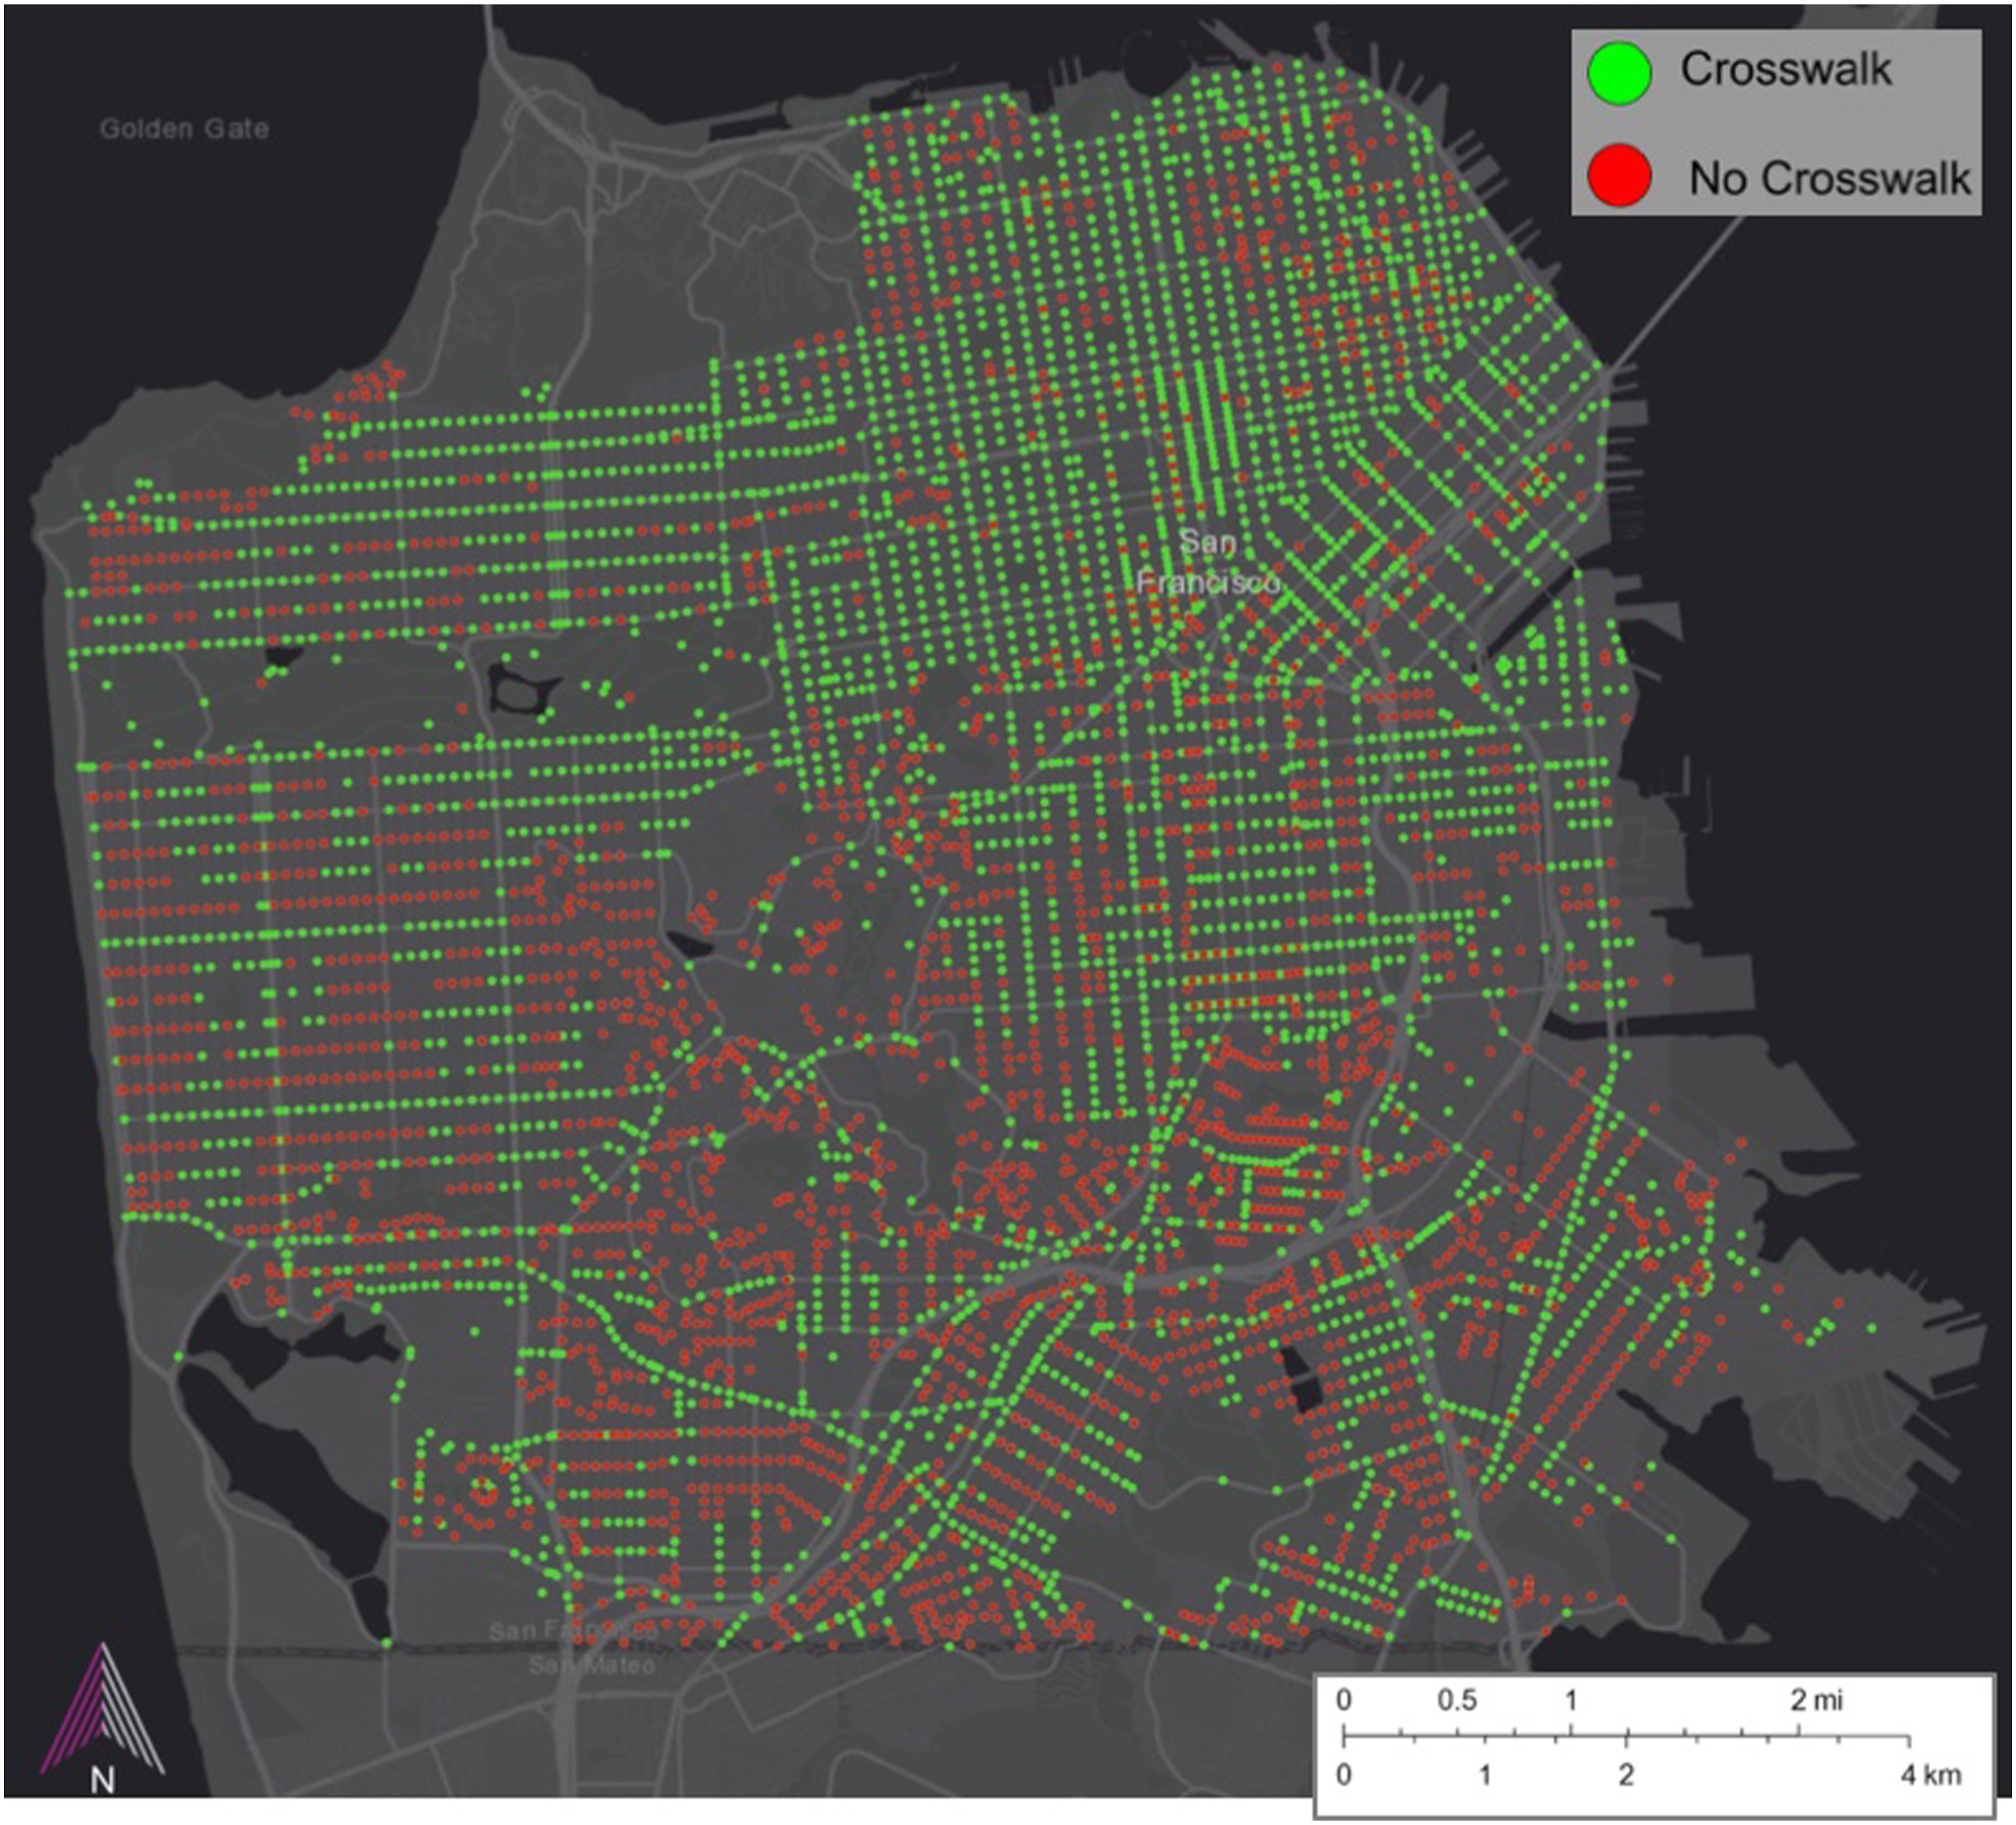
When crosswalks are aggregated by Census tract, geographic patterns in coverage become further evident; high-coverage tracts cluster in the northern half of San Francisco, and low-coverage tracts cluster in the southern half (see Figure 5). Again, this trend remains the case not just concerning the downtown core, but citywide and across a range of neighborhood types and densities. Beyond spatial patterns, the variation in general is quite stark; there are 14 tracts with 100% crosswalk coverage (covering 181 intersections) whereas one tract in the Inner Sunset neighborhood has only three marked crosswalks across 42 intersections (7% coverage). The large tract in the southwest corner of San Francisco, which stands out in that quadrant for high crosswalk coverage (95%) is dominated by multiple golf courses and a lake. Crosswalk coverage by Census tract in San Francisco, CA.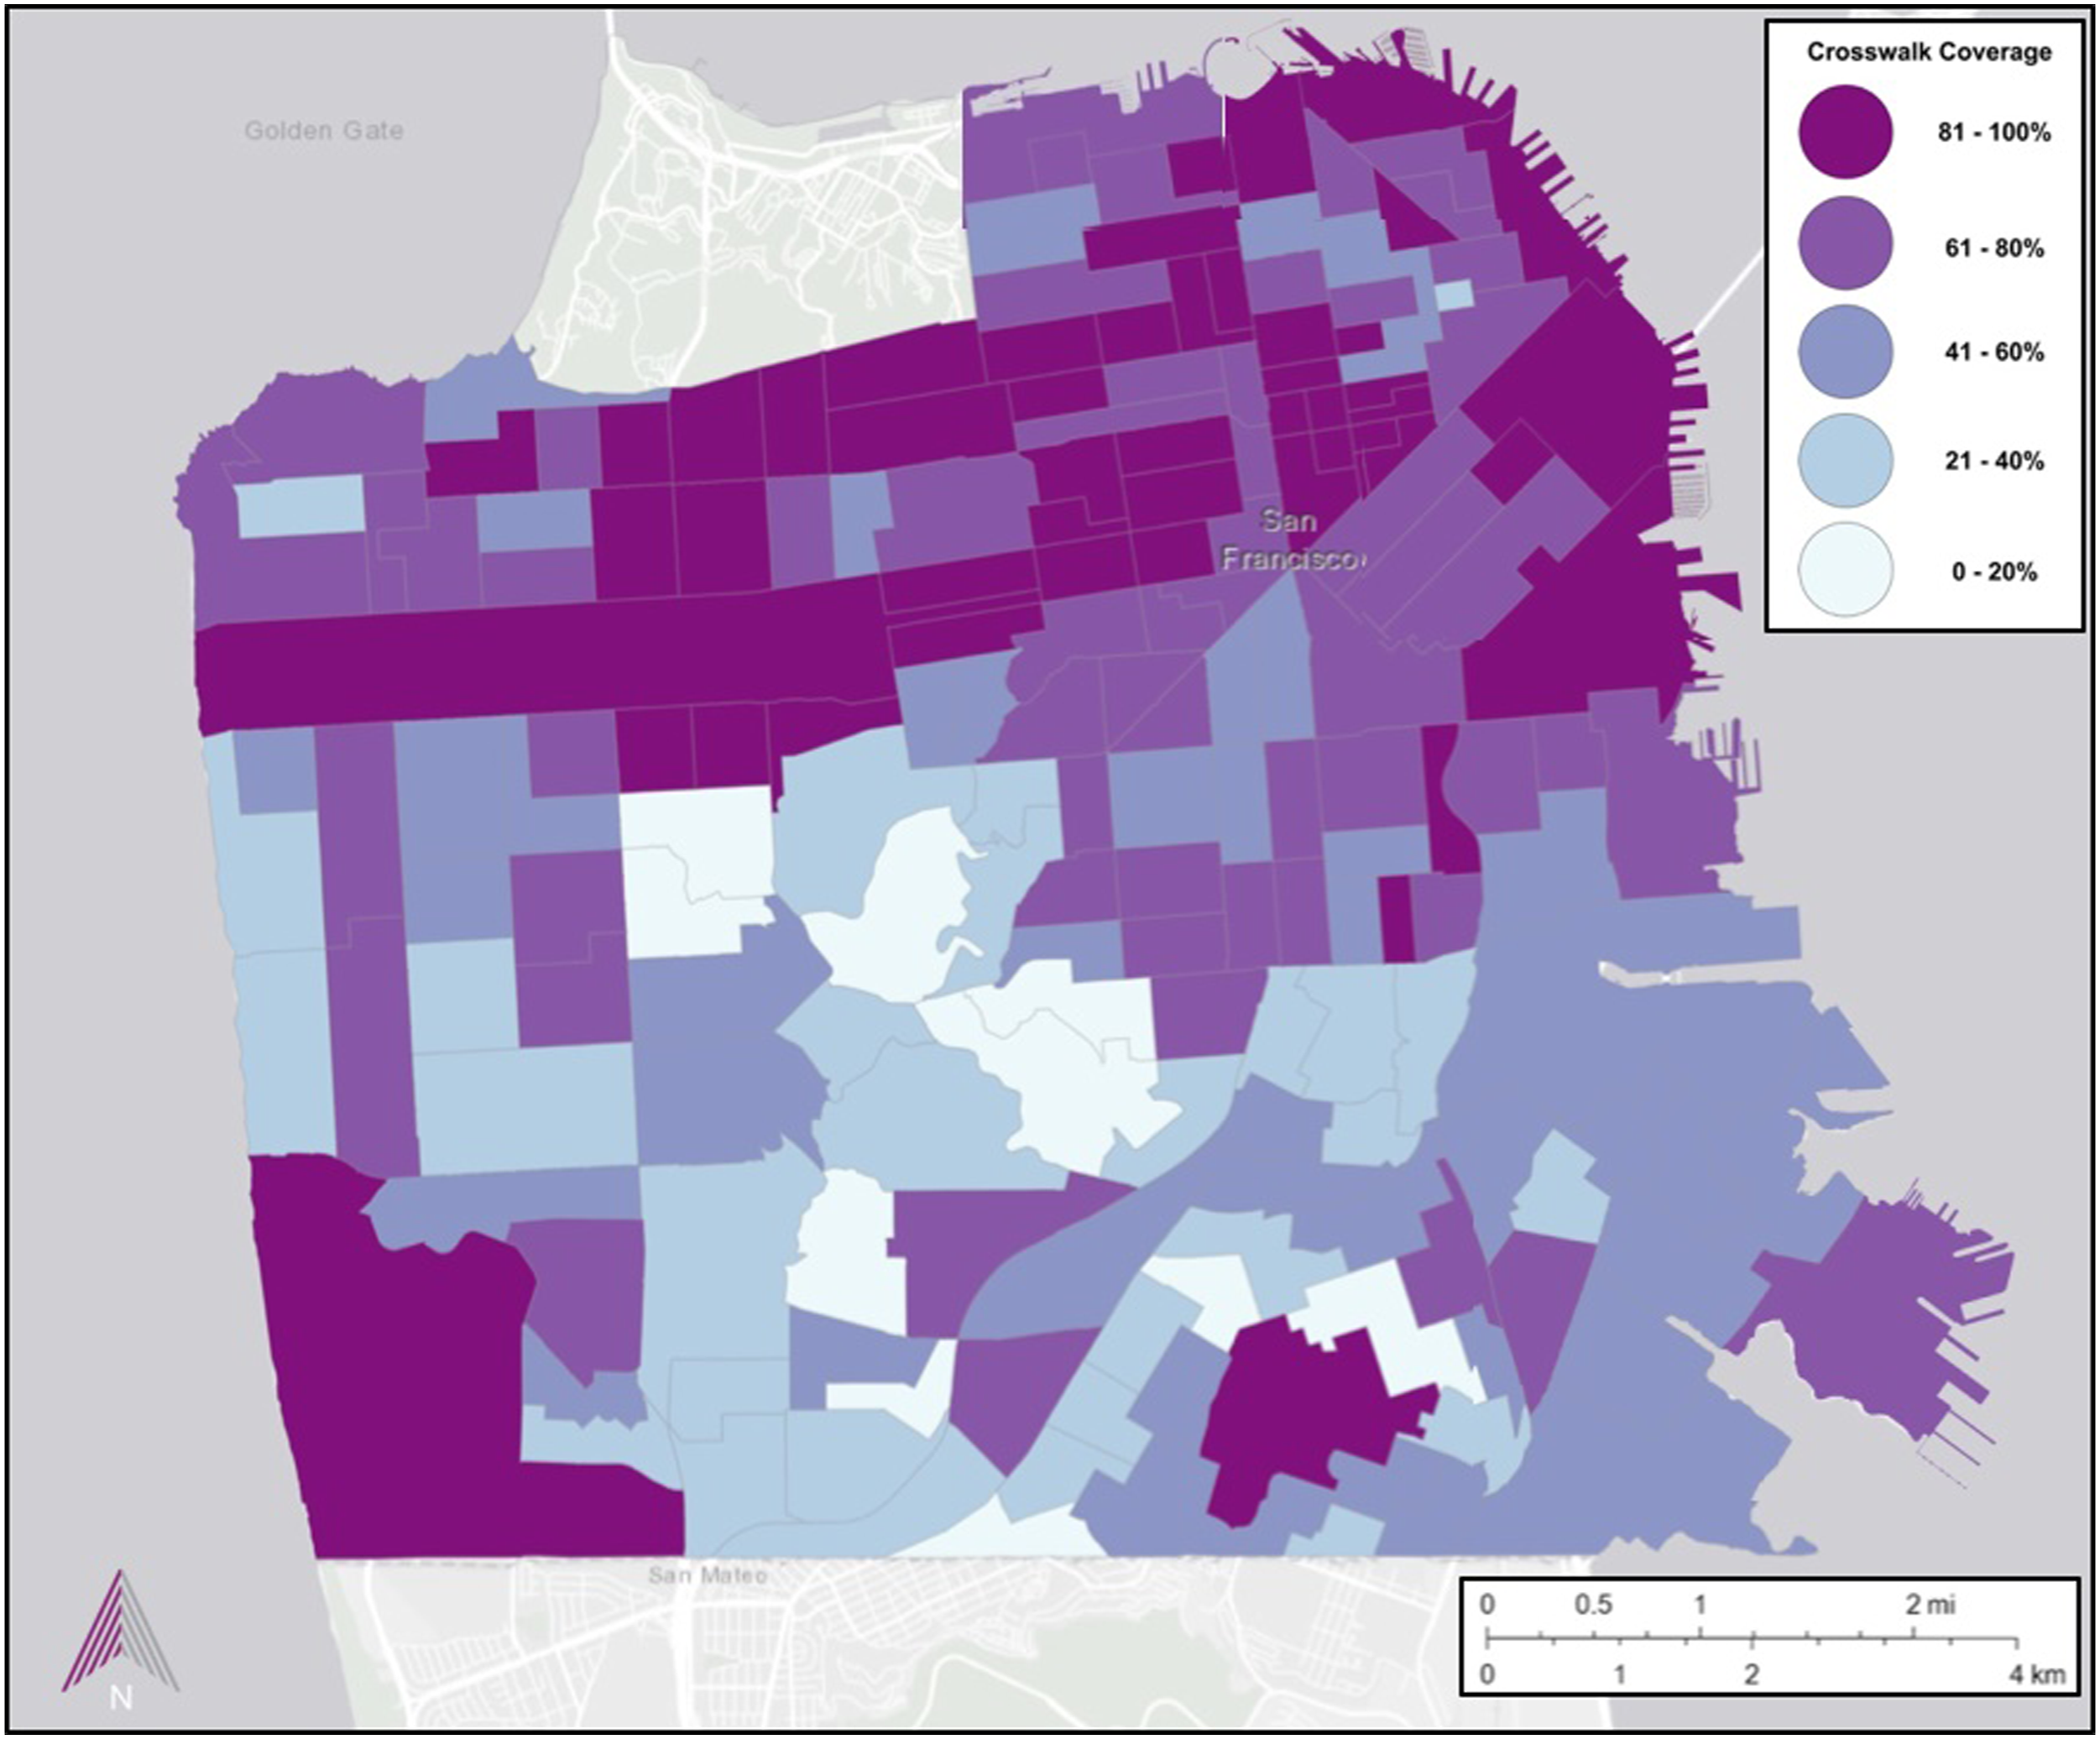
Two variables drawn from American Community Survey data were compared to crosswalk coverage at the Census tract level: density (persons per square mile) and average household income (based on 2019 figures, 5-year estimates). Simple linear regression analysis found no association between either density or average household income with crosswalk coverage at this scale, with R2 values of 0.11 and 0.001, respectively.
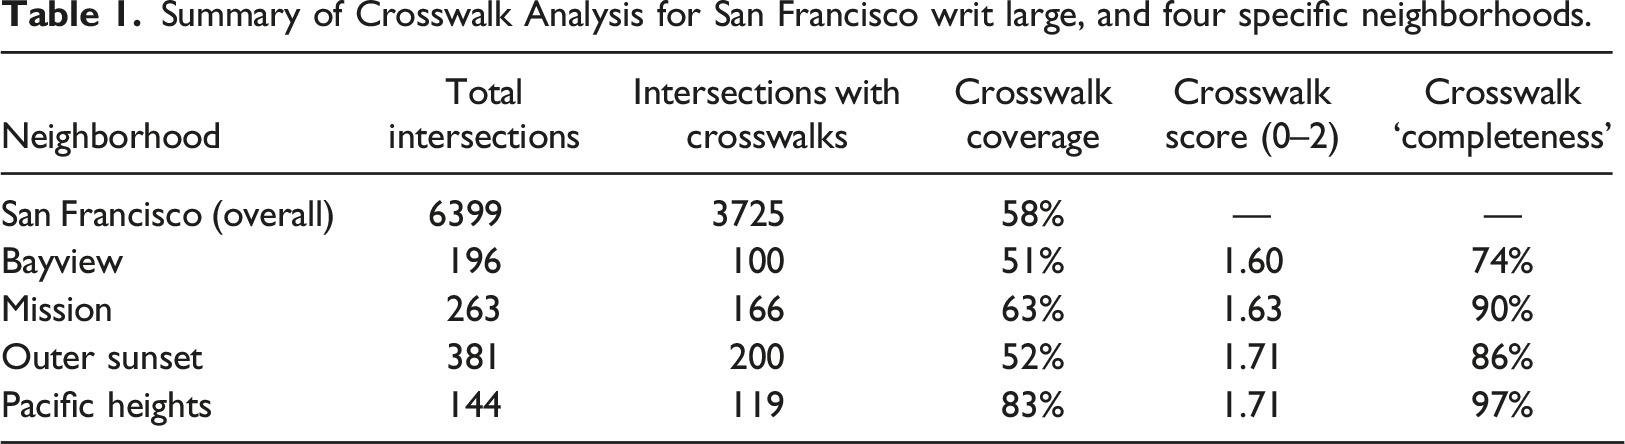
Summary of Crosswalk Analysis for San Francisco writ large, and four specific neighborhoods.
Though continental crosswalks were the most common category in all four neighborhoods, the relative percentage of those varied by neighborhood, along with standard and ladder crosswalks. For example, 78% of crosswalks in the Mission were continental, versus only 52% in the Bayview. In addition, 28% of crosswalks in Pacific Heights were standard, versus just 7% in the Mission. “Corridor effects” are evident at this sub-city scale, in that all intersections along certain streets feature marked crosswalks. For example, all 31 intersections of Noreiga Street, running east to west in the Outer Sunset, feature a crosswalk. In comparison, Moraga Street (running parallel to Noreiga, just one block north), maintains only five intersections with crosswalks (see Figure 6). Crosswalk coverage in San Francisco’s Outer Sunset neighborhood, with several corridors highlighted.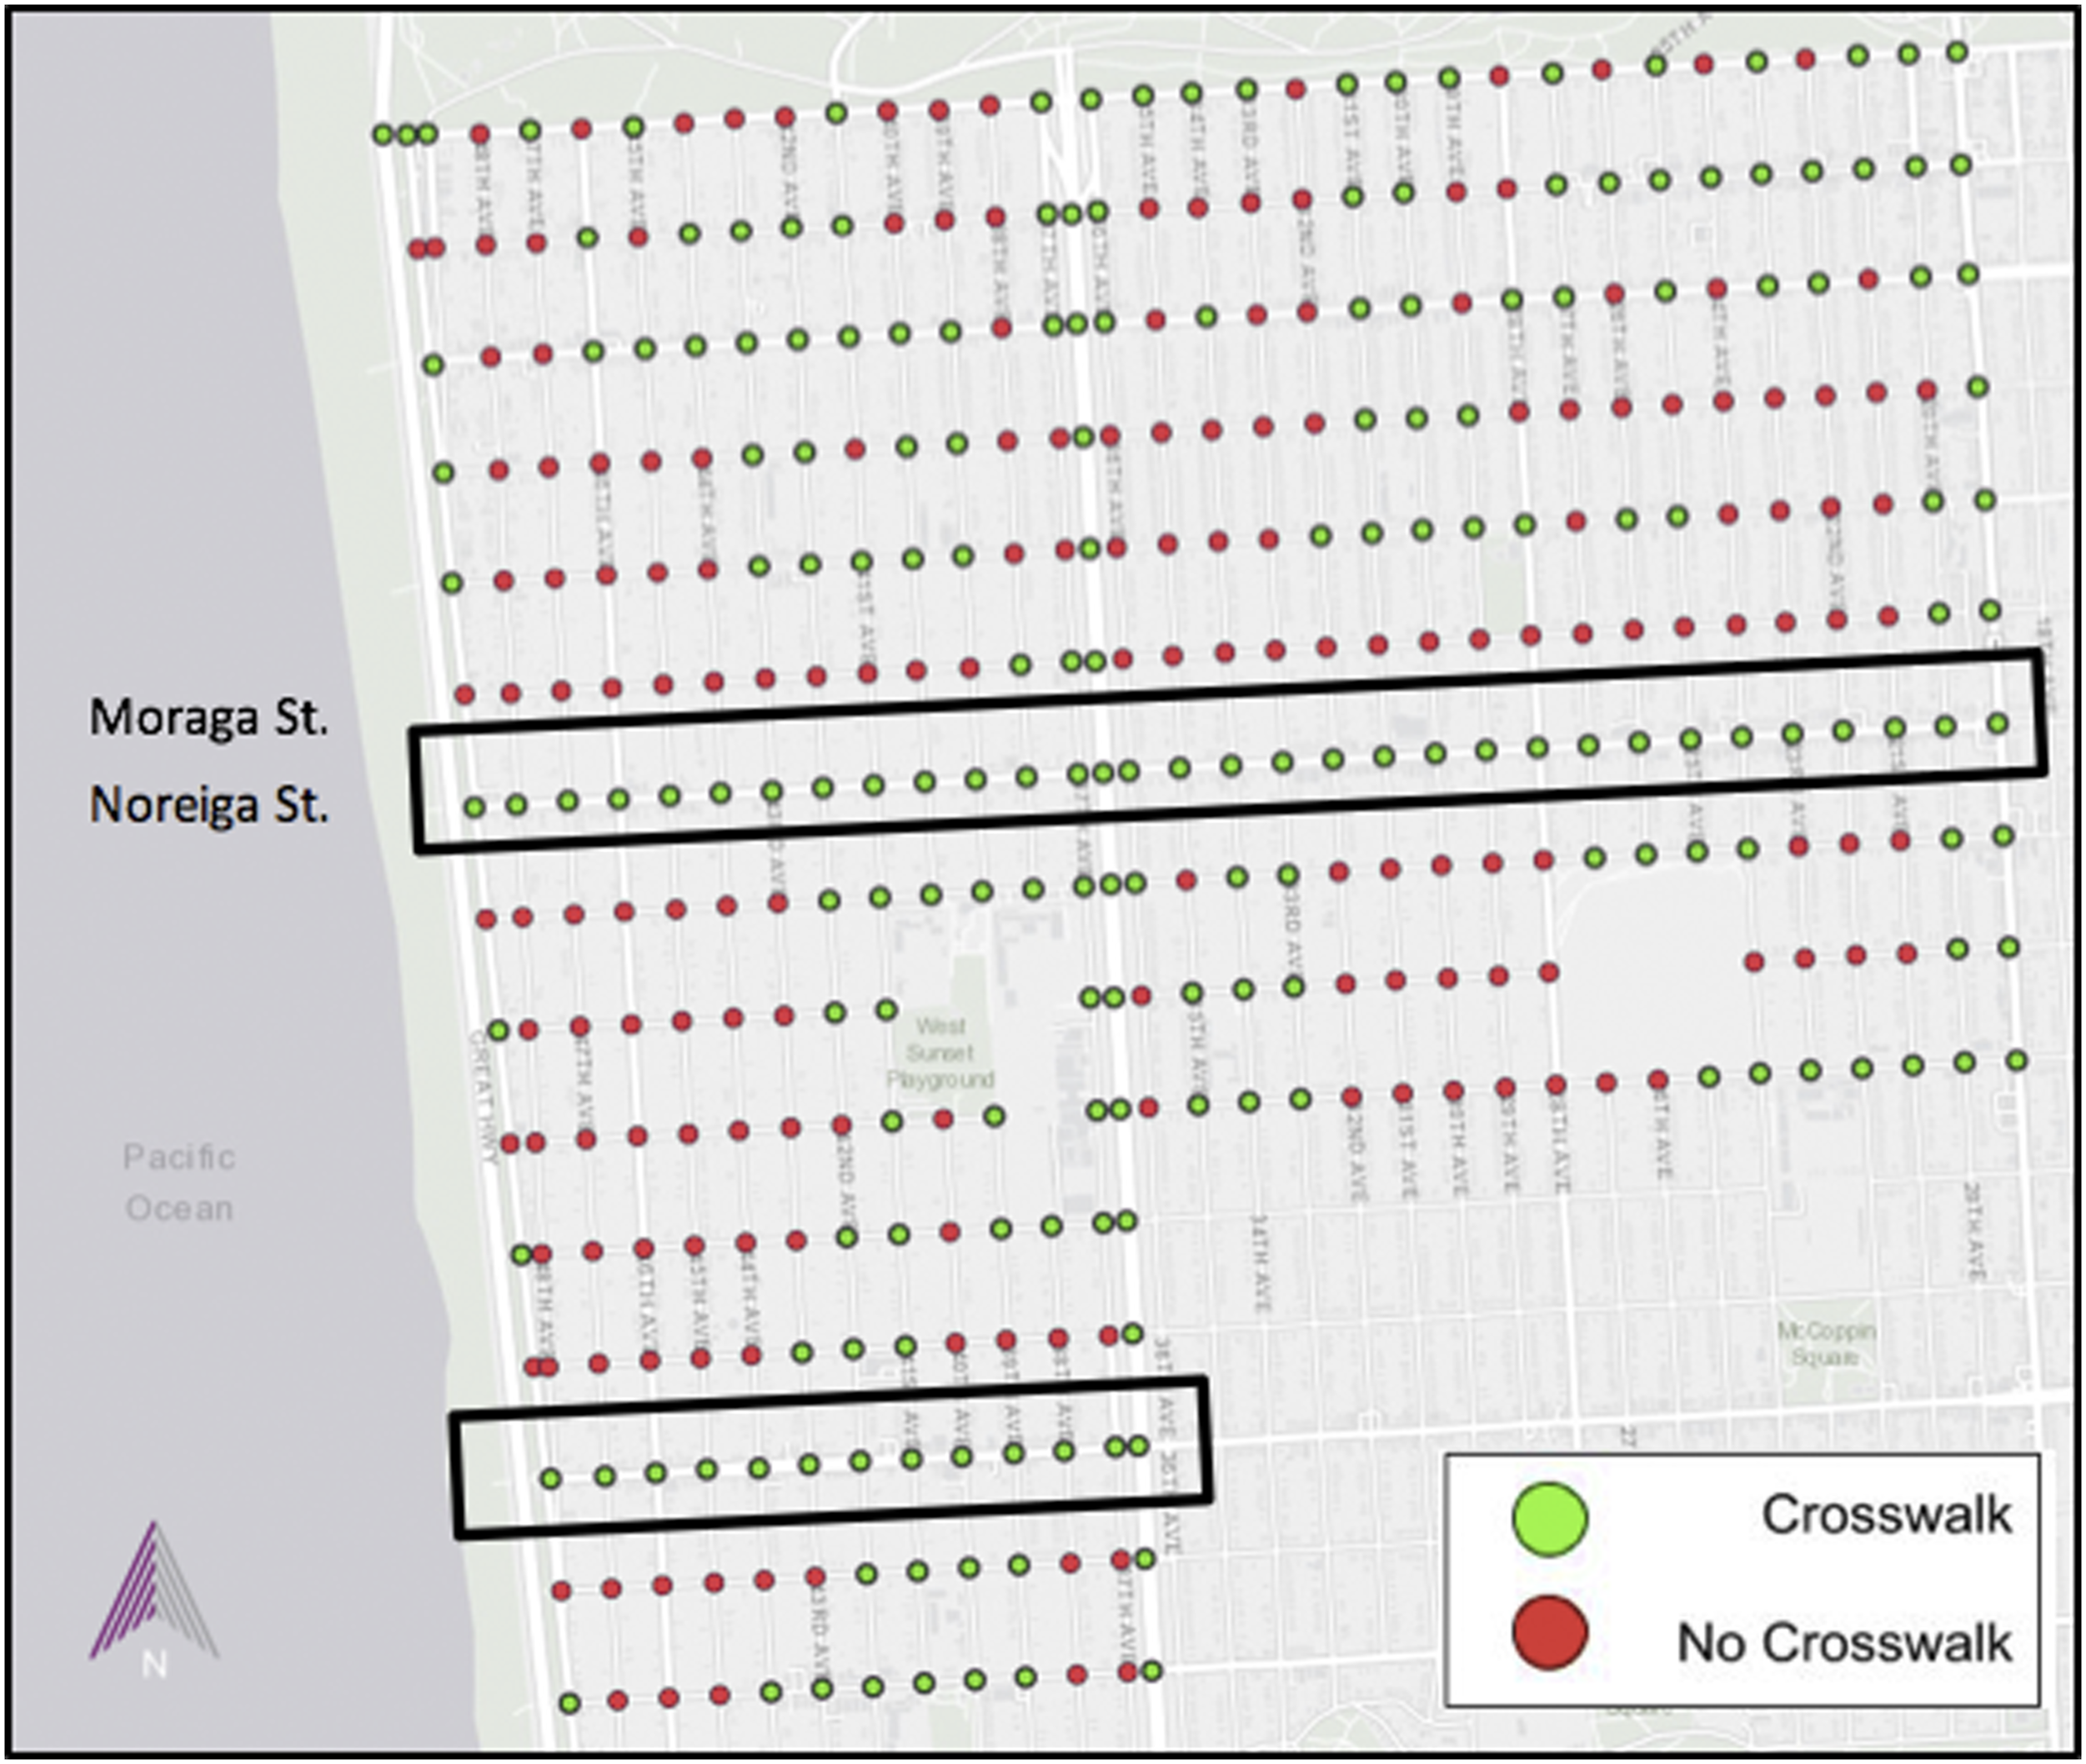
In the four neighborhoods reviewed more extensively, crosswalk quality (rated from 0 to 2) averaged 1.7, indicating high visibility of marked crosswalks. Moreover, crosswalk quality varied minimally across the four neighborhoods (from 1.60 in the Bayview to 1.71 in Pacific Heights). This indicates crosswalks vary more so in terms of their geographical footprint than visibility. Of the 586 intersections with marked crosswalks in this subset, 87% of them were “complete,” in that all adjacent blocks featured connecting crosswalks. The percentage of crosswalk-intersections that were complete did vary, with Pacific Heights having the highest rate (97% complete), followed by the Mission (90%), the Outer Sunset (86%), and the Bayview (74%).
Discussion
Marked crosswalks are an essential component of pedestrian infrastructure in U.S. cities, yet their spatial provision within and across neighborhoods has never been analyzed. Satellite imagery provides a highly-accurate way to map crosswalks’ geographic footprint at scale, with San Francisco providing an ideal initial case. This approach introduces the measurement of “crosswalk coverage” (percent of total intersections featuring a crosswalk), and in doing so indicates that crosswalks are provided unevenly across San Francisco. Marked crosswalks are present at 58% of roughly 6,400 total intersections, featured most often in its northern half (stretching from the downtown core to residential neighborhoods westward) and declining in non-uniform ways outside of that. Mapping crosswalk coverage hotspots and by Census tract generates a stark picture of variation in pedestrian amenities, including one primarily residential tract in which just three of 42 intersections include crosswalks. There was no relationship found between Census tract density or average household income with crosswalk coverage. Should the city wish to extend pedestrian amenities to all neighborhoods more equally, this analysis could guide where to install new crosswalks and improve existing ones.
Of four neighborhoods analyzed to a deeper extent, coverage was highest in a high-income, largely white neighborhood (Pacific Heights), and lowest in a lower-income and more diverse neighborhood (the Bayview). Crosswalk provision in San Francisco is also often corridor dependent, in that specific streets feature crosswalks at each intersection, generally in commercial areas. Within four neighborhoods analyzed to a further extent, crosswalk “completeness,” defined here as the number of adjacent blocks with a connecting crosswalk, also varied, from 97% in Pacific Heights, to 74% in the Bayview. This secondary statistic demonstrates that not only may intersections differ in which receive marked crosswalks at all, but the quality of crosswalks themselves, in terms of completeness, may diverge. Furthermore, given evidence that “standard” crosswalk markings are less visible to motorists (Fitzpatrick et al., 2011), the identification of different percentages of crosswalk categories can empower cities to locate and potentially convert such intersections. This relates to San Francisco specifically, given its stated goal to “gradually have all crosswalk markings be converted to the high-visibility continental marking pattern” (“Crosswalks,” 2015).
As to the pedestrian and automobile volumes drawn from previous studies, scrutiny of these datasets is useful in the interpretation of the crosswalk coverage generated here, but do not fully explain the observed geographic patterns. Indeed, for both pedestrian counts between 2009 and 2010 and vehicle counts between 2014 and 2018, there is an overall gradient moving from San Francisco’s dense northeastern quadrant westward and southward. These trends, tied to a range of factors (land use, density, street width, commercial areas, etc.) no doubt influence where crosswalks are provided. Though, current crosswalk coverage citywide does not match these trends uniformly; indeed, pedestrian and automobile volume are lower in both the city’s northern and southern halves stretching west to the Pacific Ocean, yet large differences in crosswalk coverage persist, with the northern half maintaining far higher shares of intersections with crosswalks. For example, the Mission District recorded both higher pedestrian and automobile volume than Pacific Heights (and has a higher residential density), and yet the latter maintains higher crosswalk coverage. In addition, relying solely on pedestrian counts to determine where crosswalks are provided succumbs to a self-fulfilling prophecy; pedestrians may never feel comfortable crossing an intersection in significant numbers unless and until a marked crosswalk is present. Thus, planners should move from installing crosswalks “reactively” (or only where warrants are met), and transition to “proactive” crosswalk installation in order to spur walking.
Considering the benefits of crosswalks, both in terms of safeguarding pedestrians and encouraging walking, this study suggests that transportation planners can measure and address equity in crosswalk provision without a single existing record of their current distribution, category, or quality. In particular, analyzing crosswalks at larger scales can consider how pedestrian behavior may be less dependent on one specific intersection and more related to the overall crosswalk network.
Of course, this study does not presume that every intersection in a city (San Francisco or otherwise) requires marked crosswalks, particularly given finite resources for pedestrian infrastructure and genuine differences in traffic volume, street type, and surrounding land uses. Indeed, San Francisco has recently improved the pedestrian environment in a number of neighborhoods, including by reducing speed limits, restricting turns on certain streets, and installing refuge islands (Graf, 2020; Huston, 2021; Sawyer, 2017). Still, calculating crosswalk coverage across different geographic units enables the evaluation of a city’s transportation system that centers the experience of pedestrians. Although some cities may already maintain robust accounts of crosswalk provision and quality (or at least date of last surfacing), many do not, and satellite imagery can fill this data gap.
In terms of future research, manually classifying satellite imagery of crosswalks, while highly accurate, could be expanded and accelerated by automating the process. As noted in the methods section, manual review of a city this size took approximately 90 hours of intersection analysis, not an amount of time many planning departments can dedicate to such a project. Given that, automated classification would allow for the completion of such work to be done much faster, enabling the study of much larger municipalities (such as Chicago, New York, and Los Angeles), and even cross-city comparisons. Given previous work on supervised classification of urban-street features (noted in the literature review), this study could serve as a “training set” for automating the process elsewhere for crosswalks. In the context of supervised classification, this entails using the set of manually identified crosswalks from this case to train a GIS software algorithm to automatically locate all marked crosswalks in a new location or map extent.
In addition, street-level imagery, which is increasingly available for a number of cities (e.g., via Google, Bing, and Apple maps), could also be used in future work, given it has been recently deployed to detect crosswalks and other accessibility issues (Berriel et al., 2017b; Smith et al., 2013; Sharif et al., 2021). This is particularly the case when satellite imagery is obstructed by trees, buildings, or shadows, making crosswalk detection and evaluation difficult from the overhead/aerial perspective. Moreover, generating crosswalk coverage for the first time raises the prospect of probing associations between this new metric and pedestrian-safety outcomes, particularly roadway collisions. Indeed, this new dataset offers the chance to understand if and how crosswalks safeguard pedestrians to different extents in different neighborhoods. Though pedestrian-collision data are available down to the block level in San Francisco, data for traffic and pedestrian volume (important control variables) are far less granular, which complicates such an analytical task. Furthermore, this study could be complemented by gathering a range of street and traffic characteristics (such as road width and speed limit) to perhaps reveal how such infrastructure patterns came about, and where crosswalk gaps are the most problematic in terms of transportation equity. Though this analysis found no relationship between either density or average household income with crosswalk coverage, there are certainly other variables to incorporate, including the location of primary schools, senior centers, and transit hubs. In addition, crosswalk location can also be included in the study of pedestrian route choice, which is increasingly taking place at the scale of entire cities (Sevtsuk et al., 2021).
Considering the range of variables at play, interviews with planners, residents, and pedestrian advocates represent an ideal next step in this research, and could add useful context and color to the spatial variations detected. This is particularly important given crosswalk coverage does not completely mirror pedestrian and automobile volume, which raises the question of how else crosswalk decisions are made by planners. In addition, there may be important differences in how and in what frequency residents petition local governments for marked crosswalks, such as via 311 services or at public meetings. Moreover, differences in crosswalk category may relate to changes in work crews tasked with installation over time, as well as prevailing guidance from traffic-safety bodies.
There are several limitations to this research. The first is that while satellite imagery is effective in terms of identifying and appraising crosswalks based on existing resolution, there have inevitably been changes to San Francisco’s intersections since these data were reviewed in 2021. This includes new crosswalks being installed and/or existing crosswalks being covered up during road paving or adjacent construction. Thus, more so than an up-to-the-minute record of crosswalks in San Francisco, this study represents the status of crosswalks at a single moment in time for this case, and a proof of concept for considering crosswalk coverage more broadly. In addition, there is some inherent reductiveness to the analysis here, such as the fact that certain complex intersections (where many roads converge) are reduced to a simple “crosswalk” or “no crosswalk” rating. This binary output, while useful when considering Census tracts, neighborhoods, and a city writ large, leaves out other details that complicate the picture of which intersections are actually most in need of improvement. An example of two intersections, ranging in complexity, is pictured in Figure 7. Example intersection in San Francisco that vary in complexity. The intersection on the left has no marked crosswalks, whereas the intersection on the right does, though that binary distinction does not fully capture the pedestrian environment at either, or how planners may decide to modify them.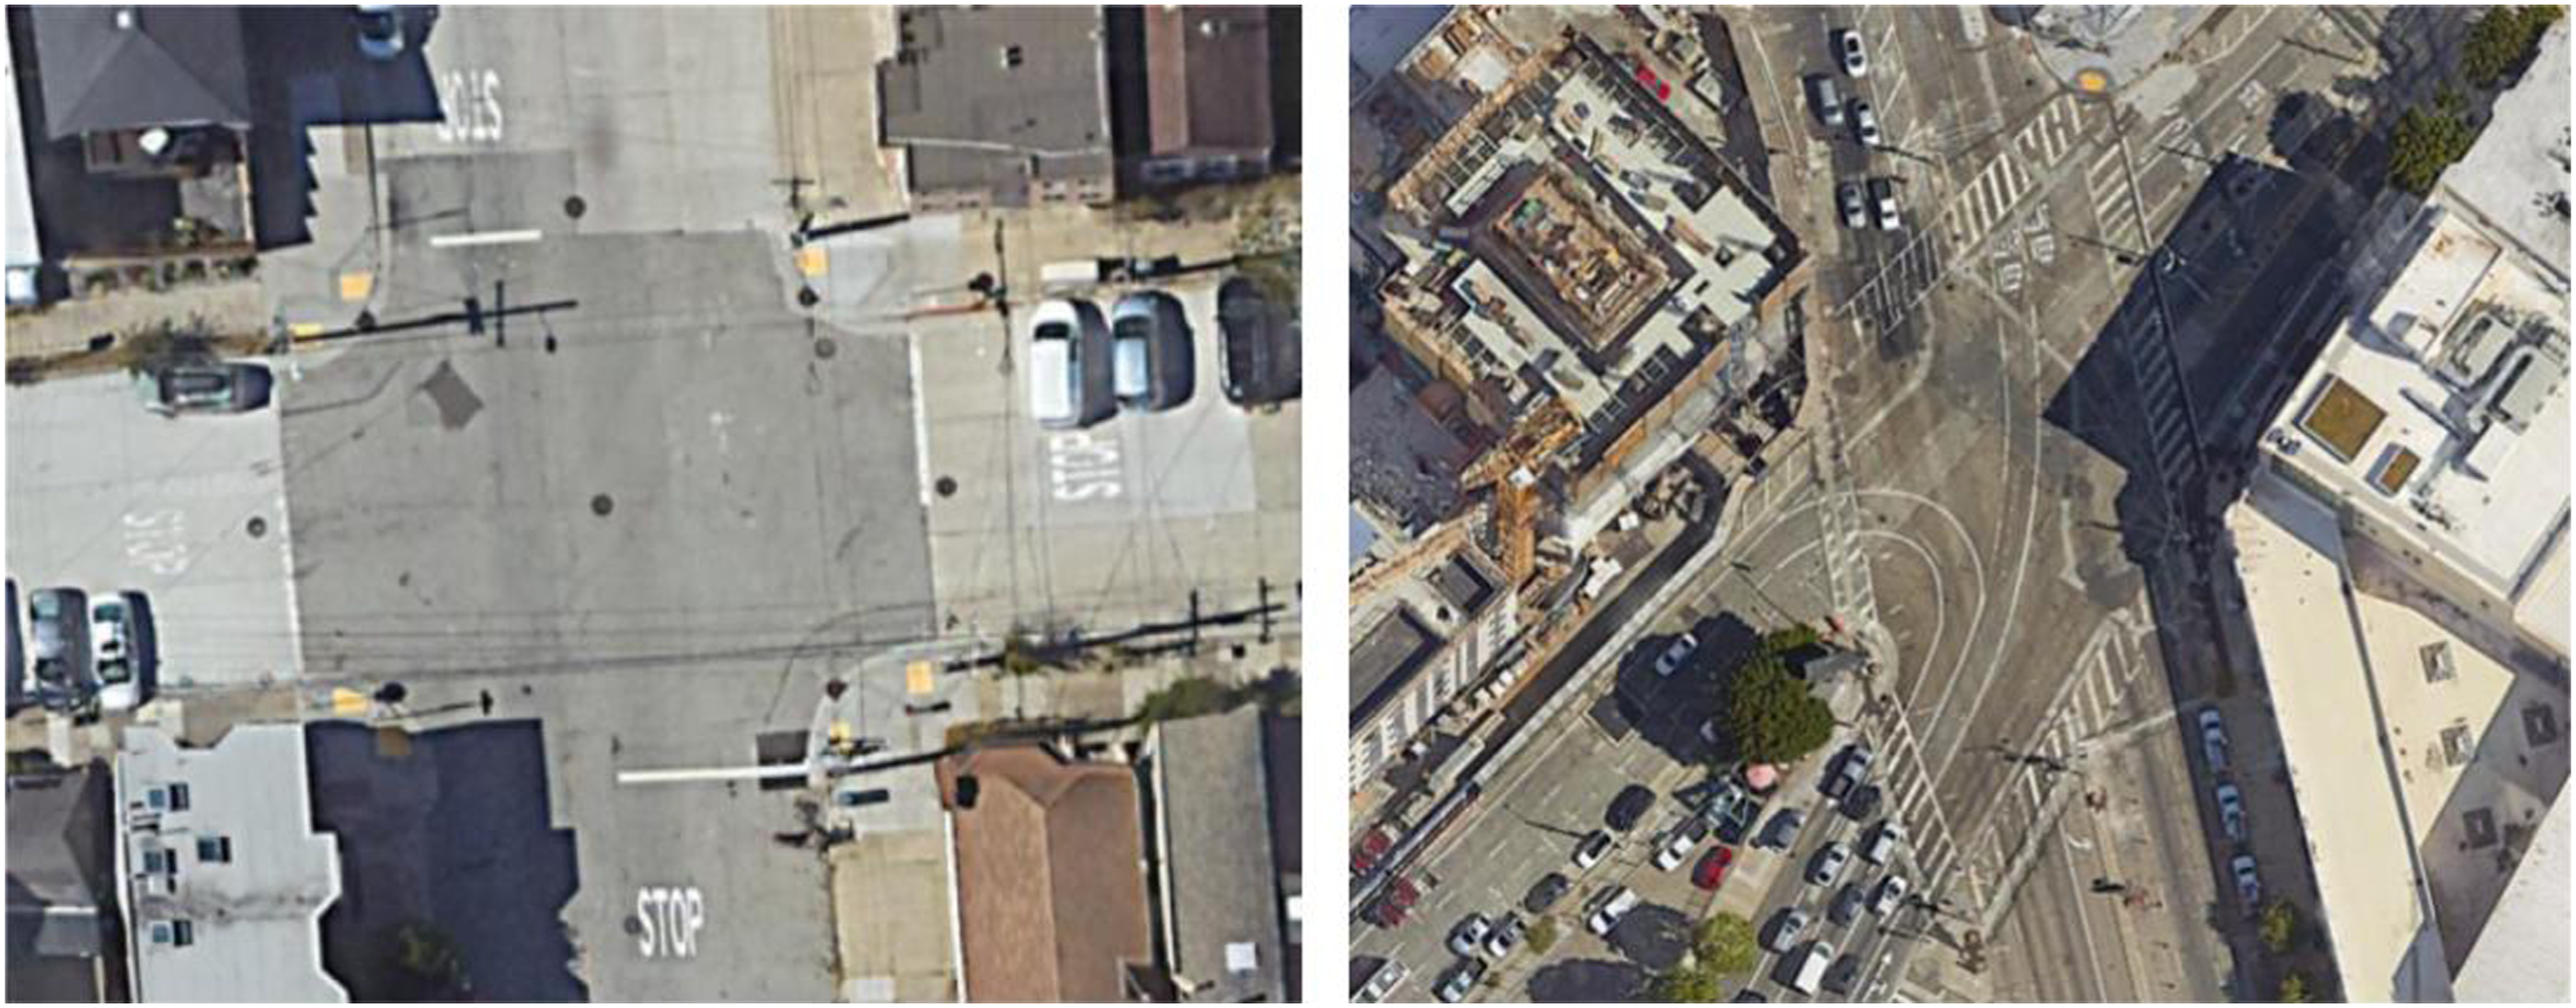
This project omits other amenities which undoubtedly contribute to the pedestrian experience, including traffic signaling (both for motorists and pedestrians), refuge islands, speed tables, and curb bulb-outs, among many others. Treasure Island (which is part of San Francisco) is excluded from this analysis due to large-scale construction taking place during this time frame, which rendered crosswalk analysis difficult. Similarly, the Presidio of San Francisco, part of the National Park Service, is not under SFMTA’s jurisdiction and is also excluded. Finally, like other cities during the COVID-19 pandemic, San Francisco has closed off a number of streets to non-local traffic (“Slow Streets”; Rudick, 2020), some permanently so, which may change how planners weigh the benefits and drawbacks of installing new crosswalks at certain intersections and along certain corridors. For example, for intersections now part of a “Slow Street,” there may be less concern over inconsistent crosswalk provision. Moreover, the granularity of existing pedestrian and automobile volume data does not match the crosswalk analysis undertaken here. For example, though the State of California provides Annual Average Daily Traffic (AADT) Volume at roughly 20 locations in San Francisco, those readings do not include any spots within the four neighborhoods studied, and are almost entirely on highways that lack pedestrian crossings. This leaves open a great deal of ways to build on this new dataset going forward.
Overall, planning researchers and practitioners must not simply consider crosswalks at individual intersections, but their overall spatial distribution, which may mirror other types of public underinvestment, and make pedestrian-safety goals difficult to reach. Satellite imagery can reliably generate crosswalk-coverage maps, which enable comparisons at multiple geographic scales, and help prioritize upgrades.
Footnotes
Declaration of conflicting interests
The author(s) declared no potential conflicts of interest with respect to the research, authorship, and/or publication of this article.
Funding
The author(s) received no financial support for the research, authorship, and/or publication of this article.