
Abstract
Climate change is making our cities more vulnerable, increasing the needs for further policy actions to make them more resilient. In particular, the transport network is critical in the first phase of disaster response. This study presents the epirical findings of a large scale, nationwide analysis of the road network vulnerability in 69 Japanese cities. We (1) identify the level of network efficiency using topological elements in its undisturbed normal state; (2) evaluate the level of network robustness under different random and targeted attack scenarios; and (3) analyze the relationship of the identified network efficiency and robustness indicators with city-level characteristics. The main findings include: (1) cities with a higher population and a higher infrastructure investment tend to be more robust under random attacks; (2) larger cities tend to be less robust to targeted attacks, presumably due to their high agglomeration of urban functions; (3) car dependency tends to make cities more vulnerable toward random attacks and less vulnerable toward targeted attacks as it indicates a weaker concentration in urban functions; and (4) a high modal share for trains tends to make cities less vulnerable toward random events as it indicates a high agglomeration of urban functions. These findings will help policymakers to prioritize their budget allocations to improve nationwide disaster resilience.
Introduction
The road network is a vital part of any city. It makes different opportunities accessible to the people of the city, having a direct impact on their lives. Furthermore, it has macrolevel impacts on the city, region, and the nation. It serves as a driving force for economic growth while also serving as a major lifeline support during disasters. Given the significant role that road networks play, it becomes imperative to determine if road network systems are well built to accommodate sudden incident occurrences. These incidences of disruption can range from routine road repairs, traffic accidents, and extreme weather conditions to intentional acts of conflicts (Berdica, 2002). Mattsson and Jenelius (2015) classified these incidences into four types: (a) internal accidental events such as technical failures; (b) internal intentional interference such as labor market conflicts; (c) external accidental events such as natural disasters; and (d) external intentional interference such as terrorist attacks. Such events or interferences can possibly cause severe damage to the networks by reducing its efficiency and level of service. Due to climate change, such disruptions are becoming increasingly common around the world. A city’s climate resilience will be tested during such situations, and the efficiency and robustness of its road network will play a significant role. The transportation policies of the future must be sensitized toward climate emergencies. Our cities and their road networks must be better prepared against them.
To understand the performance of transport networks, existing studies have introduced a number of performance indicators describing vulnerability, efficiency, and robustness of networks. Berdica (2002) summarized the different definitions of vulnerability and suggested that “vulnerability in the road transportation system is a susceptibility to incidents that can result in considerable reductions in road network serviceability.” Similarly, Hansen and Mladenovic (2006) described the differences between efficiency and robustness. They defined efficiency as “heuristics that provide optimal or near optimal solutions for all or at least most realistic instances,” while robustness was defined as the “performance of heuristics that is consistent over a variety of instances.” Therefore, efficiency can be understood as how well the road network performs in its undisturbed normal state. Meanwhile, robustness represents the road network performance under a disturbed state, where several disruptions occur. These indicators have been measured using numerous indices. Both efficiency and robustness have been commonly measured using topological elements of the system, such as nodes and links, and topological metrics including betweenness and closeness centralities (Anop, 2016). It is almost certain that disruptions in the network will result in reduction of its efficiency. However, certain networks inherently have the capacity to function and tolerate interruptions (Albert et al., 2000; Duan and Lu, 2014). The structure of the network and the importance of the attacked road will play a significant role in estimating the reduction in efficiency levels (Albert et al., 2000). Moreover, the efficiency and robustness of a road network might be associated with certain city-level characteristics, such as the size of the city, the travel behavior of the people, the investments being made on infrastructure and maintenance, and the fiscal health of the city. Knowledge of these associations will help policymakers to prioritize budget allocation to improve nationwide disaster resilience. However, to the authors’ knowledge, there is little evidence regarding these associations. A nationwide study across different cities would provide an opportunity to understand these linkages.
Japan has witnessed many such climatic disruptive incidents. A number of different types of natural disasters, including floods, tsunamis, landslides, and earthquakes have affected the lives of Japanese citizens. Recently, a similar incident occurred in the city of Kure, in Hiroshima prefecture in July 2018. Heavy torrential rains and the subsequent landslides damaged the arterial roads, leaving the city in a disrupted state (Asahi Shimbun, 2018). As a result of the damaged network, the city’s access to other areas was destroyed, and it created a food supply and water crisis. Moreover, it stopped people from going to work and participating in other economic activities. The impact of the incident was seen over the next three months as heavy congestion on its remaining roads continued (Chikaraishi et al., 2020). Similarly, the road networks of other Japanese cities have also been severely affected due to disasters in the recent past. With this study, we aim to investigate the road network vulnerability of Japanese cities and understand its relationship with city-level characteristics. We believe that a nationwide study comparing the levels of efficiency, robustness, and their relationship with policy variables will be beneficial for future researchers and policymakers. The study has the following three objectives: (1) to identify the level of network efficiency in 69 cities from Japan using topological elements in its undisturbed normal state; (2) to evaluate the level of network robustness under different random and targeted attack scenarios; and (3) to analyze the relationship of network efficiency and robustness indicators with city-level characteristics. Even though this study will evaluate the vulnerability of the road network based on the concepts of efficiency and robustness as observed in previous studies (Mattsson and Jenelius, 2015), it will contribute to the literature in the following ways: first, most studies have only focused on one or compared a few cities (Anop, 2016; Demšar et al., 2008; Duan and Lu, 2014; Porta et al., 2006; Tsiotas and Polyzos, 2017). A nationwide comparison will present new knowledge with respect to how random and targeted attacks affect efficiency levels. Second, a comparative analysis between cities will add new knowledge regarding how different city-level variables such as city size, population, mode share, average travel time, and most importantly, the financial status of the city are associated with road network efficiency and robustness indicators. We formulate and test different hypotheses regarding the relationship of the above-mentioned city-level variables with efficiency and robustness indicators. Finally, by basing the study across different cities of Japan, which have frequently experienced disruptions in the form of natural disasters, this study will be beneficial to policymakers to prioritize their city budgets and focus on improving the efficiency and robustness of their cities’ networks. Particularly, we highlight the importance of urban form components in determining the robustness of the road network. We believe that such empirical results could only be obtained through a nationwide comparison.
This study is structured as follows: The next section reviews the related literature, covering the topics of topological vulnerability analysis, road network attack strategies, and the relationship with other city-level variables. The “Methodology” section describes the data used and illustrates the methodology employed to determine the efficiency and robustness of road networks. This section also discusses the hypotheses to be tested. Then, the results and its policy implications are discussed in the section that follows. Finally, we conclude our research by discussing the key findings, contributions, and directions for future research in the “Conclusions” section.
Literature review
Both natural and man-made networks have been extensively studied in the literature. Every network could be characterized by its nodes and the links connecting them. The topology of these networks varies. Strogatz (2001), in a review of studies on complex networks, observed that the studies were conducted in varied fields ranging from cell biology to business but argued that there existed unifying principles underlying the topology of these networks. The review identified that networks could be classified as chains, grids, lattices, fully-connected graphs, random graphs, small-world networks, scale-free networks, and generalized random graphs based on their complexity. They opined that in the longer run, theory will have to keep up in order to interpret data pouring in from various fields. In another study, Barthélemy (2011) laid down the characteristics of spatial networks and argued that topology alone does not contain all the information. Spatial features, for example, the cost associated with the length of links, would also affect the structure and properties of the network. Such features have been previously explored in the field of transportation (Ashton et al., 2005), the internet (Yook et al., 2002), mobile phone networks (Krings et al., 2009), power grids (Crucitti et al., 2004), water networks (Giustolisi et al., 2019), social networks (Jarrett et al., 2006), and random complex networks (Bradde et al., 2010).
In transportation networks, the importance of spatial features has been well established. Mattsson and Jenelius (2015), in their review of transport network vulnerability studies, observed that the studies could be broadly divided to two categories: (a) topological analysis and (b) system-based vulnerability analysis. The topological vulnerability analysis of transport networks converts real transport networks into an abstract network or graph consisting of nodes and links. Meanwhile, in system-based vulnerability analysis, the weighted abstract graphs (weighted based on network parameters such as travel time or generalized cost) are often merged with demand and supply side information about the transportation systems. For example, the analysis of vulnerability of a network is merged with transportation system models. Several studies have utilized both these methods in the past. Bono et al. (2010) demonstrated this by calculating the global and spatial correlations between path dependencies in directed networks and measured traffic flows. Akbarzadeh et al. (2019) used topological analysis to find the critical links in a network. Meanwhile, Duan and Lu (2014) estimated efficiency parameters by creating abstract networks at three different levels of aggregation viz. segment, stroke, and community. Similarly, Demšar et al. (2008) identified critical locations for the city of Helsinki using graph theory and strategic attack strategies. They identified areas in the city which were vulnerable from a topological standpoint. In Gao et al.’s (2019) study, the network vulnerability of both centrifugal and centripetal networks in six different cities was tested. By introducing attack strategies to remove links in the networks, the performance of these networks under these attacks was evaluated. They observed that an attack strategy based on the Ricci curvature caused a more rapid decline in networks’ performance as compared to a strategy based on betweenness centrality.
System-based analysis has also been widely conducted in the literature. The distinction of this particular type of study is that it combines the topological feature of a network with other system-based characteristics such as demand-supply information to develop indices to evaluate vulnerability. Zhan et al. (2017) utilized network congestion evolution data from Beijing and Shanghai to predict how functional failures caused due to traffic congestion and recoveries evolve in a topologically intact road network. Murray-Tuite and Mahmassani (2004) combined information on traffic flow, link capacities, travel times, and route availability to develop a network vulnerability index. Lu and Peng (2011) used residence and employment density indicators to incorporate accessibility into network vulnerability. They also observed that population was as an important element of a vulnerability index. Latora and Marchiori (2005) utilized travel time information to evaluate the network performance. Many other studies also incorporated such similar transport system variables to evaluate vulnerability (see Mattsson and Jenelius (2015) for details). It should be noted that system-based analyses are data and computationally intensive in comparison to the topological methods. As this study aims to evaluate the network vulnerability across cities in Japan and compare the findings, an analysis of vulnerability with the topological structure of the networks is deemed adequate. However, the networks of the cities were weighted using the average travel time information of the links.
Different studies have adopted different attack strategies to compute changes in the efficiency of road networks. Duan and Lu (2014) tested the impact of four attack strategies. First, a percentage of roads were eliminated randomly. The second attack strategy called the “initial degree-based attack strategy” involved identifying road networks with the highest initial degree and then removing them in a descending order. The third attack strategy was also degree-based, but it included the calculation of the degree of each node at every step, i.e., recalculating after deleting the node with the highest degree. The final strategy was a “betweenness-based attack strategy,” which was similar to the third strategy but instead of degree centrality, they utilized betweenness centrality. Similarly, Holme et al. (2002) also adopted attack strategies based on initial centrality measures. Bellingeri et al. (2018) systematically attacked nodes based on (i) the number of nearest neighbors; (ii) next to nearest neighbors; (iii) next to nearest neighbors and nearest neighbors; and (iv) betweenness centrality. In addition, they adopted weighted attack strategies where nodes were removed based on the rank of nodes produced by the google page rank algorithm and the strength of the node, which is given by the “sum of the weight of links incident to the node.” The choice of attack strategies becomes critical with respect to the discussions around natural disasters. A simulation with the intention to replicate the effect of an external disaster should have a combination of both random and targeted attacks. Moreover, studies in the past have argued on the relevance of these indicators. For example, Demšar et al. (2008) identified that links with a high value of betweenness centrality are the most critical links in a network. It is because they represent the number of shortest paths passing through a link. Targeting those links might cause the highest damage to a network. However, Gao et al. (2019) in their study noted that attacking links using Ricci curvature caused relatively more damage as compared to the betweenness index. Mattsson and Jenelius (2015) cautioned that the effect in reality might be different and would also depend on the demand, supply, and the travel times of alternative routes.
Even though in system-based analyses, many variables capturing transport characteristics have been utilized to develop novel indices, only a few studies have evaluated other relevant city-level or region-level characteristics, which could have an effect on road network vulnerability. Strano et al. (2012) utilized 200 years of road network evolution data from a large area located in Milan, Italy, and analyzed the relationship between urbanization and evolution of road networks. Hayashi and Meguro (2012) observed that surviving nodes were concentrated in areas with high population. The analysis of such city-level variables is important with respect to policy discussions. There is a gap in the literature regarding the analysis of many other variables vis-à-vis network vulnerability. These variables include the city’s size, i.e., whether a city is compact or sprawled, the travel behavior of its people, and its financial status among other variables. Moreover, most of the studies have only focused on one city or a few cities, so a nationwide comparison of efficiency and robustness indicators would provide important knowledge on how various city specific variables relate to road network vulnerability.
Methodology
Data preparation
Data on 69 cities from 41 prefectures in Japan were selected. In the analysis, all road types (i.e., expressway, national, prefectural, and city roads) in the network were included. The 69 Japanese cities were chosen due to the availability of other city-level information particularly, from the nationwide person-trip survey conducted by the Ministry of Land, Infrastructure, Transport, and Tourism (2008). Detailed travel information, including modal share, percentage of people making at least one trip per day, and average travel time, was obtained for the cities (see Table S1 in the Supplemental Material for the list of cities). The use of data from the person-trip survey will enable this study to analyze the relationship between city-level travel-related variables and network vulnerability. In addition, this study also used the Japanese Government’s data on the financial strength index, infrastructure expenses, maintenance costs, and the city’s road extension in kilometers (km) (Cabinet Office, 2019). These data sets provide information on the city’s financial status and their expenditure on the construction and maintenance of road networks. The use of the same would suggest how the fiscal health of a city’s municipality relates to the efficiency and robustness of its networks. The data on the financial strength index were available from the year 2000 till year 2014. Meanwhile, the data for road construction costs and maintenance costs were available from 2000 to 2013. An average of the previous years for all 69 cities is considered for analysis. The data on the cumulative total length of the city’s road extension were taken for the year 2012. Finally, information on every city’s population, their area size, and population density was also considered. Table S1 in the Supplemental Material summarizes all the cities and the corresponding number of network links and nodes.
The data represent a good mix of cities of different sizes. The largest city in terms of the number of links was Yokohama, whereas the smallest was Ootake. Many of the important metropolises from Japan, such as Kyoto, Nagoya, Osaka, and Sapporo, have been considered for analysis. In addition, cities which suffered from natural disasters in the recent past such as Kumamoto (suffered from an earthquake in 2016) and Kure (suffered from landslides resulting from torrential rains in 2018) are also included in the analysis.
Research methodology
The methodology adopted for the analysis in this study can be divided into three parts: (1) measuring efficiency of networks; (2) measuring robustness of the network in the case of random and targeted attacks; and (3) analysis of the relationship with city-level characteristics. Figure 1 illustrates the research flow and lists four different hypotheses on the relationship of efficiency and robustness indicators with city-level variables. To calculate the efficiency of the networks in its undisturbed normal state, first, the network maps of the 69 cities were converted into an abstract network with nodes and links, where links were weighted using the average travel time to obtain the shortest travel time for any origin-destination (OD) pair in the network. The travel time was computed by multiplying the travel speed in kilometers per hour (kmph) by the total length of each link. The travel speed for each link was based on the road type, road width, surrounding roads, and actual speed regulations for ordinary vehicles (ESRI Japan, 2015). The average efficiency proposed by Latora and Marchiori (2001), where efficiency is defined as the average of the reciprocal of the shortest path between all node pairs, is modified further in this study as
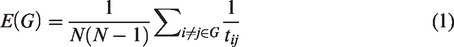

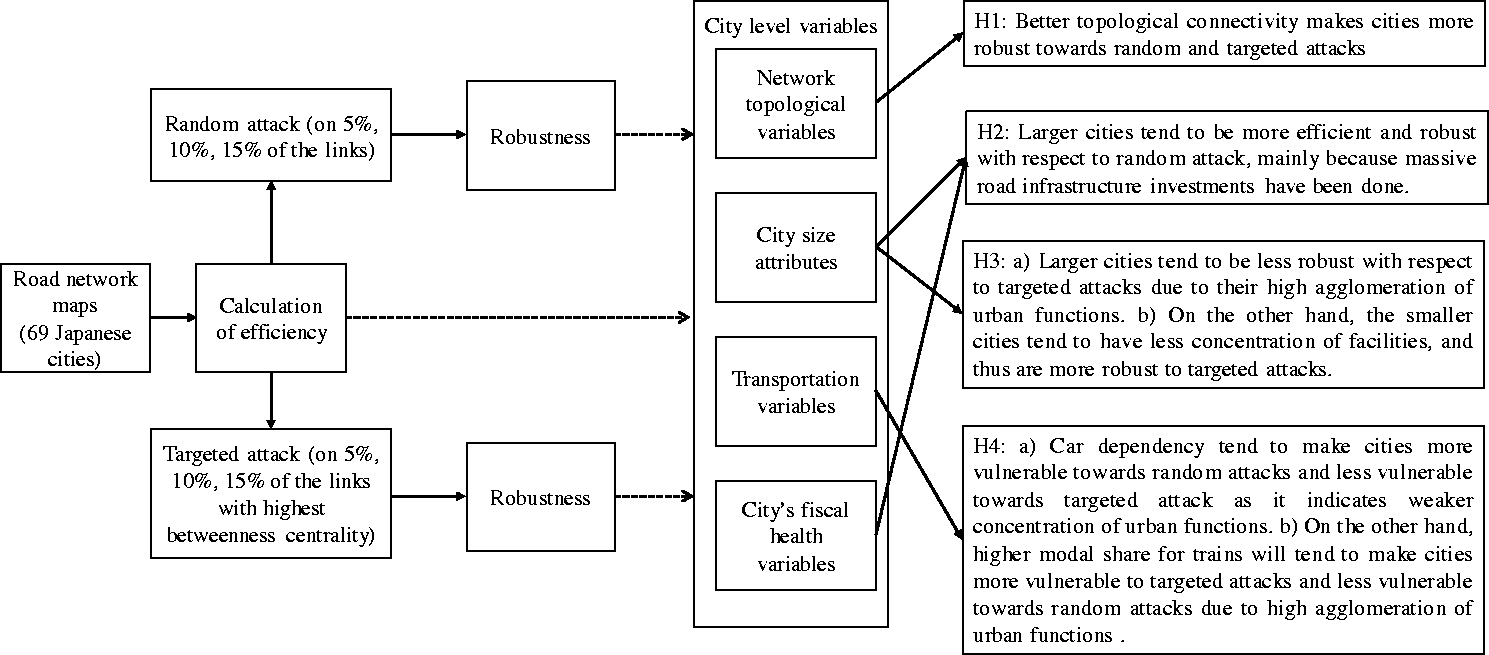
Overview of the research flow.
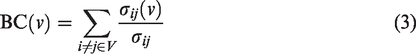
This study estimated the global efficiency for all 69 cities across Japan. Next, we estimated robustness, which is defined as the performance of a road network under a disturbed state, where several disruptions occur. It is equal to the percentage reduction of efficiency by road network disruptions. Higher efficiency percentage reduction in a network means a less robust network and vice versa. First, the robustness of all the networks was calculated based on equations 1 and 2 after randomly removing 5%, 10%, and 15% of all the links. In addition, the percentage change in the efficiency was estimated. For targeted attacks, the edge betweenness centrality measure was used as a basis for targeting the links. Edge betweenness centrality provides the proportion of the number of shortest paths that pass any given link (Brandes, 2008) and is represented by
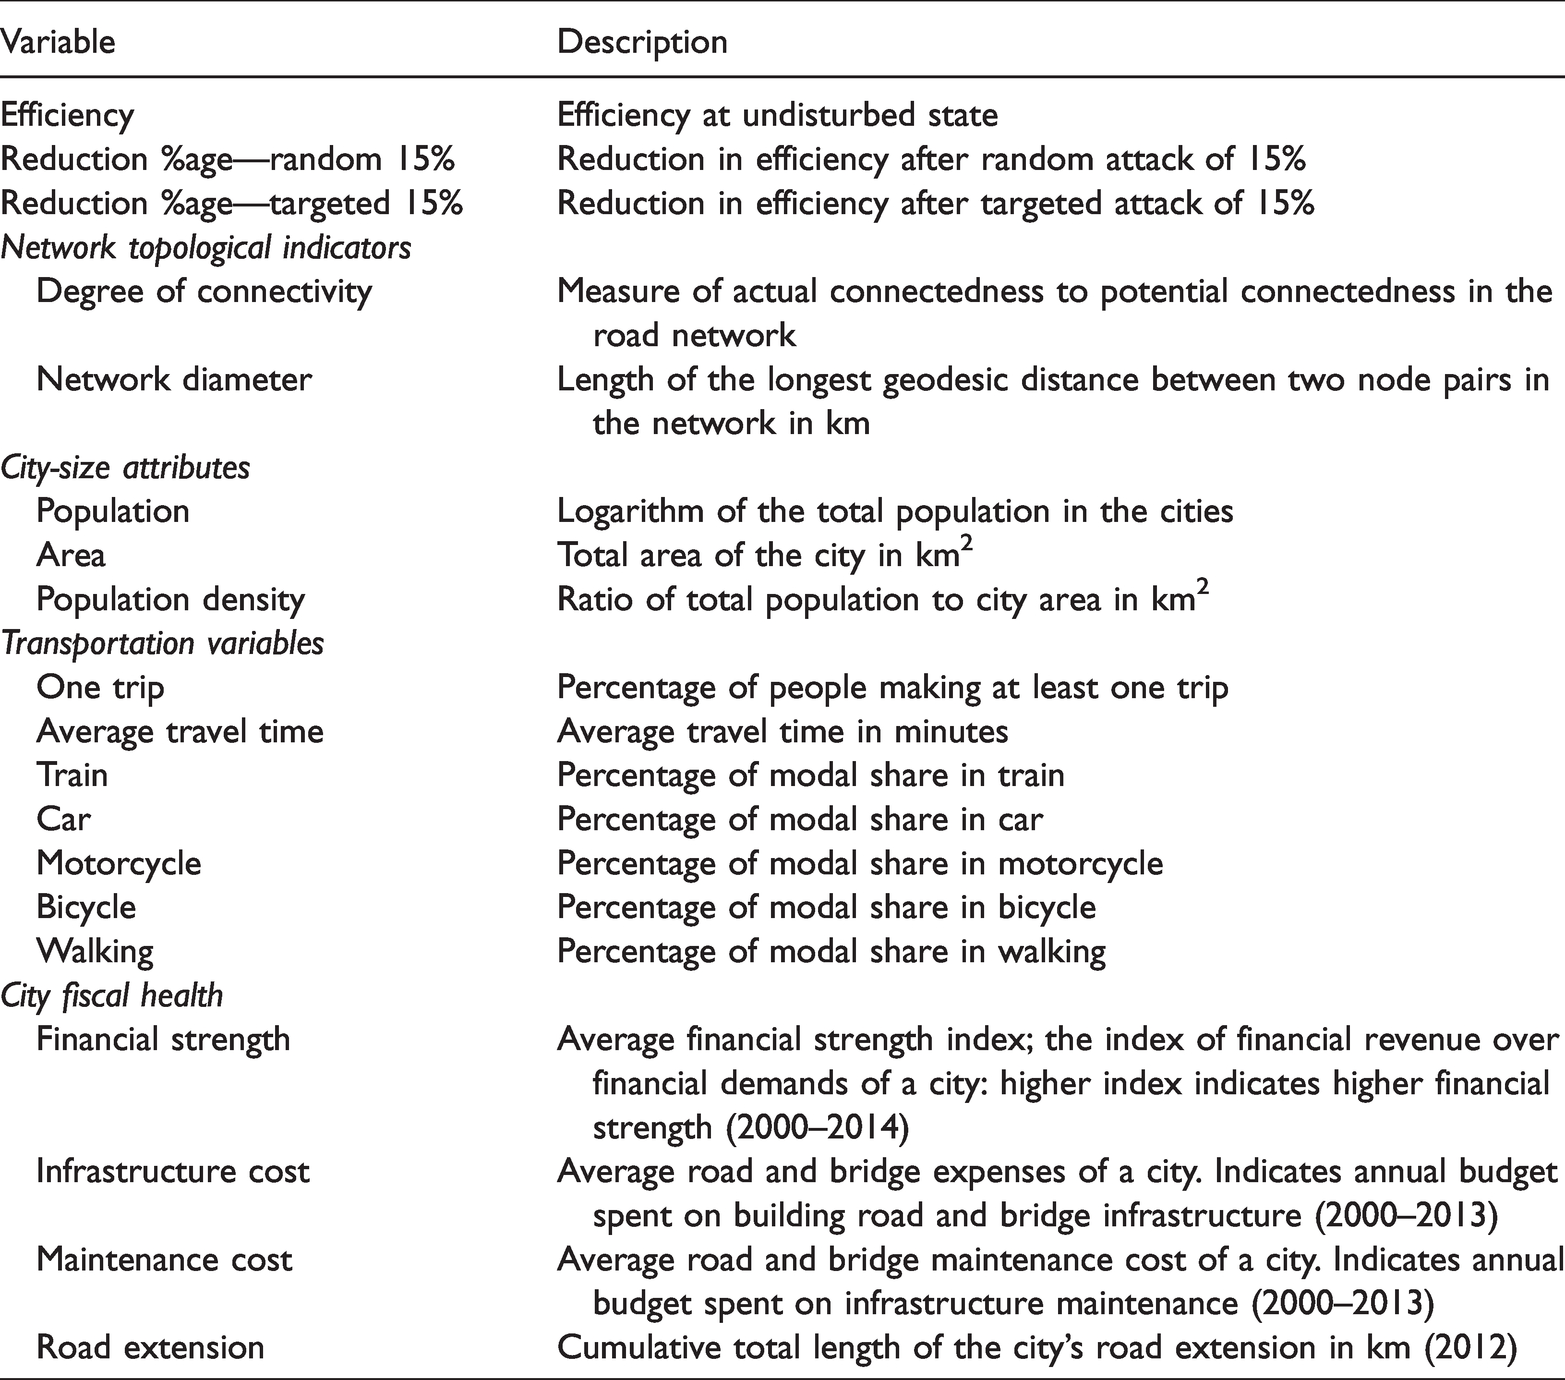
For the final part, we formulated four different hypotheses to test the relationships between city-level variables and road network vulnerability indices. The city-level variables were broadly grouped into four categories. First, network topological indicators include degree of connectivity and network diameter. Second, city-level attributes include population, city area, and population density. Third, transportation-related variables were extracted from the person-trip survey. This group of variables includes the modal share percentage in different modes, the average percentage of people making at least one trip, and the average travel time for each city. Finally, the fourth category of variables included variables denoting the fiscal health of a city, namely the financial strength index, infrastructure cost (road and bridges cost), and maintenance cost. In addition, the cumulative length of road extension was also included under this category. The detailed description of the variables is provided in Table 1. The basic idea behind formulating the hypotheses was to inform policy decisions by determining if there was any relationship between city-level variables and road network vulnerability. The hypotheses to be tested are listed below:
List of variables for correlation analysis.
H1: Better topological connectivity makes cities more robust toward random and targeted attacks.
The study calculated different topological indicators for the cities of Japan including the degree of connectivity, which is basically an indicator of how well a city’s major centers are connected. The evaluation across different cities gives the opportunity to test how connectivity of a city is linked with its performance during strategic attacks.
H2: Larger cities tend to be more efficient and robust with respect to random attack, mainly because massive road infrastructure investments have been done.
H3: (a) Larger cities tend to be less robust with respect to targeted attacks due to their high agglomeration of urban functions. (b) On the other hand, the smaller cities tend to have less concentration of facilities and thus are more robust to targeted attacks.
H4: (a) Car dependency tends to make cities more vulnerable toward random attacks and less vulnerable toward targeted attack as it indicates weaker concentration of urban functions. (b) On the other hand, higher modal share for trains will tend to make cities more vulnerable to targeted attacks due to high agglomeration of urban functions.
The hypotheses were tested with the use of correlation analysis between the city-level variables and efficiency/robustness indicators. It should be noted that the correlation analysis only provides the level of associations between the variables. To make causal claims, longitudinal data would be required. Despite this limitation, we believe that the testing of these hypotheses would provide important knowledge with respect to the patterns and trends in relationships.
Results
Efficiency and robustness of the networks
In this analysis, travel time was used as the weight to create the graphs. Table 2 shows the summary of efficiency and robustness indices calculated for the road networks from 69 Japanese cities. The results show that the average of global efficiency (calculated from equation (2)) for all the cities was 0.21 with a maximum value of 0.28 and a minimum value of 0.12. A comparison across cities showed that the larger-sized network cities (e.g., Osaka, Nagoya, and Sapporo), which usually have in total more than 75,000 links, performed relatively better than small-sized network cities, which usually have in total less than 50,000 links. Table S1 in the Supplemental Material summarizes efficiency values for all cities. Figure S1 in the Supplemental Material illustrates the relationship between efficiency values with the population and the road density (total road length over area size). The results show that cities with a relatively lower road density tend to be more efficient than cities with a higher road density. Our results indicate that building more roads might not necessarily guarantee a higher topological efficiency. In fact, there is a possibility that the efficiency of networks could be linked to its urban form. Compact cities, where facilities and functions are concentrated to reduce the travel time (Burton et al., 2003), might have critical relationships with road network vulnerability. Similarly, cities where the facilities are spread out and have low levels of agglomeration could also be related to a network’s efficiency and robustness.
Summary of efficiency and robustness of road networks.
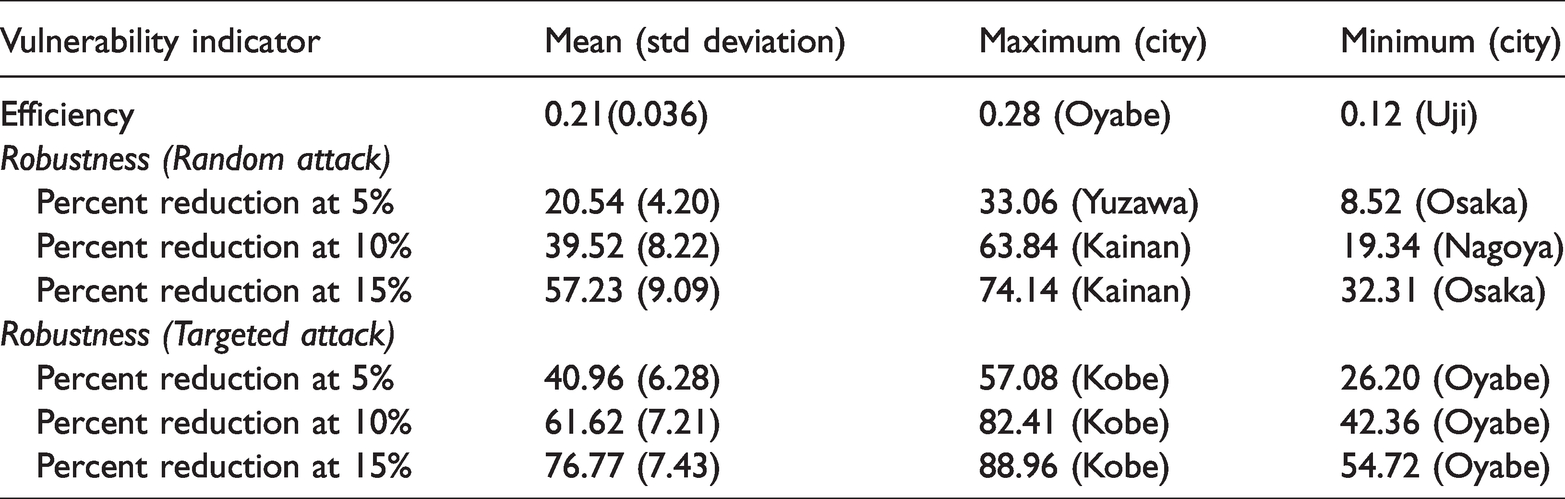
The robustness indicators showed that, on average, the reduction in efficiency was higher under targeted attacks as compared to random attacks. This is an expected finding and is consistent with findings from previous studies (Albert et al., 2000; Holme et al., 2002). Table 2 lists out a summary of the findings. The results showed that under random attacks of 5%, 10%, and 15% of link removal, the average reduction in efficiency was 20.54%, 39.52%, and 57.23%, respectively. Meanwhile, for targeted attacks, it was observed to be 40.96%, 61.62%, and 76.77%, respectively. The percentage reduction in efficiency due to targeted attacks on links with the highest betweenness index resulted in almost twice the damage compared to random attacks. A graphical summary of how each city faired against random and targeted attacks is presented in Figure S2 in the Supplemental Material. In addition, Table S1 in the Supplemental Material provides a comparison of efficiency and robustness indicators across cities when the links were weighted with distance instead of travel time. It was observed that distance-based efficiency and travel time-based efficiency had a low correlation of r = 0.161. This indicates that these indicators are highly sensitive to the weights attached to the links.
Relationship with city-level variables
Linear correlation coefficients were calculated for the relationships between city-level variables and efficiency/robustness indicators (for the 15% attack scenario). As explained earlier, the relationships were tested for four categories of variables including network topological indicators, city-size attributes, transportation variables, and city fiscal health-related variables. The results are summarized in Table 3.
Correlation between city-level variables and efficiency and robustness indicators.
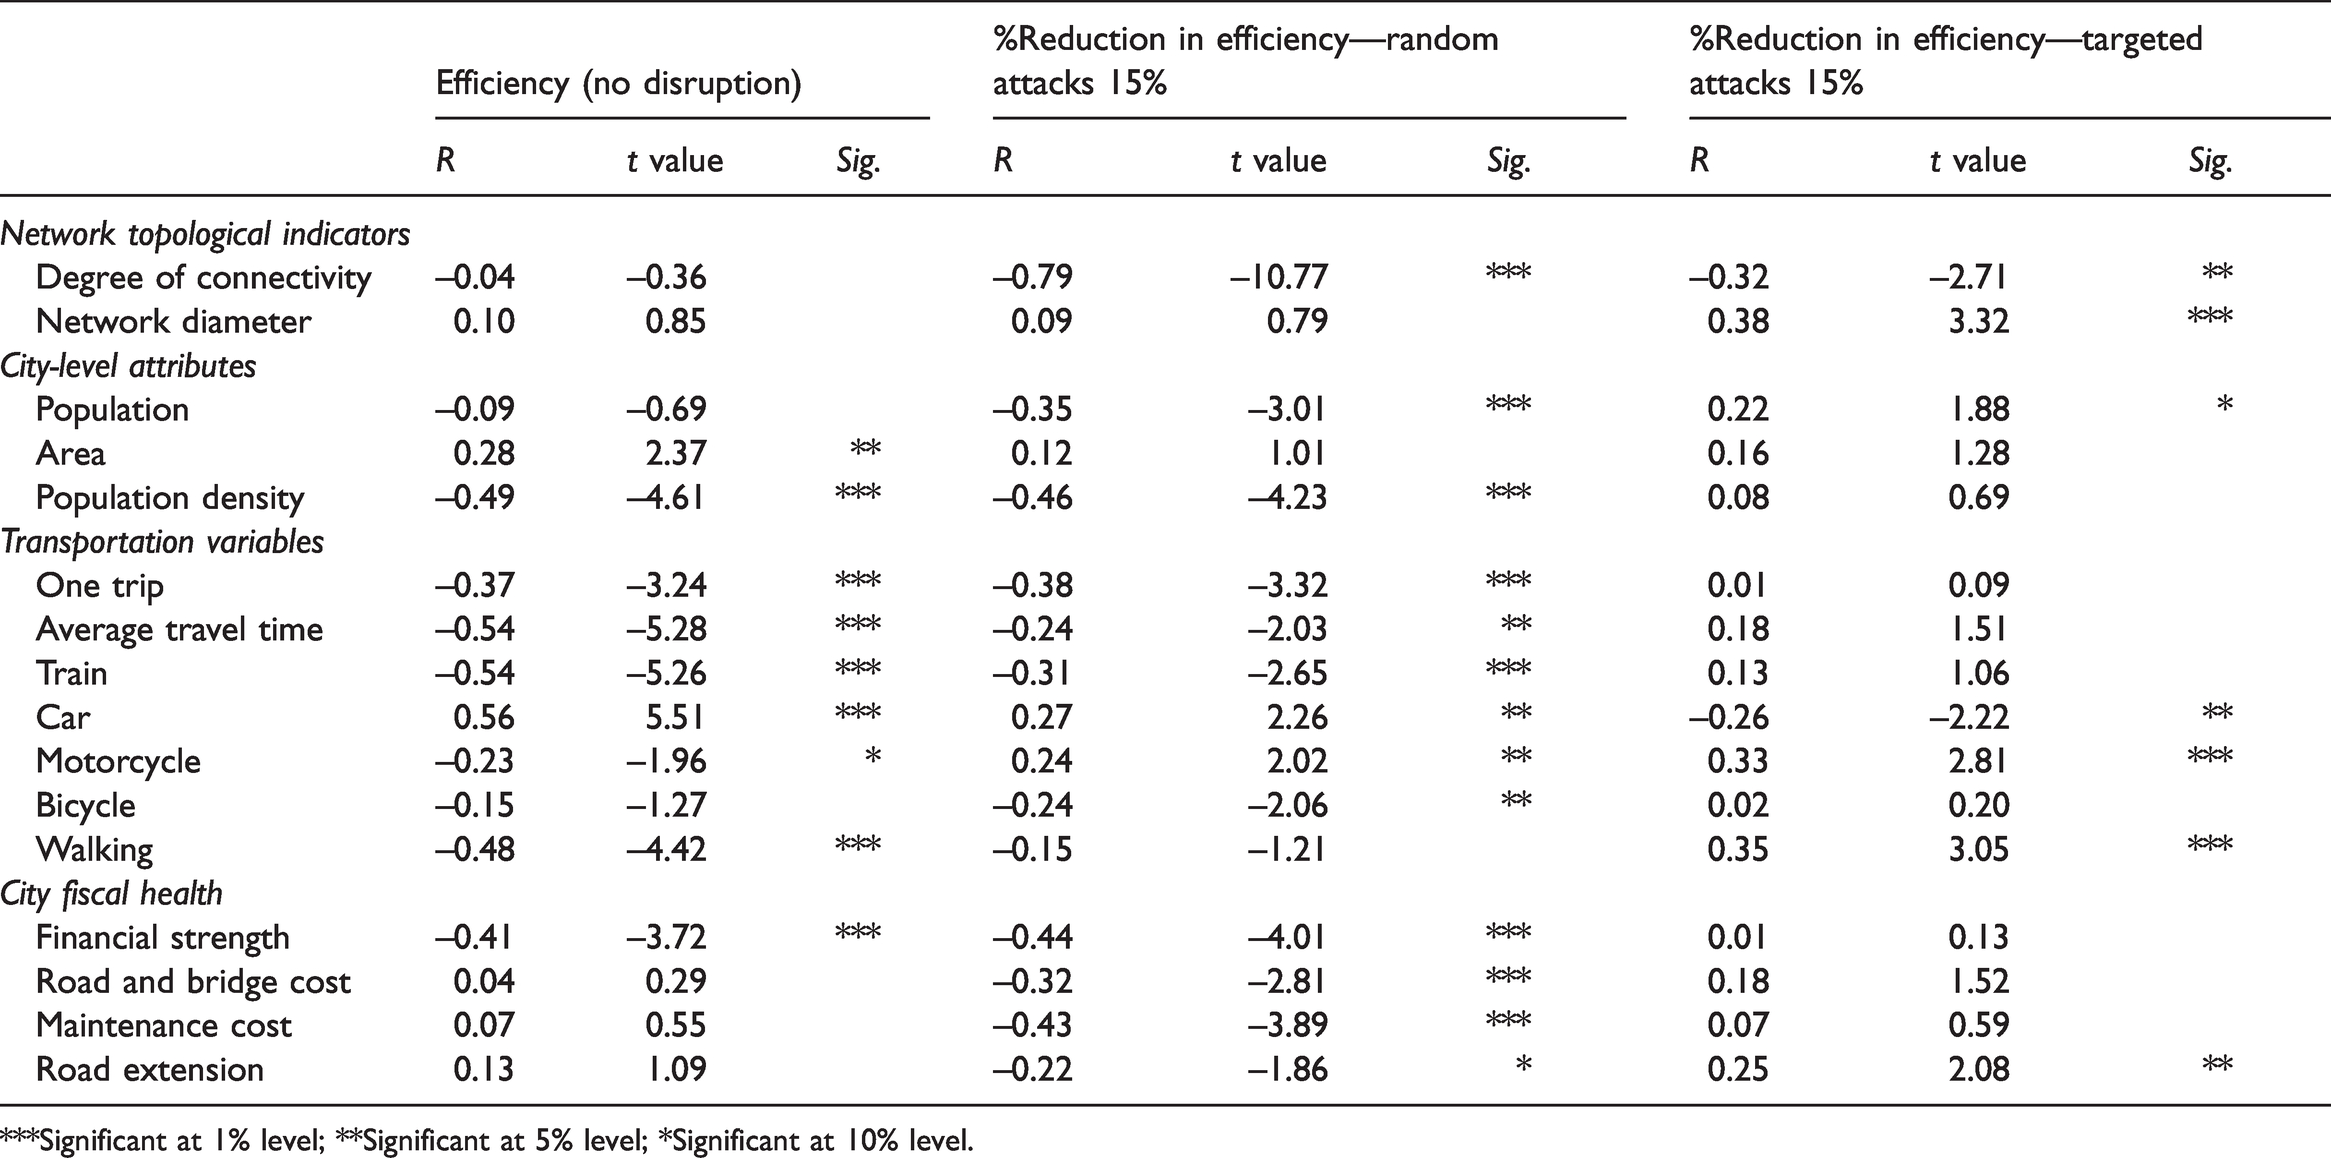
***Significant at 1% level; **Significant at 5% level; *Significant at 10% level.
The correlation of efficiency and robustness indicators with two network topological indicators, the degree of connectivity, and the network diameter was analyzed. It was observed that both variables did not have a significant relationship with efficiency, whereas the degree of connectivity was observed to have a negative relationship with the percentage reduction in efficiency during both random and targeted attacks. This finding confirms the first hypothesis H1: Better topological connectivity makes cities more robust toward random and targeted attacks. Taylor (2017) defined degree of connectivity as the ratio of the actual number of links to the potential maximum number of links for any network. The finding shows that if the connectivity of a network is improved, then it could make them more robust against attacks. In addition, for the variable network diameter, it was observed that it had positive relationship with percentage reduction in efficiency during targeted attacks, indicating that larger networks might be less robust during targeted attacks, supporting the hypothesis H3: (a) Larger cities tend to be less robust with respect to targeted attacks due to their high agglomeration of urban functions. (b) On the other hand, the smaller cities tend to have less concentration of facilities and thus are more robust to targeted attacks. If we look further at the correlation of city-size attributes, we observe that population did not have any significant correlation with the value of efficiency. The role of population is better understood when its relationship with robustness, i.e., percentage reduction in efficiency, is analyzed. The findings showed that cities with high population tend to be more robust under random attacks and less robust under targeted attacks. Another city-size variable, area size shows a positive relationship with efficiency, indicating that larger cities tend to be more efficient in their undisturbed ideal state. Meanwhile, population density had a negative relationship with efficiency and percentage reduction in efficiency during random attacks. The findings show that cities with low population density tend to be more efficient, whereas cities with high population density tend to be more robust under random attacks. These findings are in line with our discussions in the previous subsection related to the importance of critical links in better performing cities.
To test H2: Larger cities tend to be more efficient and robust with respect to random attack, mainly because massive road infrastructure investments have been done, the relationship of city-size attributes must be seen in tandem with the relationship of city fiscal health variables. All four city fiscal health variables, financial strength index, road and bridge cost, maintenance cost, and road extension, showed a negative relationship with the percentage of reduction in efficiency during random attacks. However, the financial strength index showed a negative relationship with efficiency in its ideal, nondisturbed state. The correlations overwhelmingly indicate that cities with a high expenditure on roads and maintenance tend to be more robust toward random attacks. In addition, the correlation of city-size attributes, especially population, was observed to be very high with the road infrastructure investment variables (see correlation matrix in Table S2 in the Supplemental Material). These results partially confirm H2. We could only partially confirm the hypothesis as the relationship of efficiency with population density and financial strength index was observed to be negative, contrary to our hypothesis. However, it could be commented that larger cities in general tend to be more robust toward random attacks.
The results of the correlation analysis of percentage reduction in efficiency during a targeted attack showed that it had a positive relationship with population, indicating that larger cities are less robust during targeted attacks. A similar relationship was also observed with the variable “network diameter” (explained above). These findings confirm H3. A possible reason behind this could be that these cities also have higher levels of agglomeration of facilities and places of importance, and therefore, when links are removed by targeting important links, the networks tend to be more vulnerable. However, it should be noted that other city-size variables were not found to have a significant correlation with the percentage reduction in efficiency during a targeted attack.
The test of correlation with transportation variables showed that both the efficiency and the robustness during random attacks were negatively related to the percentage of people making at least one trip. Mode shares of train, motorcycle, bicycle, and walking showed a negative relationship with network efficiency, whereas the mode shares of car showed a positive relationship. This indicates that cities that have a higher share of car mode are more likely to have a higher efficiency. In addition, the mode share of train (car) was negatively (positively) related with the percentage reduction in efficiency under random attacks and positively (negatively) related under targeted attacks. However, the relationship of mode share of train with the percentage reduction under targeted attacks was not statistically significant. These findings partially confirm H4: (a) Car dependency tend to make cities more vulnerable toward random attacks and less vulnerable toward targeted attack as it indicates weaker concentration of urban functions. (b) On the other hand, higher modal share for trains will tend to make cities more vulnerable to targeted attacks and less vulnerable toward random attacks due to high agglomeration of urban functions. In addition, the relationship of the mode share of walking with the percentage reduction under targeted attacks was observed to be positive. This indicates that cities with a higher percentage of people walking are less likely to be robust under targeted attacks. This finding also indicates that cities that have a high agglomeration of facilities (usually associated with more walking, public transport use, and population) are likely to be more vulnerable under targeted attacks.
Conclusions
The primary objectives of this paper were to analyze network vulnerability indicators in a nationwide study and understand factors associated with road network vulnerability. Using well-established indicators for measuring road network efficiency and robustness, this study analyzed the topological global efficiency in 69 Japanese cities. In addition, it tested the performance of these cities under random and targeted attack scenarios. First, three scenarios of random attacks, removing 5%, 10%, and 15% of the links from the networks, were executed. This was followed by the removal of 5%, 10%, and 15% of the most critical links with the highest betweenness centrality index. The subsequent reduction in efficiency was then calculated. The relationship of efficiency and robustness indicators was then evaluated with city-level variables by testing four hypotheses using correlation analysis.
The contributions of this study are twofold. First, by conducting a nationwide study across 69 cities from Japan, it presents new knowledge with respect to the performance of cities. In summary, the average percentage reduction in efficiency under targeted attacks was much higher than under random attacks. These findings could be of interest to policymakers to help them prioritize decisions regarding which city needs how much assistance and what kind of planning would be required to help vulnerable cities be better prepared. Second, this study establishes the nature of associations between city-level variables and road network vulnerability indicators. The study tested four different hypotheses regarding the relationship of vulnerability indicators with the city’s degree of connectivity, its size, travel behavior of people, and infrastructure investments. The analysis of correlation provided us with a trend of relationships with these variables. The findings threw light on many interesting insights with respect to pertinent policy variables. The study established that larger cities with massive infrastructure investments tend to be more robust under random attacks. Meanwhile, larger cities were less likely to be robust under targeted attacks. This shows that a city’s size and its urban form with respect to the agglomeration of facilities might play an important role in influencing network efficiency. This was further substantiated by the evaluation of the relationship between the travel behavior of people in these cities and vulnerability indicators. It was observed that car-dependent cities were less likely to be robust under random attacks and more likely to be robust under targeted attacks. Meanwhile, the relationship of mode share of trains was observed to be contrary to that of car’s mode share. Cities with high dependence on trains were more likely to be robust under random attacks. These relationships provide interesting insights into how a city’s shape, its urban form, and land use could be influencing the efficiency of its road network. However, it must be noted that urban form variables were not directly evaluated in this study.
Future research may extend this analysis to other cities in Japan or replicate the study in other countries. The study can help policymakers to understand the current state and plan for policies to mitigate the effects of emergencies on road networks. However, this study has some limitations that must be carefully considered. Due to the high computational requirement of the magnitude and number of networks included, the methodology used in this study for targeted attacks involved removing links with the highest edge betweenness centrality all at once instead of sequentially removing and recalculating the index as employed by some other studies (Albert et al., 2000; Duan and Lu, 2014; Holme et al., 2002). Furthermore, this study only focused on estimating the topological global efficiency (Latora and Marchiori, 2001); other system-based vulnerability measures could be the focus in future studies. Another limitation is that our network evaluation is mainly for an emergency response after disaster: the ability to provide a road transport service for special travel demand such as rescue activities and relief aid logistics. To extend the focus to general travel demand, for example, all paths should be weighted by traffic volume, although data availability would be one of the major bottlenecks to implement it. Finally, the study only provided the associations between variables, whereas future studies could evaluate the direction of causality between vulnerability indicators and city-level variables.
Supplemental Material
sj-pdf-1-epb-10.1177_2399808321999318 - Supplemental material for Road network vulnerability and city-level characteristics: A nationwide comparative analysis of Japanese cities
Supplemental material, sj-pdf-1-epb-10.1177_2399808321999318 for Road network vulnerability and city-level characteristics: A nationwide comparative analysis of Japanese cities by Johan Rose Santos, Nur Diana Safitri, Maya Safira, Varun Varghese and Makoto Chikaraishi in EPB: Urban Analytics and City Science
Footnotes
Acknowledgements
The authors would like to acknowledge that a part of this research was conducted under the research project “Short-term travel demand prediction and comprehensive transport demand management,” supported by the Committee on Advanced Road Technology under the authority of the Ministry of Land, Infrastructure, Transport, and Tourism of Japan.
Authors’ Note
Johan Rose Santos is now affiliated with Department of Public Works and Highways, The Philippines.
Declaration of conflicting interests
The author(s) declared no potential conflicts of interest with respect to the research, authorship, and/or publication of this article.
Funding
The author(s) received no financial support for the research, authorship, and/or publication of this article.
Supplemental material
Supplemental material for this article is available online.
References
Supplementary Material
Please find the following supplemental material available below.
For Open Access articles published under a Creative Commons License, all supplemental material carries the same license as the article it is associated with.
For non-Open Access articles published, all supplemental material carries a non-exclusive license, and permission requests for re-use of supplemental material or any part of supplemental material shall be sent directly to the copyright owner as specified in the copyright notice associated with the article.