
Abstract
A lack of cycle parking is a known barrier to promoting the uptake of cycling in urban areas. Unlike cars that can be parked on the roadside with little additional infrastructure, bikes usually require dedicated parking facilities. The existing research and guidance on where cycle parking should be provided primarily focuses on key destinations such as train stations or schools. Thus, there is a gap in knowledge about the amount of general-purpose cycle parking required and how it should be distributed across a city. This paper presents a novel method for analysing and prioritising the spatial distribution of cycle parking. The method draws on established portfolio management techniques but applies them in a spatial context. Using the case study of London, we demonstrate that it is possible to identify areas that have a deficit of cycle parking as well as locations that have the most significant potential for increasing cycling uptake by providing additional cycle parking.
Introduction
Encouraging more cycling is widely considered to be advantageous for society as there is growing evidence of cycling’s benefits, such as improvements to health (De Hartog et al., 2010; Oja et al., 2011), environment (Walsh et al., 2008) and social equity (Goodman et al., 2013). In recent years, there has been a significant investment in cycle lanes and paths in many cities. However, dedicated cycle parking is often underdeveloped as little attention is paid to cycle parking compared to cycle paths (Heinen and Buehler, 2019). For example, in London, one of the most advanced cycling cities in the UK, 53 km of new cycle paths were built in three years (Mayor of London, 2019). However, more than half of Londoners identify lack of parking as a discouraging factor (Transport for London, 2019). In addition, 25% of Londoners have put off cycling because of the risk of bicycle theft, and 34% of the bicycle theft victims stopped cycling (Transport for London, 2019). Thus, as more cycle paths are built, cycle parking may become the next barrier to the widespread adoption of cycling. Yet, the tools and evidence base for the systematic planning of cycle parking is underdeveloped, which means it is unlikely that cycle parking provision will improve.
This paper proposes a portfolio management approach inspired by the Boston Consulting Group’s Growth-Share Matrix (BCG matrix) as a new approach for assessing the spatial distribution of new transport infrastructure. BCG matrix is well established in the private sector (Madsen, 2017), and is considered a breakthrough tool that helped multinational companies with diverse businesses to allocate finite resources effectively by sorting out each business’s strategic position (Lorange, 1975). However, it is not widely used in the public sector (Baškarada and Hanlon, 2018).
In transport planning, spatial heterogeneity (variation between places) is an important consideration (Cheng et al., 2020; Ding et al., 2014; Gan et al., 2019; Li et al., 2019). Some areas require more cycle parking since employment is concentrated in certain areas (Silva et al., 2006). A portfolio management approach can deal with spatial heterogeneity, thereby assisting policymakers in deciding where to prioritise cycle parking investment.
We seek to answer the question ‘Where should cities invest in cycle parking?’ By demonstrating a data-driven spatial planning approach in contrast to existing planning approaches based on a rule of thumb. The paper explores how to measure the imbalance between parking supply and demand and prioritise locations for investment. For this paper, we are not considering cycle parking type or quality. There are a wide variety of cycle parking facilities, from simple stands in the street to dedicated multi-storey buildings. Different types of parking are appropriate for different types of bicycles and journey purposes. So while in practice selecting the correct type of cycle parking facilities is important for transport planners, establishing how much parking is required is a necessary prerequisite. As shown below, there is already substantial literature on designing good cycle parking facilities. Yet, surprisingly little is written on establishing the baseline demand for cycle parking.
Literature review
As governments in the western world have started promoting cycling as a sustainable form of transport, research on cycling has increased dramatically (Pucher and Buehler, 2017). Nevertheless, most of this research focuses on linear cycling infrastructure rather than cycle parking, so planning practitioners’ guidance is also limited (Heinen and Buehler, 2019). What research does exist on cycle parking usually focuses on a few key destinations such as schools (Kamargianni, 2015), workplaces (Hamre and Buehler, 2014) and public transport nodes (Pucher and Buehler, 2008); even though it is well established that the provision of cycle parking enables people to cycle more (Heinen et al., 2009; Turner, 2013).
One of the few research projects into citywide cycle parking’s supply and demand was conducted in Shanghai (Yan and Zheng, 1994). In this study, a category analysis model was built using employment location and type, by which future parking demand was predicted. The strength of this study is the citywide scale modelling, as it is important to have the same scale between modelling and the planning process (Lovelace et al., 2017). However, Shanghai in the 1990s had a very different context to most cities planning cycling infrastructure today.
Pfaffenbichler and Brezina (2015) estimated cycle parking demand in Vienna, and their study reflects the European context of generally low levels of cycling. In the study, three parking demand models used origin-destination travel census data as input. After modelling, the results of the three models are compared and synthesised to indicate the demand level in each district. The weakness of this approach was the assumptions required by the models. For example, one of the models assumes homogenous growth of cycling share for trips less than 5 km to achieve the government target. However, Lovelace et al. (2017) have shown that better predictions of cycling propensity can be produced from logit models that consider trip distance and hilliness. Pfaffenbichler and Brezina also assume that only 30% of trips require cycle parking regardless of destination. The study by Pfaffenbichler and Brezina points the way for citywide cycle parking demand using census data. However, the model has room for improvement, as some assumptions are unrealistic or arbitrary.
As well as academic research into cycle parking, many transport authorities have published guidance on the design and planning of cycle parking. We reviewed national policies from Japan, Singapore, Australia and South Africa, as well as local policies from New York, Seattle, Kyoto, Amsterdam, Sydney and London (Blackett and van Den Dool, 2016; City of Sydney, 2018; Department of Transport, 2019; 2019; Government of Amsterdam, 2017; Kyoto City Official, 2017; Ministry of Land Infrastructure Transport and Tourism, 2016; National Department of Transport, 2003; Rutledge, 2015; Seattle Department of Transportation, 2018; Transport for London, 2018a; Urban Redevelopment Authority, 2018).
Among the countries/cities where cycling is already built into everyday life, planning for cycle parking is centred on the issue of parked bicycles hindering pedestrians’ and cyclists’ movement. In Japan, fly-parked and abandoned bicycles became a social issue in the late 1970s. Fly-parking is when cyclists secure their bikes to street furniture or other objects rather than a designated parking facility (Gamman et al., 2004). In addition to setting a required amount of parking space for different land uses, fly-parking is regulated, and cycle parking charges are used to encourage mode shift to walking. In Singapore, the second-most densely populated country (Hirschmann, 2020), the national policy similarly emphasises parking in the designated space.
Amsterdam takes a slightly different approach despite having the same issue of fly-parking and abandoned bicycles. Amsterdam aims to reinforce cycling culture by improving and maintaining cycle parking, one of the three main themes of its long-term cycling plan. The city aims to provide a more convenient parking experience for cyclists while not disturbing pedestrians through a series of interventions, including re-designing bicycle racks, supplying more parking facilities, improving signage and removing abandoned bicycles.
In contrast, in countries with limited cycling culture, cycle parking is treated as a way to promote cycling. South Africa, Sydney, New York and London are planning to provide more cycle parking to increase cycling (Blackett and van Den Dool, 2016; City of Sydney, 2018; Department of Transport, 2014).
A destination-focused approach is common for the delivery of cycle parking. While governments acknowledge the importance of cycle parking provision in every part of the city, they focus on a few key facilities such as public transport nodes, schools and workplaces. Among the locations listed above, only Amsterdam analysed the supply and demand conditions of cycle parking and identified the areas where the parking occupancy is high. Some cities allow residents to request cycle parking facilities, such as Sydney, New York and parts of London (City of Sydney, 2020; Department of Transport, 2020).
In terms of the required amount of parking, some guidelines state that planning practitioners need to consider current demand and future demand growth. Australian guidelines suggest a 10 to 20 years span in line with targeted cycling share to the area (Blackett and van Den Dool, 2016). Japanese policies recommend considering the future change in the urban environment. Although a direct link between land use and the required number of cycle parking spaces is often legally defined, the methodology to decide the desirable quantity of cycle parking is not well established in any of the researched countries. Usually, only a rule of thumb is applied; for example, DfT (2008) states that bicycles locked to street furniture is an indicator of a parking shortage, TfL (2016) recommends providing 20% spare capacity, and that planners either conduct surveys or make a ‘broader assessment of where trip generators are, and where and when people are likely to, or could, travel there by cycle’. Australia has a generic 10% rate based on land uses, while the London plan specifies different cycle parking minimum for long and short-stay parking for each land use, for example, restaurants require one long-stay space per 175 sqm and one short-stay space per 40 sqm (London Assembly, 2016). This implies that considering the balance of supply and demand for cycle parking is not well established in planning practice.
The BCG matrix
The BCG matrix divides a company’s business portfolio into four quadrants based on market share and growth rate (BCG, 2020; Madsen, 2017). The logic of the matrix is that businesses should focus on investments where they have a high market share to exploit economies of scale and experience or markets that are growing rapidly, thus allowing for revenue growth (Reeves et al., 2014). The BCG matrix substantially changed how strategic business planning was done. As before the BGC matrix, there was no evaluation of how a division’s business was performing compared to the overall market (Lorange, 1975). Prior to the matrix, business divisions assessment and engagement tended to be uniform regardless of their position in the market or growth prospects (Haspeslagh, 1989).
Despite its widespread adoption in business, the BCG matrix has been criticised; for (i) being incomprehensive and focussing too much on investment decisions (Hewitt, 1988 cited in Morrison and Wensley, 1991: 21), market share (Catry and Chevalier, 1974; Day and Wensley, 1983; Wind and Claycamp, 1976) and supply-side economics (Wensley, 1981). (ii) a lack of evidence for the value of investing in growth markets (Wensley, 1981) and competitive value of greater market share (Day, 1977); and (iii) inappropriate labelling of quadrants (Hax and Majluf, 1983). In recent years, the matrix has been considered outdated due to the changing nature of businesses since the 1970s, notably as new technologies have reduced the importance of market share as a competitive advantage in favour of adaptability (Reeves et al., 2014).
The application of the BCG matrix outside corporate consultancy is limited. Some examples include the analysis of the national-level tourism industry in Egypt (Khairat and Alromeedy, 2016), the Polish packaging industry investment scheme (Connell, 2010), telecommunication companies and products in India (Srivastava and Prakash, 2011), university programmes in Ghana (Afriyie et al., 2018) and hospital departments in China (Tao and Shi, 2016) and sensor technologies (Singh, 2004). These examples are informative as they demonstrate the generalisable characterises of the matrix. For instance, Egyptian tourism analysis uses historical revenue from all North African countries to calculate the market share and growth rate. Other studies define growth and share in their own way according to its industry’s characteristics and available data, not restricted to the traditional financial base. For example, Ghanan universities use survey data to capture which programme student wishes to study, while the Indian telecommunication analysis used the number of subscribers. In each case, the results are interpreted in context to enable planners to prioritise the allocation of resources.
BCG matrix is not the only portfolio planning framework (Haspeslagh, 1989). For example, an expanded form of the BCG matrix, the GE McKinsey matrix, has been applied to the transport sector (Gikunda et al., 2012). The study considered routes offered by Kenya Airways and concluded that 96.1% of the change in investment could be attributed to the market attractiveness and business strength.
The mode share matrix
The previous section showed that there is little strategic planning of cycle parking and that the BCG matrix has become a helpful business portfolio planning tool. This section will show the parallels between a company managing a portfolio of businesses and a local transport authority’s spatial planning of a ‘portfolio’ of different transport modes and locations.
The critical link between the two disciplines is that transport mode share has similar characteristics to a company’s market share. Both can be expressed as a percentage, and both can vary spatially. Furthermore, growth in the use of a particular transport mode can be achieved either at the expense of another mode (increased mode share) or through growth in total transport demand (additional trips), which is analogous to a business experiencing growth in the overall market. Thus, Figure 1 shows a mode share matrix that plots transport mode share against growth in the use of that mode. The mode share matrix, plotting the mode share on the x-axis and the expected growth in the number of travellers on the y-axis. The plot is divided into four named quadrants with the analogous BCG matrix names included in brackets.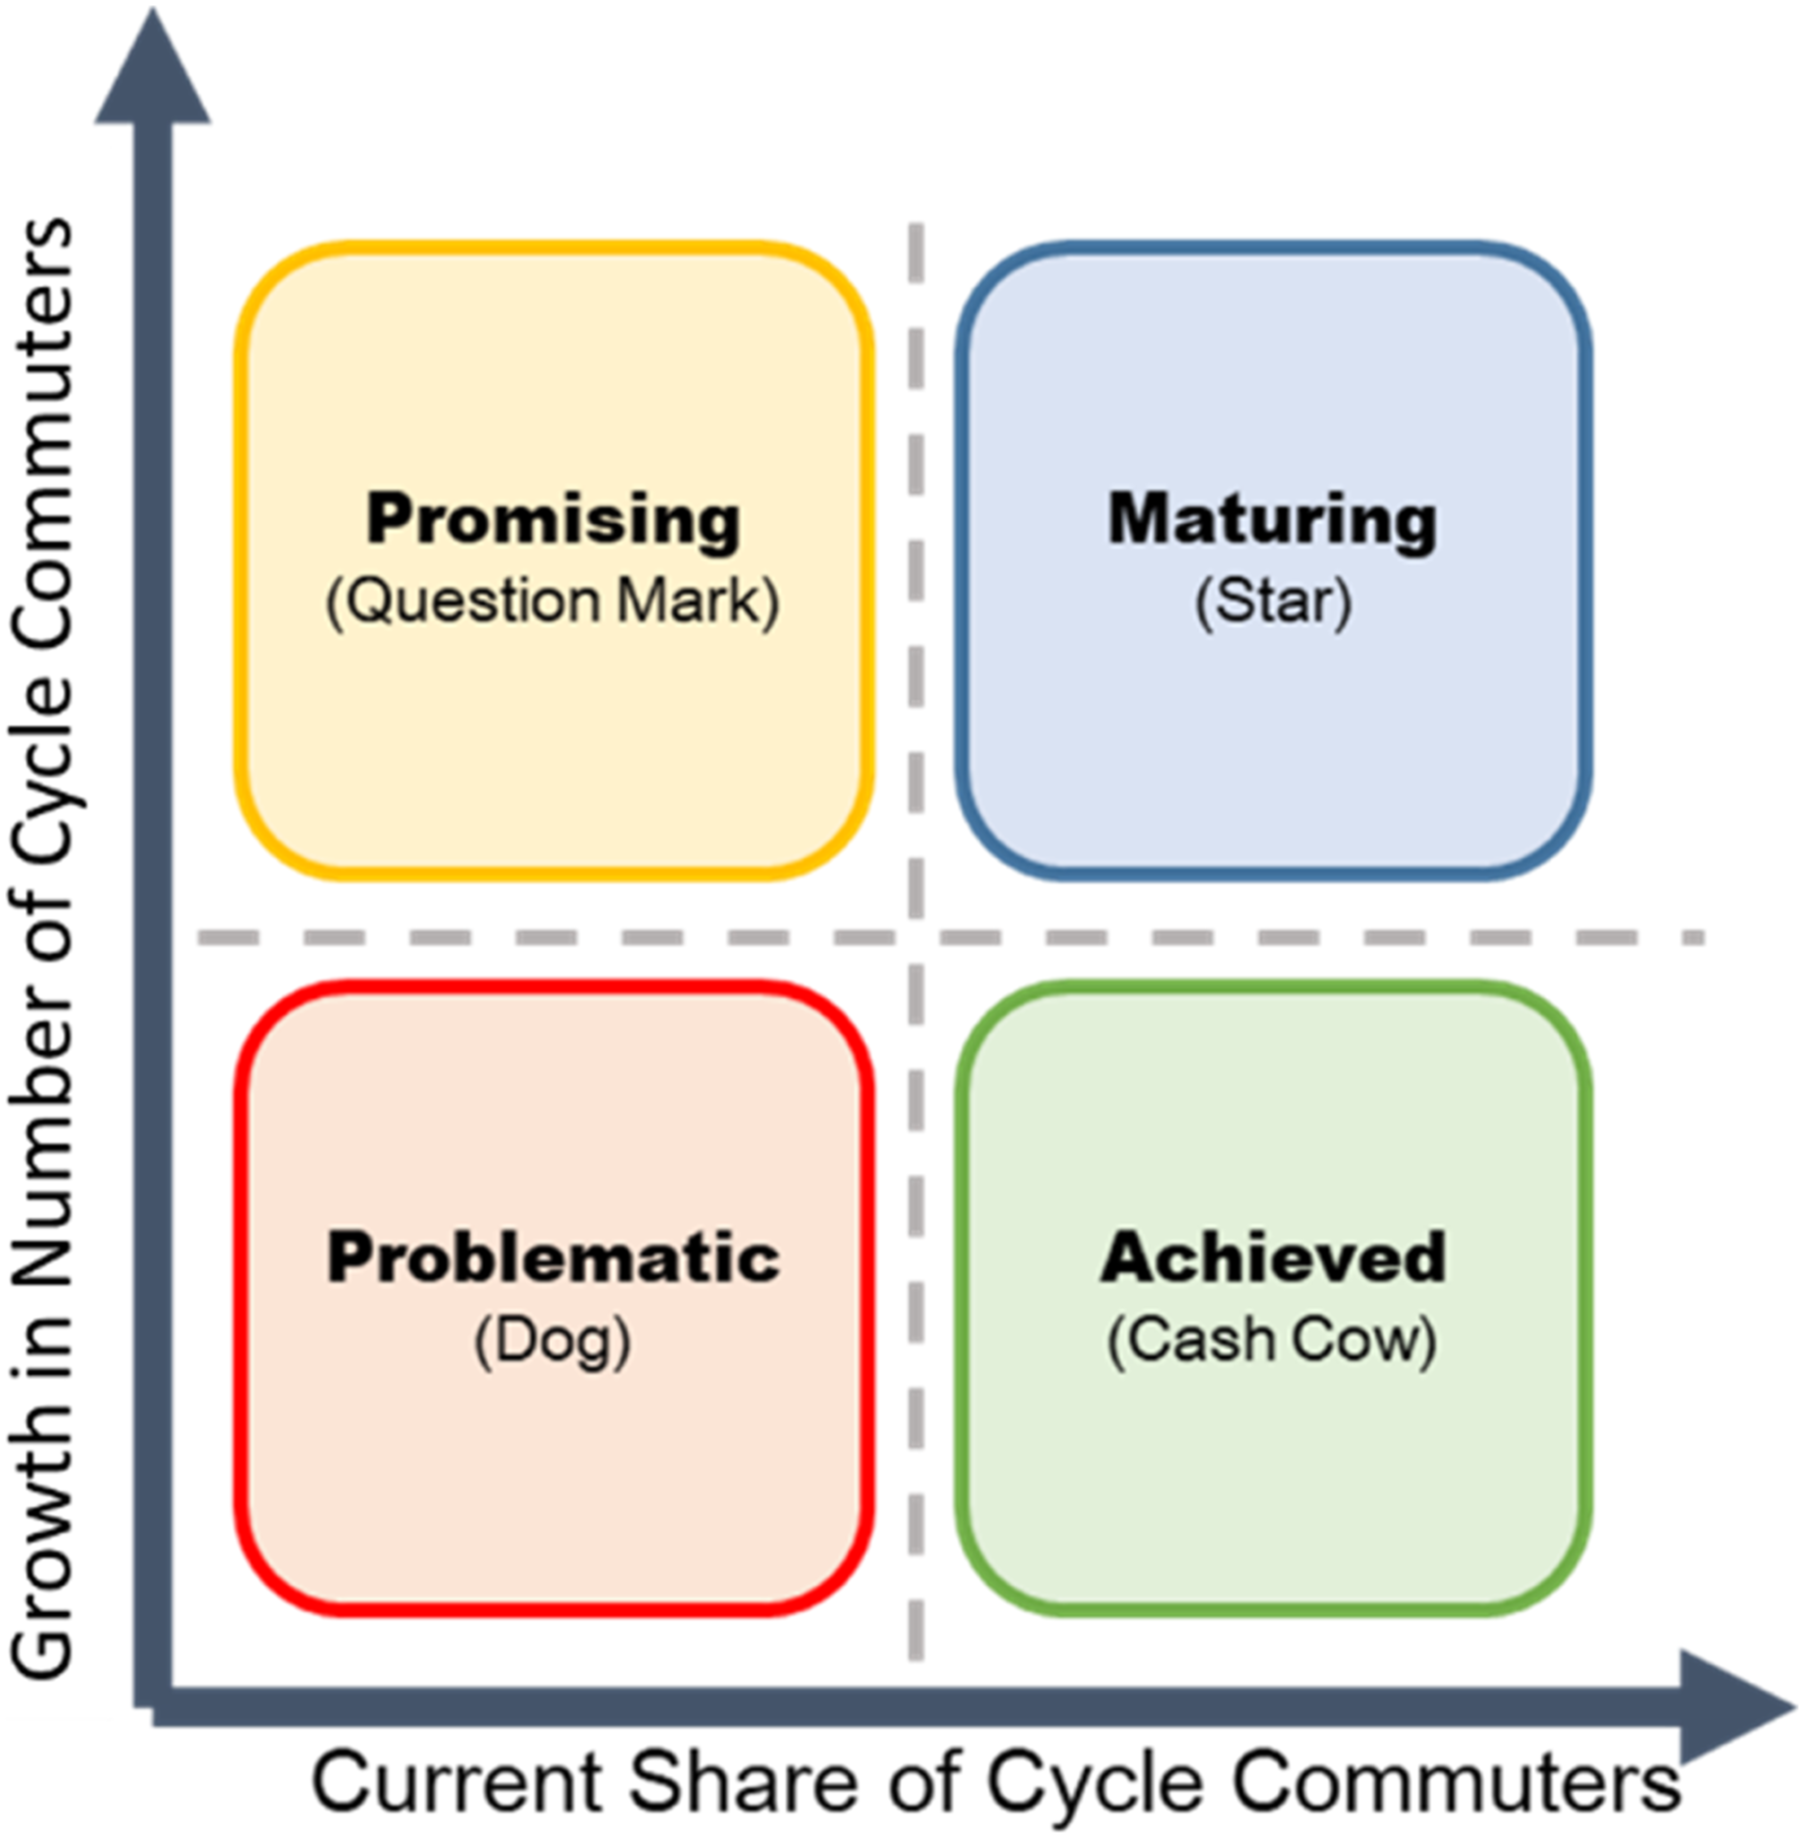
Comparison of the BCG matrix and mode share matrix quadrants.
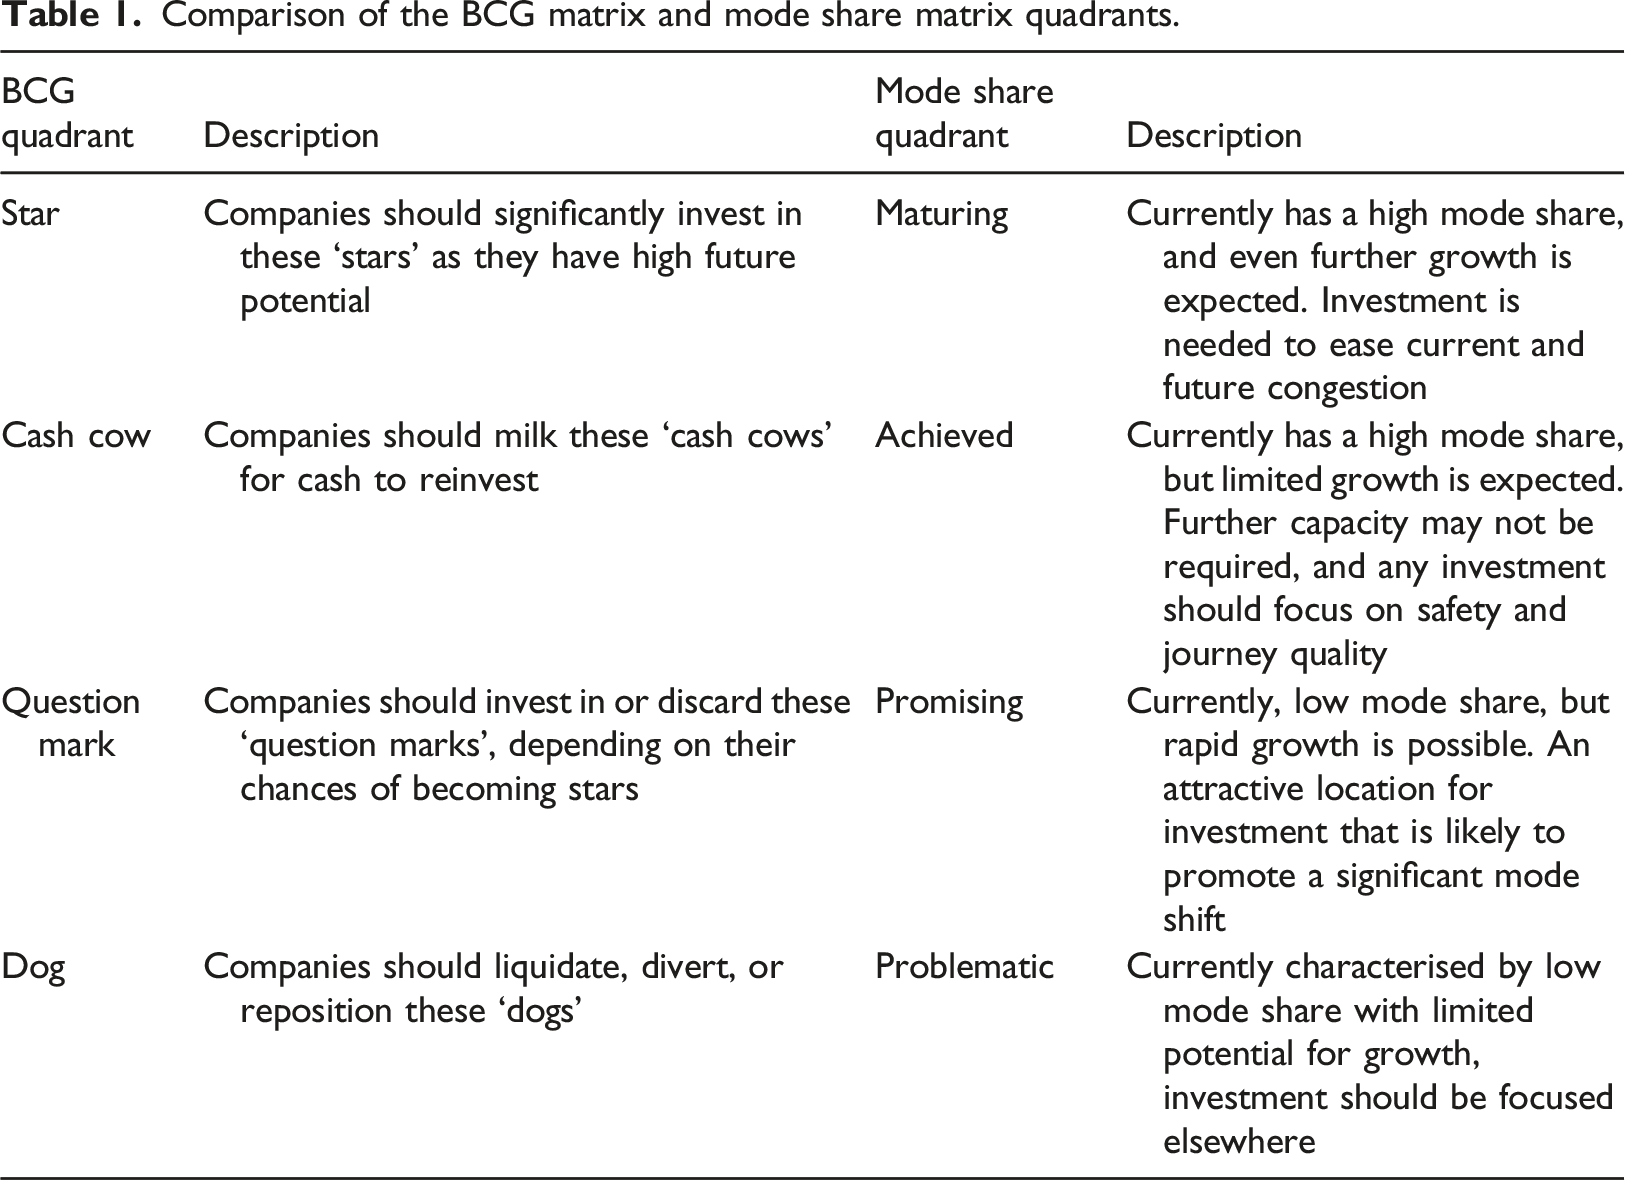
Within the BCG framework, businesses are expected to move around the matrix over time. For example, a manager may seek to turn a star into a cash cow. A similar concept applies to the mode share matrix as an area with high growth potential (promising/maturing) may realise that growth via investment in cycle infrastructure, and thus reduce its potential for additional growth (achieved).
Methodology
London was selected as a case study to demonstrate the concept of mode share matrix due to its clear policies of promoting cycling and the availability of spatially disaggregated data. Two types of data are used for this research; commuter origin-destination data and the locations of cycle parking facilities.
Cycling demand data is taken from the Propensity to Cycle Tool (www.pct.bike), which is based on the 2011 Census travel to work data. While data covering a wider range of trip purposes would be preferable, an all-purpose travel demand dataset does not exist for London. The PCT data provides 31,256 desire lines with the number of cycle commuters per day currently and under several future scenarios (Lovelace et al., 2017). The desire lines have an average length of 5.2 km and a maximum length of 18 km. Within the PCT website, this data is aggregated to residential origin locations. However, we inverted the PCT’s analysis by aggregating the number of cyclists at their destinations. Thus, for each area, an estimate of the number of cyclists arriving each day could be produced both currently and in the future.
We took the PCT’s ‘Go Dutch’ scenario as the future cycling demand and the 2011 baseline as the current cycling demand. The areas of analysis used are Middle Super Output Areas (MSOAs). MSOAs are designed to have around 5000 to 15,000 residents. Although smaller areas of analysis are available for London, we chose MSOAs as the publically available data suppresses small numbers to protect privacy. This disproportionally affects cycling as it has a low overall mode share. The PCT’s Go Dutch scenario estimates the number of cycle commuters if London had Dutch-style infrastructure and culture while adjusting for trip distance and hilliness (Lovelace et al., 2017).
Cycle parking data is obtained from the Cycling Infrastructure Database (CID) (Transport for London, 2018b) and OpenStreetMap (OSM) (OpenStreetMap, 2010). The CID survey was conducted on every street in Greater London, capturing 240,000 pieces of infrastructure visible from street level, including 146,000 cycle parking spaces (Transport for London, 2018b). OSM cycle parking data contains fewer locations than CID (4865 vs 23,758). However, OSM contains cycle parking facilities that are not visible from the street. We, therefore, combined the datasets by manually adding 968 parking locations from the OSM that were absent in the CID.
Overall, Greater London has 140,788 bike parking spaces, excluding 6124 spaces (4%) provided by bike hangers. Bike hangers are identified from CID spatial data’s attribute and excluded as city councils offer them to people who have difficulty parking their bicycles at home (Lambeth Council, 2020; Southwark Council, 2020). Thus, they are not generally available as public parking for cyclists. This data was then aggregated by MSOA to allow the comparison of cycle parking demand and supply.
Results and analysis
Within the PCT data, 3,715,982 people commute to London, of which 97% are inter-zonal. Cyclists account for 5% of the total commuters (n = 143,182), which is higher than England and Wales average of 3% (Lovelace et al., 2017). In the ‘Go Dutch’ scenario, the number of cyclists increases by 470,764, quadrupling the cycle mode share to 20%. Most cycle commuters travel to inner London, with 43% of trips going to just 2% of London’s land area. These locations are also expected to see the highest growth in cycling, as shown in Figure 2. Maps of MSOAs in London showing (a) the current number of commuter cyclists arriving each day; (b) the increase in cyclists travelling to each MSOA under the PCT Go Dutch scenario; (c) the percentage of commuters that currently cycle to each MSOA and (d) the number of cycle parking spaces currently provided.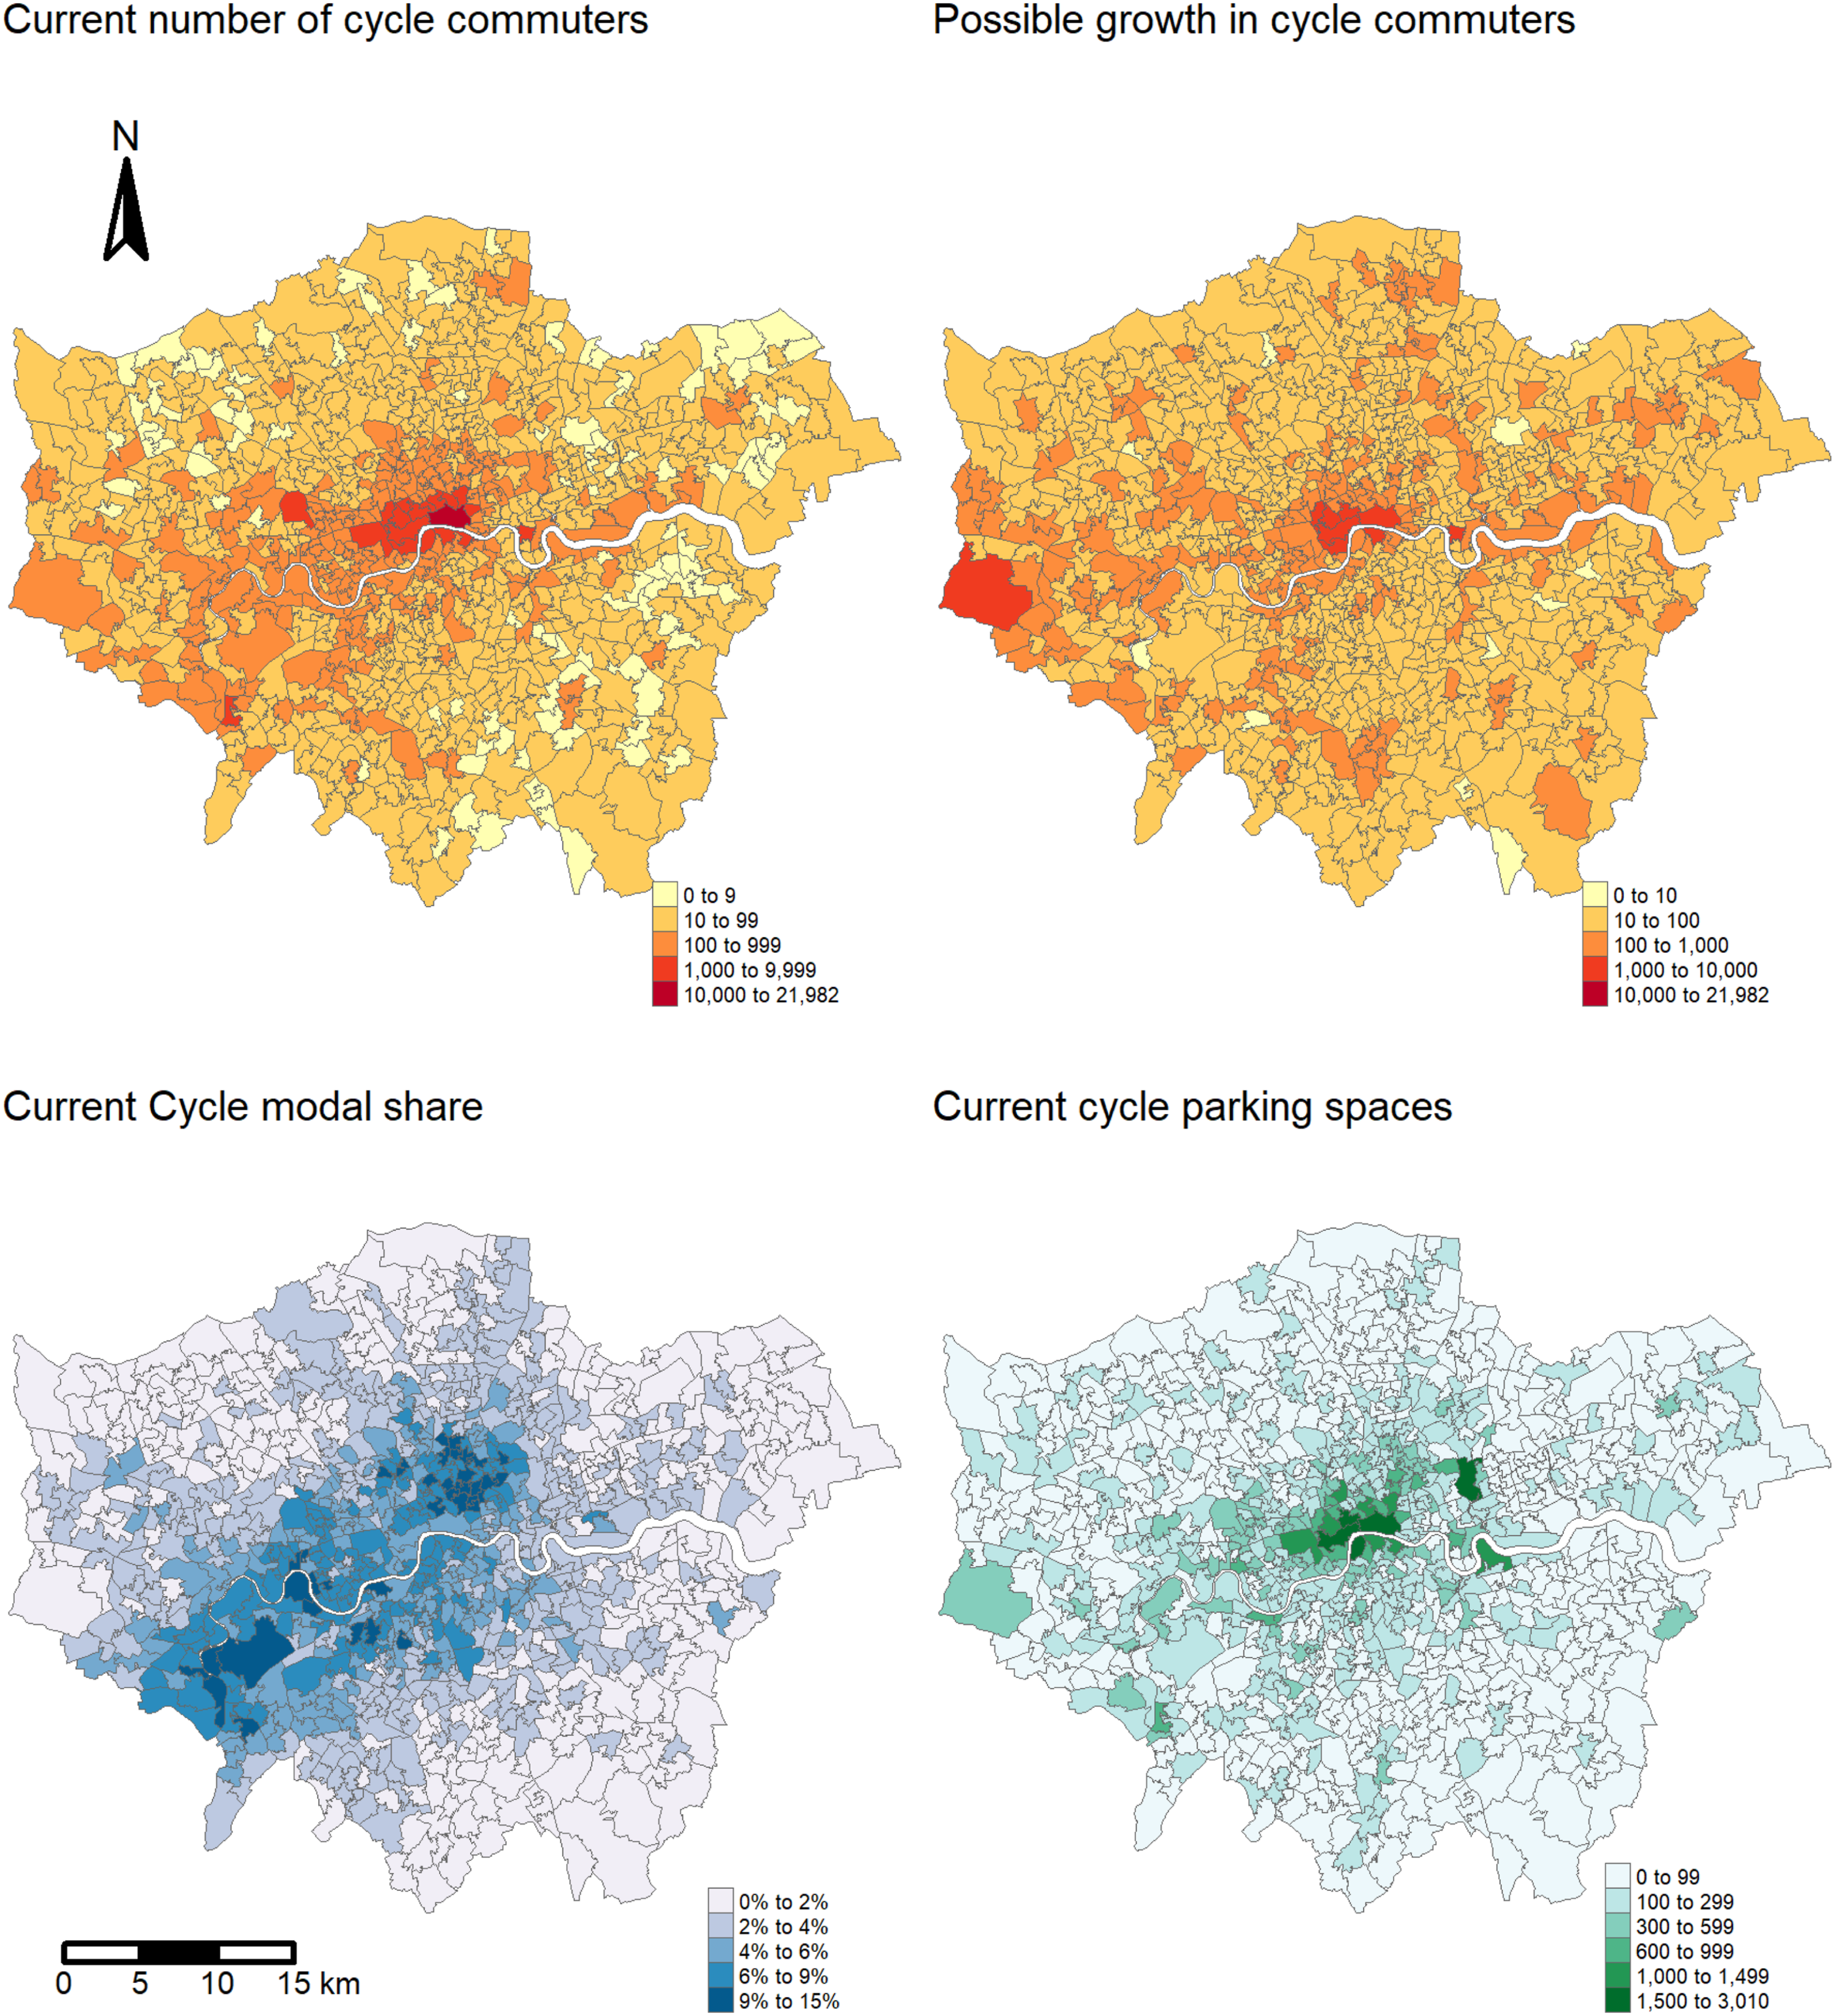
Figure 2 also shows that London’s existing cycle parking spaces are concentrated in inner London, but not always where demand is highest. In contrast, two-thirds of London’s land area (579 MSOAs) has only 18% of the total parking spaces.
Figure 3 shows each MSOA plotted on the mode share matrix with the quadrants defined by the mean values. Note the use of a log scale for the growth in the number of cyclists as a few key destinations are expected to see substantial growth in cycling. Scatter plot of MSOAs growth and current share of cycle commuters in London.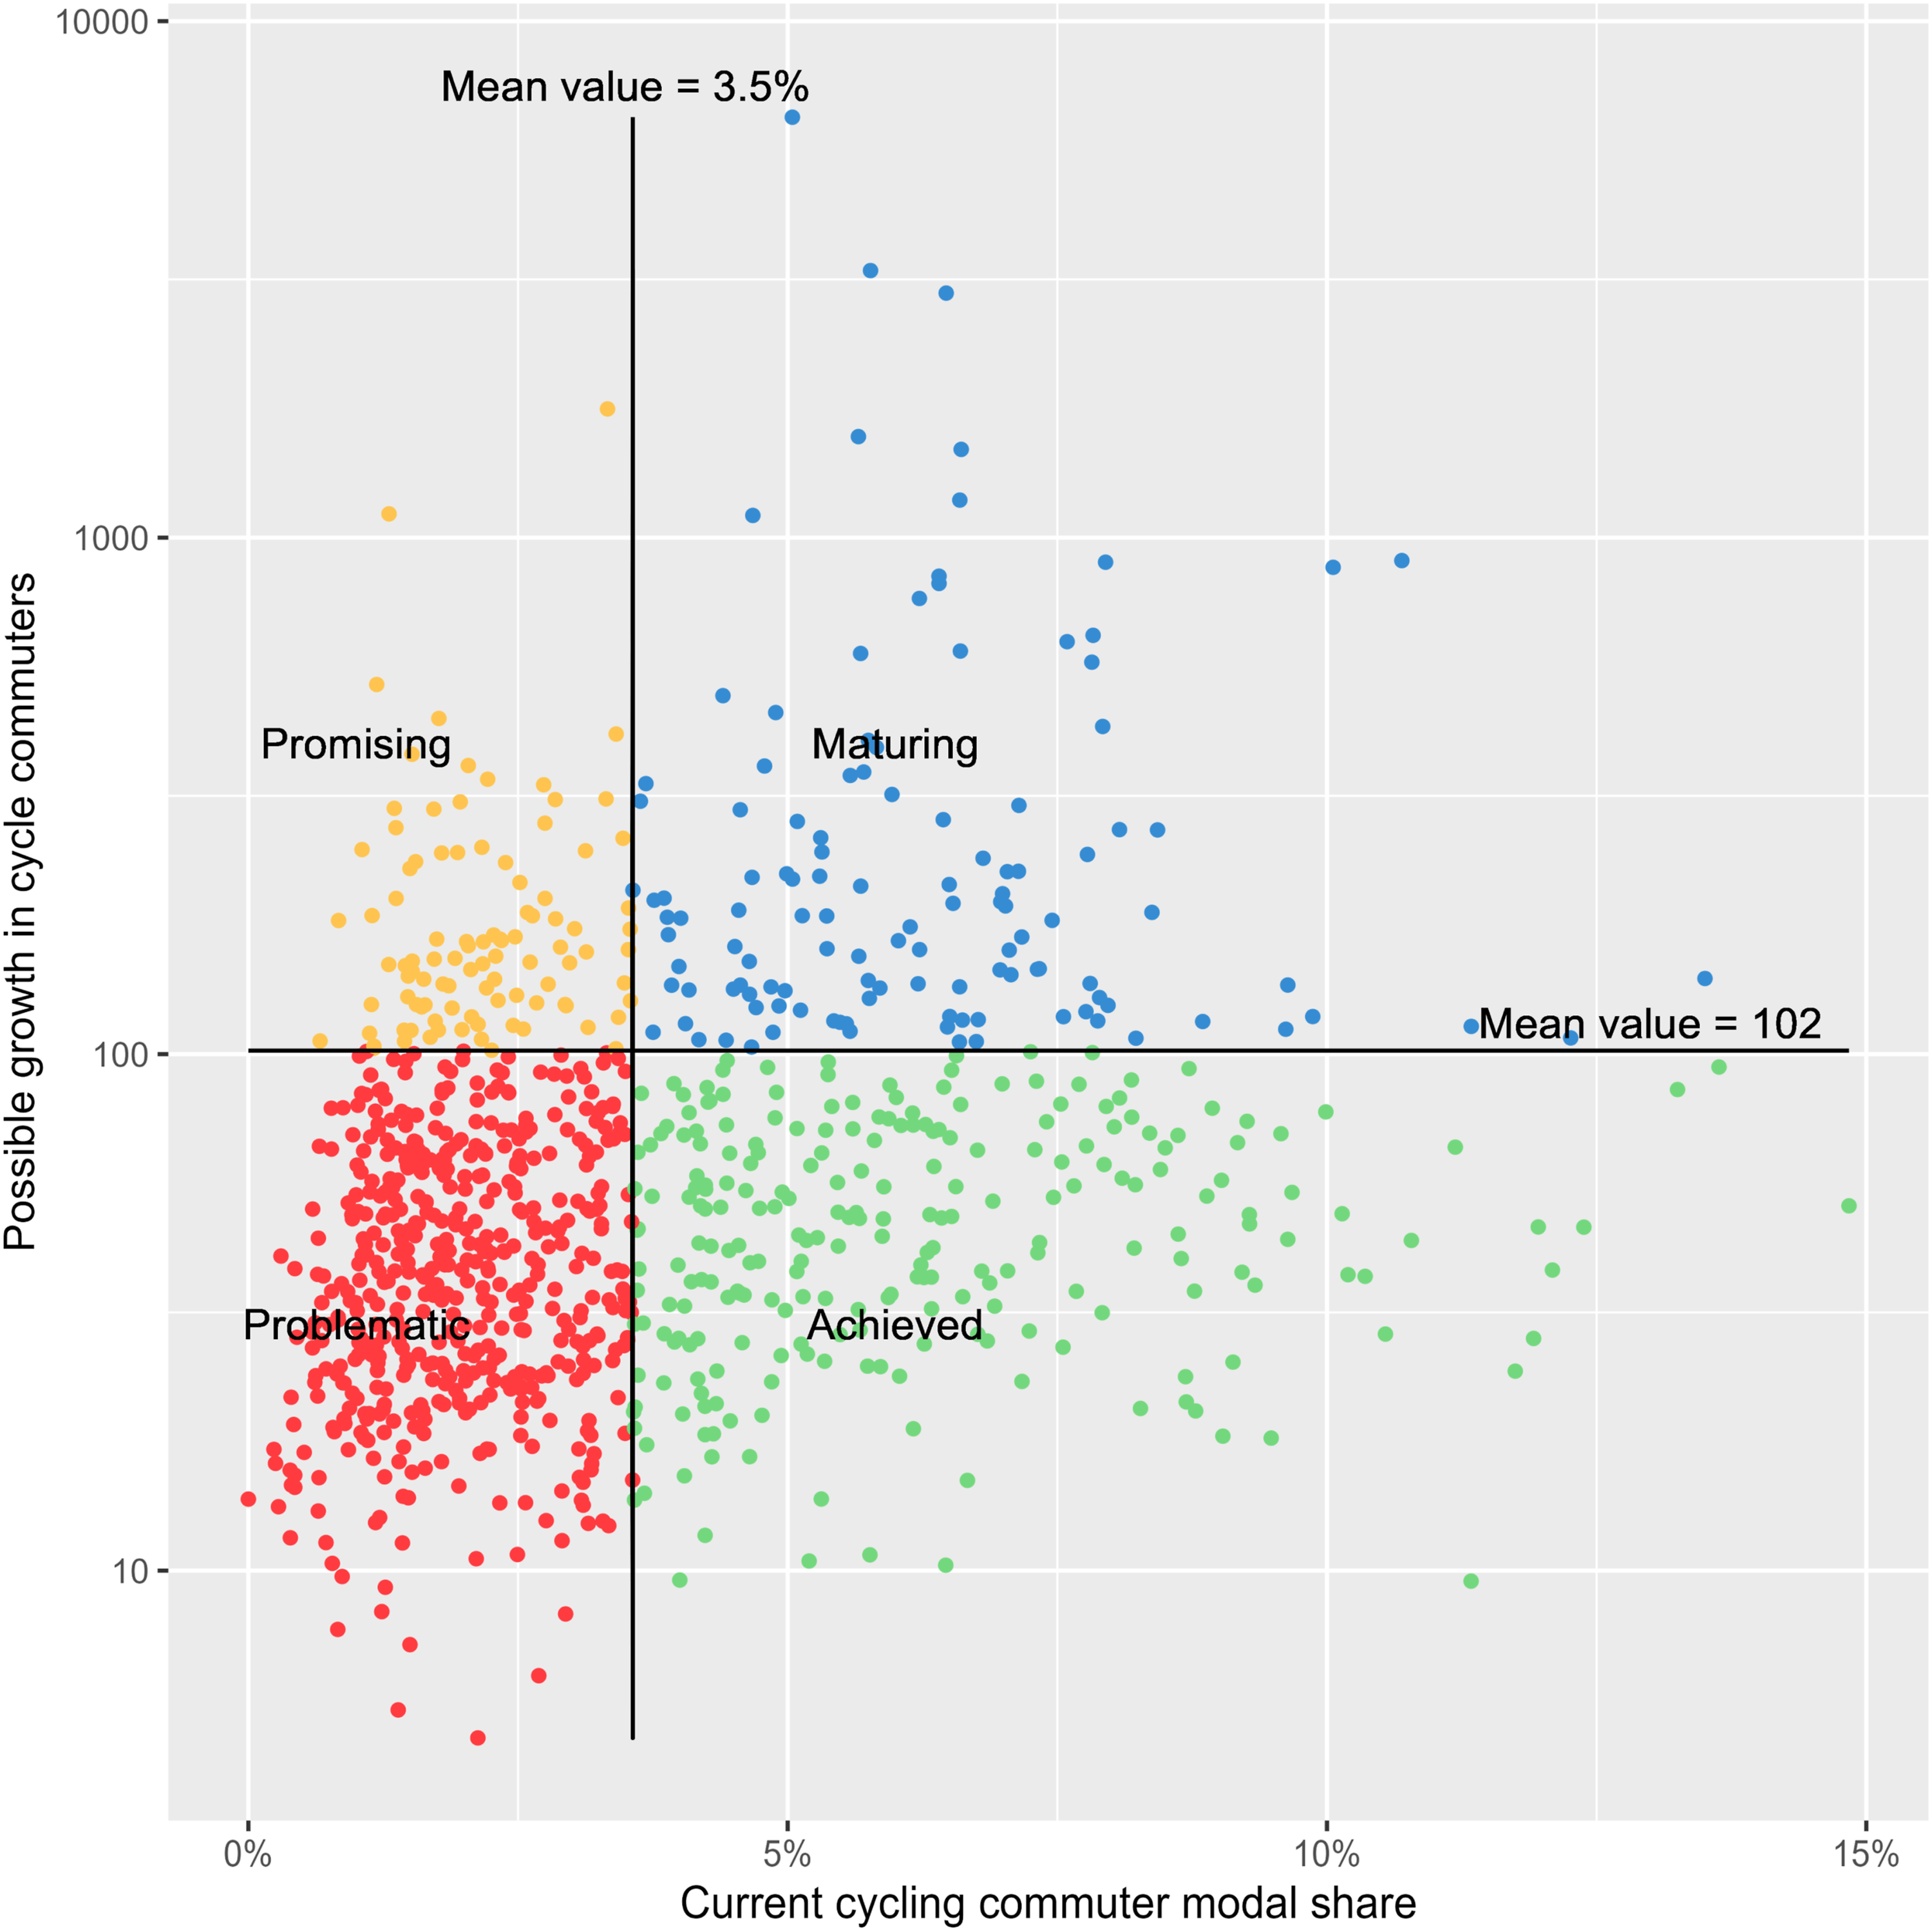
Figure 4 shows the spatial distribution of the four classifications and the need to focus on cycle parking in London’s centre and South West. Conversely, most of outer London is less attractive for investment in cycle parking. Map of the MSOAs in London categorised by the mode share matrix.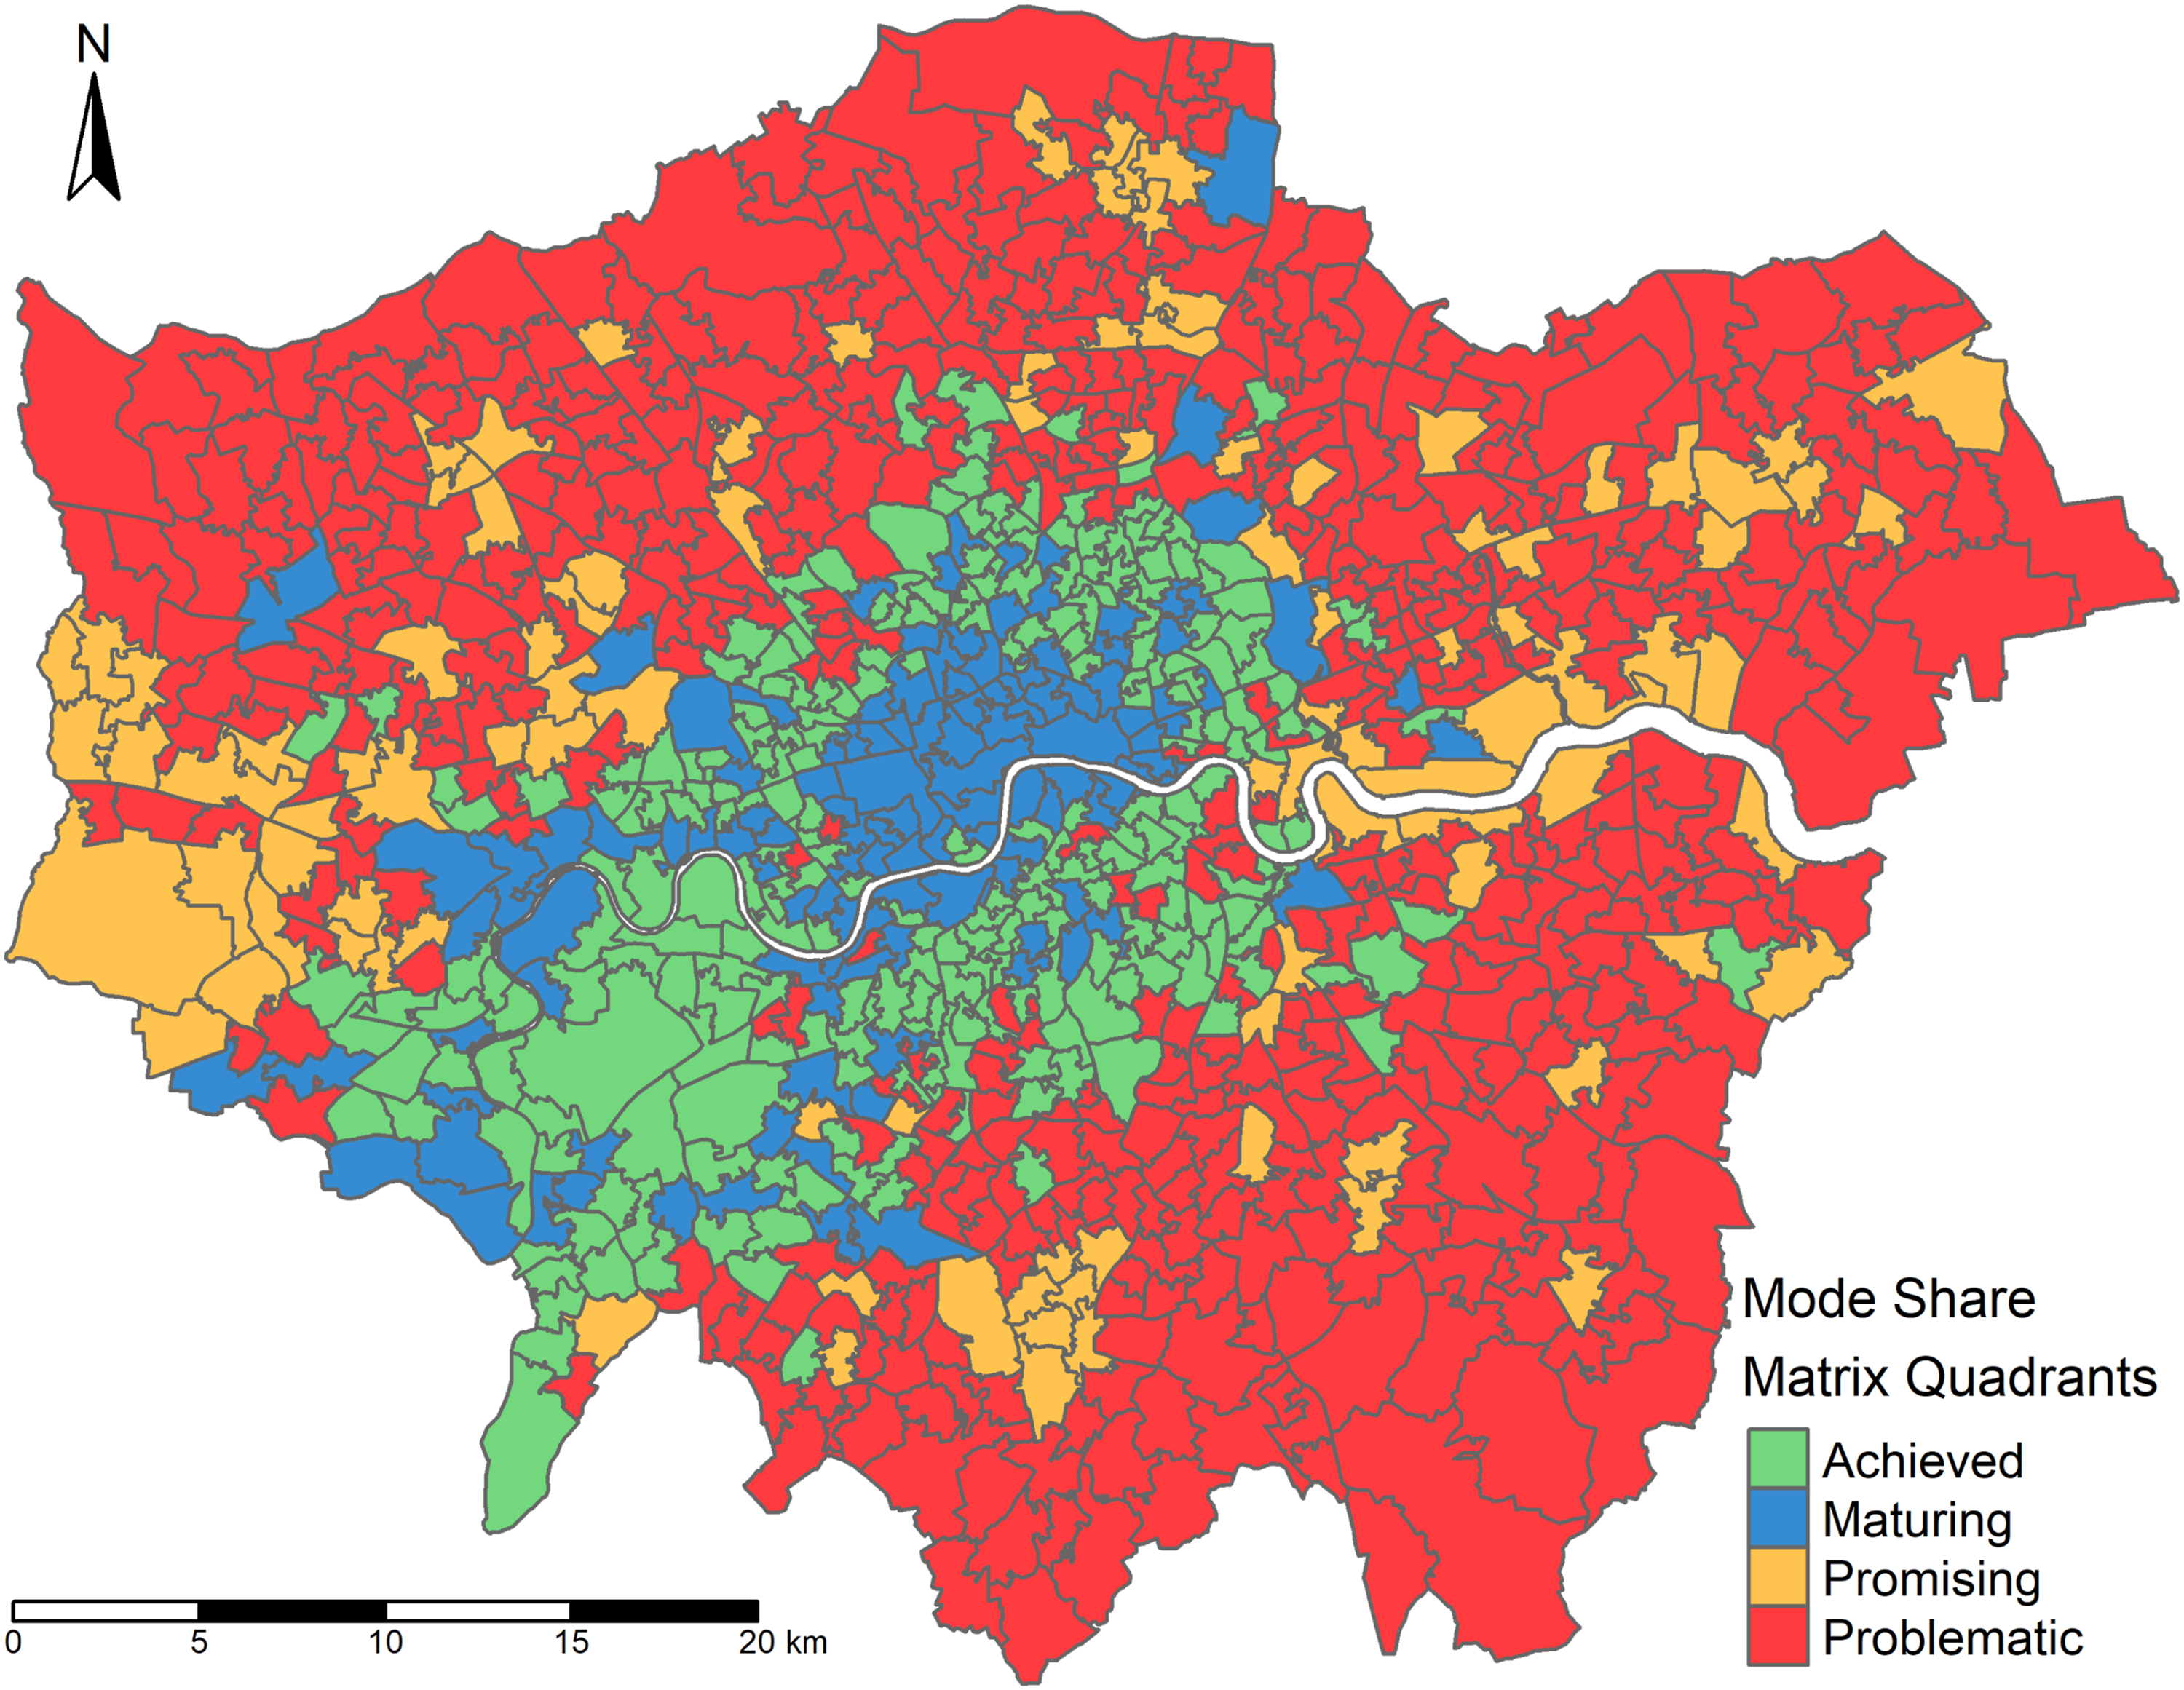
Comparing the cycle parking provision against current and future demand is also possible. Ideally, a cyclist would always be able to find a suitable parking space, so parking provision would exceed demand. TfL (Transport for London, 2016) recommends at least 20% additional capacity, while the Cambridge Cycling Campaign (2008) suggests an extra 50%. Based on these ratios, we defined occupancy rates as: • Surplus <50% • Ideal 50% to 80% • Threshold 80% to 100% • Shortage >100%
As a whole, London is at the low end of the shortage category, with a 102% occupancy rate. However, the occupancy rate has a significant spatial variation (SD = 193%), and the majority of cyclists (72%) are travelling to an MSOA with a shortage of cycle parking. Thus, overall, London currently needs an additional 55,000 cycle parking spaces and in the future may require 127,000 more spaces. Given these estimates are based on only commuter travel, the true value may be even higher. As Figure 5 shows, central London lacks parking despite having the highest concentration of parking spaces. Although some MSOAs in outer London also have a shortage of parking, these MSOAs also receive few cycle commuters due to the lower number of workplaces in outer London. Thus, an outer London MSOA may only require a handful of additional parking spaces to go from shortage to ideal, while an inner London MSOA may require hundreds of additional parking spaces. Baseline distribution of parking occupancy in London.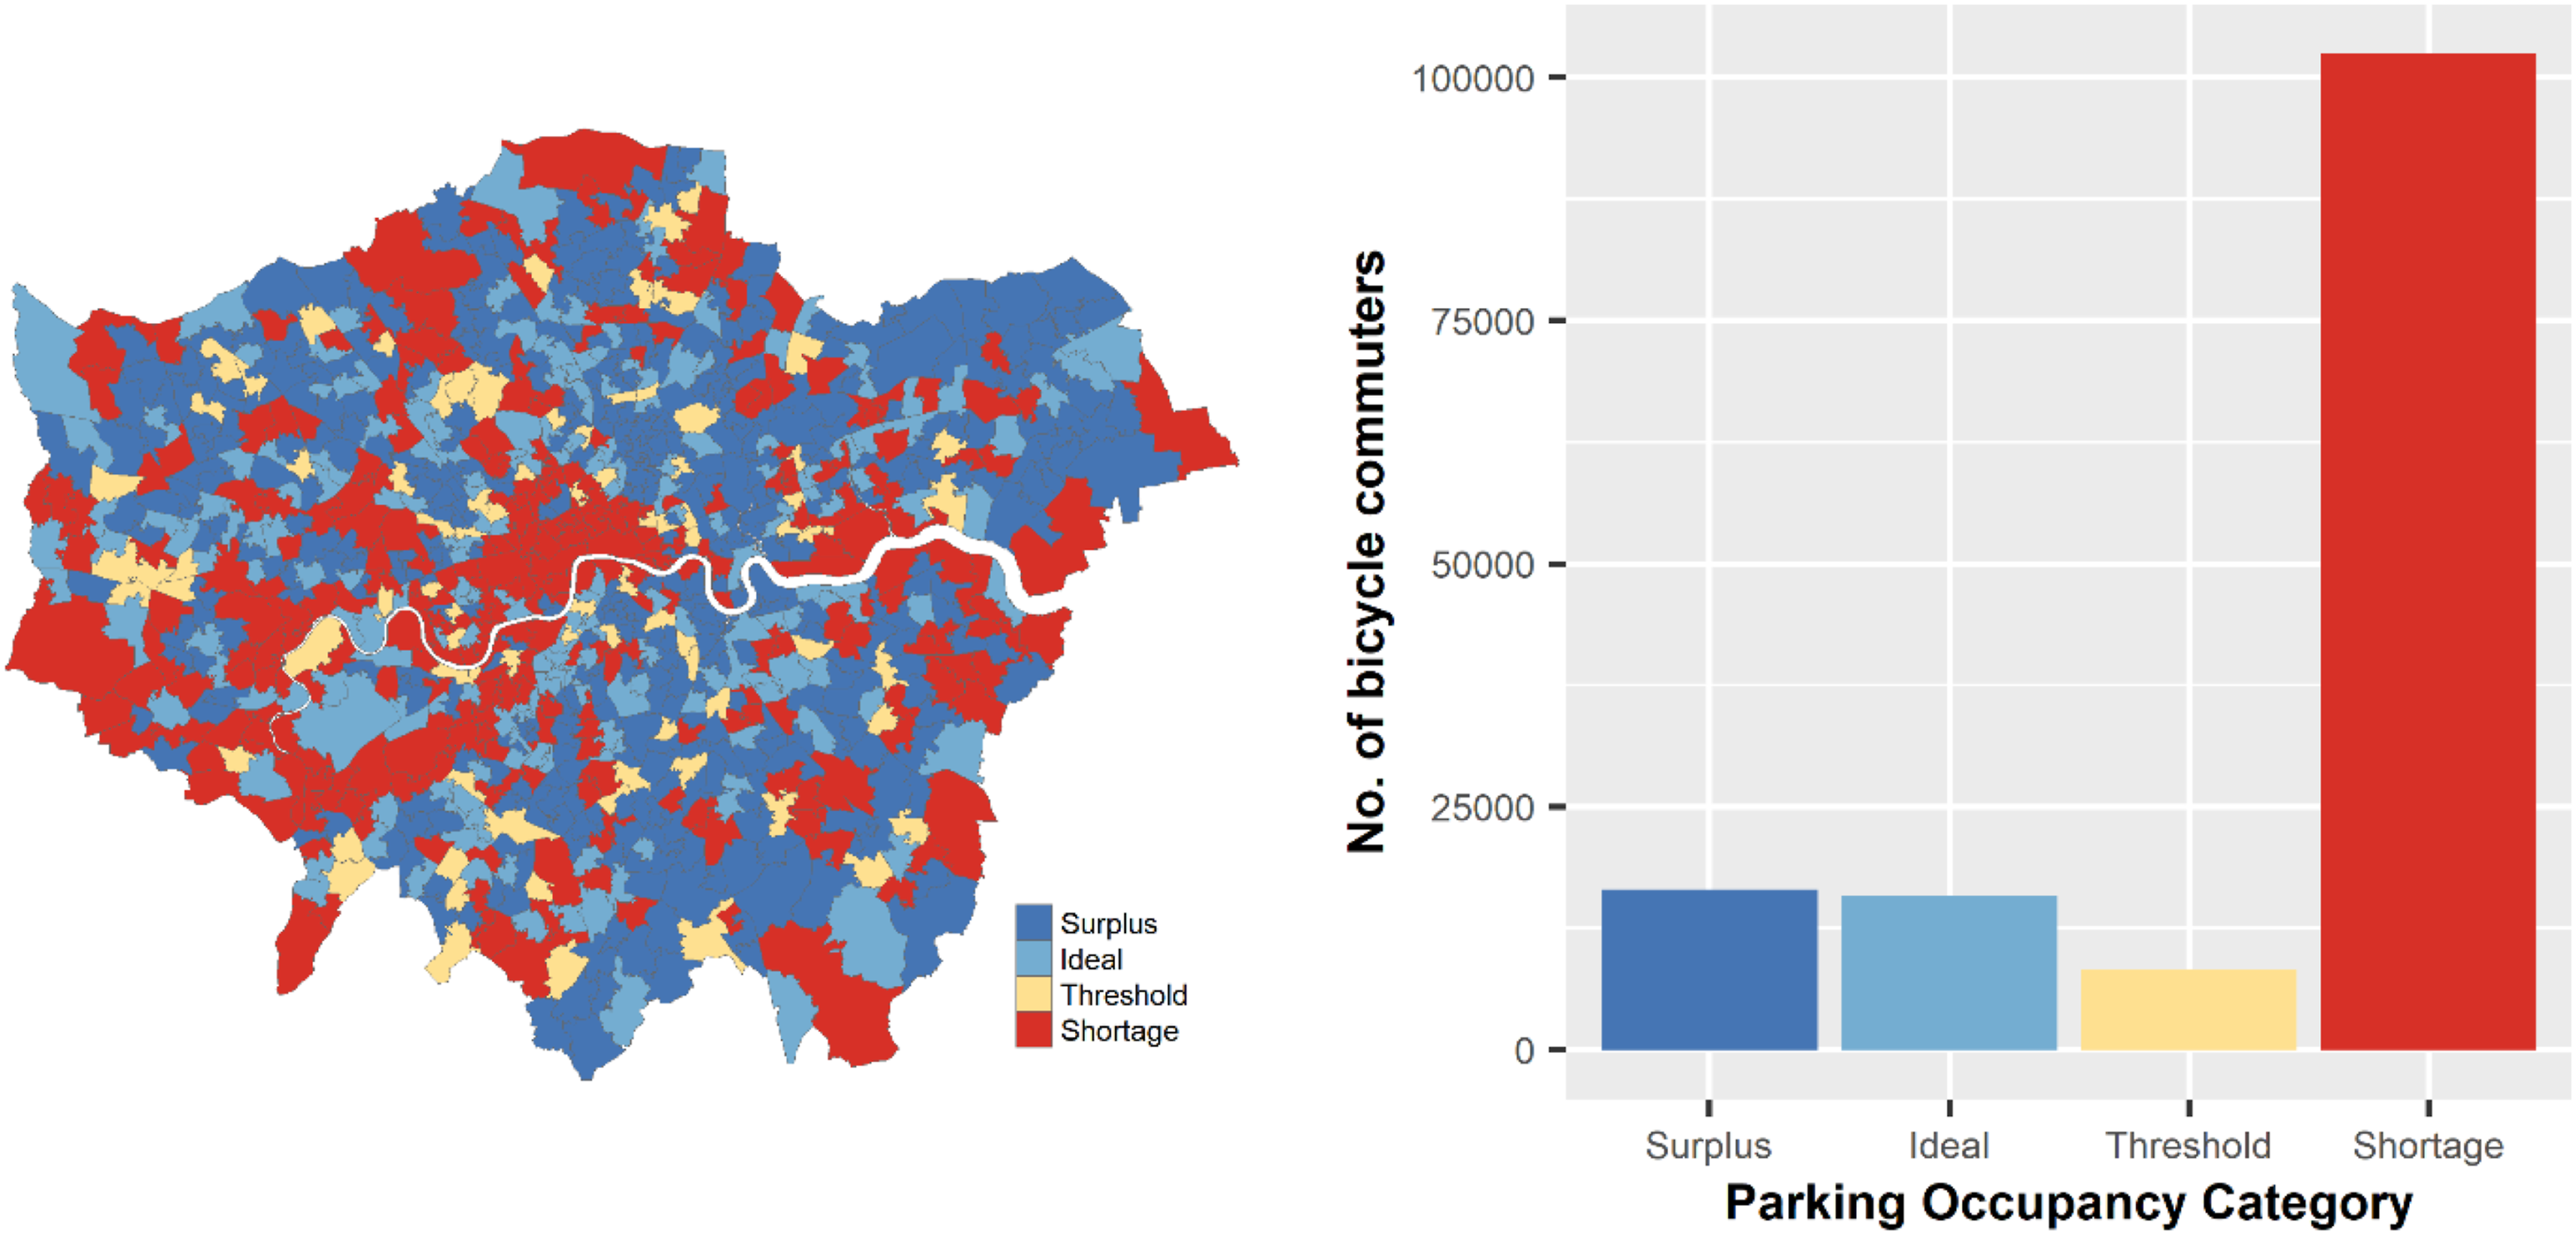
Figure 6 highlights that most of the missing cycle parking spaces are in the ‘maturing’ areas that receive 64% of cycle commuters, of which 89% experience a parking shortage. Similarly, more than half (54%) of cycle commuters travelling to ‘promising’ areas (11% of total cycle commuters) experience a shortage of parking. In contrast, most (65%) of those travelling to ‘problematic’ areas have a surplus or ideal amount of parking. Cyclists who arrive in an ‘achieved’ area also experience fewer shortages as more than half (52%) have access to ideal or surplus parking. These patterns suggest that a lack of cycle parking acts as a barrier to cycling, especially in the areas best suited to high levels of cycling. Breakdown of parking occupancy based on the number of cyclists currently communing.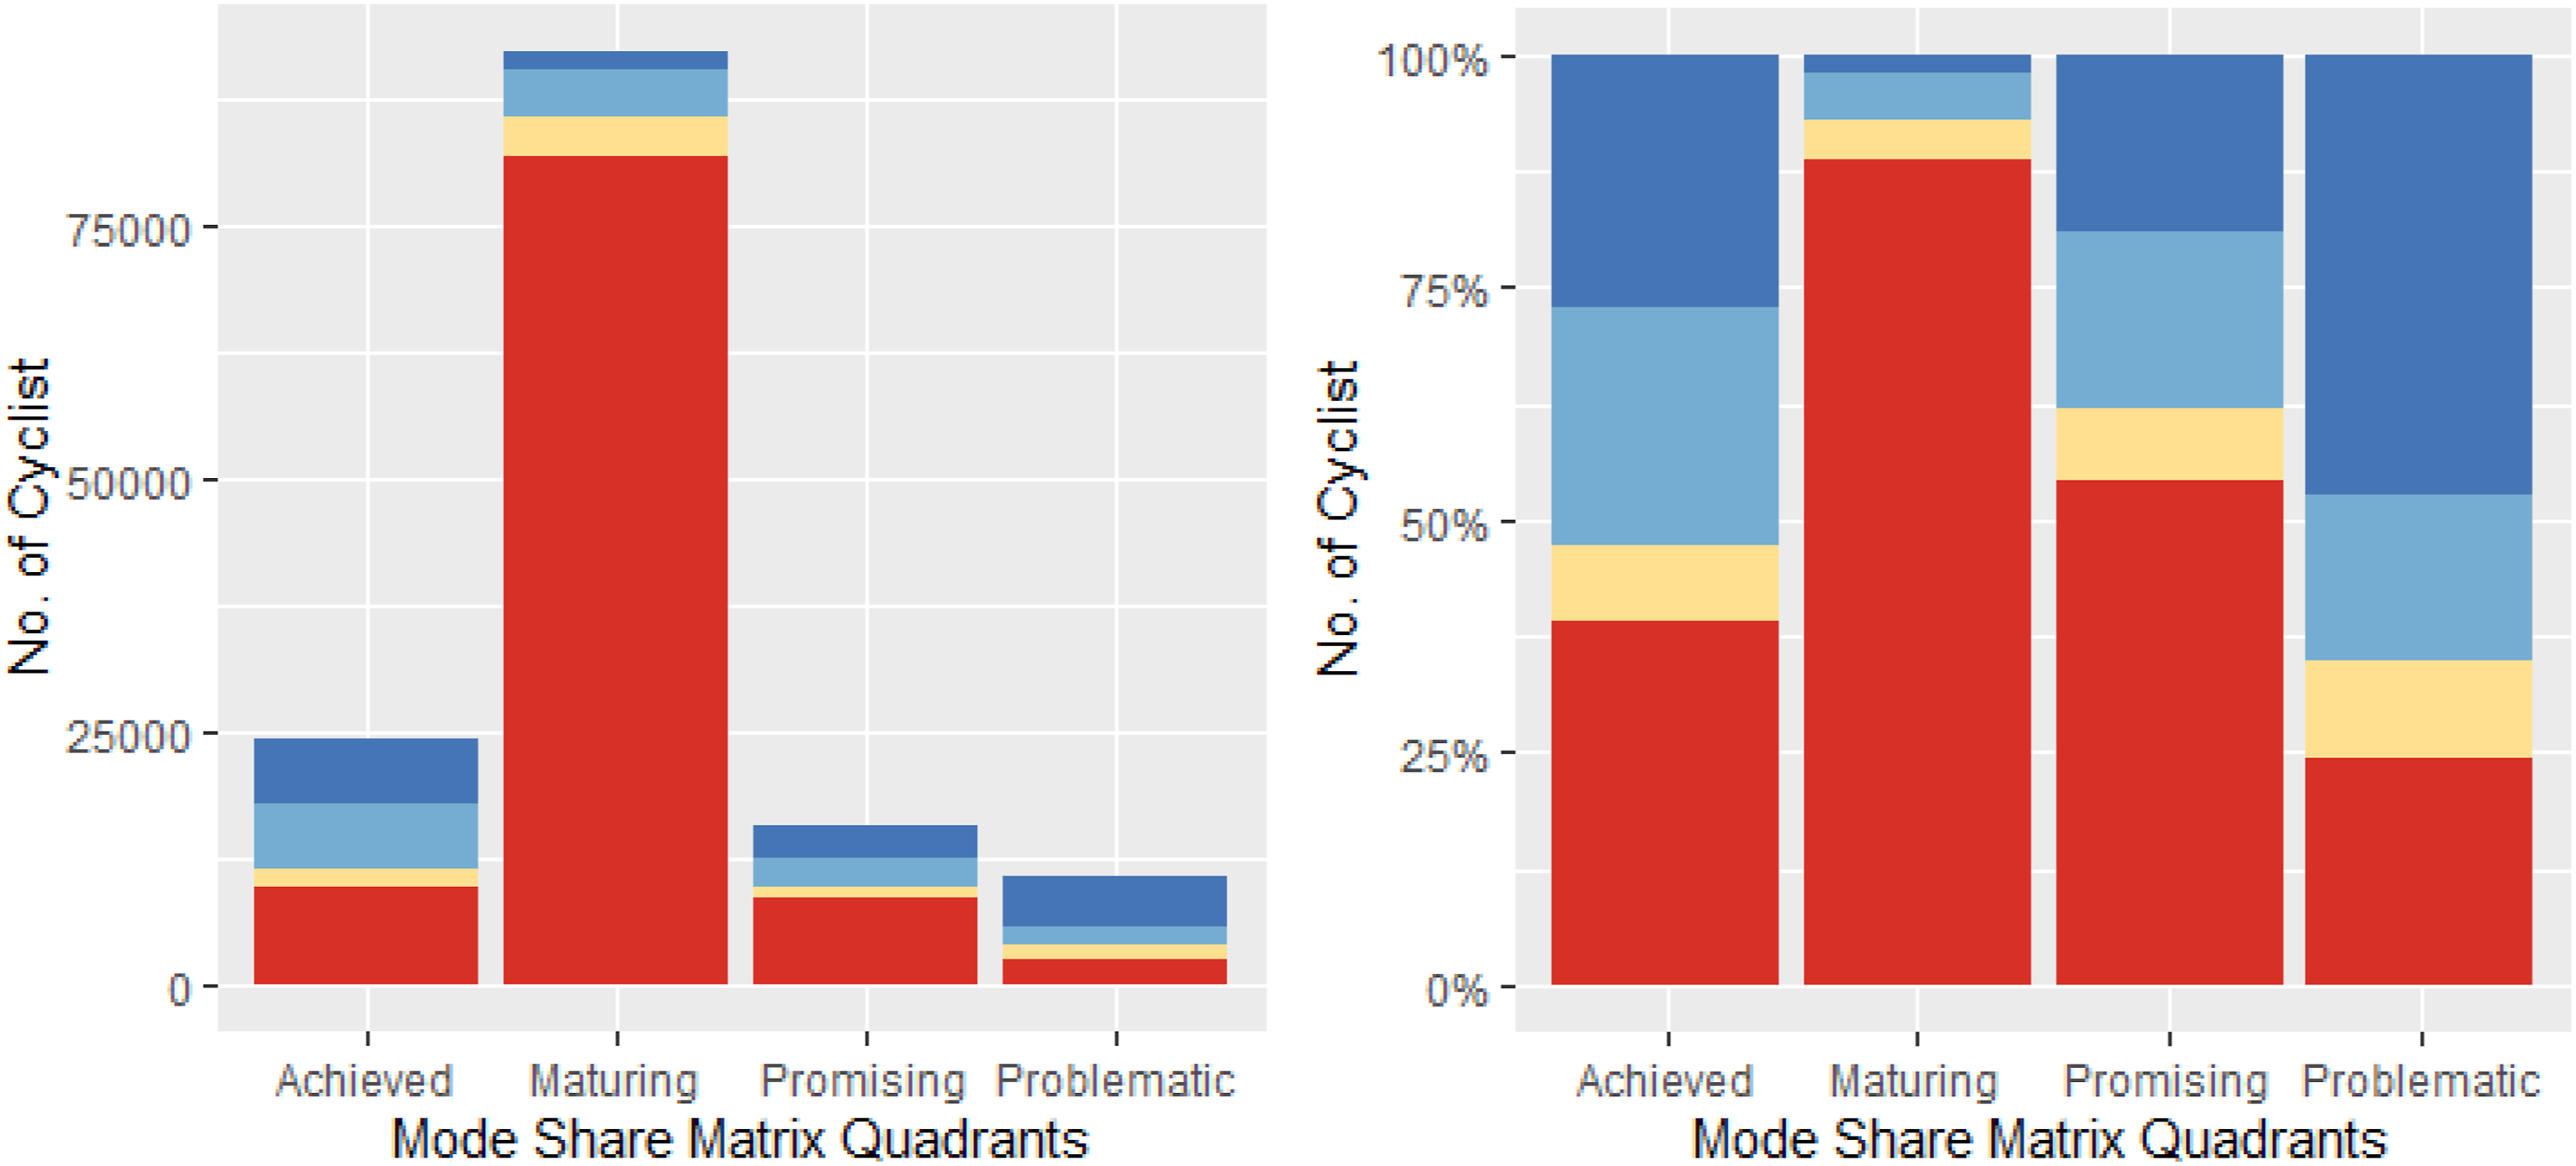
It is possible to calculate the occupancy rate under the future scenario. However, due to the significant increase in cycling possible in London, the occupancy rate showed shortages of cycle parking in almost every MSOA. Therefore, no useful spatial patterns could be observed in the results.
Discussion
This paper has presented three different measures of cycle parking, with each metric providing a slightly different answer to the question, ‘where should we invest in cycle parking?’ In this section, the characteristics of these metrics are analysed from three perspectives: absolute or relative measure; integration or separation of supply and demand; and ability to produce strategic insights.
Firstly, absolute metrics, illustrated in Figures 2(a) and (d), reveal a high concentration of parking supply and demand in inner London, suggesting that parking provision is correctly distributed. On the other hand, simple supply and demand measures do not show if a lack of supply suppresses demand. This could result in a planning policy that increases cycle parking in areas that have already been shown to be in demand and thus reinforces existing travel patterns rather than identifying opportunities for transformational change.
As a relative metric, the occupancy rate highlights locations where demand is close to supply, so increasing the supply of cycle parking may result in a corresponding increase in demand. Figure 5 highlights that MSOAs across London have a supply shortage; thus, the opportunities for increasing cycling may not be limited to the city centre. However, relative metrics lose the measures of the magnitude of benefits that can be achieved. For example, a 10% increase in a central MSOA with hundreds of existing cyclists may convey more benefits than a 100% increase in a suburban MSOA with only a few cyclists. The mode share matrix attempts to bring the benefits of both types of metrics, having an absolute measure on the y-axis and a relative measure on the x-axis
Secondly, whether supply and demand are integrated or separated significantly affects the metric’s nature. The parking occupancy rate combines both supply and demand conditions to measure the level of parking space availability. This is beneficial to policymakers as the analysis identifies a clear problem. Conversely, the mode share matrix only directly considers demand. However, it is worth noting that areas classified by the matrix as ‘promising’ or ‘maturing’ and so are expected to have the highest growth in cycling are also the most likely to have a current shortage in cycle parking. This finding is consistent with the hypothesis that a lack of cycle parking prevents more people from cycling. Additionally, more than half of the ‘achieved’ areas have sufficient parking, suggesting they are not the priority for additional investment. However, it should be noted that as MSOAs are reasonably large, an MSOA could have sufficient parking but in the wrong places, so local interventions may still be required.
The parking occupancy and mode share matrix classifications complement each other and give a richer understanding of the need for additional parking in each area. For example, additional parking may lead to immediate benefits in a ‘promising’ area with a shortage. However, planners may wish to significantly over-provide parking to transition the area to the maturing or achieved categories.
Finally, the descriptive statistics about supply and demand provide limited insights until they are combined into the occupancy rate. The occupancy rate offers planners an understanding of where the problems are and thus which areas to prioritise. The mode share matrix further enhances this understanding by considering the potential for future growth. Transport planners should seek to address current shortages in cycle parking supply and enable transformational change where possible. Thus, the occupancy rate helps in short-term planning, and the mode share matrix helps in long-term planning. Any locations where additional cycle parking would aid both short-term and long-term goals are especially suitable for investment.
The mode share matrix can also help navigate the sometimes tricky local politics of cycling investment. While planners may wish to target ‘promising’ areas capable of transformational change to maximise the benefits delivered, such changes take time and probably require multiple interventions on top of additional cycle parking. During the early stages of transitioning a city to high levels of cycling, it can be crucial that investments in cycling are seen to be successful. Otherwise, a failed cycling scheme can be used to justify blocking additional investment. Thus, a planner may opt to place early investments in the maturing category, which ensures that some parking spaces are used on day one while also demonstrating growing use over time. By showing early successes, transport planners can then create the political will to attempt more ambitious projects. Furthermore, the data-driven approach to producing the mode share matrix enables planners to select the best of each category rather than the more ambiguous areas close to the centre of the matrix. This contrasts the traditional BCG matrix approach, where investments are often subjectively grouped into the four categories.
Limitations of the methods
While tools that are simple to produce and use are helpful in transport planning, they are not without limitations, and the mode share matrix is no exception.
Firstly, the method focuses on designated public cycle parking spaces and so ignores fly-parking, private cycle parking, dockless bike share and folding bikes. All of which change the relationship between parking demand and supply. Fly-parking is already an issue in cities with high cycling culture (Larsen, 2017; Watkiss, 2017) and may be a common practice in inner London as a shortfall of 17,000 cycle parking spaces is claimed (Mayor of London, 2017). Especially as 97% of cycle parking in London has no additional security measures (Transport for London, 2018b), so cyclists may favour the flexibility and convenience of fly-parking.
Folding bikes and dockless bike share can reduce the need for designated parking spaces. However, folding bikes only make up 4% of the UK market (Bike Europe, 2017) and dockless bike share is not widespread in London partly due to the large docked bike-share scheme operated by Transport for London. Therefore, the impact of these types of bike may not be significant.
More generally, the method does not consider the type of cycling parking or its quality. Commuters may prefer secure lockers to street side racks better suited to short stays. A more nuanced approach would consider the mix of parking types as well as supplementary faculties such as showers or repaid stations. However, this would also increase the complexity of the analysis as people preferences would need to be considered as well as accounting for differential access (e.g. bike locker is only available to cyclists with a key).
A further limitation comes from the reliance on the Propensity to Cycle Tool data. Thus, while this analysis could be rapidly expanded to cover the whole of England and Wales, other countries would first have to reproduce the PCT analysis. However, as the PCT is a free, open-source tool, this is not an insurmountable obstacle to the widespread adoption of the method. It is also worth considering the effect on the method of the chosen study area. For example, if the analysis was performed for London and the surrounding countryside, the mean values used to define the boundaries between the four quadrants would fall. This would result in areas previously considered ‘problematic’ to become ‘maturing’. Thus the method can only help to prioritise between different areas but cannot provide an objective measure of the need for infrastructure.
The use of the PCT data also included other limitations. For instance, the PCT data is based on the 2011 travel to work data; thus, the analysis is outdated and limited to only a single trip purpose. It is also known that the pandemic has caused changes in commuting patterns that are not represented in the 2011 data. Furthermore, the PCT only considers direct cycle commutes and so misses cyclists that only use the bike for one leg of their journey, such as cycling to the train station. However, the method is not intrinsically tied to these limitations, and alternative data sources, such as mobile phone data, can provide timely all-purpose multi-stage origin-destination data. Additional consideration would also be required for parking duration. The current analysis assumes commuters need parking space all day, but this will not be true for all trip purposes.
Finally, the choice of MSOAs as the area of analysis was taken for practical reasons. But, as highlighted above, there could be a significant distance between the cycle parking and the final destination. Smaller areas of analysis would improve the results of the mode share matrix. However, transport planners will still need to exercise professional judgement in choosing the exact location of cycle parking facilities regardless of the areas used in the analysis.
Conclusions
This paper has shown that there are currently limited methods for the spatial planning of cycle parking and presents two complementary approaches to judging where more cycle parking should be provided. Unlike cars, which can be parked on the street, bicycles usually need to be locked to a fixed object and so require explicit parking facilities. Thus, a place with no cycle parking cannot easily be cycled to. The existing approach to cycle parking often focuses on a limited number of key locations such as transit stops or schools. While these locations certainly should have good cycle parking, they may not provide general parking capacity. Therefore, transport planners wishing to see a significant mode shift to bicycles should provide general publicly accessible cycle parking across cities.
The mode share matrix divides areas into four categories based on the current cycling mode share and the potential increase in cyclists travelling to each area. This simple classification provides valuable policy insights into where to invest in cycle parking. ‘Promising’ areas offer the chance of transformation change from low cycling to high cycling destinations. However, this change may require more than just cycle parking to achieve. ‘Maturing’ areas already have higher cycling rates but also have the potential for high growth, suggesting they may be good places for early investment. ‘Achieved’ places have higher cycling rates but limited growth potential, so investments may need to focus on a specific local issue. Finally, ‘problematic’ areas have low cycling rates and low growth potential, so they are unsuitable for cycling investment.
To supplement the mode share matrix, we calculated the occupancy rate that considers whether the current parking supply meets existing demand. The occupancy rate provides a useful short-term measure of where more cycle parking is needed, while the mode share matrix highlights long-term growth in cycle parking demand. When considered together, these two easy-to-calculate metrics give a rich understanding of the spatial distribution of both supply and demand and thus allow transport planners to prioritise parking investments.
These simple methods can help ensure that cycle parking capacity is provided where it is most needed. Which will increase the chances of achieving a significant mode shift to cycling and thus the environmental, social and economic benefits that change would provide.
Footnotes
Declaration of conflicting interests
The author(s) declared no potential conflicts of interest with respect to the research, authorship, and/or publication of this article.
Funding
The author(s) received no financial support for the research, authorship, and/or publication of this article.
Author biography
Dr Malcolm Morgan is a Senior Research Fellow at the Institute for Transport Studies, University of Leeds. His research focuses on the decarbonisation of transport and urban areas.