
Abstract
There is a growing interest in planning for green infrastructure, as well as a growing recognition of the multifunctional nature of green infrastructure, since it provides many social and environmental benefits to cities and regions. However, there is a lack of appropriate methods for prioritizing the locations for green infrastructure interventions. In response, this article proposes a spatial multi-criteria analysis for green infrastructure. We demonstrate the method at the regional scale for Southeast Michigan, as well as through two embedded case studies within this region. We show how the method can be adapted for rural parks and conservation planning, as well as for urban green infrastructure planning within the City of Detroit. Although lacking the analytical structure needed for some planning questions, and limited by data and access to appropriate technical skills, we argue the spatial planning approach strikes an appropriate balance between technical rigor and transparency required for collaborative planning practice. The described GIS-based analysis technique can be used as part of a planning process to identify locations for green infrastructure expansion or improvement in a way that acknowledges and balances their social and environmental benefits.
Introduction
Cities and regions are expanding green infrastructure as a strategy to achieve planning goals such as mitigating flooding and the urban heat island effect, improving residents’ access to green space and conserving critical natural habitat (Firehock, 2015; Garrison, 2019; Pauleit, 2011; Shi, 2020; Tzoulas et al., 2007). The term green infrastructure is used to refer to a variety of landscape elements, including street trees, parks, swales and other stormwater detention facilities, and reforestation initiatives (Tzoulas et al., 2007; Young, 2011). The term infrastructure emphasizes the potential for green landscape elements to provide valuable benefits, such as reducing flooding, provided by engineered “gray” infrastructure like stormwater systems. However, unlike typical gray infrastructure, green infrastructure provides multiple benefits, or ecosystem services, to people and the environment alike, and is therefore described as multifunctional due to the multiple benefits they provide. Green infrastructure planning is also associated with the principles of connectivity, integration, a communicative and social-inclusive process, and a long-term strategy (Pauleit et al., 2011).
The purpose of this article is to describe a methodology suited to planners’ needs to identify areas suitable for green infrastructure through the consideration of multiple benefits. Our method extends earlier work by Meerow and Newell (2017) in two ways. First, we adapt the method to use a much finer spatial resolution while also extending it to the regional scale, which Shi (2020) has recently argued is an important scale for green infrastructure planning. In addition to conducting a region-wide analysis for Southeast Michigan, we also develop two detailed case studies through engagement with stakeholders involved in real-world green infrastructure planning decisions: the Detroit Reforestation Initiative (DRI), and the Washtenaw County Parks and Recreation Commission’s (WCPARC’s) Natural Areas Preservation Program (NAPP). The case studies allow us to demonstrate how the method can be tailored to address diverse professional green infrastructure planning questions.
The remainder of the article is organized as follows: the background section describes planning methods for green infrastructure, presents the use of spatial multi-criteria analysis (MCA) for green infrastructure, and provides case context. The methods section summarizes our approach, which is fully documented in the supplemental material. The results section shows the analysis maps and outputs, and a discussion comments on the use of this method to inform professional practice before we conclude.
Background
The expanding practice area of green infrastructure planning typically includes projects that inventory existing natural assets and propose the locations and type of new green infrastructure landscape interventions (Firehock, 2015). In addition to the growing number of green infrastructure plans and initiatives (Young, 2011), there is evidence that such plans are making a difference in regional landscapes. A quasi-experimental analysis of nine counties in Colorado, Florida, and Maryland concluded that compared with control counties, the counties with green infrastructure planning experienced improvements in the quantity and quality of green infrastructure over ten years (Lynch, 2016). Since different urban green space types are associated with different benefits (Derkzen et al., 2015), a central challenge for green infrastructure planning is how to integrate consideration of the multiple potential benefits into a single methodological framework to determine spatial priorities for new interventions. The following section therefore focuses on methods that are suited for conducting analyses that recognize this multifunctional nature of green infrastructure.
Planning methods for multifunctional green infrastructure
At the neighborhood to metropolitan scales, green infrastructure can potentially provide multiple types of empirically-documented benefits to communities. Related to climate change mitigation, forests—a component of many types of green infrastructure—can play an important role in carbon sequestration (Hutyra et al., 2011; McPhearson, Kremer, and Hamstead , 2013; Nowak et al., 2013; Strohbach et al., 2012), as well as provide various direct and indirect benefits. Urban forests moderate temperatures in local microclimates, resulting in energy savings (Sawka et al., 2013) and improved air quality in adjacent neighborhoods (Nowak et al., 2006; Sæbø et al., 2012). Moreover, studies show that urban forests locally control rainfall surface runoff (Inkiläinen et al., 2013), improve water quaity (Wang et al. 2021), enhance soil stabilization (Grau et al., 2008) and support biodiversity by providing habitat to many species (Goddard et al., 2010; Nielsen et al., 2014). The multi-functionality of urban forests is also emphasized by the numerous health and recreational benefits delivered to local residents (Jorgensen and Gobster, 2010; Tzoulas et al., 2007). And recently, urban forests have been shown to have a positive impact on mental health (Engemann et al., 2019). Moreover, the cultural aspects of urban forests, such as aesthetics, heritage, social interaction, and community attachment are supported by findings in a multitude of studies (e.g., Kazmierczak, 2013; Nordh et al., 2009; Seeland et al., 2009; Wolch et al., 2014). As a result of these benefits, the presence of trees is consistently found reflected in real estate values through hedonic price analyses (Anderson and Cordell, 1988; Crompton, 2001; Kroeger, 2014). Forests in exurban and rural areas have additional benefits unique to those contexts, such as mitigating agricultural runoff and providing habitat corridors.
Prevailing methods in green infrastructure planning demonstrate the need for improved methods of spatial prioritization incorporating these multiple dimensions. Many cities have launched ambitious tree planting initiatives; however, these have lacked sophisticated analysis to maximize the benefits of these investments. For example, NYC Million Trees were largely planted in parks, which were already inequitably distributed therefore the campaign overlooked inequities in access to green spaces within the city (Garrison, 2019). Although MillionTreesLA may have succeeded in planting more trees in underserved areas, both programs relied on qualitative criteria for selecting neighborhoods resulting in ambiguous outcomes (Garrison, 2018). Inequity in urban green space is well-established (Landry and Chakraborty, 2009; Nesbitt et al., 2019; Watkins et al., 2017), and although relationships may be weakening (Koo et al., 2019), tree canopy is continuing to disproportionately decline in many urban areas (Nowak and Greenfield, 2018). While the impact of small-scale, isolated green infrastructure projects in the urban forest arena is modest, the most successful urban tree planting initiatives exhibit institutionalized, diverse funding structures and robust, agency-level commitment to maintaining and expanding urban forests (Young, 2011).
Within our study region, previous research has shown a small overall gain of tree canopy in the seven-county Southeast Michigan region, but also an ongoing decline in the City of Detroit (Gounaridis et al., 2020). The regional growth is mostly associated with some public tree planting efforts and maturing urban canopies in suburban communities. However, the ongoing housing development in the form of urban sprawl led to more fragmented and less connected forests across the region (Gounaridis et al., 2020). Within the realm of urban stormwater mitigation, decision-making has often been driven exclusively by urban stormwater considerations, disregarding the potential for green infrastructure to simultaneously provide for other important benefits, such as urban heat island mitigation or urban social equity (Newell et al., 2013). Finally, various methodologies exist for prioritizing conservation in rural areas, but many typically focus exclusively on environmental rather than social benefits (Bower et al., 2018; Moilanen et al., 209; Wintle, 2008).
Several methods are available to planners to develop recommendations in light of multiple competing benefits or objectives, a typical challenge in sustainability planning (Campbell, 1996). Although there are many technical comparisons, we adopt the approach proposed by Ellen et al. (2016) for evaluating professional methods for climate resilience planning, which specifies that they should have the following characteristics: participatory, transparent, comprehensive, rigorous, and scenario driven. Adopting this rubric, Ellen et al. (2016) survey several well-known planning methods, which also describe those used for green infrastructure planning. Working groups or collaborative approaches make decisions through the involvement and consensus of many diverse stakeholders, but can lack the rich spatial information and transparency of formal analytical methods. Cost–benefit analysis is technically rigorous but not accessible to stakeholders, and it typically only includes quantifiable factors. Compared with each of these, Ellen et al. (2016) argue that a third, MCA, which quantitatively combines multiple criteria to evaluate options, is a superior method for climate resilience planning, rating higher than either working groups or cost-benefit analysis on five principles for selecting effective methods in planning. We agree with these authors that MCA strikes a balance between the technical rigor and spatial detail required for high-quality plans but is also suitably flexible and understandable to stakeholders.
Spatial multi-criteria analysis for green infrastructure planning
MCA is a well-established decision-making method within operations research for making decisions through the explicit evaluation of multiple criteria. The method has three steps: first, a set of criteria are selected, which may be qualitative or quantitative. Second, weights are applied to each criterion to determine their relative importance. Finally, each option being considered is scored against the criteria and the weights applied to result in a final recommendation, which can take the form of a list of options that meet thresholds for the criteria, or scores are used to rank all options. Spatial MCA applies this logic within a geographic information system (GIS) to map each criterion, apply weights, and apply map algebra to produce a map illustrating spatial prioritization (Malczewski, 2006).
One notable application of spatial MCA to green infrastructure planning was provided by Meerow and Newell (2017), which proposed the green infrastructure spatial planning model for Detroit. This analysis mapped six potential green infrastructure benefits (managing stormwater, reducing social vulnerability, increasing access to green space, reducing urban heat island effect, improving air quality, increasing landscape connectivity) at the census tract-level in Detroit, and combined them through stakeholder inputs. A few scholars have proposed methodologies incorporating multiple criteria for green infrastructure sub-fields, including tree canopy (Bodnaruk et al., 2017; Locke et al., 2010) and stormwater infrastructure (Rivera, 2018). Most studies using MCA for green infrastructure analyzed locations to achieve a single benefit such as social equity (Christman et al., 2018) or air quality (Morani et al., 2011) or explored the spatial consequences of different governance priorities (Kremer et al., 2016).
This article explicitly builds on Meerow and Newell’s (2017) comprehensive methodology, introducing technical improvements and practice case studies that together illustrate how this methodology can be more effectively applied to green infrastructure planning. First, we extend the scope of our analysis to a large, seven-county region, and use a much finer spatial resolution than Census tracts, 30 m resolution for most criteria. This simultaneously demonstrates the potential of this method to be used for green infrastructure planning at large scales, such as across regions or watersheds and it also produces results able to prioritize sites with high geographic detail. Whereas Meerow and Newell’s (2017) method identifies census tracts for green infrastructure, our analysis can aid in the identification of particular streets or parcels within a given tract. Additionally, two engaged case studies demonstrate how the method can be tailored to suit the planning needs of stakeholders working in both urban and rural contexts to plan for a variety of green infrastructure strategies and decisions.
Case study overview: Southeast Michigan
This study adopts the Southeast Michigan Council of Governments (SEMCOG) region in southeast Michigan as a study area (Figure 1). This region includes Wayne, Washtenaw, Monroe, Livingston, Oakland, Macomb, and St. Clair counties contained within the Detroit metropolitan area, which includes the cities of Detroit, Monroe, Ann Arbor, Pontiac, and Port Huron and surrounding rural areas. The region is home to 4.7 million people according to the Census 2010 and encompasses 4,598 square miles. SEMCOG finalized the plan Green Infrastructure Vision for Southeast Michigan in 2014, the result of extensive collaboration with regional stakeholders. This plan inventories the benefits of different types of green infrastructure, proposes regional policies, and provides a green infrastructure vision map that identifies potential recreation and conservation lands, identifies potential green roads, and identifies urban areas where the increased tree canopy is needed. However, this plan does not conduct more specific analysis to prioritize areas within each category, instead it seeks to serve as a framework for more detailed plans to be created by local stakeholders. Within the SEMCOG region, many local jurisdictions engage in green infrastructure planning and initiatives. We implement our method for the region as a whole, as well as for two embedded cases that exemplify two different categories of local green infrastructure planning.
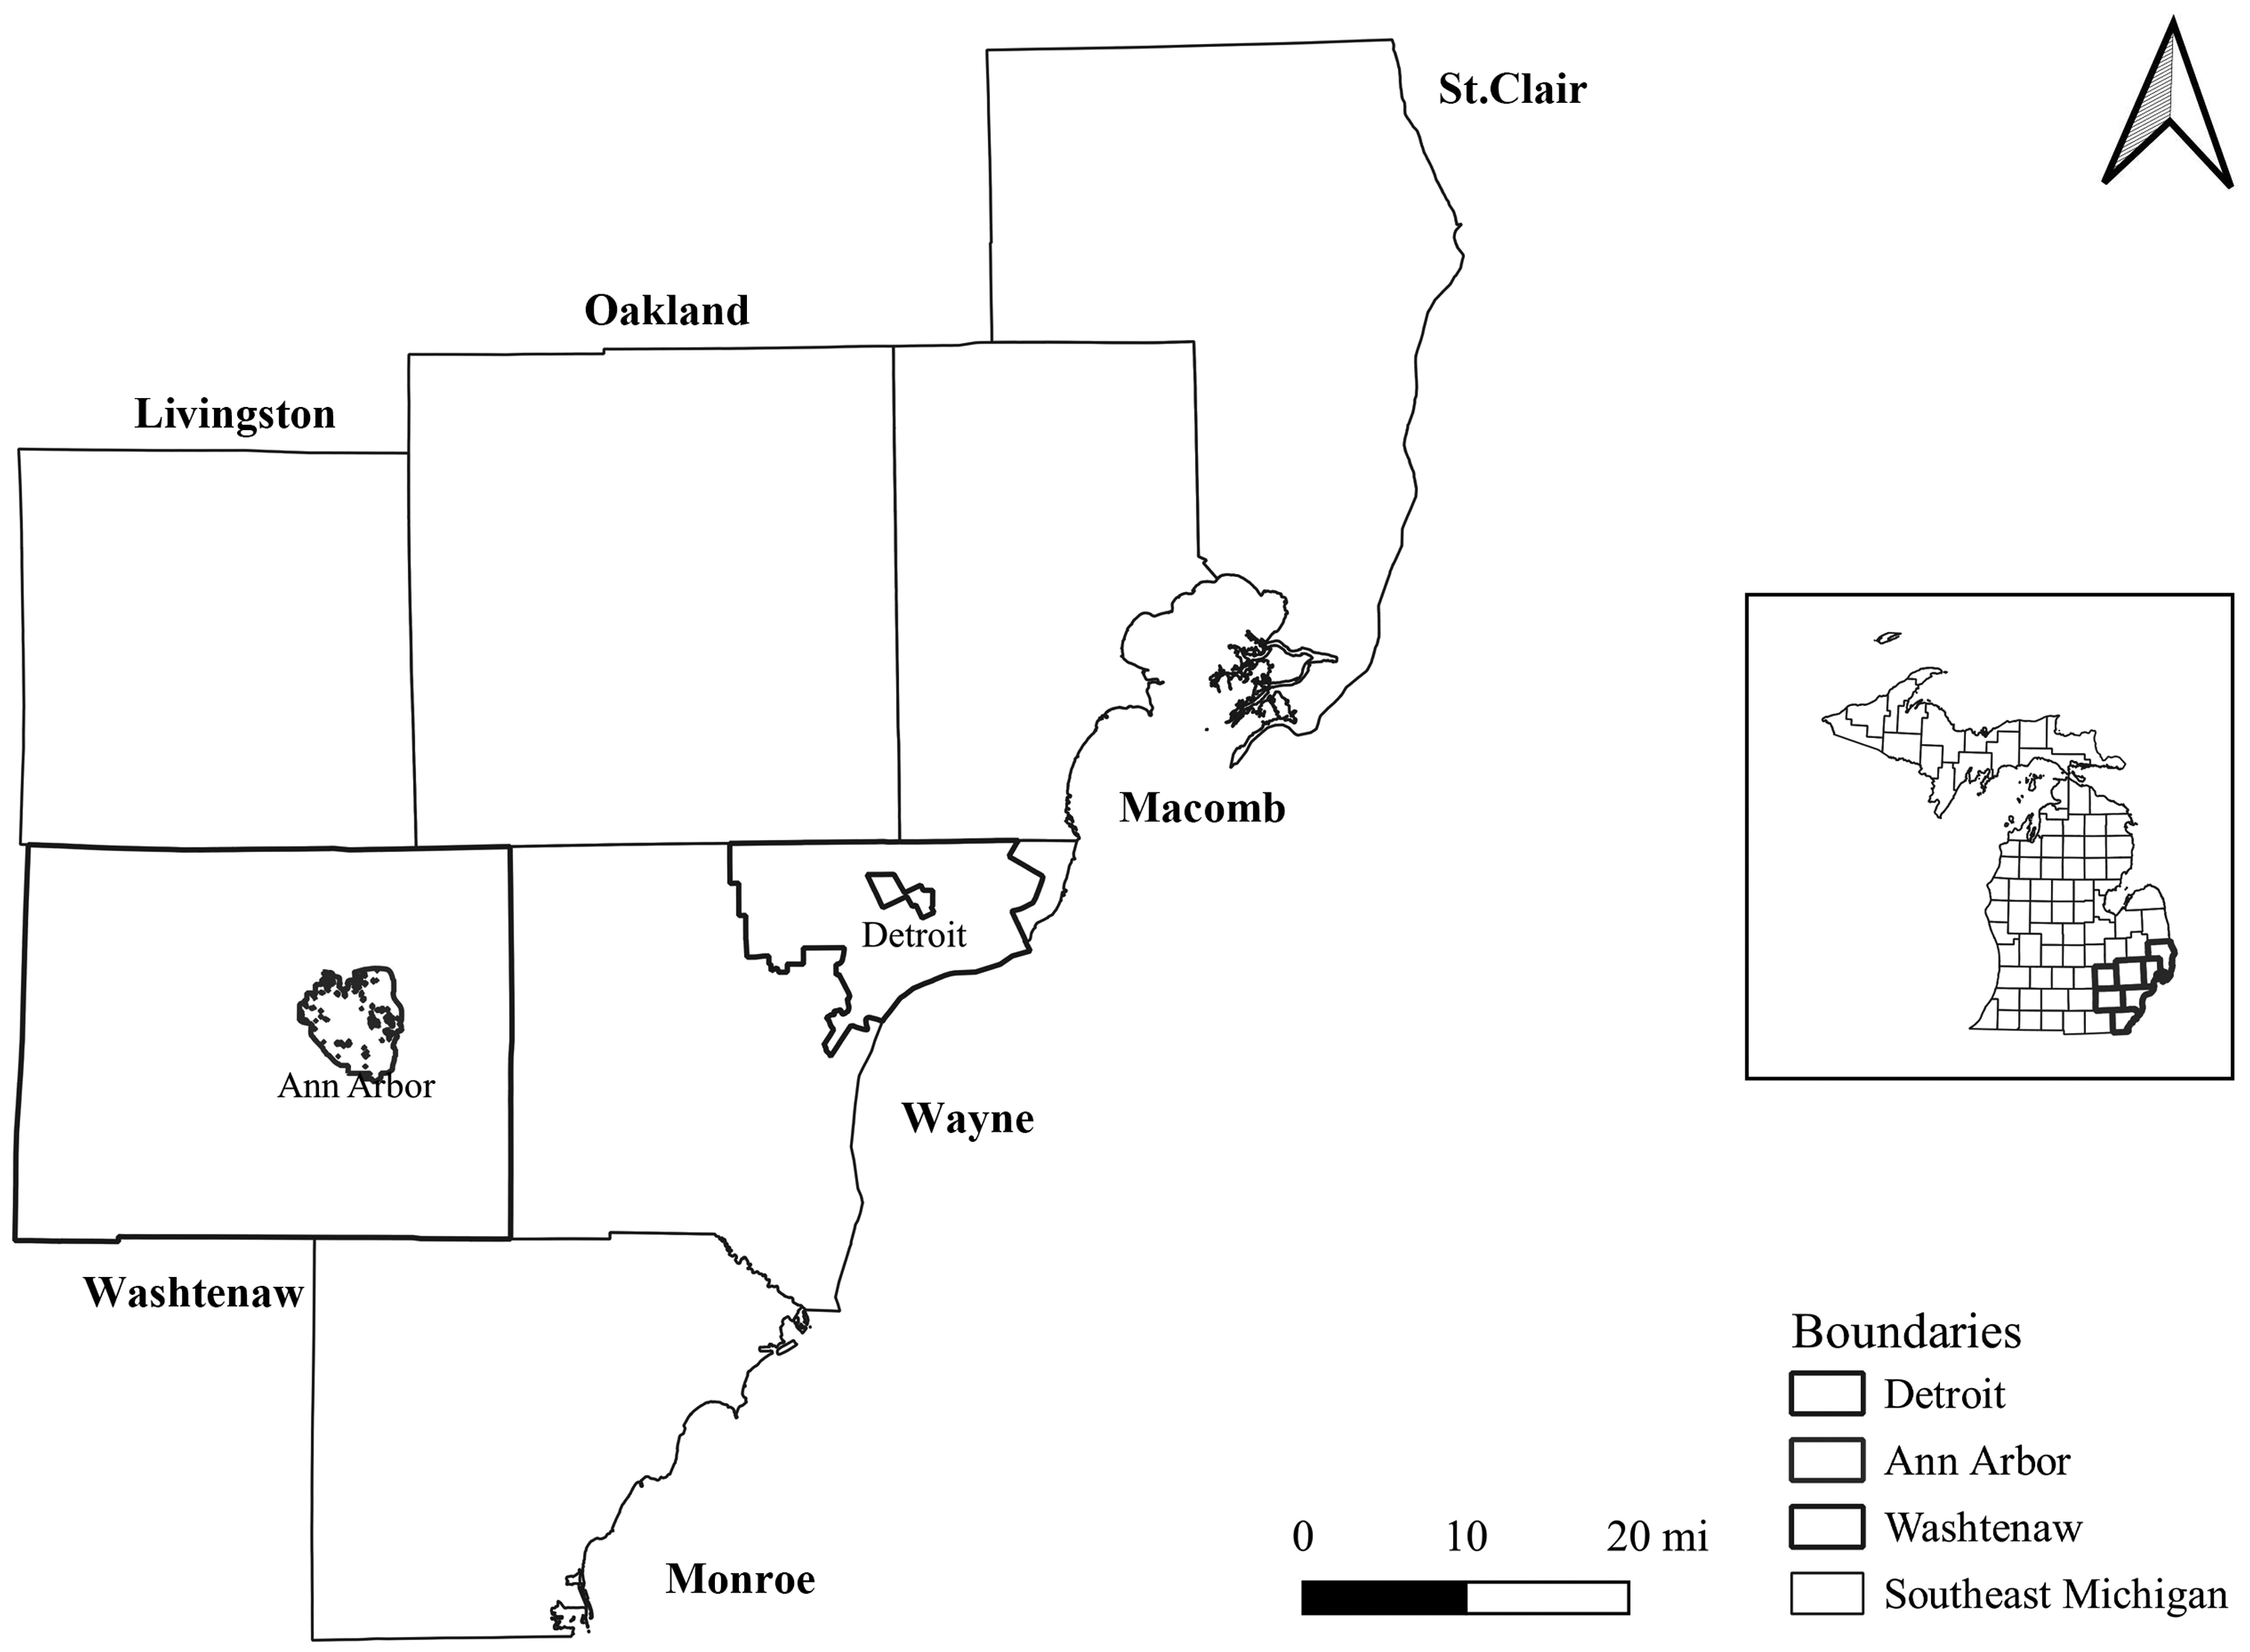
Southeast Michigan study region.
One embedded case focuses on green infrastructure planning within the City of Detroit, where there have been extensive discussions about appropriate green infrastructure within the context of vacant land and environmental racism. Due to the presence of a combined sewer overflow problem, there has been particular interest in green stormwater infrastructure in particular in Detroit (McFarland et al., 2019). To develop our case study, we engage with the DRI, a collaborative effort involving the City of Detroit, NGOs, and other stakeholders, to coordinate green infrastructure policy and implementation in the city.
The other embedded case is with the WCPARC. Specifically, our analysis informs ongoing landscape management decisions for the stewardship of the county’s extensive network of parks, recreation, and conservation areas. The county is involved in acquiring new properties through their NAPP, which receives dedicated tax revenue for acquiring new land for conservation purposes, and we demonstrate how our method can be used to rank properties for possible preservation.
Methods
We conducted a spatial MCA analysis for the entire Southeast Michigan study region, before tailoring the method to suit the needs of stakeholders involved in our embedded cases. The analysis incorporates six criteria, each of which is mapped before being combined (Figure 2). The method is summarized below and full documentation and individual factor maps are provided in the supplemental material.
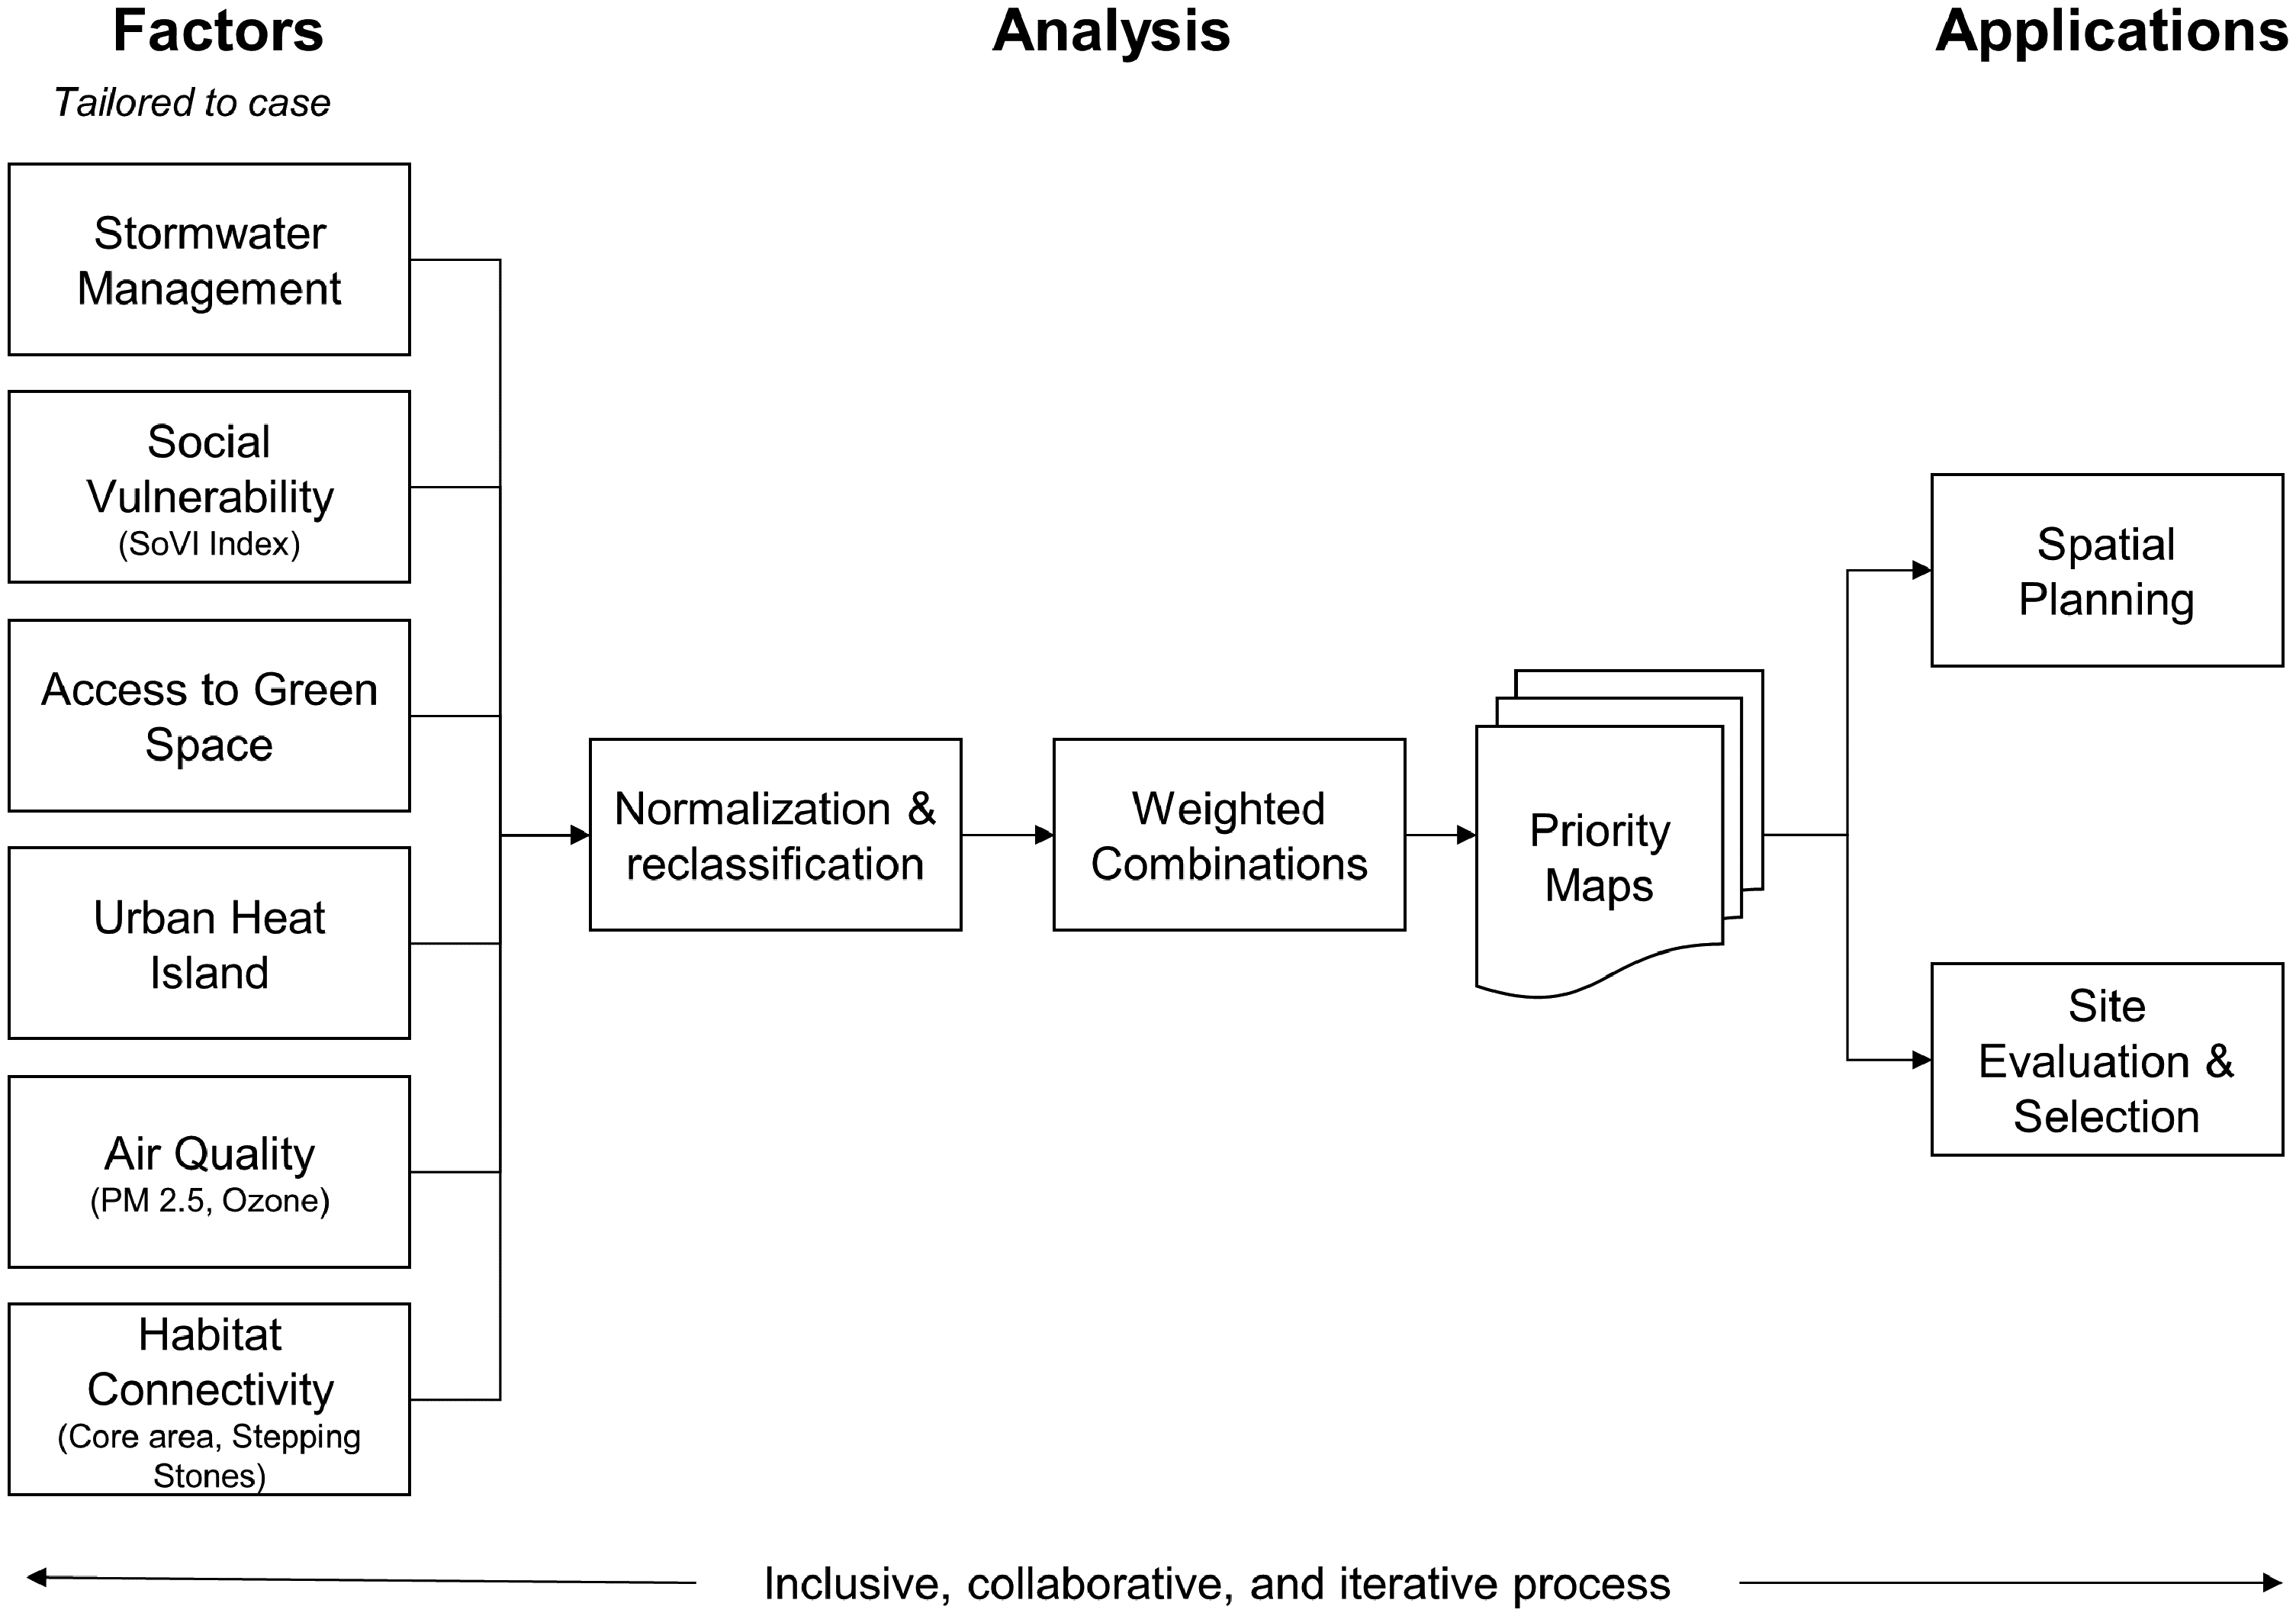
Overview of green infrastructure spatial planning model.
Green infrastructure criteria data sources and methods
Stormwater management
We acquired a land use vector layer from SEMCOG for the year 2015. The layer has land use zoning data with very high spatial and thematic resolution (e.g. residential types disaggregated to single family or multi-family housing). In addition to the land use polygons, we included the road network from the TIGER/Line dataset (2016 version). Roads originally represented as lines were converted to polygons using a 5-m buffer. To calculate runoff, we assigned coefficients per land use type following the USDA’s Natural Resources Conservation Service—Hydrology Training Series/Module 206D.
Social vulnerability
We calculated the social vulnerability index at the census tract-level, adopting 27 commonly used variables from the SoVI (Cutter and Emrich, 2017). The SoVI input data were normalized as either percentage, per capita values or density functions. To further reduce the complexity of the dataset, we standardized the input variables and performed Principal Component Analysis using a varimax rotation and Kaiser criterion for component selection which reduced the dataset to seven leading factors. Using an equal weight approach, SoVI was then calculated as the sum of all components. For the Detroit case study, we substitute this index with another social vulnerability index derived from a related set of socioeconomic variables that have been validated to be correlated with heat-related deaths in Detroit (Conlon et al., 2020).
Access to green space
We used GIS and a proximity analysis approach to calculate the physical distance between the census block group centroids and the nearest parks of the region. For the analysis, we used the SEMCOG’s parks and recreation areas layer and calculated the euclidean distance at 30 m spatial resolution.
Urban heat island
We acquired 30 m spatial resolution Land Surface Temperature data from the Landsat Level-2 Provisional Surface Temperature products which are included in the U.S. Landsat Analysis Ready Data product bundle (Cook et al., 2014). The atmospherically corrected thermal bands underwent a sophisticated approach that takes into account background emissivity coupled with vegetation condition products such as the Normalized Difference Vegetation Index (Malakar et al., 2018). We acquired four cloud-free Landsat 8 Operational Land Imager images from mid-July 2019 to cover the entire southeast Michigan region. We opted to work with imagery acquired in summer to capture the greatest urban heat island intensity.
Air quality
We used data on fine particulate matter (PM2.5) and Ozone concentrations across the region. We acquired data on both from the Environmental Protection Agency. The data are based on estimates of daily ozone (maximum 8-h average) and PM2.5 (24-h average) from the National Air Monitoring Stations/State and Local Air Monitoring Stations and numerical output from the Models-3/Community Multiscale Air Quality (Mebust et al., 2003). Data from both sources are then looped into a fusion downscaling Bayesian space–time model (Berrocal et al., 2010). Outputs were available at a 12-km point grid format for the year 2016. To create continuous raster layers at 30 m resolution, we spatially interpolated the data using the Multilevel B-spline algorithm (Lee et al., 1997).
Habitat connectivity
We used a newly developed very high resolution (1 m) land cover map of the region for the year 2015 (Gounaridis et al., 2020). The map was created using aerial imagery and the random forests algorithm and includes forests and smaller street tree patches across the region and is more suitable to assess habitat connectivity than using other coarser readily available datasets. From this dataset, we extracted only the “forest” pixels. Next, forest patches larger than 12 ha qualified as core habitat areas (Kong et al., 2010; Zhang et al., 2019) and patches smaller than 12 ha qualified as stepping stones. The goal was to generate continuous surfaces that reflect the connectivity of each habitat quality component. Following the methodology described in Gounaridis et al. (2020) we used a 1 × 1 km to divide the area into unique “landscapes”. We split both core habitat and stepping stones layers into 12,633 smaller raster files and calculated the Area Weighted Mean Proximity index using FRAGSTATS (McGarigal et al., 2002). Finally, results were joined back to the grid cells, extracted centroids and applied the multilevel B-spline interpolation for each layer to end up with 30 m spatial resolution continuous surfaces (Lee et al., 1997).
MCA combination
Each layer was reclassified to a 1–10 scale based on the quantile, resampled to 30 m spatial resolution and combined using the simple additive weighting method (Afshari et al., 2010). Since the regional analysis was conducted primarily to demonstrate the method outside of an established planning process, we decided to apply equal weights to the factors. However, as specified below, we tailored the weights in different ways for the case stakeholders to reflect their priorities and tailor the method to their particular decision context.
Results
Our regional green infrastructure priority map resulting from the evenly weighted combination of the six criteria is shown in Figures 3 and 4. It shows the areas with the highest priority include the City of Detroit, southern parts of Macomb County including the city of Warren, and the city of Monroe. In suburban and exurban areas of the remaining counties, there are patches of highly rated areas.
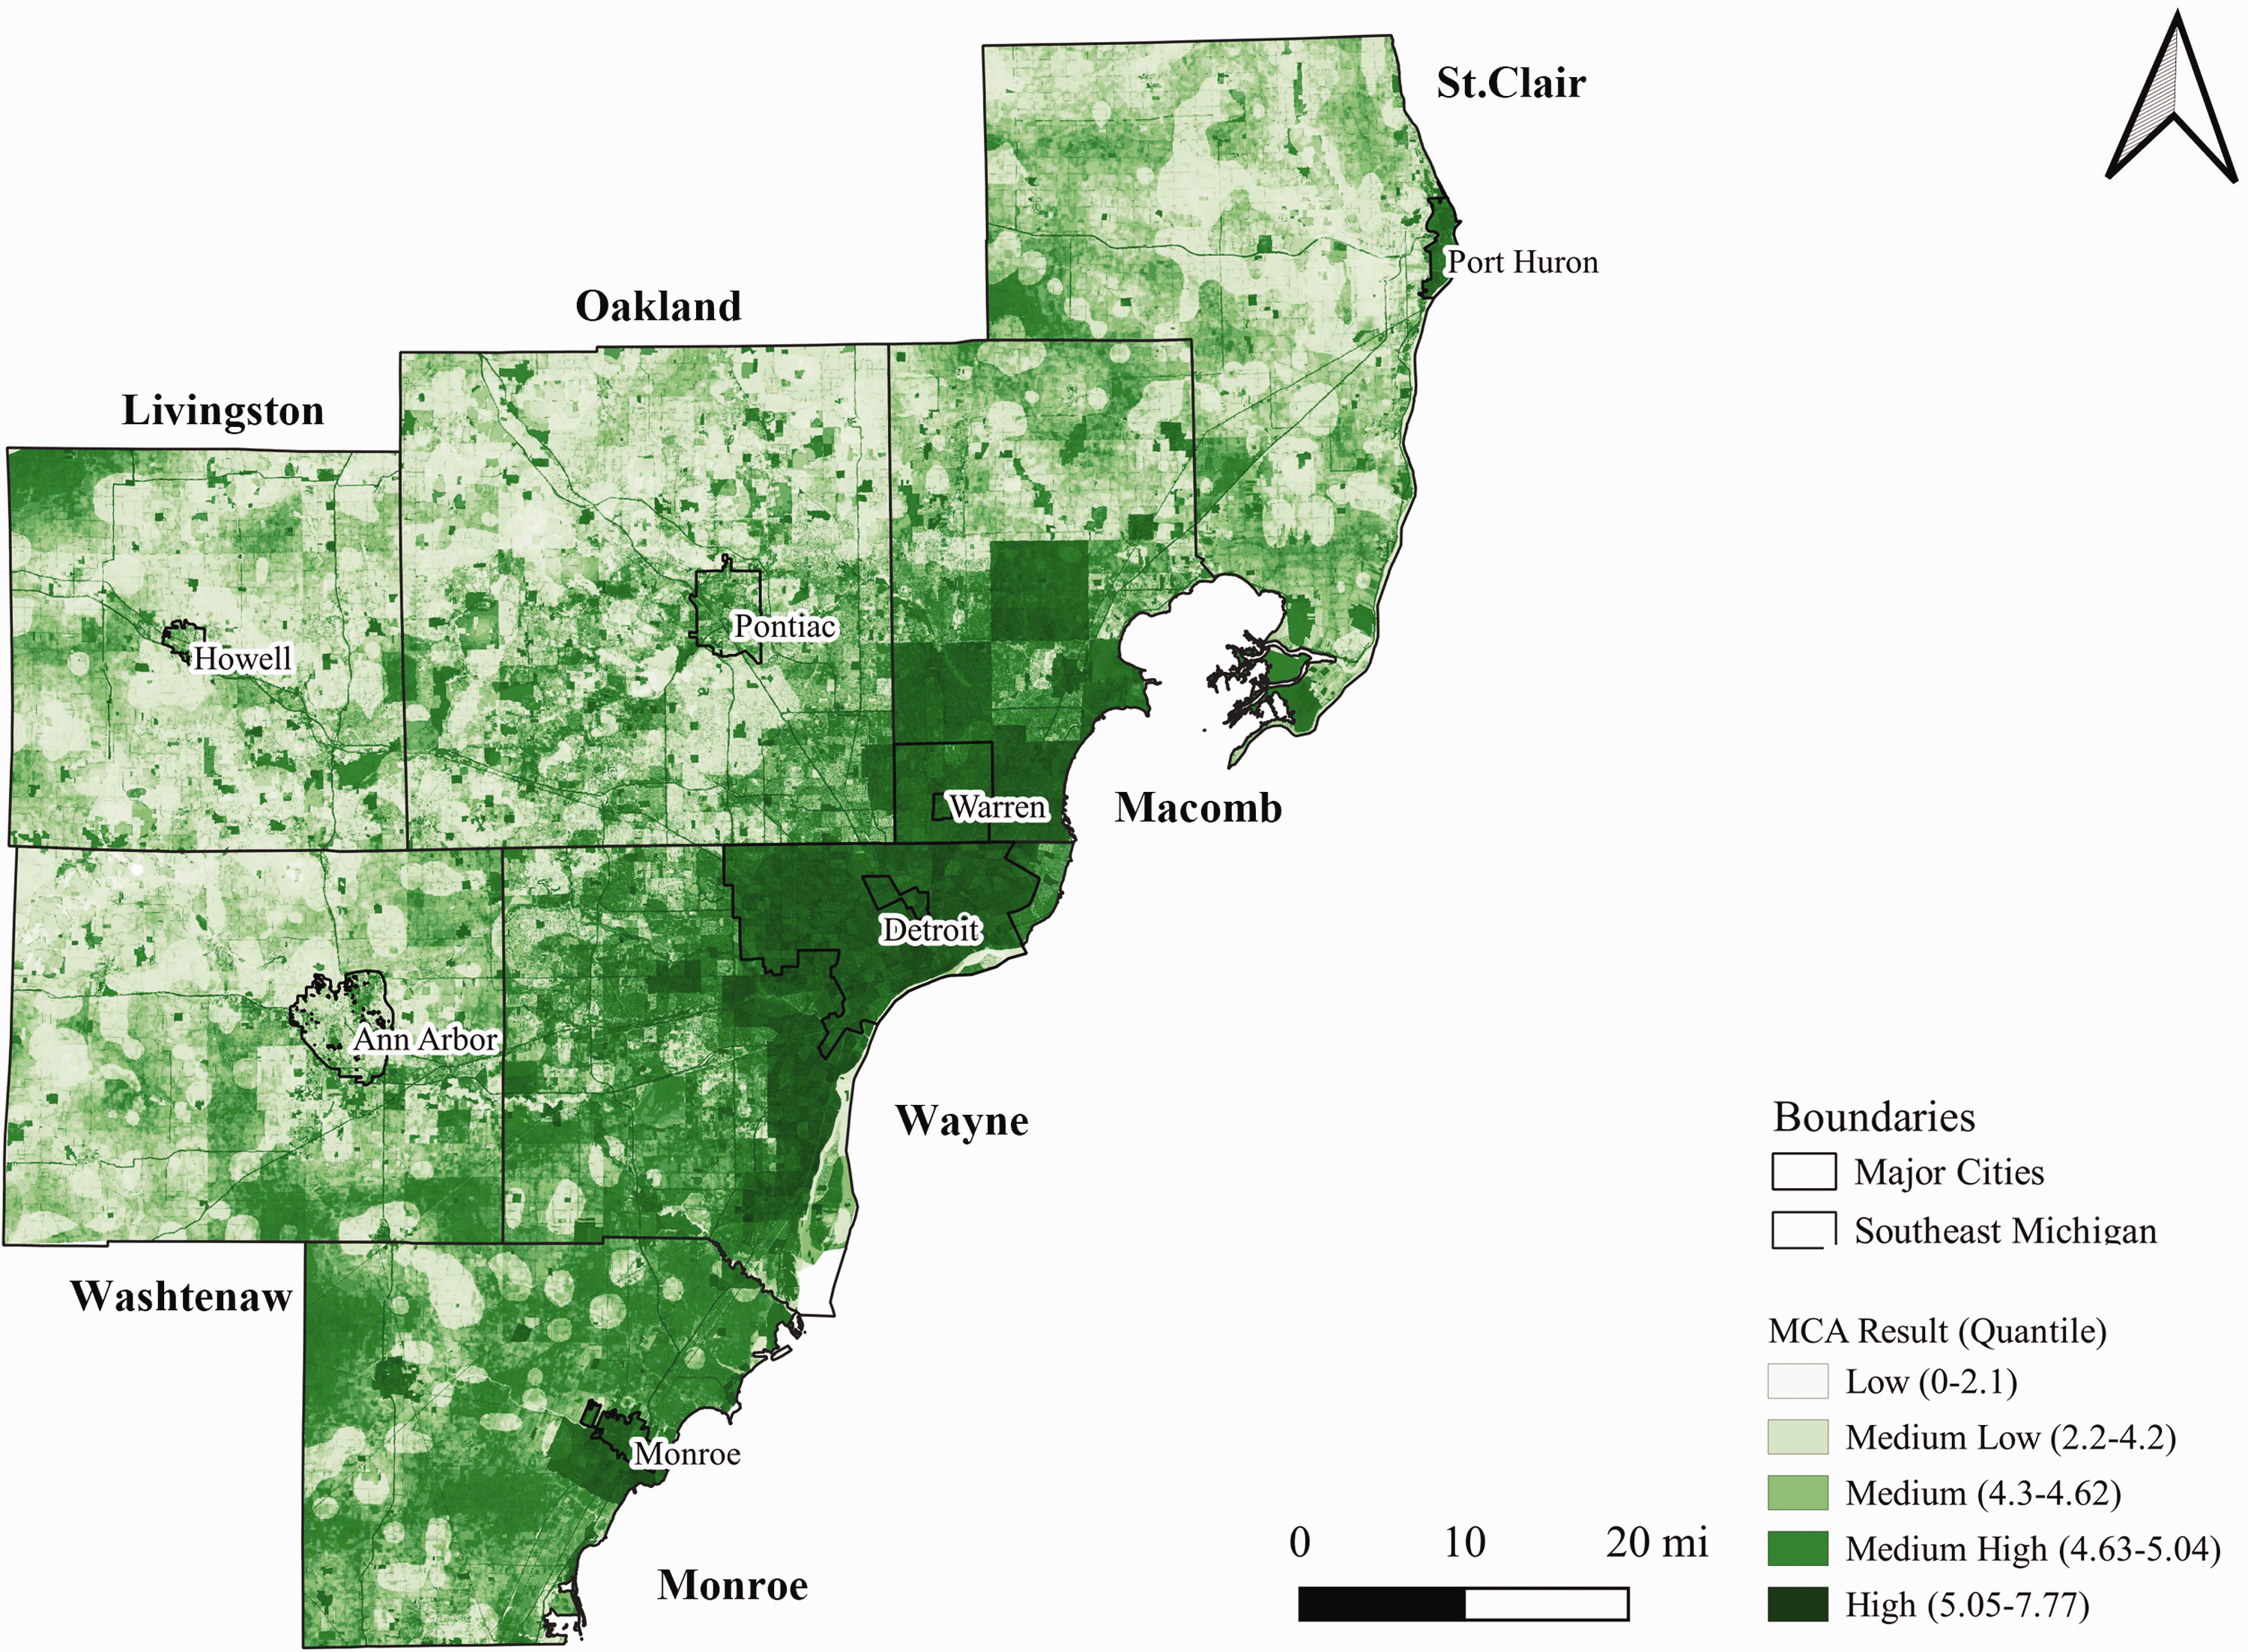
Regional green infrastructure priority map.
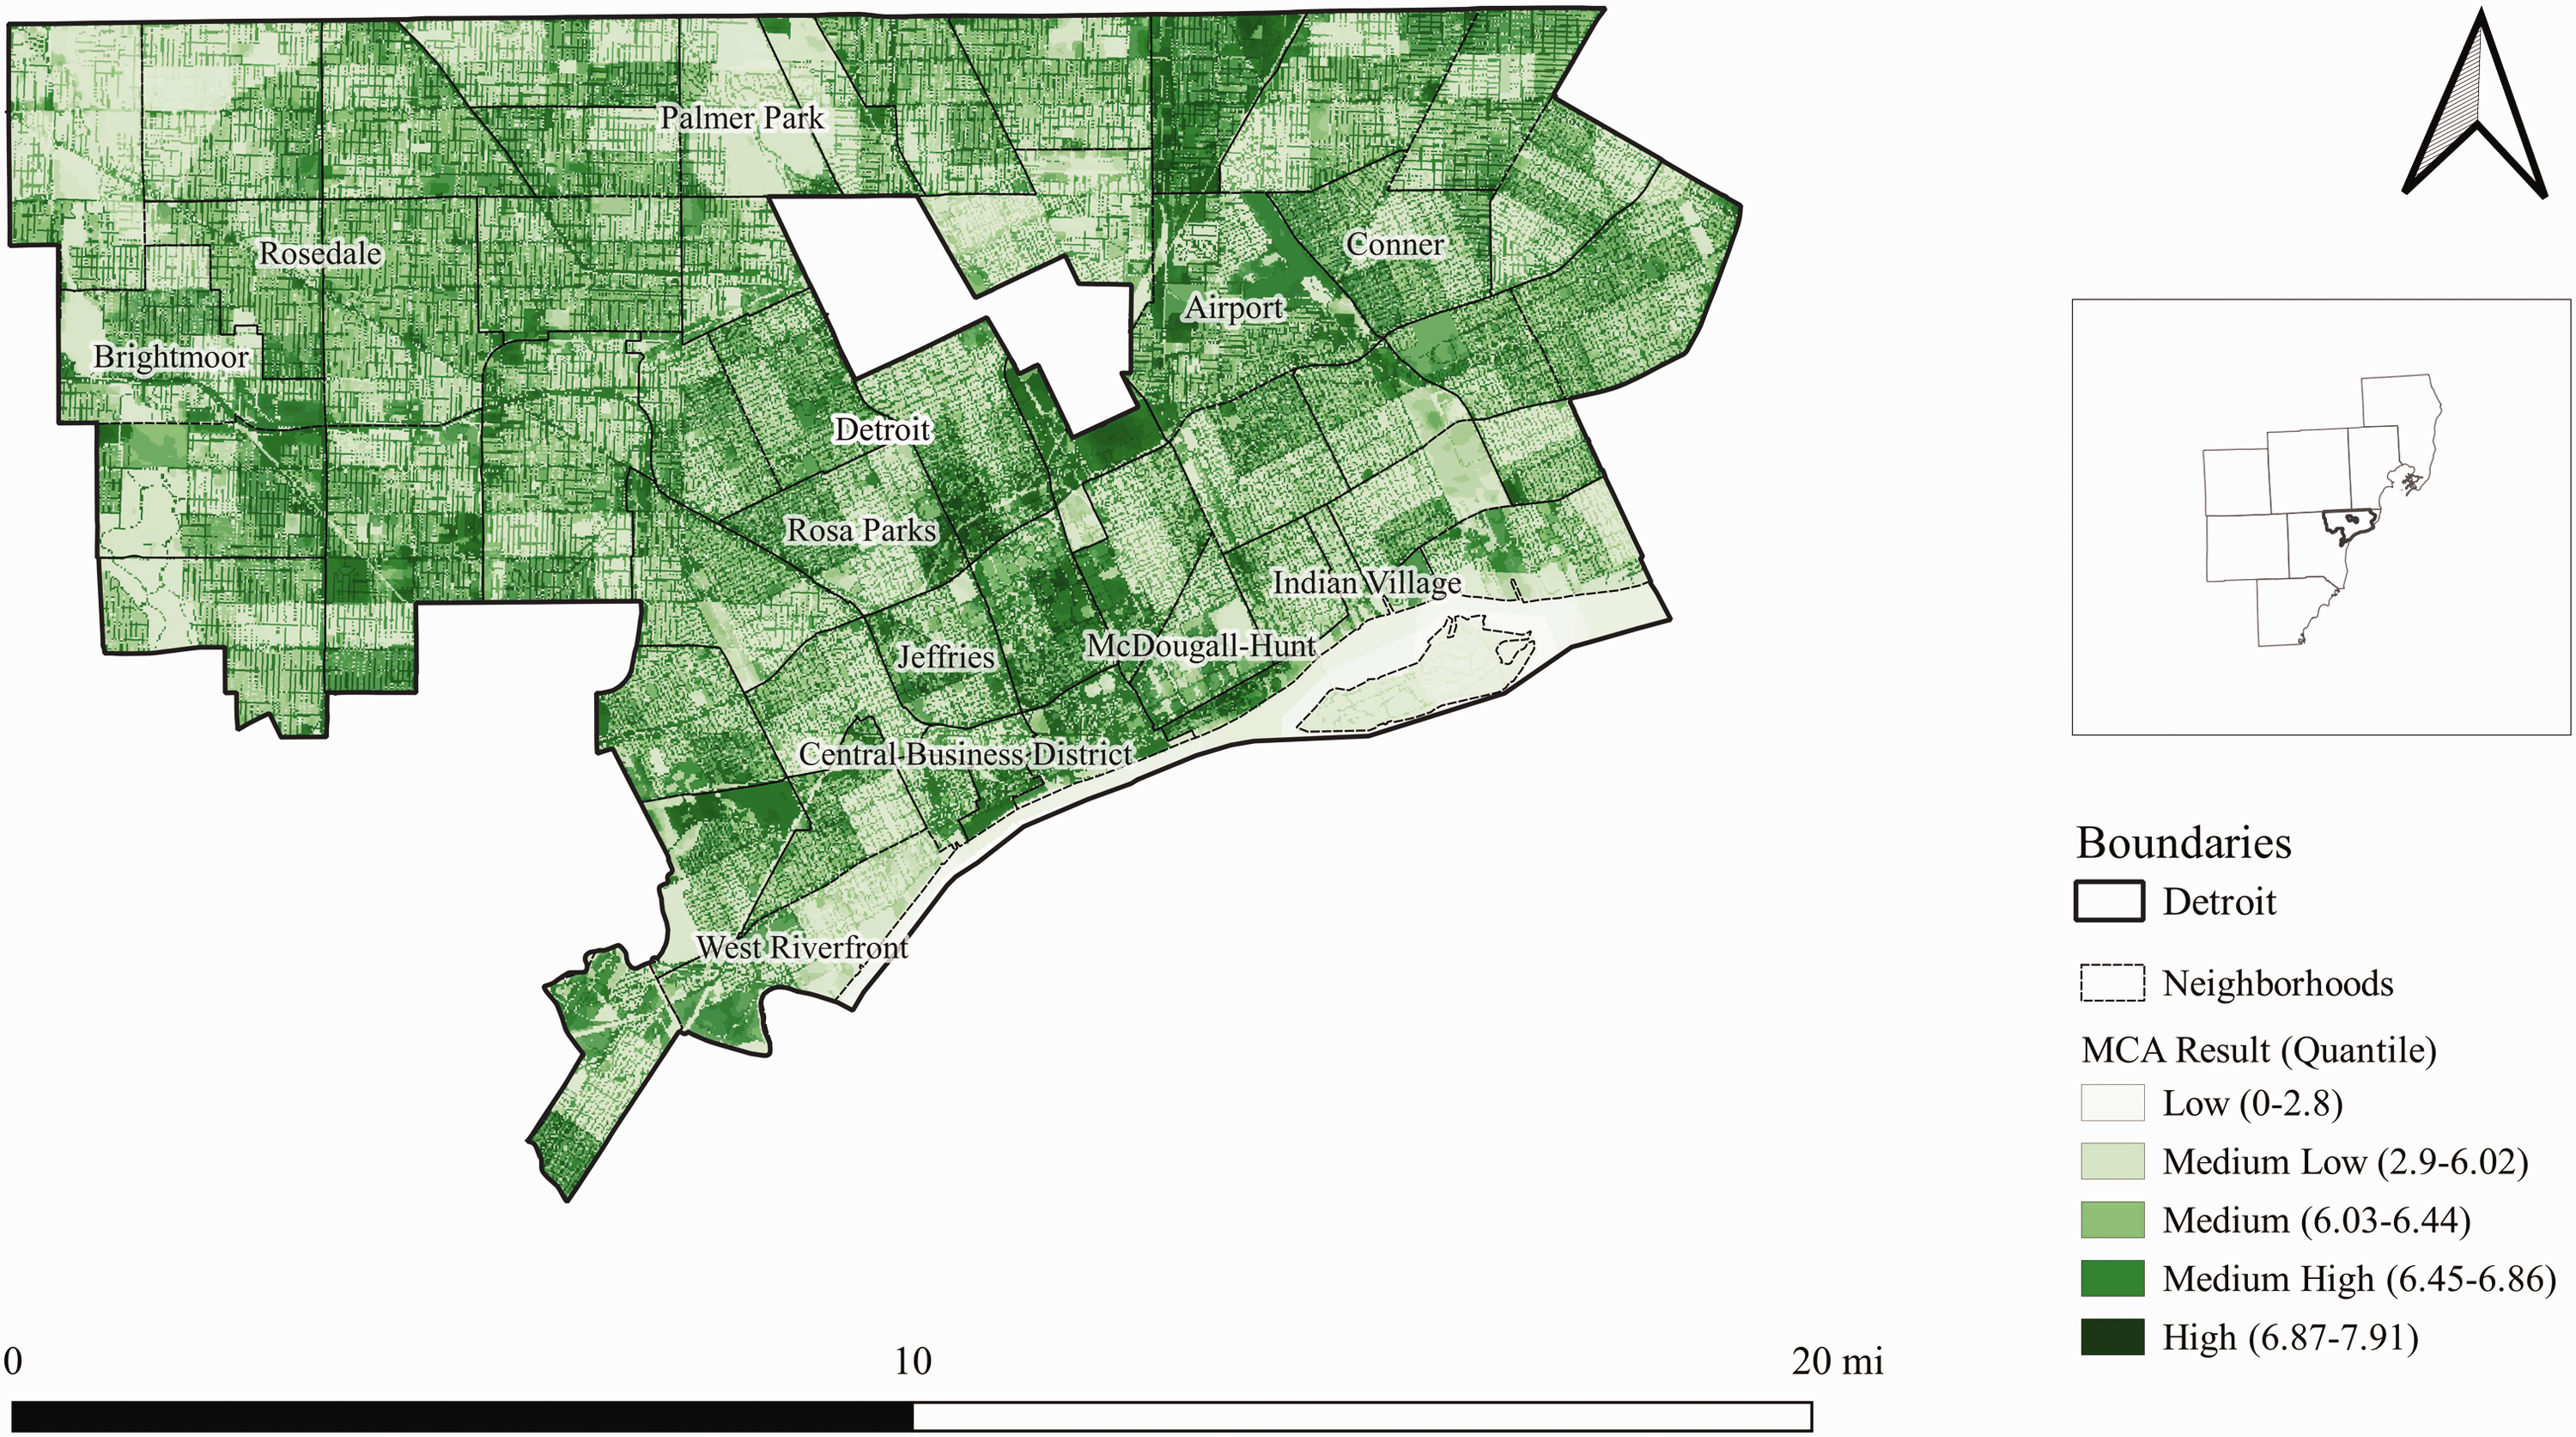
Detroit’s green infrastructure priority map.
Detroit reforestation initiative case
The first case study is set in Detroit, the largest city in Michigan with a 2010 population of 713,777 (2010 Census) and an area of 142.9 sq. miles. We collaborated with the DRI to create a city-wide suitability map for future tree planting, which integrates the MCA analysis and DRI’s six priority planting strategies. Launched in 2016, DRI includes representatives of the City of Detroit, the NGOs American Forests and Detroit Future City, and other stakeholders. The group aims to promote and coordinate tree planting activities by the participating stakeholders. Our case study supports this group’s work to provide technical assistance to the City of Detroit, which had identified six priority tree planting strategies: Neighborhood tree canopy: this criterion prioritizes neighborhoods with low tree canopy, high population density and vulnerable populations. Vegetative buffers: it prioritizes residential areas or schools that are close to heavy traffic corridors. Land-based ventures: it prioritizes contiguous vacant lots with lower housing stock, as well as locations that are close to schools or training centers. Parks and greenways: it prioritizes low tree canopy areas close to parks and greenways. Commercial corridor plantings: it prioritizes targeted commercial, cultural or roadway improvement locations that have urban heat island effects. Low population areas: it prioritizes low future development potential areas that are close to areas of concern, flood areas, or outdoor recreation areas.
DRI was interested in adopting the MCA analysis in their site selection process for these specific tree planting strategies. Furthermore, the group aims to develop an interactive GIS tool that allows planners and stakeholders to customize their tree planting strategies by selecting different sets of variables and weightings. Together with the DRI team, we identified nine factors within four categories for city-wide raster layers: air quality (estimated PM 2.5, estimated ground-level ozone, traffic volume), social equity (low tree canopy, heat vulnerability index, heat island locations, distance to a park of any size), stormwater management (runoff from land use), and public health (asthma rate). These factors are described in detail in the supplemental material. Next, these factors were loaded into the ArcGIS Pro Suitability Modeler tool for use by diverse city stakeholders within different planning contexts. Unlike the following case, DRI stressed the importance of tailoring the weights for each project application. Figure 5 shows a preview of DRI running suitability modeler while using the nine factors.
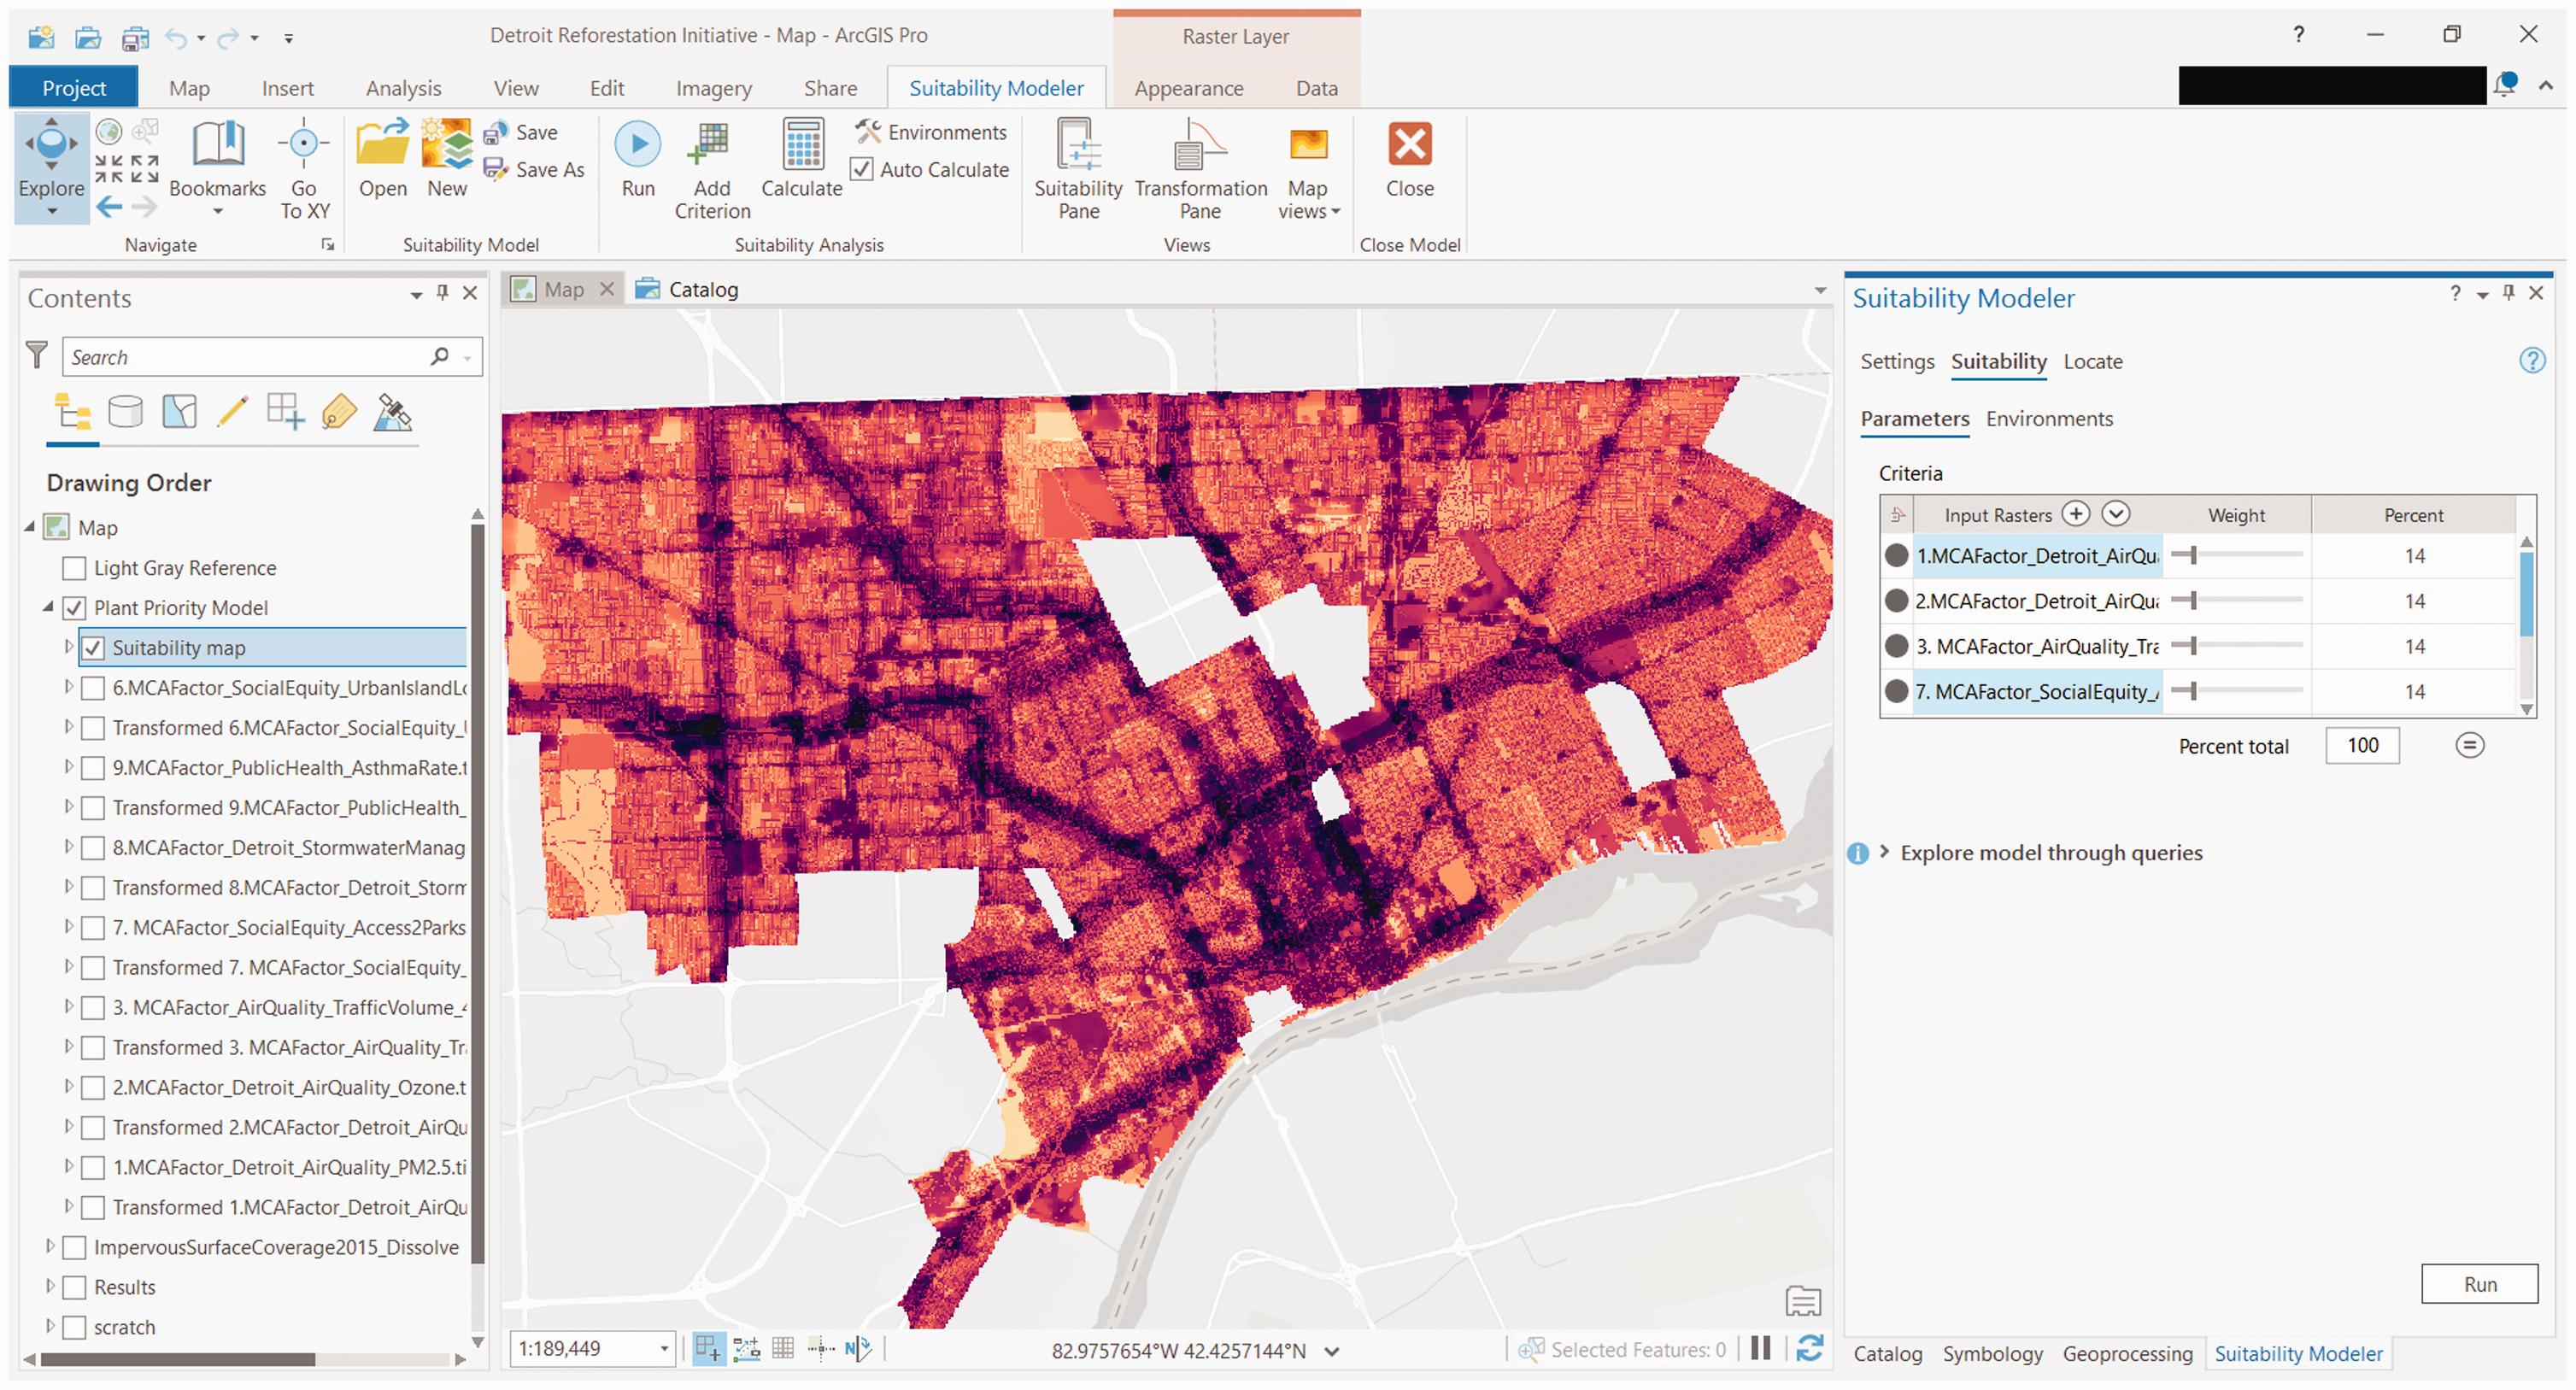
DRI’s green infrastructure priority analysis implementation in ArcGIS Pro Suitability Modeler.
Washtenaw county case
In the second case study, we collaborated with the WCPARC and conducted the MCA analysis to identify forest conservation priorities in Washtenaw County. Washtenaw County covers 722 sq. miles, encompassing rural and agricultural land, as well as the cities of Ann Arbor, Chelsea, Dexter, Milan, Saline, and Ypsilanti. As of the 2010 Census, its population was 344,791. The NAPP was established by the Washtenaw County Board of Commissioners in 2000 to use dedicated tax revenues to purchase lands with special ecological, recreational, and educational benefits to ensure their preservation and promote public uses and participation. WCPARC manages the program by reviewing lands nominated by local landowners, as well as identifying and caring for lands that meet NAPP’s standards. They hope to integrate the MCA analysis to conduct a site-by-site comparison for currently nominated lands, conservation lands, and recreation lands so that they can make evidence-based decisions on future forestation prioritization and incorporate the prioritization lists into their upcoming land management plan. Conservation lands refer to conservation easements in private ownership, whereas recreation lands are County-owned nature preserves. Additionally, the MCA analysis’s flexible weighting method provides the opportunity for including stakeholder involvement in their decisions.
For this case study, following the specifications of our collaborators we focused on only three types of properties within the county: (1) WCPARC conservation lands (N = 21); (2) WCPARC preserved recreation lands (N = 33); and (3) inactive nominated lands, which means the property has been turned away from the program, the landowner has withdrawn the application, or the landowner has declined to move forward (N = 107). To include stakeholder involvement, WCPARC invited a park planner who coordinates the acquisition and a stewardship manager to weigh six MCA factors by importance (the cumulative weight is 100) for our analysis, resulting in the following weights: Stormwater Management (25%), Urban Heat Island (10%), Social Vulnerability (10%), Habitat Connectivity (25%), Access to Green Space (10%), and Air Quality (20%). We conducted the MCA analysis based on the regional factors using the new weights. The final result generates a prioritization map of the properties (Figure 6), and top-five lists highlighting properties with the highest MCA score for each land property type (Table S4).
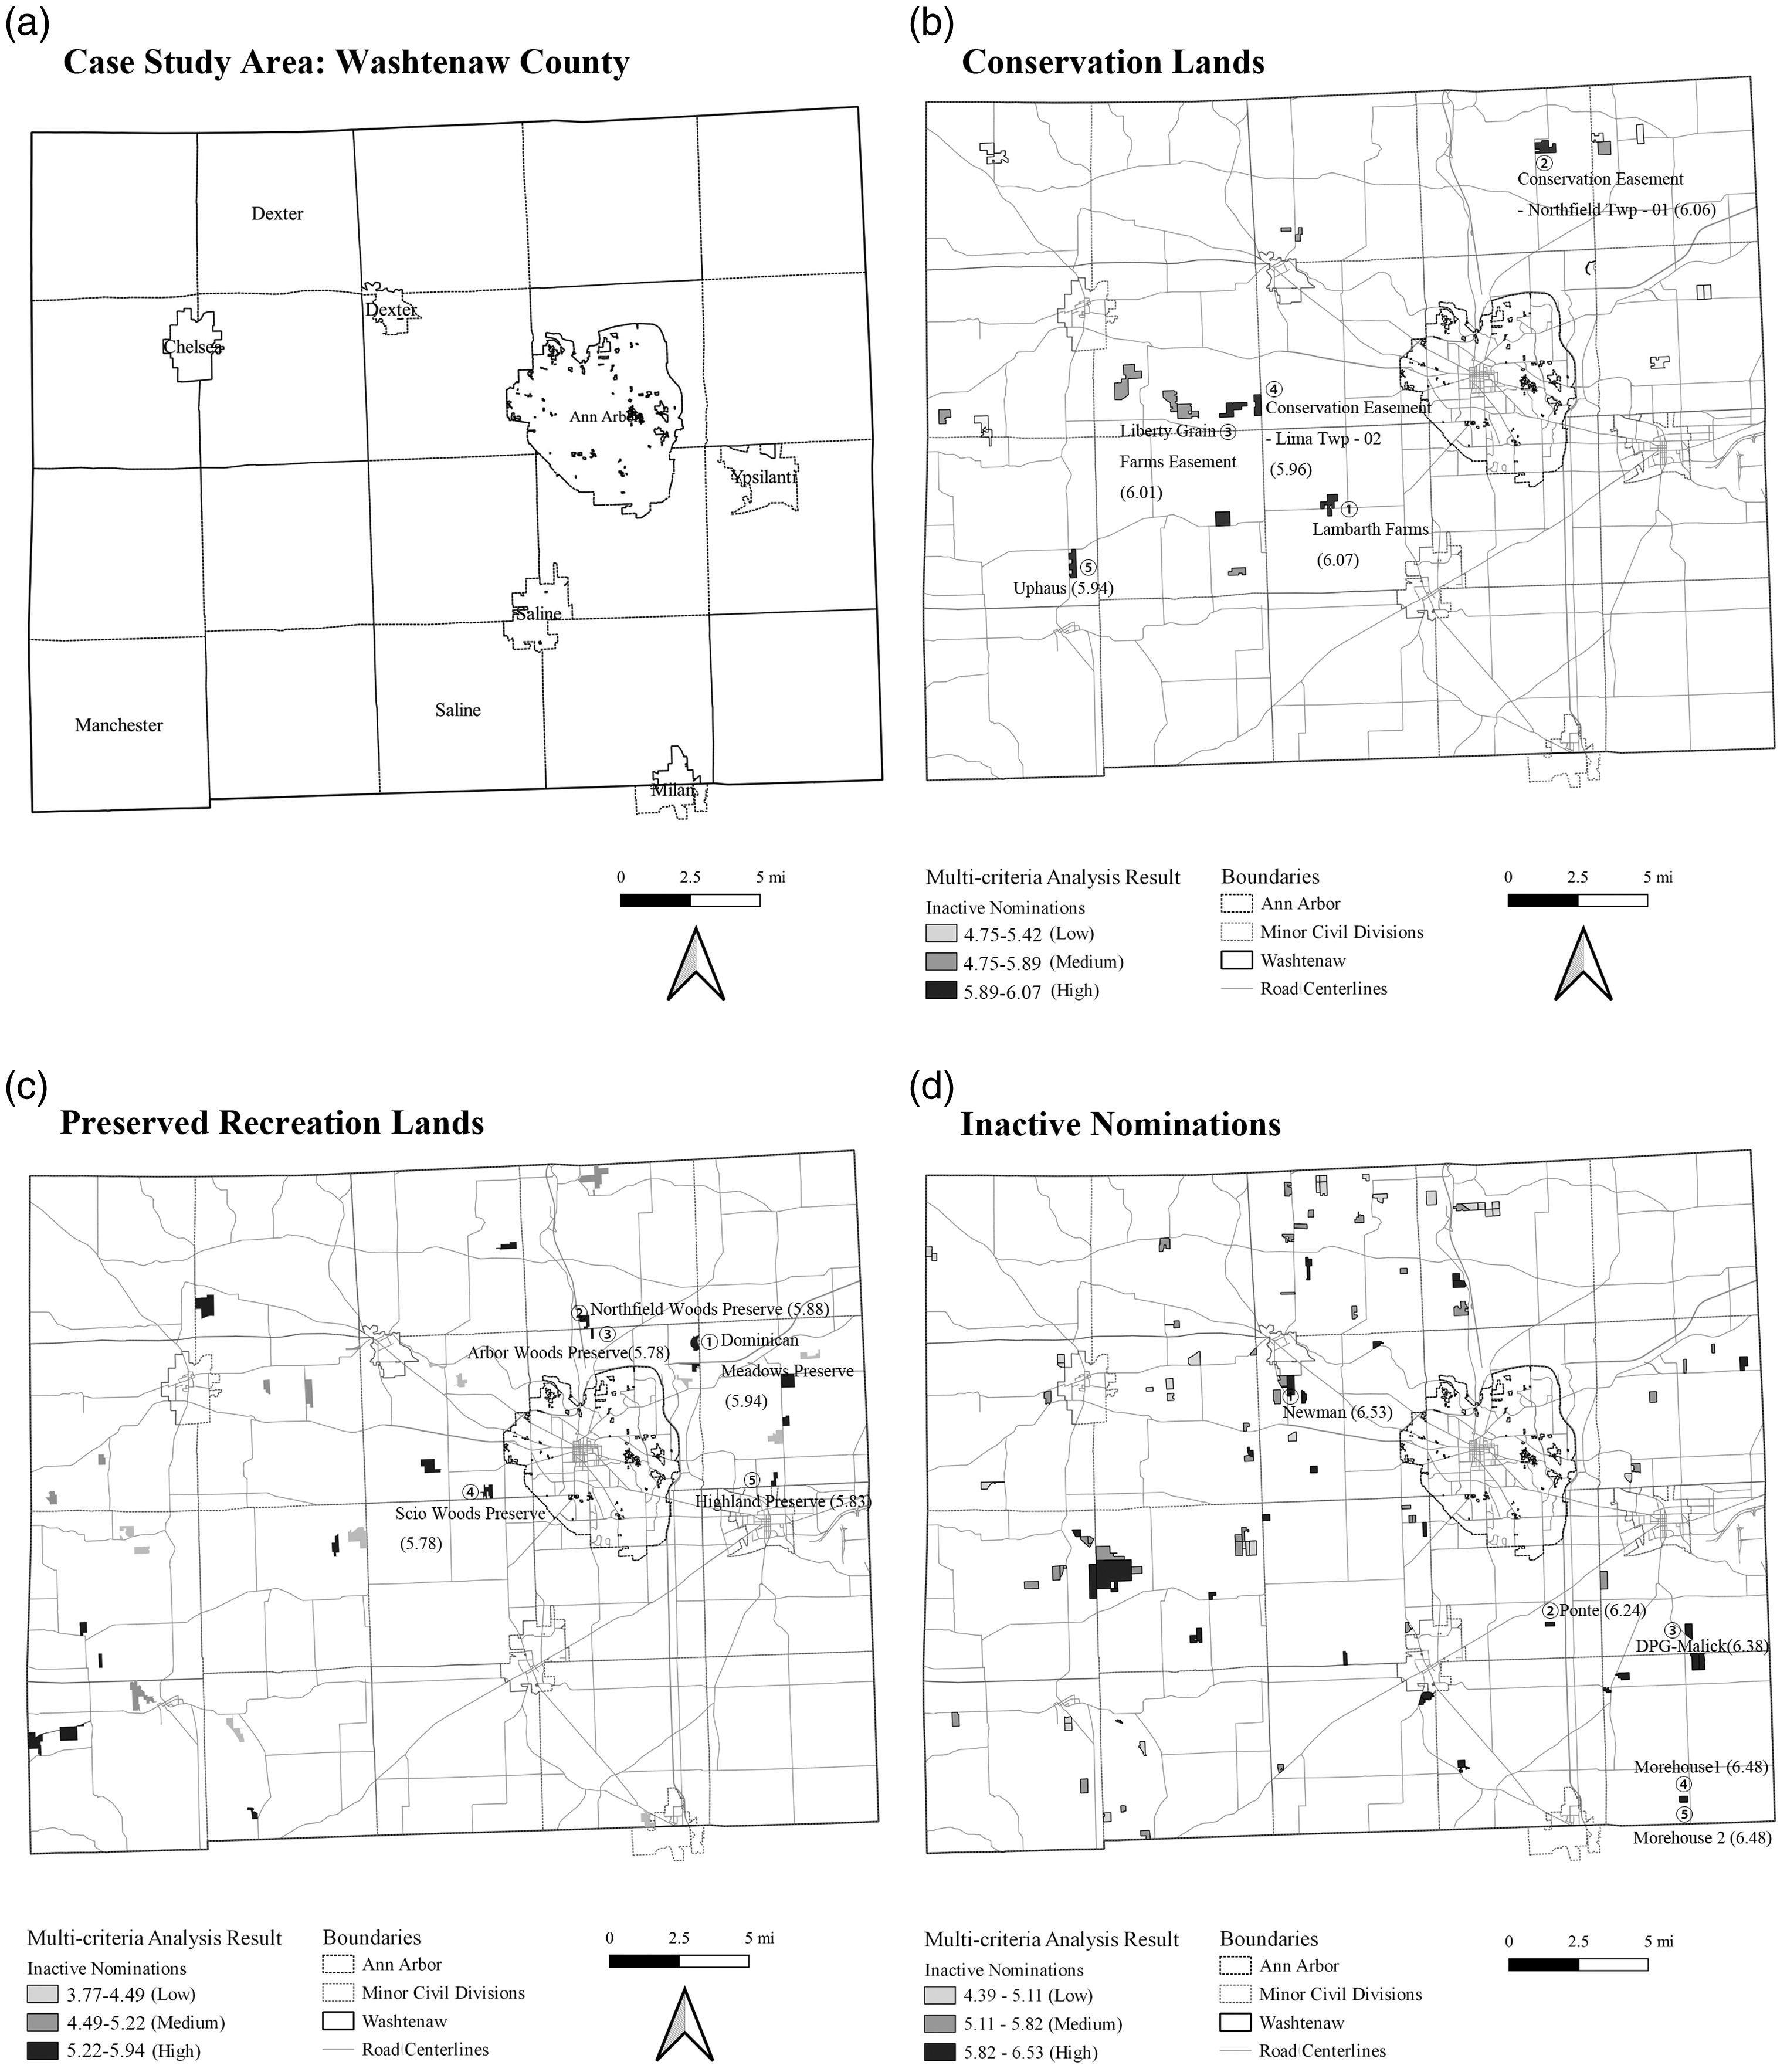
Analysis results for Washtenaw county case.
MCA results for Washtenaw county cases. Selected properties have been divided and shaded into three ranks (low, medium, and high) by equal counts based on their MCA score: the darker the shade, the higher the score, and the more urgent the need for tree planting or preservation. Image (a) highlights the case study area. Images (b), (c), and (d) show the analysis results for three types of land uses: conservation lands, preserved recreation lands, and inactive nominations, each of which has labeled five properties that have been scored the highest in their MCA analysis. The map has also labeled the top five properties with their MCA scores, as well as their names (for Recreation Lands and Conservation Lands) or their landowners’ names (for Inactive Nominations).
Discussion
This study has introduced a method within the spatial MCA tradition for planning green infrastructure, demonstrating its use at the regional, countywide, and city scales. Our method has several advantages over existing green infrastructure planning approaches. First, it provides a spatial prioritization lacking from other methods, which as we demonstrate can be used to rank parcels (Washtenaw County), or identify suitable sub-neighborhood areas for various green infrastructure typologies (City of Detroit). Second, our MCA combines social and environmental benefits, allowing for greater collaboration and support for green infrastructure across functional domains, such as stormwater engineering or public health who may not traditionally see their work as related to landscape characteristics. Third, we demonstrate how GIS can be used to conduct such a multi-scalar analysis.
The embedded case studies reveal nuances in the use and application of the method. When applied to the City of Detroit, there was great interest in ensuring the variables representing social vulnerability that had been empirically validated, and aligned with social vulnerability variables used in a recently adopted Sustainability Action Agenda (City of Detroit Office of Sustainability, 2019). In addition, City of Detroit stakeholders stressed the importance of using tailored weights for different applications, deciding it would not be appropriate to conduct one analysis using a fixed set of weights. The Washtenaw County case revealed the method identified parcels which were already heavily forested, as well as some which did not contain forests but instead were candidates for reforestation. The planning interpretation is that the former identified priority sites for stewardship activities, whereas the latter identified sites for reforestation. In both cases, although stakeholders worked for organizations with some GIS capacity, each benefited from the data and technical expertise of the research team, and therefore we suggest the development of planning support systems (PSS) such as the City of Detroit’s use of a commercial software suitability modeling tool to institutionalize the method for ongoing use.
The MCA method is inherently flexible and robust in settings with multiple conflicting perspectives, as it allows for their incorporation into a single analysis, thereby supporting collaborative planning (Mendoza and Martins, 2006). We think this method can be extended into professional practice in several ways. One trend is similar to what Young (2011) did in their study by involving a greater number of stakeholders in the analysis. A collaborative process centered on the development and use of this method could result in an analysis where the factors, weights, and application were tailored to local priorities, ultimately resulting in a spatially nuanced yet scientifically defensible plan. Another trend is demonstrated by Tree Equity Score, an online tool that provides analytical support for green infrastructure planning to users with minimal input data required. Following this approach to professional practice, an organization could spearhead the creation of a dynamic, web-based tool incorporating our MCA method for use by diverse stakeholders to understand regional patterns and propose their own plans. However, outside of a structure of a discrete planning or decision-making process, such tools are often neglected by potential users for a variety of reasons.
Substantively, the MCA method we present here is not specific to Southeast Michigan and is based on a widely tested framework with accepted concepts and accessible data sources that mean it could be readily translated to other regions (see Malczewski, 2006). The only factor that is not based on public primary data is our connectivity map, which relies on data resulting from prior remote sensing analysis in the study region (Gounaridis et al., 2020). Planners elsewhere would need to investigate the availability of similar fine-grain data, or other available land cover data that are available at various scales. Another caveat may be that some aspects of the analysis, such as the focus on stormwater management and the role of trees, may need to be tailored for use in cities with extremely dry climates. Outside of the US, the primary challenge to applying the method would be the availability of local data. However, the flexibility of the MCA method and its underlying raster data structure means the method can be adapted to many different settings, even those where property and land use data are unreliable or unavailable.
Our spatial MCA for green infrastructure planning does have limitations. Aside from the usual limitations of data quality and access, the fundamental logic of MCA is one of prioritization, not necessarily matching suitable GI typologies with these locations. Indeed, in the Detroit case study, local planners are constructing a secondary analysis tool to make parcel-level decisions based on land use, detailed proximity, and other information. MCA differs from other conservation tools such as Marxan, which can construct areas based on trade-offs between area quality and costs. In that sense, our spatial MCA also lacks analytic richness, e.g., to quantify the differential stormwater benefits based on location within watersheds or soil types, both of which necessitate much more detailed modeling tools and approaches. Finally, additional factors could be included to better represent the benefits of green infrastructure. One that we did not include but could be added is a measure of economic benefits, since as we observed there are empirical relationships between property values and the presence of trees. In addition, green infrastructure may be associated with other forms of economic benefits, such as enhanced vitality of commercial districts. We have decided to omit this measure due to the difficulty of representing this benefit spatially, and also because it may be mediated through diverse local tastes and preferences for natural areas. Overall, the spatial MCA for green infrastructure strikes a balance between analytical rigor, spatial detail, and stakeholder understandability making it well suited to professional planning contexts.
Conclusion
In recent years there has been a growing interest in the topic of green infrastructure, due to its demonstrated link with important social and environmental benefits and growing evidence of the potential for green infrastructure planning to realize concrete benefits for communities. This article reports an extension and improvement of the method proposed by Meerow and Newell (2017) for green infrastructure planning. Like all technical methods it requires a degree of data access and GIS skills, but we have commented on various ways practitioners interested in applying this method to their project, such as through partnerships with academics, the development and use of PSS, and consultant support. Although not a focus of this article, we agree with Ellen et al.’s (2016) assessment that to be effective for planning, methods must be not only technically sound, but also conducive for practice through their transparency, participatory, comprehensive, and scenario-driven qualities. Scholars have argued that due to the nature of its goals, green infrastructure planning must also not only respect the multifunctional nature of infrastructure, but also pursue connectivity, integration, a communicative and socially inclusive process, and focus on a long-term strategy (Pauleit, 2011). Although not shown here, the prioritization maps resulting from the case studies can be easily used to construct GI scenarios, proposing alternative locations, types, and arrangements of GI interventions.
With the effects of climate change predicted to intensify in future years, the importance of mitigating urban heat island effects and managing increasing precipitation will only increase. Methods alone cannot overcome long standing political and cultural challenges facing urban greening, but they can support more intelligent planning and decision-making by communities once a commitment to improving urban environments is made. Indeed, we hope the accessible and visual nature of the resulting MCA maps can foster consensus-building activities by diverse stakeholders at different scales to catalyze further action our cities need.
Supplemental Material
sj-pdf-1-epb-10.1177_23998083211033610 - Supplemental material for A regional spatial planning model for multifunctional green infrastructure
Supplemental material, sj-pdf-1-epb-10.1177_23998083211033610 for A regional spatial planning model for multifunctional green infrastructure by Robert Goodspeed, Ruoshui Liu, Dimitrios Gounaridis, Camilla Lizundia and Joshua Newell in Environment and Planning B: Urban Analytics and City Science
Footnotes
Acknowledgments
For the Detroit Case, we wish to thank the entire Detroit Reforestation Initiative, especially Eric Candela at American Forests, Susan Rusinowski at Detroit Future City, and Dan Rieden, Thomas Quintero, and Thomas Veldman at the City of Detroit. The Washtenaw County Case was made possible with the assistance of Rosie Donaldson and Allison Krueger. The work builds on prior analysis that benefited from data and feedback provided by Katherine Grantham and Kelly Karll at SEMCOG.
Declaration of conflicting interests
The author(s) declared no potential conflicts of interest with respect to the research, authorship, and/or publication of this article.
Funding
The author(s) disclosed receipt of the following financial support for the research, authorship, and/or publication of this article: The project received support from the USFS/SEAS McIntire-Stennis Research Program 2019 (Project No.19-PAF02996).
Supplemental material
Supplemental material for this article is available online.
References
Supplementary Material
Please find the following supplemental material available below.
For Open Access articles published under a Creative Commons License, all supplemental material carries the same license as the article it is associated with.
For non-Open Access articles published, all supplemental material carries a non-exclusive license, and permission requests for re-use of supplemental material or any part of supplemental material shall be sent directly to the copyright owner as specified in the copyright notice associated with the article.