
Abstract
For the establishment of precise disaster prevention measures in response to the Nankai megathrust earthquakes predicted to occur in the future, it is necessary to conduct numerous earthquake simulations and evaluate the vulnerability of the urban environment quantitatively. This vulnerability is evaluated on the basis of factors such as the extent of damage from earthquakes, as well as the attributes of residents, urban infrastructure, and systems in the environment. In this study, we propose a sparse modeling (SpM)-based technique for the evaluation of potential damage to urban environments due to Nankai megathrust earthquakes in Japan. As explanatory variables, any variables related to urban environments in Kochi Prefecture are considered. The results show that, unlike the so-called “complex disaster” events, the number of critical variables that characterize damage states when external disaster forces data (e.g. estimated seismic motion and tsunami height) and urban environment data are available is low, regardless of the magnitude of damage. In other words, urban system variables selected for damage states may be extracted as variables indicating vulnerability to earthquake damage. In addition, we evaluated the characteristics of different cities by visualizing the SpM results on a radar chart. The proposed technique is useful for gaining a deeper understanding of the influence of urban environment variables on earthquake damages. Furthermore, it is expected that measures for improving urban system resilience will be explored based on the proposed technique.
Introduction
Various estimates of damage from possible future earthquakes have been made by national and municipal governments in Japan to develop disaster prevention measures and improve disaster prevention awareness at local levels (Cabinet Office Japan, 2020; Tokyo Metropolitan Government, 2016). With the development of simulation technology using high-performance computing, both the estimation and prediction of property damage and casualties from earthquakes and tsunamis (known as complex disasters) are improving through the use of big data from various urban environments (Hori et al., 2017; Koshimura, 2016; Song et al., 2016). Hori et al. (2017) and Ichimura et al. (2014) developed an integrated earthquake simulator (IES) that integrates structural response analysis and evacuation behavior. This is achieved using seismic intensity (SI) data supplied to a high-dimensional urban model in conjunction with precise big data from the urban environment. Imamura et al. (2012) performed comprehensive analyses for tsunami disaster mitigation using the GIS platform and developed a dynamic approach using a multiagent paradigm in Padang City, Indonesia. Osaragi and Oki (2017) developed a comprehensive simulation model that integrates property damage and the wide-area evacuation activity of local residents in the event of a large earthquake. Wang (2020) simulated seismic damage using a statistical model under four spatial structure scenarios for Taichung, Taiwan, to determine whether compact development facilitates a seismic-resistant city. However, these studies are based exclusively on a small number of scenarios and do not fully utilize urban area big data. Damage estimates based on such a small number of scenarios can lead to shocks from unexpected damage. In addition, the relationship between damage and urban environments was not evaluated in these studies.
The vulnerability of urban environments to natural events exposes people to risks. In recent years, focus has been placed worldwide on the development of resilient cities that can handle natural events. For example, the United Nations Secretariat for International Strategy for Disaster Reduction (UNISDR) launched the “Making Cities Resilient 2030 (MCR2030)” campaign to identify and share expertise on urban disaster prevention and damage reduction (UNISDR, 2020). Several researchers have stressed the importance of quantifying resiliency on the basis of data related to urban environments and precise damage estimation (Cavallo and Ireland, 2014).
Various studies have been conducted with the objective of quantifying urban vulnerabilities and recoverability from specific variables, and multiple indexes have been proposed (Buckle et al., 2000; Jha et al., 2013; Rose, 2007). However, with the proposed indexes, it is difficult to consider a specific urban environment to implement disaster prevention measures because they are only evaluated as indicators. Several of the proposed indexes are based on a few arbitrarily determined scenarios using statistical data rather than precise urban environment data (e.g. people flow and geo-big data). These problems can be solved through the use of observational and geo-big data to assess quantitatively the relationship between the damage estimation result and the urban environment.
In general, urban vulnerabilities are determined by many factors related to the urban environment, including the attributes of residents and urban infrastructures (Bruneau et al., 2003; Godschalk, 2003). Thus, urban system variables are represented using high-dimensional data, and when they are used as explanatory variables, it is very important to clarify the factors for determining urban damage (explained variables), i.e. the potential structural relationships between explanatory variables and explained variables. If this potential structural relationship is clarified, the variable set that characterizes damage states can be specified when data on external disaster forces (e.g., estimated seismic motion and tsunami height) and the urban environment are available. This would enable us to determine which urban environment element can efficiently promote robust city planning in a manner that contributes to improvements in both infrastructure and evacuation plans.
In this study, we attempt to solve these problems by assuming linearity in an urban system for a potential structure explaining earthquake damage. Specifically, we assume that earthquake damage can be estimated directly, and we represent the variables of urban environments ultimately attributable to damage as high-dimensional data. This is justified because the critical variables that characterize earthquake damage do not require all the variables of an urban system, but depend exclusively on a few (sparse) variables. To acquire critical variables accurately, removing the noise contained in urban data is also necessary based on appropriate criteria. This problem is equivalent to the process of finding effective explanatory variables for a machine-learning task, which is known as variable and subset selection (Beale et al., 1967; Miller, 1990). What is fundamentally required in variable selection is an exhaustive search in which all possible sets of explanatory variables are evaluated and compared to each other with respect to specific criteria, in addition to the need to use criteria such as cross-validation error (Garside, 1965). In the variable-selection problem, it is well known that the number of all possible variable subsets is 2N, considering whether each variable is selected or not, and this implies that the combinations of variables will be very large. Under these circumstances, sparse modeling (SpM) is an algorithm proposed to search optimally for all possible subsets where the number of elements is less than or equal to a specific integer K (Igarashi et al., 2017). In deep learning, which has garnered significant attention in recent years, the selection of this subset is a black box and cannot be found. In addition, the same variable-selection problem occurs in random forests and support vector machine (SVM); thus SpM must be applied to every machine-learning task. Therefore, in this study, we performed SpM for the extraction of critical sparse components from complex data.
In recent years, SpM and Bayesian inference have frequently been used in data-driven science. Since the late 2000s, they have been applied as innovative information extraction technology in diverse fields, including measurement engineering, applied engineering, and biochemistry. Igarashi et al. (2017) developed an SpM technique that can extract rules for hidden potential structures from high-dimensional data for tsunami sediments and nerve cells. They performed sparsification through compression sensing, which allowed the automatic extraction of an appropriately small number of explanatory variables from high-dimensional data, suggesting the possibility of finding essential structures that cannot be derived by arbitrary scientific reasoning. Therefore, if critical variables are selectable after identifying potential structural relationships in the estimation of earthquake damage, the resilience of the urban environment can be evaluated based on urban vulnerabilities.
Figure 1 illustrates the data, damage estimation, and evaluation of the urban environments approach proposed in this study. In the proposed approach, we decompose the prediction into two steps. First, we use several types of precise urban environment data and simulate earthquake damage in various scenarios. Thereafter, we estimate the maximum damage scenario from the results of these scenarios. Next, we use SpM to analyze the maximum damage and the urban system variable in each city. Finally, our model extracts the most important urban environment variable of the earthquake damage by visualizing it using a radar chart and identifying the characteristics of the region.
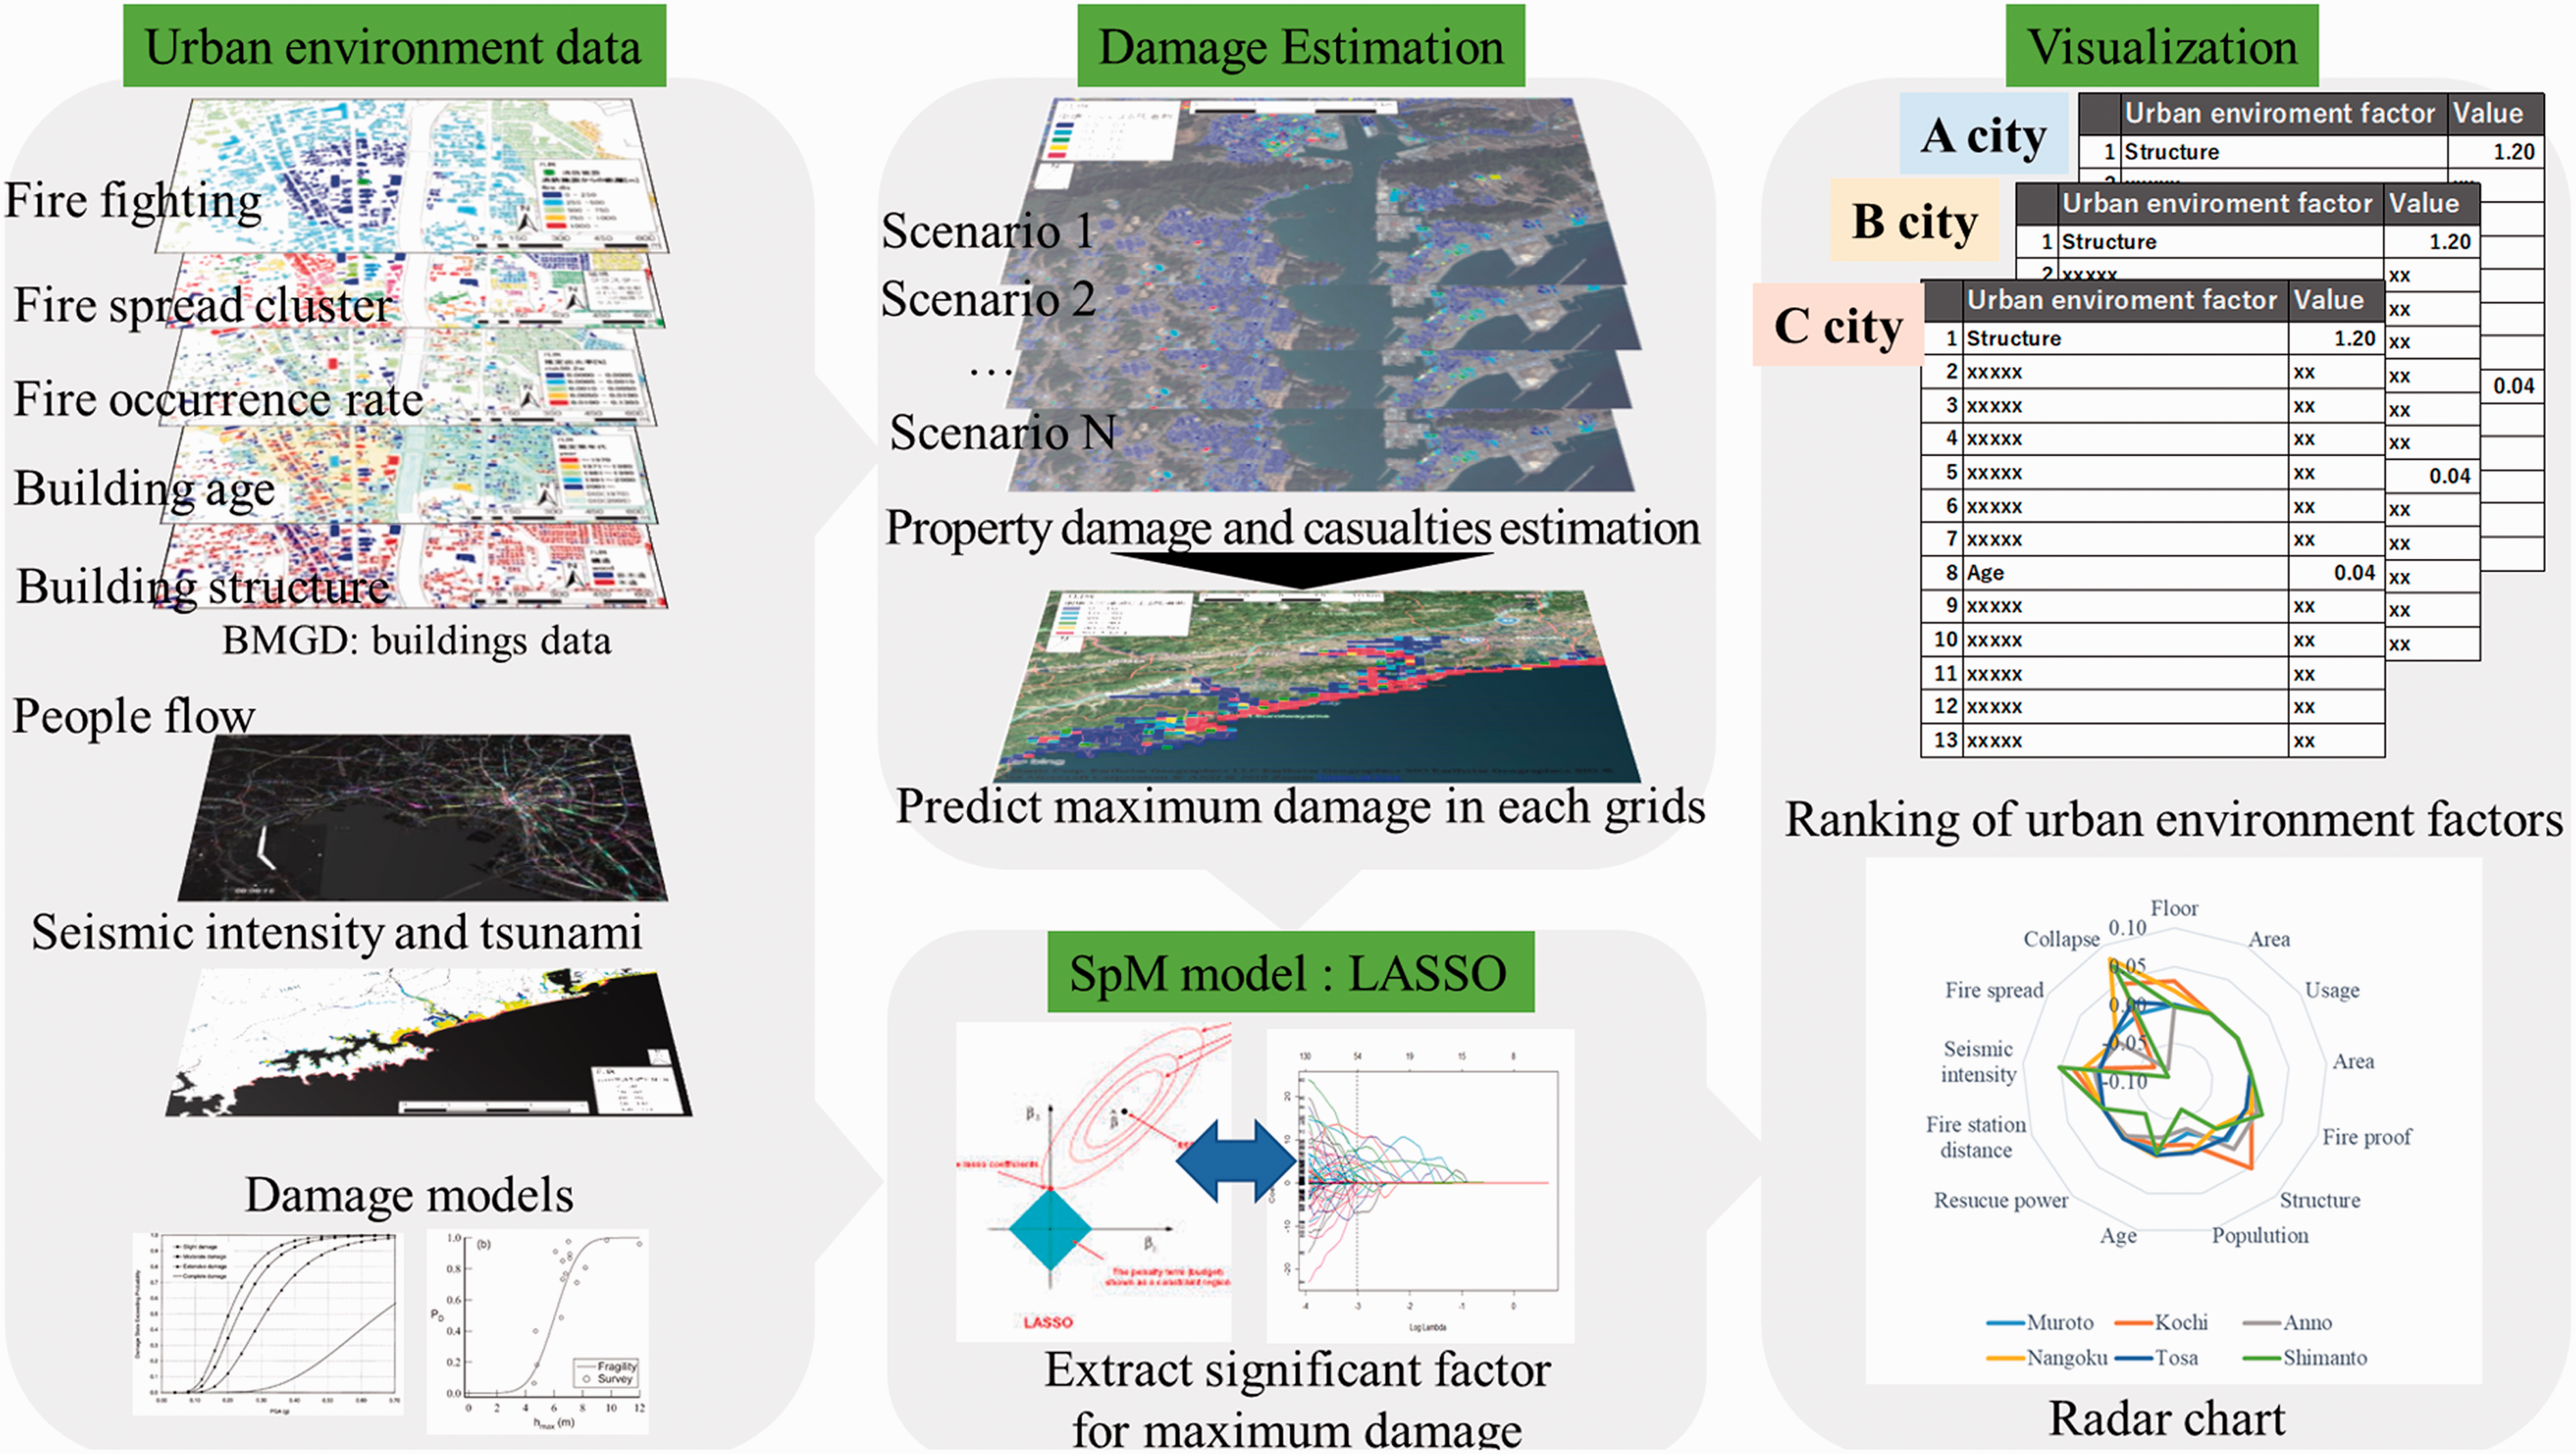
Overview of the proposed damage estimation approach.
The study makes the following contributions:
Damage estimation of approximately 30,000 scenarios integrating seismic intensity (SI), fire, and tsunamis using building micro geodata (BMGD), Pflow, and mobile phone GPS data as input hazards for the tsunami run-up, and the seismic motion results were simulated via a supercomputer. The scenarios included various event conditions. Consequently, we were able to clarify the distribution of possible damage and the maximum damage in each region by assuming numerous scenarios, which had not been possible before. Using the results of the damage simulation, we extracted the urban environment variables that indicate vulnerability for each region based on SpM, a state-of-the-art variable-selection method, and evaluated the potential vulnerable structures and urban environment variables. We further showed that SpM could facilitate the assessment of the importance of specific urban environment variables and estimation of the maximum damage with high accuracy.
Target area and dataset
Target area
We considered a Nankai Trough earthquake that is expected to occur in the near future (Hyodo et al., 2014). The Nankai Trough is a vigorous subduction zone where strong earthquakes have been recorded with a recurrence period of 100–200 years and estimated magnitudes of more than Mw.9.0. The target area is Kochi Prefecture (the largest city in the Shikoku region) in Japan, where the Nankai Trough earthquake is expected to exhibit strong effects. Kochi Prefecture is predicted to be a major disaster area of the Nankai Trough earthquake.
Dataset
Seismic intensity data and tsunami inundation data
The seismic intensity (SI) is used as an index to measure the strength of the external force of earthquakes. The SI index varies from 1 (very small) to 7 (extreme shock), with 0.1 increments, as described by the Japan Meteorological Agency. The SI is estimated from the acceleration caused by previous earthquakes; each 250 m grid unit of a region is given an SI value. Note that the SI is different from the magnitude, which is only observed at the epicenter. Kochi City is predicted to experience the largest SI of 7.0 during the future Nankai Trough earthquake. SI data can be downloaded from the “Japan Seismic Hazard Information Station” published by the National Research Institute for Earth Science and Disaster Resilience (NIED). Figure 2(a) shows the SI data in Kochi Prefecture used in this study.
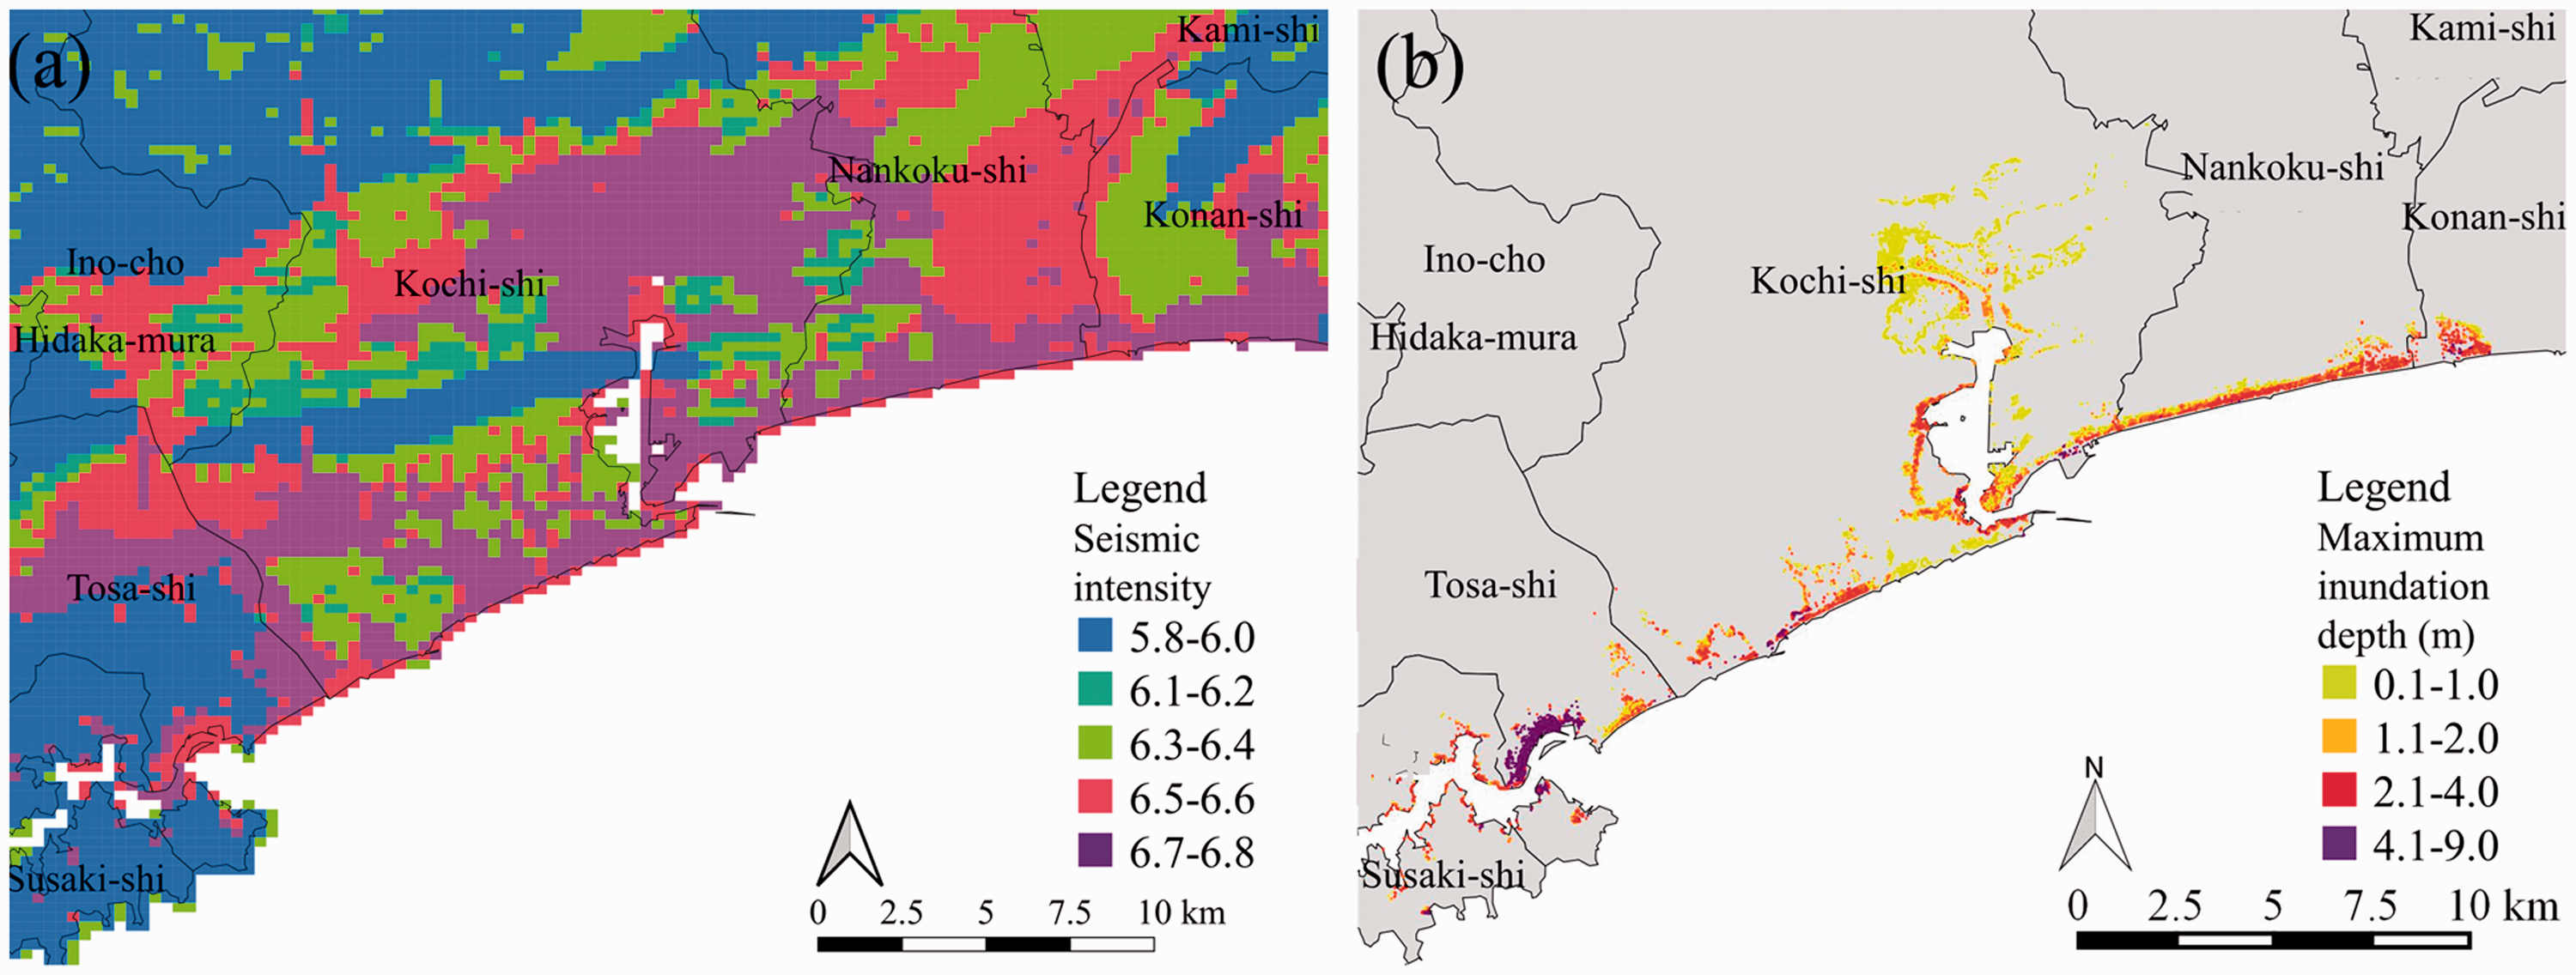
Spatial distribution of the estimated SI and tsunami inundation depth during the Nankai Trough earthquake. (a) SI data for each 250 m grid unit and (b) estimated tsunami inundation depth for each 10 m grid unit.
The tsunami inundation data used in the simulation were provided by Tohoku University using a supercomputer. These data were obtained under the assumption that a tsunami will occur during the Nankai Trough earthquake (Figure 2(b)). Supplemental Table S1 summarizes the data on the tsunami inundation simulation model. These data consider a 10 m grid unit for 180 min (30 s interval over 360 scenes) after the disaster.
Building micro geodata
First, we used approximately 153,000 building polygons in Kochi City based on the digital residential map provided by Zenrin Co., Ltd. Building micro geodata (BMGD) can be used to monitor the spatial distribution of all buildings in Japan by creating point data based on the centroid of each polygon provided by Akiyama and Ogawa (2019). The BMGD dataset contains information on the longitude and latitude of the building centroid, area, number of floors, and building use (detached house, detached office, multiuse building, landmarks, etc.). In addition, it includes the fire resistance performance (fireproof, semi-fireproof, and fire prevention), structure (wooden and non-wooden buildings), and construction period (before 1981, between 1982 and 2000, and after 2001) of each building. By spatially joining BMGD, hazard data SI, and tsunamis according to the nearest longitude and latitude, we can estimate earthquake damage.
Mobile phone location data
Real data should be used for modeling the initial spatial distribution of people in a city to predict human casualties during an earthquake or tsunami. In this study, we used data from 2011 mobile phone GPS logs called “Congestion Analysis®,” provided by Zenrin Data Com Co., Ltd. “Konzatsu-Tokei (R)” data are people-flow data collected by individual location data sent from mobile phones with the AUTO-GPS function enabled with the users’ consent, through the “docomo map navi” service provided by NTT DOCOMO, Inc. These data were processed collectively and statistically to conceal private information. This is a large database comprising text data from approximately nine billion records belonging to approximately 1.5 million users throughout Japan. We used data from 2012, and the target sample included data for approximately 50,000 people.
The GPS data from NTT DOCOMO, Inc. were processed. However, as mobile phone GPS can only acquire observation times and latitudinal and longitudinal data, we still needed to estimate transportation mode and demographic attributes (age and sex). In this study, we analyzed big data that transform mobile phone GPS data into people distribution data, which then reveal people flow for a population with several demographics (i.e. age and sex) considering Kochi City (see the details of the people-flow data section in Supplemental material). We developed a GPS data-mining method to determine the urban flow of people at any given time, thereby quantifying the spatial distribution of people flow (Figure S1). For spatial joining of people-flow data with building and hazard data, stay points join with building data as a point of interest (POI) and flow data join with only hazard data based on longitude and latitude. People data are identified by unique codes including building and hazard information in each time frame.
Estimation of property damage and human damage during a strong earthquake
Estimation of property damage
The property damage and human damage simulator consists of the simulation model created by integrating three sub-models: (a) a property damage model (damage attributable to SI, fire, and tsunami), (b) a model of casualties (damage attributable to SI, fire, and tsunami), and (c) a rescue activity model. The damage estimation method is described in detail below.
To estimate the building damage due to fire, we clarified the type of industry in each building by using BMGD and provided a fire probability corresponding to the type of business. Finally, we assigned the fire probability from the predicted ground motion and building type.
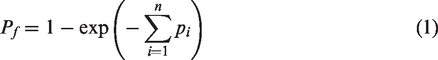
The fire-spread probability of the buildings was calculated using the method proposed by Kato et al. (2008). Further, the clusters of fire spread were calculated from the distance between buildings and the fire performances. The burn down probability Pf of each cluster of fire spread is calculated as follows
Next, the probability of building damage due to the SI is defined using fragility curves as an expression of the relations between the SI and the building damage. The ground motion is obtained from the SI through probabilistic seismic hazard analysis. Based on the study of Yamazaki and Murao (2000), we used wood frame and non-wood frame structures considering the construction period.
For the SI with strong motion index, the cumulative probability Pr (SI) of the occurrence of damage equal or higher than rank R is assumed to be lognormal, as expressed as follows

The probability of building damage due to tsunamis is defined using the fragility curves as an expression of the relations between the maximum inundation depth (MID) and the building damage. The model of Suppasri et al. (2013) considers structures and inundation depth. The cumulative probability Pt (MID) of the occurrence of damage equal or higher than rank R is assumed to be lognormal

Estimation of casualties due to fire, building collapse, and tsunami
For casualty risk evaluation, it is assumed that death is caused by a fire, tsunami, or a collapse in each building unit in each time frame. The calculation unit, based on each building, applies to the number of people staying in a building during the disaster. With the proposed method, the casualty risk is evaluated according to the death rate with burnout probability and the number of residents in the building. A death to fire ratio (deaths/fire) of 0.046 was used (Central Disaster Prevention Council, 2012). The evaluation of the risk of casualties due to building collapse uses the death rate with the building damage ratio and the number of residents in the building. According to the number of casualties per collapsed building for past earthquakes, the death to collapse ratio is 0.68 in wooden buildings and 0.08 in non-wooden buildings.
For causalities due to tsunamis, the evaluation method reported by the Cabinet Office Central Disaster Prevention Council (2012) assumes that if evacuation cannot be completed during the tsunami arrival in the tsunami inundation area, the evacuee will perish in the tsunami (see Figures S2 and S3). The number of casualties is estimated using the evacuation speed considering the traffic mode, such as traveling by car or on foot. More details on the evaluation of causalities owing to tsunamis can be seen in the Supplemental material.
The final prediction of the casualties is performed by reviewing the estimation of the number of casualties due to each type of cause. This is necessary because, in the case of an earthquake disaster, collapse owing to shaking occurs first, followed by tsunamis and fires. Therefore, if a tsunami damages a building that has already been damaged by shaking, the damage is double-counted.
Maximum damage in each region
In the earthquake and tsunami countermeasures in Japan, the Japanese government assumes that earthquake hazards that occurred repeatedly in the past are likely to reoccur with similar hazards in the near future, and they are considered to be highly imminent. However, the 2011 Great East Japan Earthquake greatly exceeded this assumption and caused enormous damage. After this realization, the government issued an urgent proposal on 6 July 2011, on the concept of “Tsunami Disaster Prevention Community Planning.” Based on the recognition that there is no upper limit to disasters, this urgent proposal enacted a law that promotes the development of communities that are resistant to tsunami disasters by combining hardware (e.g. infrastructure) and software (e.g. evacuation plans) measures. Therefore, when considering disaster prevention measures and resilience evaluation, the maximum damage should be considered.
Accordingly, in this study, the maximum number of casualties for each area was determined considering the damage estimation results of many scenarios. Specifically, the damage estimation results were totaled for each 500 m grid unit, and the maximum damage from all scenarios used as the maximum damage of the mesh.
SpM analysis of urban environment and earthquake damage estimation
Viewpoint and method of analysis
In this section, we determine the type of urban environment variables attributed to differences in damages among areas quantitatively. We used SpM to construct shrinkage and selection operator (LASSO) models that describe the relationship between variables representing the local urban environment of each area and the simulation results as explained variables. For the LASSO regression analyses, we selected the urban environment variables by considering the statistical significance and logical consistency of the parameters. As the urban environment variables used for SpM were those used for the estimation of the damage from earthquakes, we focused on urban environment variables with large effects on the damage. A disaster prevention plan can be then implemented to improve these urban environment variables.
A linear model is used in the models described below because most of the building and human damage caused by earthquakes and tsunamis can be modeled using a fragility curve, which can be approximated by linear models. In this study, a linear model is used to model the relationship between urban variables and the magnitude of damage.
SpM: L1-regularization
For SpM, a least absolute LASSO method (Sato et al., 2004) was employed in which an inverse problem for
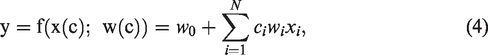

To determine λ and the urban variable

The MSE estimates the prediction error at certain λ and urban environment variables. Therefore, the optimal urban environment variables and factor can be determined by minimizing the MSE.
Experimental results
Data preprocessing and experimental setup
In our experiment, analysis and running of the simulation was performed on a PC running the Windows 10 operating system with a Core i9-9900K CPU, 128 GB RAM, and using Python and R connecting to an SQL database. Visualization tools of QGIS are used in this study.
To apply SpM, we estimated the casualty damage based on property damage in Kochi Prefecture. We selected urban data from Kochi Prefecture and analyzed more than 150,000 buildings and 300,000 people. The GPS records of these people for January, August, October, and December 2012 were utilized to compute their geographic distribution and develop flow-of-people data to set the initial conditions for damage simulation. Then, the casualties from property damage in 30,000 scenarios were estimated. Finally, the casualty results and urban data were utilized in SpM to identify the urban factors significant for earthquake damage.
Result of casualty estimation
In terms of regions, human damage is relatively large on the Pacific coast and the inland side of Urato Bay. The number of deaths varies from several hundreds to several thousands (more than 10 times) depending on the evacuation behavior. The number of casualties also appears to vary significantly depending on the assumed disaster time, owing to the different people movements (see Figure S4).
Figure 3 shows the maximum number of casualties in each area due to tsunami, collapse, and fire. In all coastal meshes, more than 100 deaths are estimated. This result shows that the worst scenario could cause severe damage. Comparing the results of many scenarios for each area, it was confirmed that there were areas where damage is likely to increase and areas where damage does not increase significantly. The factors causing these differences include the movement of people (e.g. people can easily gather on a daily basis in areas such as beaches and other tourist spots) and the tsunami arrival time and inundation depth. In addition, the building ratio and age of the building were found to affect the damage range. The current disaster occurrence time set for damage assessment by the Japanese government and local governments includes only daytime, nighttime, and morning in summer and winter, and only few scenarios are considered. For this reason, it was difficult to determine the distribution and range of damage with a sufficient number of scenarios, and there were no data that could be used to estimate the damage distribution.
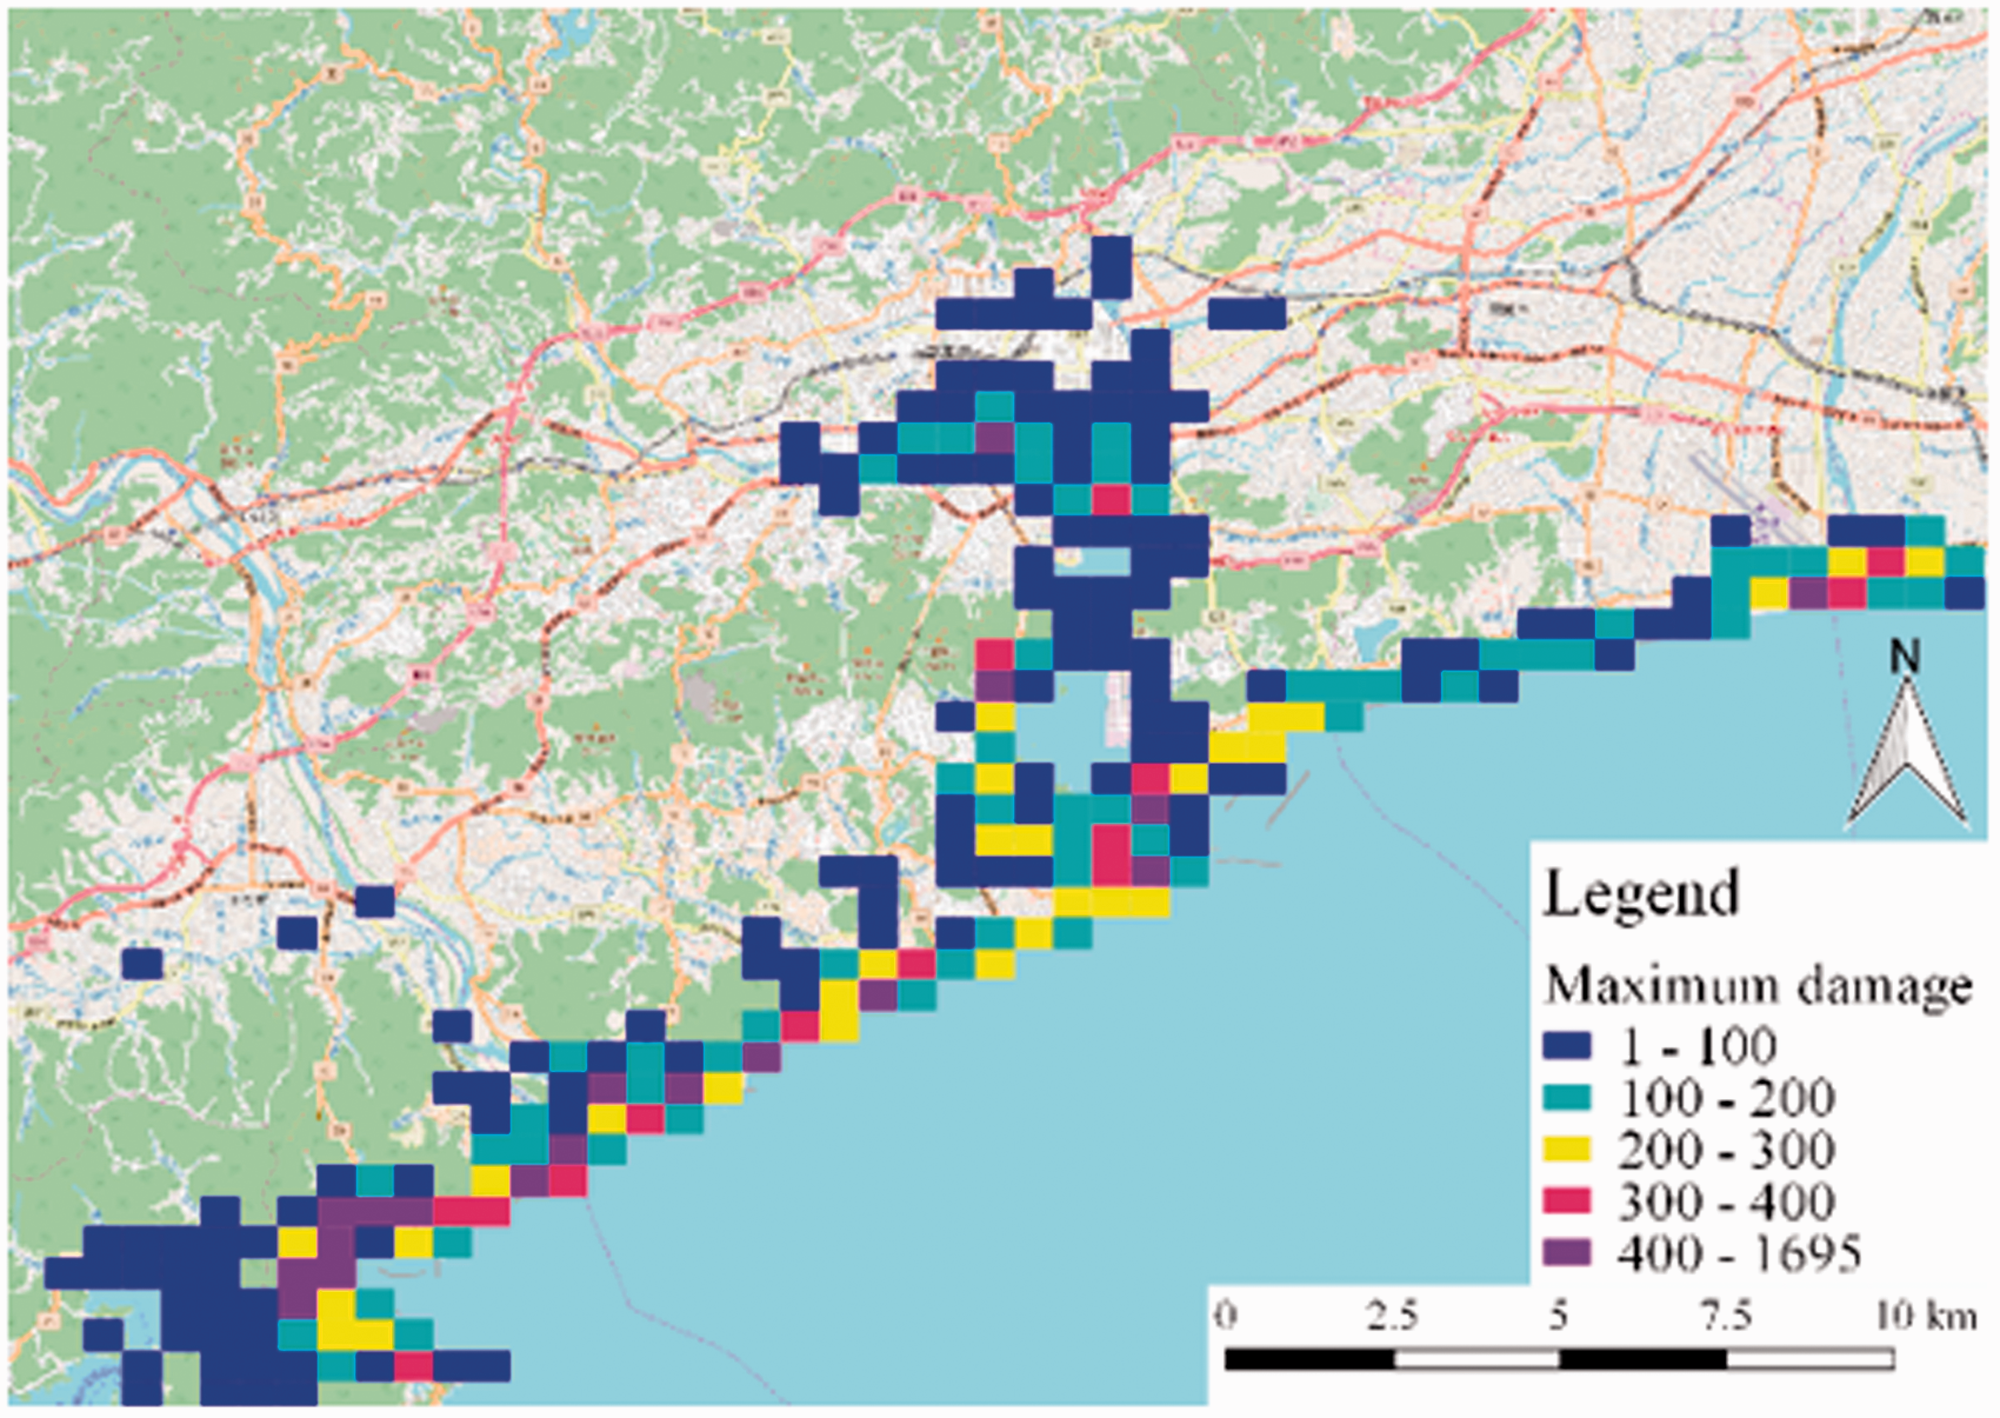
Number of maximum casualties due to integrated damages (aggregated to 500 m grid).
SpM result
We extracted the important urban variables using the entire target area (see Table S2). Figure 4 shows the relationship between the urban variable parameters and the SpM parameter λ. A total of 11 variables were selected. It can be observed that the parameter of the variable depends on λ. Considering that the change in the parameter value of a variable can be interpreted as a change in the contribution of the urban variable, it is possible to determine the potential structure. In other words, only 11 variables are required to describe the amount of damage. In the variable-selection problem based on the high-estimation accuracy model, not all variables are required, suggesting that the appropriate selection of variables based on the potential structure is important (see Figure S5).
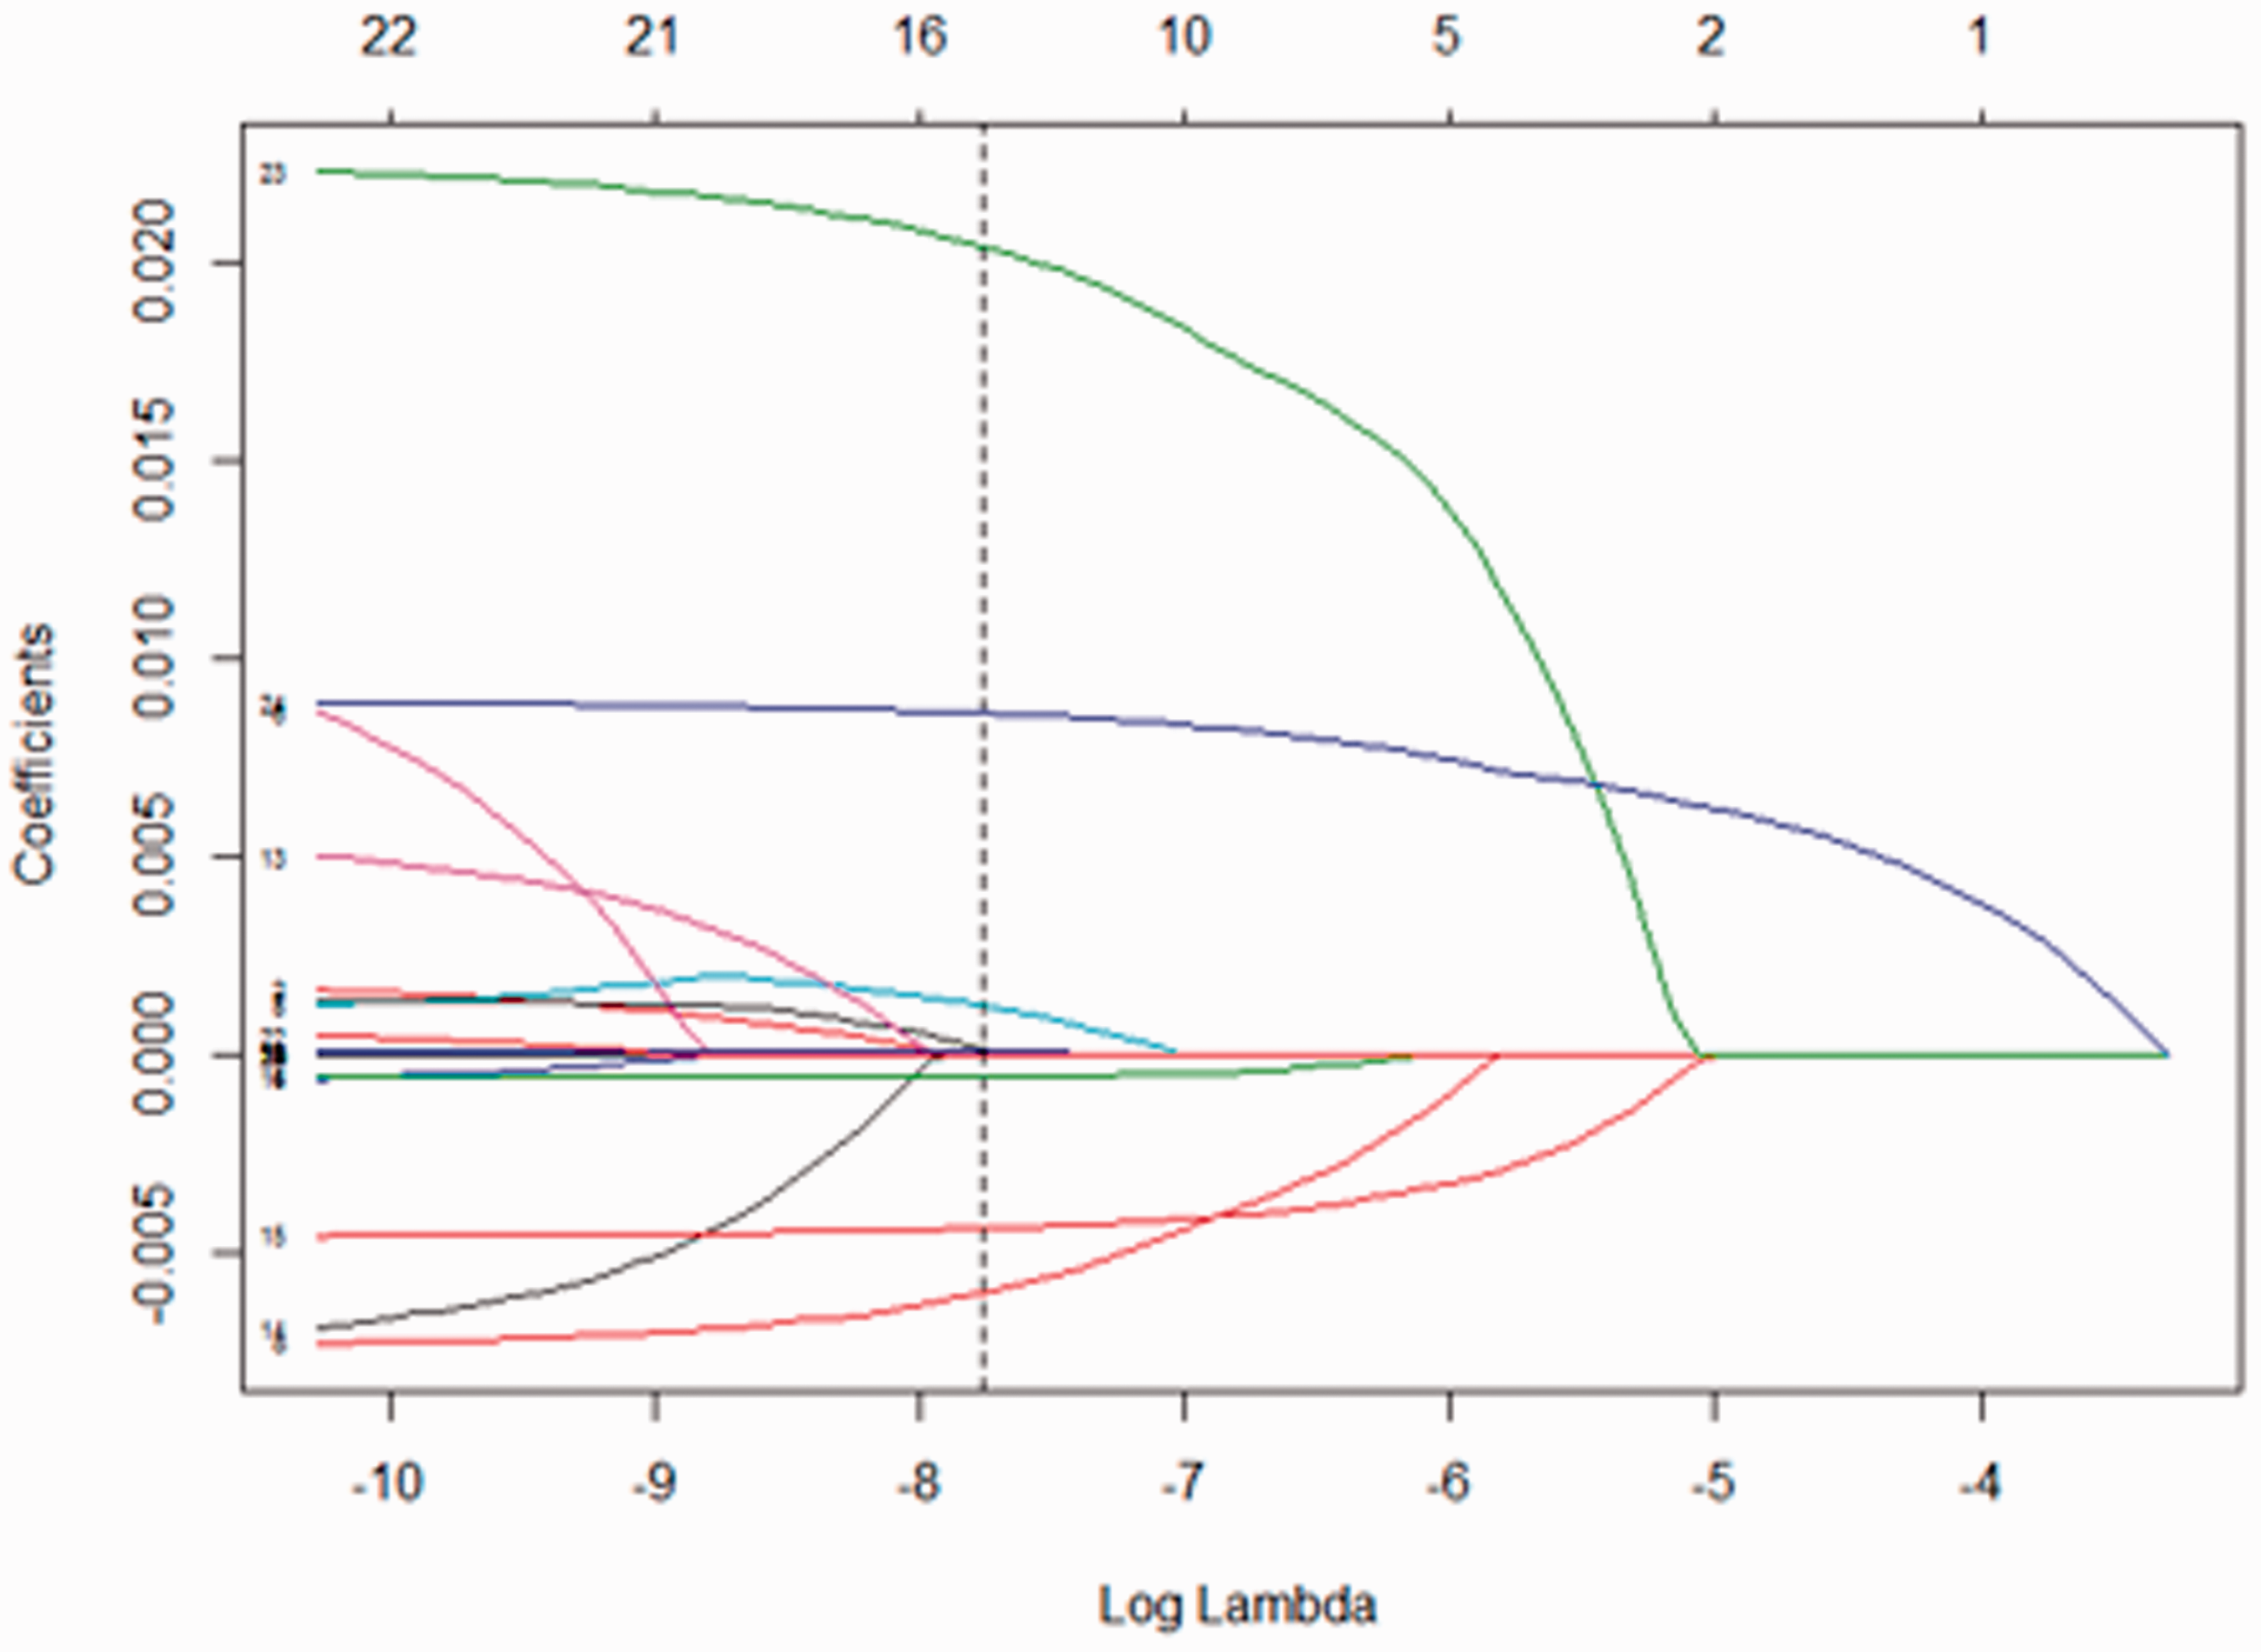
Relationship between urban environment variable parameters and the SpM parameter λ. The dotted line represents λ when the MSE is minimum.
SpM analysis results by city
Figure 5 shows a radar chart of the selected variables for Kochi City, Tosa City, Aki City, Nankoku City, Muroto City, and Shimanto Town in Kochi Prefecture. By comparing the results obtained from different neighborhoods and municipalities, the issues of the municipalities can be visualized toward disaster mitigation for resilience. In addition, from the unevenness of the radar chart, urban environment variables that municipalities need to supplement in the regional disaster prevention planning can be identified. It is extremely important to consider both the earthquake damage estimation results and the information provided by radar charts comprehensively when considering disaster prevention measures. It is also possible to establish a local disaster prevention plan by understanding the urban environment factors requiring improvement in each municipality. For example, in Kochi City, promoting both earthquake resistance and fire-proofing is necessary as both collapse and fire are high risk. In Muroto City, as only the burnout rate is selected as a regional attribute, promoting fire retardation, fire evacuation planning, and fire-fighting operations is necessary to reduce the risk of fire damage rather than the risk of collapse.
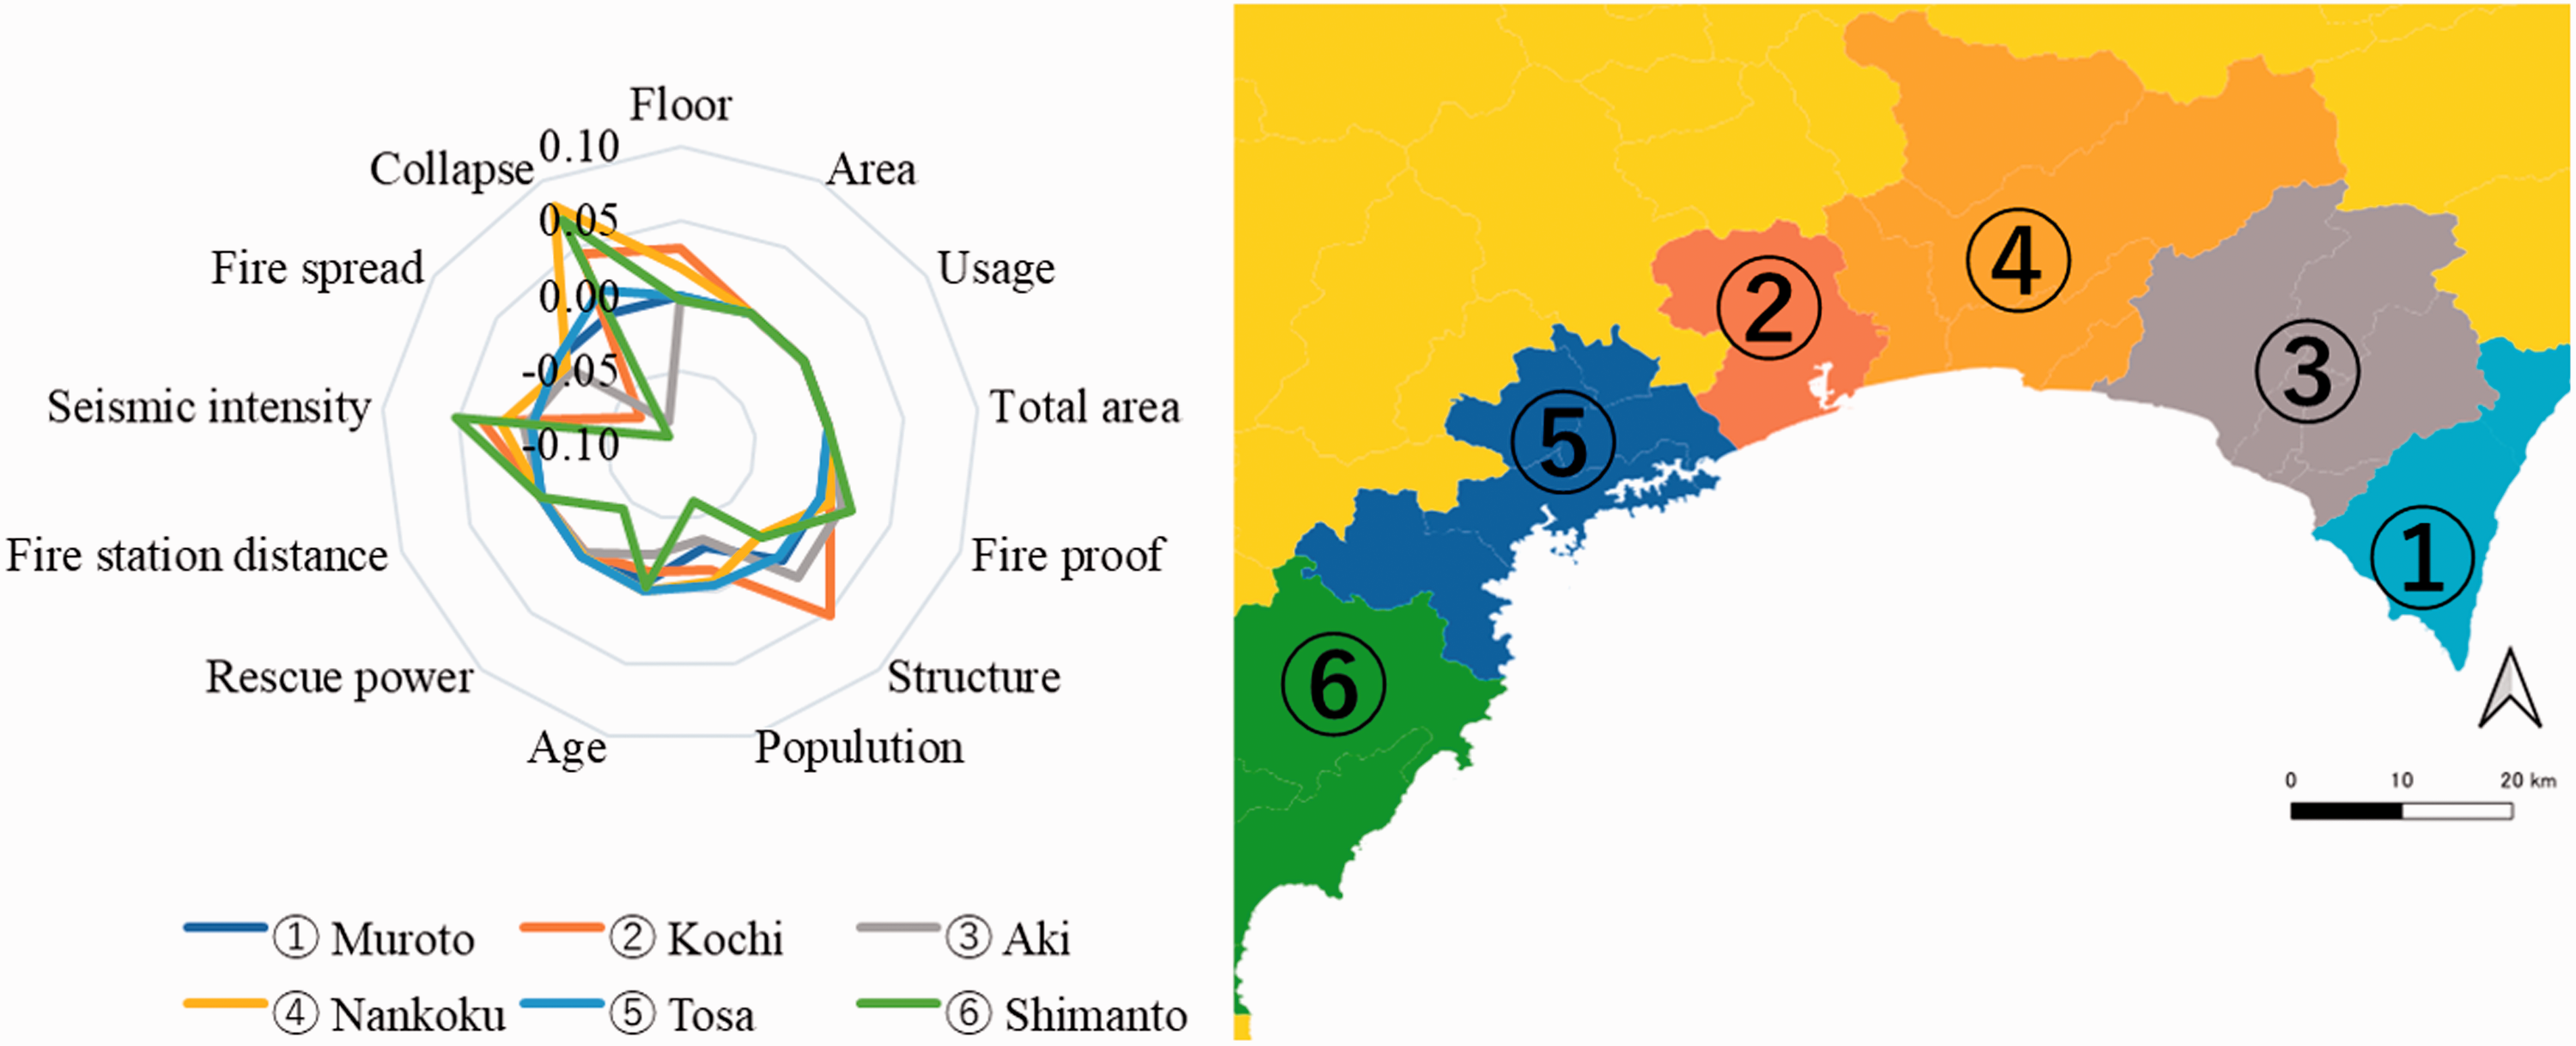
Radar chart of city variables when analyzed in each municipality.
In other cities, the impact of collapse appears to be large. Therefore, promoting seismic resistance in these areas is crucial. This analysis can be performed for evaluations both at the municipal level and the aggregation unit level (e.g. at the block or street level).
Reliability verification
We verified the reliability of the extracted regional variables of the urban environment in characterizing the maximum damage. In particular, we compared the maximum damage for every 500 m of the grid obtained with the simulation model and the model with the variables extracted using SpM. Figure 6(a) compares the maximum number of casualties obtained by SpM and the simulation model in the Kochi area. The figure shows that the two values have a positive correlation (R2 = 0.95). In other words, the maximum damage can be explained by some urban variables with the spatial distribution with some degree of reliability. Many of the areas where casualties were underestimated are grids with large numbers of casualties located in urban areas. In such areas, casualties were caused by fire and tsunamis. In these areas, other urban environment variables need to be considered because many people are staying at unsafe areas based on the movements of people.
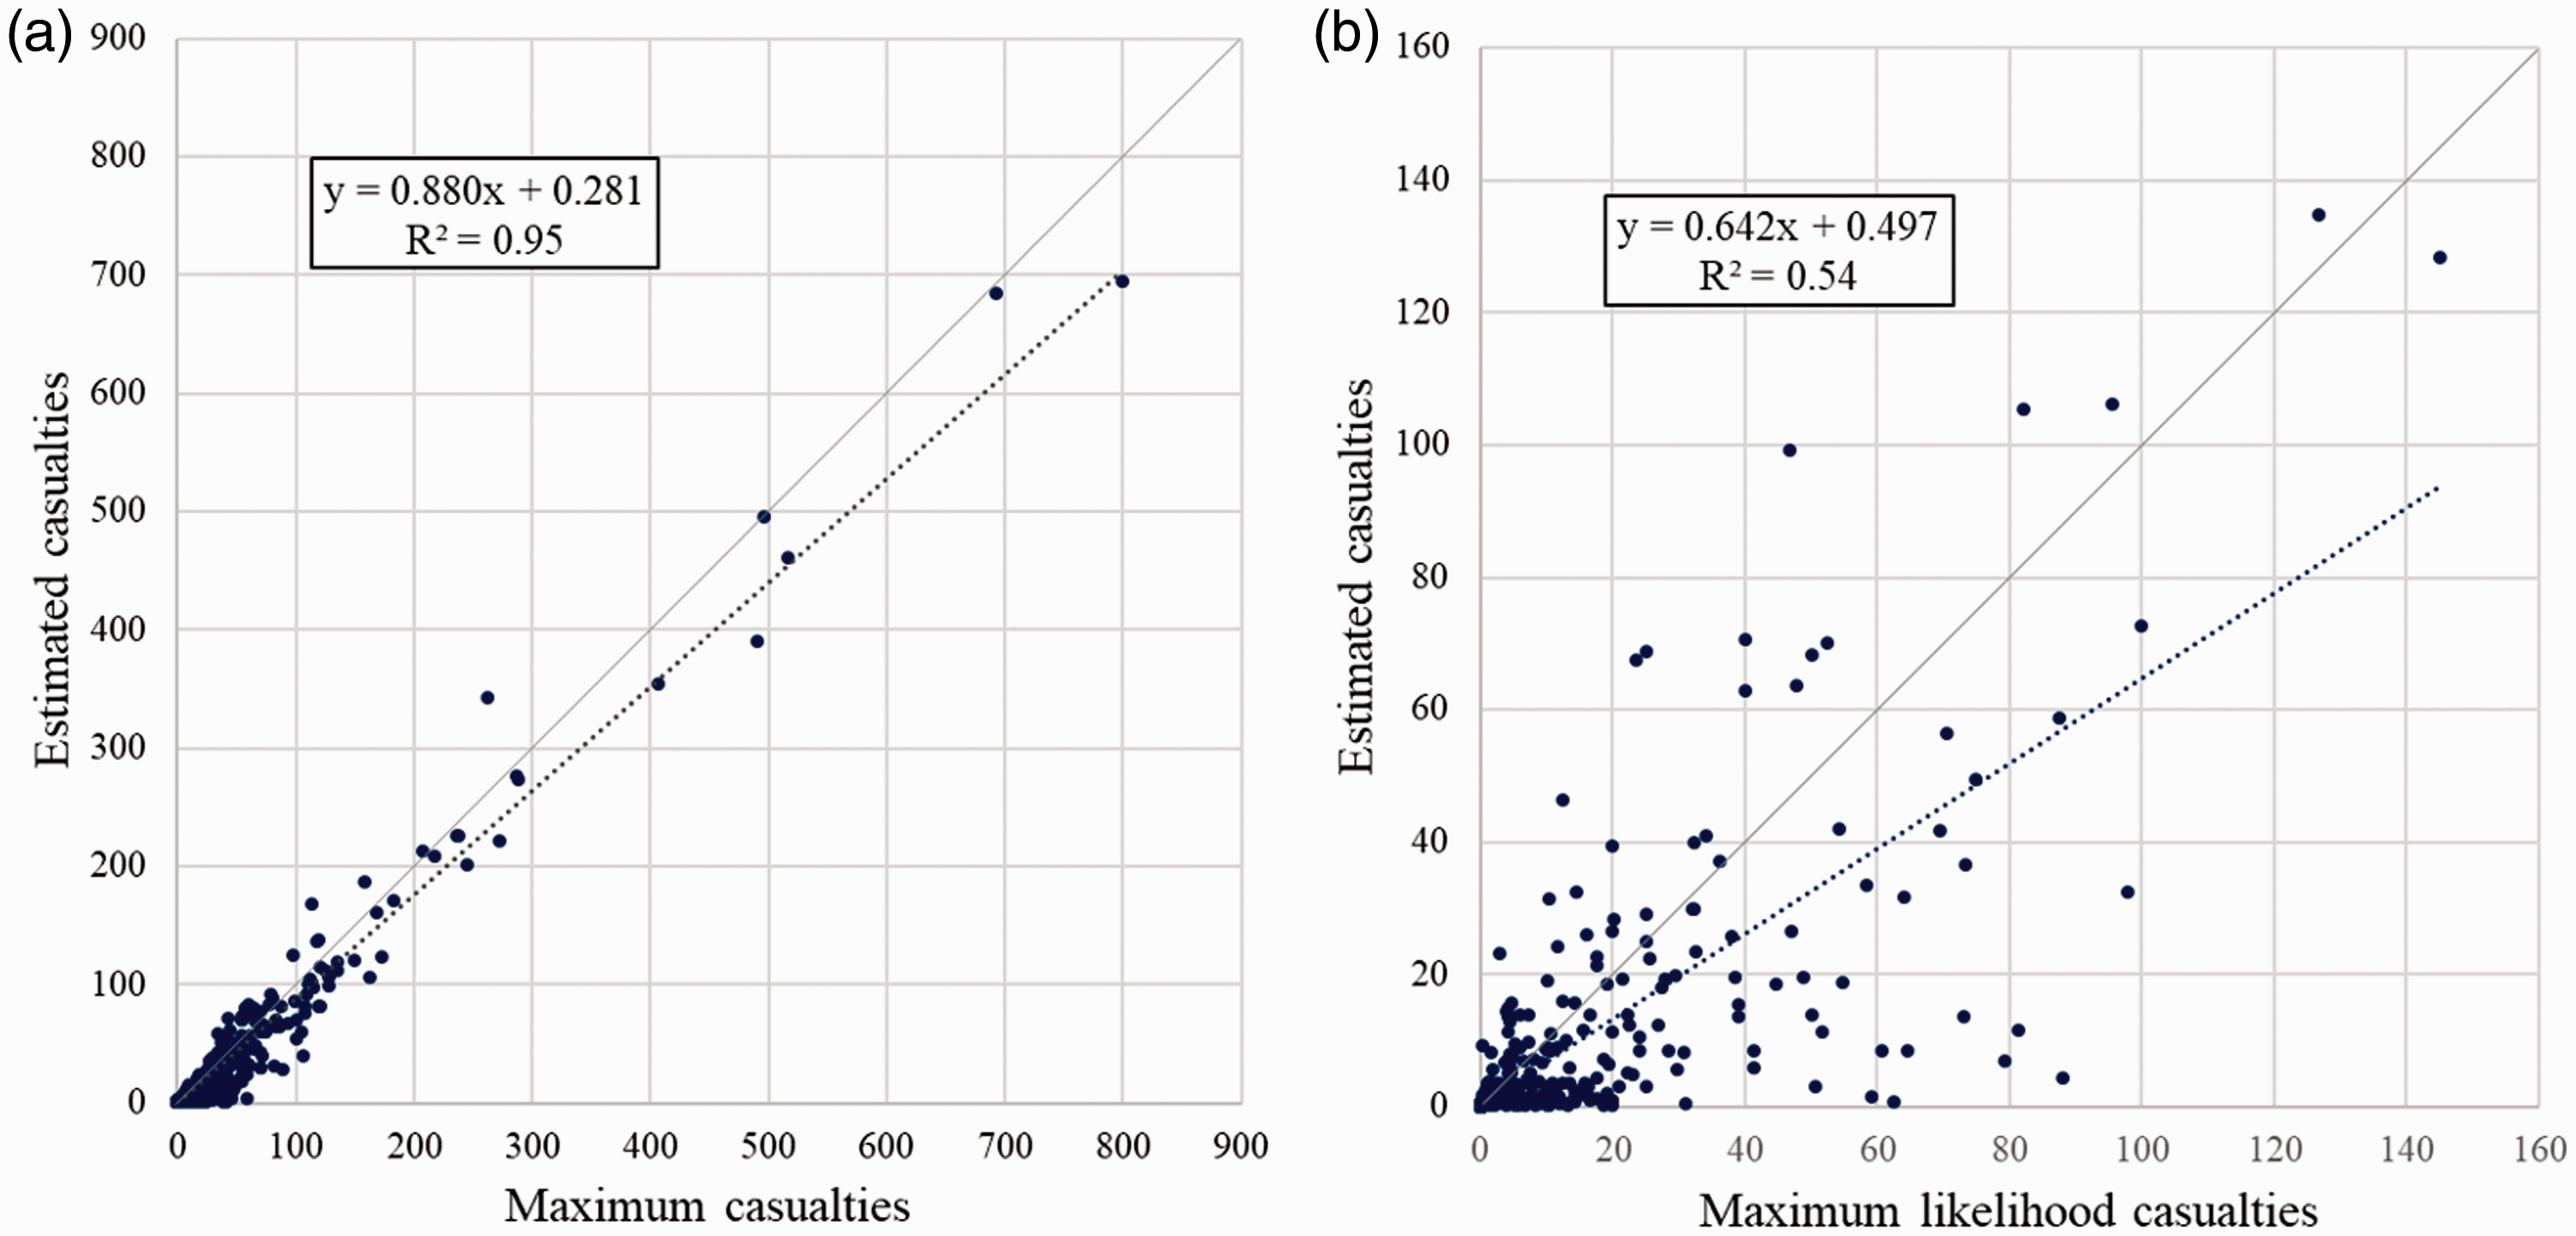
Comparison of number of casualties between SpM and simulation model for every 500 m of a square grid in the Kochi area. (a) Comparison of maximum number of casualties. (b) Comparison of maximum likelihood number of casualties.
To show that the improvement of prediction accuracy is not affected by the damage scale, we performed the same protocol for maximum likelihood damage to keep statistics on correlation. The prediction results obtained by SpM for maximum likelihood damage from damage simulation in the Nankai Trough are shown in Figure 6(b). Figure 6(b) shows that the correlation of maximum likelihood damage is positive (R2 = 0.54), but the prediction accuracy is affected by the damage scale. This is because there are no effective variables based on maximum likelihood damage rather than maximum damage. Future research should verify the reliability of the proposed method by developing models that consider the damage level in each local area.
Discussion
Generally, as the number of variables in the model increases, the accuracy also increases. This result is consistent with what we intuitively understand as the amount of known information increases. However, the best discrimination was not achieved by using all elements (Figure S5). This phenomenon is called overfitting and is a well-known concept in information science with respect to classification and prediction problems. If the number of explanatory parameters is sufficiently higher than the number of samples, or if the predictive model is significantly complex for the dataset, the classification and prediction function for an unknown dataset may fail, even if the model can classify the training data very well. Therefore, we show that to avoid overfitting, it is important to select the right combination of elements based on a data-driven approach that maximizes the use of the available dataset to create predictive models.
SI, fire spread, population, and structure are important for seismic damage. These urban variables were previously identified as important in estimating the magnitude of damage. This important role is consistent with the fact that these urban variables are included as urban variables in damage estimation models constructed from past hazards. SI, fire spread, fire-proofing, structure, collapse, and population are positive or negative and contribute to an accurate prediction of damage estimates. Building area and usage are zero, indicating that these urban environments cannot be used as indicators of earthquake damage. Similar results were reported for structure and collapse in the 2011 Great East Japan Earthquake.
In the case of the minor element, the weights for the number of condominiums, distance from a fire station, number of rooms, and area are zero. Nakamura et al. (2017) reported that in complex disasters with simultaneous fires and collapses, residents' awareness and rescue activities had more impact on the damage than distance from fire stations and buildings. Future research will more fully investigate the mechanisms of these differences in resident awareness and self-help as well as the magnitude of damage.
Recent research proposes that data-driven proxies have significant potential in focusing on the elements of the urban environment that are most important for the process of mitigating damage from natural hazards in terms of disaster preparedness. Our estimation method can consider several urban environment elements that may contribute to better estimation of urban environment variables. Therefore, by applying our method to a specific seismic hazard, it may be possible to determine important urban environmental variables that will be robust to the damage process after an earthquake. One of the challenges for this is the open data collection of damage data during disasters. This study can contribute to the analysis of these vast disaster datasets. Furthermore, the proposed method can be widely used for high-dimensional urban environmental datasets, regardless of resilience evaluation and any type of natural disaster.
Summary and conclusions
In this paper, we proposed a method for estimating the damage to humans and properties due to earthquakes under various scenarios using detailed urban environment data and observation data. The damages caused by collapse and fire were found to fluctuate significantly depending on several factors, such as the movement of people and the date and time of the earthquake. Furthermore, we proposed a method to extract characteristic urban variables that explain the maximum damage by applying SpM to urban environment variables for each region. Using BMGD, urban environmental variables were analyzed in detail at scales below the building units, such as elementary schools and homes.
One limitation of the proposed method is that the numerical simulations do not depend on the fragility curves. As numerical simulations demand a large amount of computational power, they require high-performance computing techniques. In future studies, the reliability of the estimation method should be verified through comparisons with the analysis of previous earthquakes. To enhance the resilience of cities by raising the awareness of disaster prevention, not only simulations from data but also geographical approaches to deeply understand the region (e.g. topography, cultural background, awareness of residents, etc.) should be employed. Combining state-of-the-art big data high-performance computing technology with the traditional fieldwork approach, new and improved approaches can be developed, and the strengths of both fields can be enhanced.
On the other hand, further studies are needed to address problems with the validation and demonstration of our models; not using past earthquake damage results may still be disadvantageous. The effectiveness of the SpM analysis in extracting the characteristic urban variables of disaster scenarios will make it possible to build a more reliable model by comparing the data obtained from various past disaster events.
Supplemental Material
sj-pdf-1-epb-10.1177_2399808320986560 - Supplemental material for Estimation of earthquake damage to urban environments using sparse modeling
Supplemental material, sj-pdf-1-epb-10.1177_2399808320986560 for Estimation of earthquake damage to urban environments using sparse modeling by Yoshiki Ogawa, Yoshihide Sekimoto and Ryosuke Shibasaki in EPB: Urban Analytics and City Science
Footnotes
Acknowledgements
The tsunami propagation simulation data used in this study were provided by Professor Shunichi Koshimura at Tohoku University. The present study was made possible by data provided by NTT Docomo, Inc., ZENRIN DataCom Co., Ltd., and Teikoku Databank, Ltd. Furthermore, this study was carried out as part of joint research no. 122 with the Center for Spatial Information Science (CSIS), University of Tokyo. The authors wish to express their gratitude to the individuals, companies, and sponsor organizations noted above.
Declaration of conflicting interests
The author(s) declared no potential conflicts of interest with respect to the research, authorship, and/or publication of this article.
Funding
The author(s) disclosed receipt of the following financial support for the research, authorship, and/or publication of this article: This study received funding support under the “Post-K computer priority issue application development” program (Priority issue 3: Construction of an integrated forecasting system for complex disasters based on earthquake and tsunami) sponsored by the Ministry of Education, Culture, Sports, Science, and Technology, and the Strategic Basic Research Program and AIP (Artificial Intelligence, Big Data, IoT, Cyber Security Integration Project) Network Public/Private R&D Investment Strategic Expansion Program (PRISM) [grant number JPMJCR18Z6] of the Japan Science and Technology Agency (JST) and JSPS KAKENHI [Grant Numbers JP17K12997 and JP 20K15001].
Supplemental material
Supplemental material for this article is available online.
![]() ). He is a former President of Asian GIS Association, a former President of the GIS Association of Japan. He also served as a board member of Infrastructure Implementation Board of GEO (Group of Earth Observations), a steering committee member of World Data System of ICSU (International Council for Science). Now, He works as a committee member on space policy of Cabinet Office of Japan, with the expertise of geospatial information technology and application development leveraged by space technology.
). He is a former President of Asian GIS Association, a former President of the GIS Association of Japan. He also served as a board member of Infrastructure Implementation Board of GEO (Group of Earth Observations), a steering committee member of World Data System of ICSU (International Council for Science). Now, He works as a committee member on space policy of Cabinet Office of Japan, with the expertise of geospatial information technology and application development leveraged by space technology.
References
Supplementary Material
Please find the following supplemental material available below.
For Open Access articles published under a Creative Commons License, all supplemental material carries the same license as the article it is associated with.
For non-Open Access articles published, all supplemental material carries a non-exclusive license, and permission requests for re-use of supplemental material or any part of supplemental material shall be sent directly to the copyright owner as specified in the copyright notice associated with the article.