
Abstract
This study applies a new methodology using the location of tweets from creatives to study where economic creativity takes place in a city. Based on a Twitter network in Brighton and Hove (United Kingdom), a creative hub, we identify freelancers and entrepreneurs in the creative industries that form the ‘core’ of the ‘creative class’ but have rarely been captured in existing spatial research. We use a comprehensive geodatabase of ‘Points-of-Interest’ and Census of Population residence and workplace locations to match tweets with types of places. Findings show that practices of economic creativity are less spatially clustered in central parts of the city and more spatially distributed across the city than studies that used business register data or cluster approaches suggested. Residential areas, which proxy for home locations, have a high incident of creative activities besides urban amenities and coworking spaces. It is concluded that local economic development should support the creation and maintenance of attractive places of social interactions across the city to foster creativity and innovation which has become even more important with the surge in homeworking due to Covid-19.
Introduction
Cities are routinely regarded in urban economic research as the locus of creativity and innovation. Richard Florida’s (2002) creative class theory, which suggests that research should focus on people rather than firms to understand firm location and urban economic growth, has sparked substantial interest in academia and urban planning and policy. It is through this lens of the locational preferences of creative people (the ‘creative class’) whose work requires cognitive skills and involves high levels of creative tasks, we seek to study economic creativity. Following the notion that the location and attraction of economic creativity as embodied in entrepreneurs (Florida, 2003) is driven by diversity, openness and urban amenities (such as cafés and theatres) rather than traditional economic factors (e.g. pool of skilled labour, supply networks) some previous work has investigated the locational preferences of creative entrepreneurs. In confirmation of this theory, creative entrepreneurs seem to be attracted to cities with a high level of urban amenities (Qian and Liu, 2018; Wenting et al., 2011) but it is less clear to which places they are attracted to within cities.
Research on creative entrepreneurship faces methodological challenges. One issue relates to the definition of creative entrepreneurs and the creative industries and a second issue lies in data availability. Established definitions of the ‘creative class’ and the ‘creative industries’ rely on occupation-based measures encompassing scientists and engineers, architects and designers, academics, musicians and artists (Clifton, 2008; UK Department for Culture, Media and Sport, 2011) – but this approach does not allow creative entrepreneurs to be identified. In order to capture ‘economic creativity’ (entrepreneurship), business start-ups (Lee et al., 2004) or creative firms (He et al., 2018; Qian and Liu, 2018; Wenting, 2011) have been used. However, business register data exclude a large part of the creative industries as the self-employed or businesses that are not registered are not captured by official business registers (Foord, 2013). Creative work has increasingly been performed by ‘independent’ workers (freelancers). Research suggests that a high proportion of firms in the creative industries regularly outsource tasks to freelancers who often perform the more creative aspects of the work (Mould et al., 2014). This organisational flexibility means that creative work is increasingly been done outside of fixed firm locations. Because of the limitation of existing secondary or administrative data sources, previous work that has tried to tackle the issue of how to locate creativity in the city has sought to integrate qualitative data with more quantitative (and spatial – GIS) methods (Brennan-Horley and Gibson, 2009) or enhanced rather limited business data sources with interviews (Foord, 2013).
This paper develops a new approach to locating economic creativity in the city complementing previous urban research that studied creativity using business register data or occupational/employment data (He et al., 2018; Kemeny et al., 2020; Nathan and Vandore, 2014; Wenting et al., 2011). Rather than approaching economic creativity through business start-ups or firms with creative employees, we use independent freelancers and entrepreneurs who work in the creative industries, that are sectors that depend on individual creativity, skills and talent including designer fashion, music, film, video, photography and software and digital media (see DCMS, 2011). These creative individuals that form the core of the ‘creative class’ have been largely hidden in quantitative urban economic research. We use geolocated tweets of creatives to explore the locations of places they have visited using their tweets as a practice of economic creativity. The aim of this study is twofold. First, we seek to derive a new methodology to identify creative entrepreneurs and where they practise creativity that can be used in future urban economic research to overcome the limitations of existing data sources. This adds to the limited number of studies that used big social media data to contribute to understanding economic processes in cities (Casadei and Lee, 2020; Currid and Williams, 2010). Second, we test the attraction of creatives to urban amenities, as suggested by the creative class theory, and to places that facilitate encounters and social interactions that have increasingly been researched in creativity and organisational studies often using qualitative approaches (Kingma, 2016).
We analyse the places in Brighton and Hove – one of the ‘creative centres’ of the United Kingdom (Clifton, 2008) – where independent creative workers tweet by linking them to Ordinance Survey Points-of-Interests (POIs) which is the most comprehensive geographical database of all public and privately owned businesses, education and leisure services in the UK. We further link tweets with Census of Population data to identify tweets from residential areas as a proxy of residential homes and working from home. Our findings confirm the relevance of urban amenities for economic creativity in central parts of the city. However, equally important are residential areas for the creative practices of independent workers. Our new methodological approach therefore suggests a much less city centre-centric, spatially clustered pattern and a more distributed spatial pattern of economic creativity in contemporary cities than suggested by previous work based on more traditional methods to measure creativity and its location.
Literature review
‘Zones’ and clusters of creativity
Previous work on creative industries has often identified clusters of firms following the notion that firms derive benefits from proximity to other firms of the same or related industries (Grodach et al., 2014; Nathan and Vandore, 2014). It is well-established that firms in the creative industries are highly spatially clustered in large cities and within these in central city locations, both in the Central Business Districts (CBD) and surrounding areas (Grodach et al., 2014; Polèse, 2012), which has been explained with their high dependence on a flexible skilled pool of labour and tacit (as opposed to codified) knowledge (Florida et al., 2010; Lorenzen and Frederiksen, 2008).
Research, however, that has approached the location of creativity through creative people (including actors, architects, dancers, designers, managers and directors, photographers) rather than creative or cultural-cognitive firms, has revealed different ‘zones’ of creativity. Brennan-Horley and Gibson (2009) identified ‘creative epicentres’ in the City of Darwin (Australia) using interview data. In addition to a CBD-centred zone, they found activities of workers in the creative industries to be concentrated in suburbs. Others also highlight the importance of suburban residential areas and residential dwellings for firms in the creative industries (Gornostaeva, 2008; Kiroff, 2017) because commercial premises were not needed or the proximity to amenities was appreciated.
Mobile and multi-locational working
Rather than being fixed in one location, other research suggests that creatives’ work is multi-sited (Brennan-Horley, 2010; Hislop and Axtell, 2009) and characterised by a high level of local mobility (Liegl, 2014). Such previous research is in line with an interdisciplinary body of literature that has argued that the spatial fixity of work is decreasing as a result of mobile technologies (Hislop and Axtell, 2007; Pajevic and Shearmur, 2017).
Contrary to the focus in the literature on mobile professionals and working in mobile spaces, other research has found that mobile occupations are most prevalent in traditional industries (agriculture, construction and transport), whilst knowledge-intensive occupations remain predominantly located at fixed employment locations (Ojala and Pyöriä, 2018). Knowledge work, however, means that people increasingly work remotely from home besides working at the employer’s premises (Felstead and Henseke, 2017) – and this has dramatically increased in the Covid-19 crisis (Felstead and Reuschke, 2020).
Micro-spaces of creativity
Literature on the creative class has emphasised the role of urban amenities for creativity and talent. Reasons for the attraction to urban amenities, as argued in this strand of literature, relate to preferences for ‘quality of life’ and the appreciation of an environment that is open and tolerant towards diversity in terms of race, ethnicity and lifestyle (Clifton, 2008). The creative class was found to attend contemporary concerts, visit art museums and art exhibitions, engage in sport and fitness and use the internet more often than the ‘service class’ (Bille, 2010: 473). Related to these distinct lifestyles is a preference for neighbourhoods with leisure and cultural amenities such as boutiques, restaurants, nightclubs, museums, theatres and art galleries (Clark et al., 2002; Florida, 2005; Lloyd, 2002). Whereas the creative class theory has first and foremost studied residential and consumer preferences (Clark et al., 2002), neighbourhoods with a concentration of leisure and cultural amenities are also thought to generate economic benefits as they create a ‘cultural milieu’ (Wojan et al., 2007) that fosters collaboration which is why digital/tech companies often also reside in these areas alongside recording and art studios (Lloyd, 2002).
Recent urban economic research has drawn on the concept of ‘third place’ to study the places that creative freelancers visit because of perceived economic benefits. Oldenburg (1989) introduced the term ‘third place’ to describe public spaces used for informal social interaction outside of the home (‘first place’) and the workplace (‘second place’), such as cafés, taverns, pubs, the main street, bookstores, hair salons, post offices and beer gardens. Coworking spaces, that are collaborative working environments where people can flexibly lease desk space (Spinuzzi, 2012), have been regarded as a new ‘third place’ for creative freelancers (Brown, 2017; Kingma, 2016). This emerging literature highlights that rather than solely providing office and meeting space for those who do not have an office, coworking spaces are social spaces where creative freelancers and entrepreneurs can network and develop new ideas (Merkel, 2015; Spinuzzi, 2012). In addition to third places, the literature also suggests the relevance of temporary places for creative work, such as events and festivals (Comunian, 2017) as they provide ‘ad hoc’ social interactions.
In summary, whilst research on the creative industries has had a focus on clusters using primarily firm or employment data that fix creative activity in one place, research on the creative class has focused on creative people rather than creative firms and identified spaces that creatives seek in cities for residential and lifestyle reasons. Simultaneously, workplace research and creativity studies have moved away from the fixed workplace to highlight the concept of multi-locational working. There is little clarity, however, about the relevance of multiple work sites for freelancers and entrepreneurs and their spatial practices in cities.
Research design and data
We used Twitter to explore the location of economic creativity as embodied by creative freelancers and entrepreneurs. Twitter is an appropriate ‘big data’ source for our study due to its popularity, openly accessible data, and ability to identify users by their profile descriptions. Existing studies suggest that social media platforms such as Twitter are increasingly embedded in creative freelancers’ everyday work (Brems et al., 2017). In addition, we conducted a pre-study using the UK Association of Independent Professionals and the Self-Employed’s Freelance Confidence Survey in June 2016 to ask professional freelancers about their professional use of social media. Of the n = 452 respondents who answered our survey questions, Twitter was by far the second most relevant social media network used by 24.1% of the respondents, after LinkedIn that was used by almost all of the respondents for their work. In comparison, Facebook was only used by 13% (Reuschke and Wilkins, 2017).
Given our research aim, to identify locations of creativity in cities through the places visited by creative people, we identified a city-based Twitter network of creative freelancers. The Twitter network @WiredSussex was selected as an appropriate network as it has a large number of followers (over 24,000 in June 2019) compared to similar networks that we could identify. The @WiredSussex network seeks to attract freelancers in the digital, media and technology sector in Brighton and Hove and the wider Sussex region (in the economically strong South East of England). This coincides with the fact that Brighton is the biggest ‘creative hub’ in the UK outside of London in terms of creative employment (Clifton, 2008). In order to target individual users, we used the Twitter user timeline endpoint, or the application programme interface component.
Identifying creative freelancers and entrepreneurs
We used several iterations of profile tagging, similar to Fang et al. (2015), Brems et al. (2017) and Su et al. (2018), to identify creative freelancers and entrepreneurs among the followers of the @WiredSussex Twitter network. We used the creative industry definition by the UK Department for Culture, Media and Sport (2011) to identify creative occupations to which we add keywords related to entrepreneurship, freelancing and self-employed in order to capture economic/entrepreneurial creativity (Florida, 2003). This resulted in the following initial keyword matches in our sample: accountant, advisor, analyst, artist, associate artist, author, blogger, coach, co-founder, coding, commentator, consultant, consulting, contractor, copywriter, designer, developer, director, editor, engineer, entrepreneur, experienced professional, founder, freelance, freelancer, illustrator, independent, innovator, musician, networking, organiser, owner, photographer, product marketing, promoter, promotion, producer, self employed, self-employed, software developer, specialist, specialists, therapist, writer.
We used both topic modelling and network analysis to further investigate whether the creatives were using their Twitter account for professional purposes with the aim to delete accounts and/or tweets from our sample that were not related to freelancers’ professional use of Twitter. The identification of professional versus private tweets via topic modelling did not prove to be an appropriate method since it did not allow us to precisely define the purpose of the tweet which was related to the fact that our sample included a variety of professions for whom text and pictures potentially had different meanings. For example, an image with related text describing the beach or sunset in Brighton is likely to fulfil primarily professional purposes for a photographer but perhaps less so for a software developer. Further, a tweet about a local football game could be professional for a journalist. Instead, we applied our freelancer tags (see above) to our sampled freelancers’ Twitter networks, both to those they were following and their followers, to test whether their networks were mostly composed of creative freelancers or entrepreneurs. The proportions of followers and following accounts which were classified as freelancer or entrepreneur varied between 15% and 58% whereby those with the lowest proportion of creatives amongst their followers still had higher proportions in their following accounts and vice versa (see supplementary documentation). This led us to retain all identified user accounts.
Sample
From the identified creatives, we selected only those who had tweeted at least once from Brighton and Hove. This resulted in a sample for our study of 451 freelancers and entrepreneurs with a total of 14,514 geolocated tweets. The tweets included in our analysis cover the period between September 2010 and June 2019. The number of tweets and users in our sample varied over the study period with a peak mid-2014 (see supplementary documentation).
Based on their Twitter profiles, our sample represents predominantly creatives in arts, design engineering and software developer, i.e. the ‘core’ of the creative class (Clifton, 2008; Florida, 2002), and incorporates those who identify as entrepreneur, for example: (‘designer’, 68), (‘director’, 61), (‘artist’, 45), (‘founder’, 42), (‘freelance’, 39), (‘writer’, 33), (‘consultant’, 32), (‘photographer’, 30), (‘producer’, 22), (‘developer’, 21), (‘independent’, 19), (‘co-founder’, 19), (‘editor’, 18), (‘illustrator’, 16), (‘specialist’, 15), (‘engineer’, 14), (‘owner’, 14), (‘blogger’, 13), (‘author’, 13), (‘coach’, 13), (‘specialists’, 10), (‘musician’, 9), (‘entrepreneur’, 9), (‘freelancer’, 5), (‘therapist’, 5), (‘coding’, 4), (‘advisor’, 4), (‘copywriter’, 4).
Classification of places
We used POI data produced by the UK’s national mapping agency, the Ordnance Survey, to classify types of places creative freelancers and entrepreneurs tweeted from in Brighton and Hove. 1 These data identify over 700 types of objects and activities at a high level of spatial accuracy. We derived a classification of places based on the literature review.
Third places.
We selected cafés, restaurants, pubs and bars highlighted in the creative class literature as urban amenities (Bereitschaft, 2017). We label these ‘meeting spaces’ following the concept of ‘third place’ and the notion that creatives seek these places for social encounters and networking (Kingma, 2016). We include in our group of meeting spaces hotels that often have lobbies and bars that can also function as places of social interactions (Martins, 2015).
The POI data do not contain coworking spaces. We therefore used a Google search and identified 34 coworking spaces in Brighton and Hove that we classified as separate category. Because our sample contains writers and authors, we include libraries and community centres as another place category that have increasingly offered social events (Hickman, 2013; Martins, 2015).
Cultural and leisure amenities.
As cultural amenities that highly feature in the creative class literature (Clark et al., 2002), we included museums, theatres, concert halls and art galleries. We used a long list of entertainment and sports facilities as leisure amenities (supplementary documentation).
Transport and public spaces.
We further classified transport facilities (bus and coach station, motorway service stations, railway stations, etc.) and public spaces that we could identify in the POI data via Wi-Fi Hotspots (installed on lamp posts and CCTV cameras in central locations in the Brighton and Hove area 2 ). Both of these categories capture the phenomenon of ‘working on the move’ using mobile devices and thus the notion of ‘mobile spaces’.
Green space.
Green space has been regarded as an urban amenity mainly to attract tourists rather than creatives. However, He et al. (2018) found a proximity of cultural entrepreneurs to urban parks. We therefore derived a category for natural amenities (parks, gardens, commons, etc.).
Education/health and commercial services and buildings.
Our data contain tweets from places that classify as educational activity (e.g. school buildings) and health service. We collapse these into one category. We can further assign tweet locations to business services (e.g. architectural consultants) and commercial buildings (e.g. shopping centres) which we label commercial places.
Buffer zones.
We used a 50 m tolerance around each POI because of the inconsistencies in smartphone GPS signals. A limitation of using tolerance distances (‘buffer zones’) is where POI locations are within 50 m of each other, such as in high streets, but this is a necessary limitation due to GPS accuracy considerations. However, this tolerance allowed us to capture an entire building rather than rely on a fixed coordinate to represent the POI. The vast majority of the geolocated tweets in our sample (80.8%) were associated with only a single POI, therefore, despite the risk of overlapping POI tolerance zones, we are confident that our classifications are not artificially inflated.
A limitation of the POI data is the unavailability of time-series data. We had only access to the most up-to-date POI datasets from June 2019. This could mean that tweets in our sample dated from 2010 were in a different place category than identified in our study. However, the misclassification should be minimal as it will be likely that POIs will have changed within our place categories (e.g. between restaurant and café) but that there are only few changes between our categories.
Home and residential locations.
We cannot directly identify the residential locations of Twitter users in our data. Instead, we derived a measure of areas that we deemed to be strictly residential and used this as a proxy of residential home location. For this purpose, we used the Workplace Classification of the Office for National Statistics that is based on the Census of Population data 2011, specifically a variable that measures the ratio of the residential population to workplaces at Output Area level (the smallest Census geography). 3 We used the lowest ratios (OAs that are overwhelmingly residential in nature) to measure strictly residential areas. Tweets that were not associated with POIs but fell into a strictly residential location are classified as residential/home places.
Identification of combinations of places
To further examine whether there were different types (or patterns) in individual tweet locations, we applied the k-means cluster algorithm, an often-used algorithm to detect patterns in data. For this analysis, we calculated (at the individual level) the proportion of all tweets for each place category (rather than taking the tweet count) to account for the uneven number of tweets per person in our data and heavy users in particular (see the Sample section). Because of the limitation in recognising tweet patterns from individuals with only a few tweets, we created a sub-sample of freelancers with a sufficient number of geolocated tweets (eight and more tweets). 4
The k-means cluster algorithm requires a pre-defined number of clusters to be identified. We used the Davies-Bouldin, Dunn and Jaccard indices (Mehar et al., 2013; Unankard et al., 2014) to define a local clustering optimum within the range of k = 2–10. On the basis of these results, we selected the value of seven for our set number of clusters.
Empirical findings
Spatial tweet patterns
The tweets in our sample show a concentration in Brighton’s city centre (around the train station in the central South) but also higher concentrations along the sea front (South coast) and fringe areas in the north (Figure 1). Figure 2 shows the spatial distribution of tweets in our sample per place category. Meeting spaces, cultural amenities and coworking spaces are concentrated in central parts in the central South. Tweets from natural amenities, libraries and community centres and transport spaces are more spatially dispersed. Tweets from residential/home locations spread across the city including in central parts. There remains an unclassified number of tweets (representing 5% in our sample, see Table 1) that cannot be assigned to a POI or defined as a residential/home location.
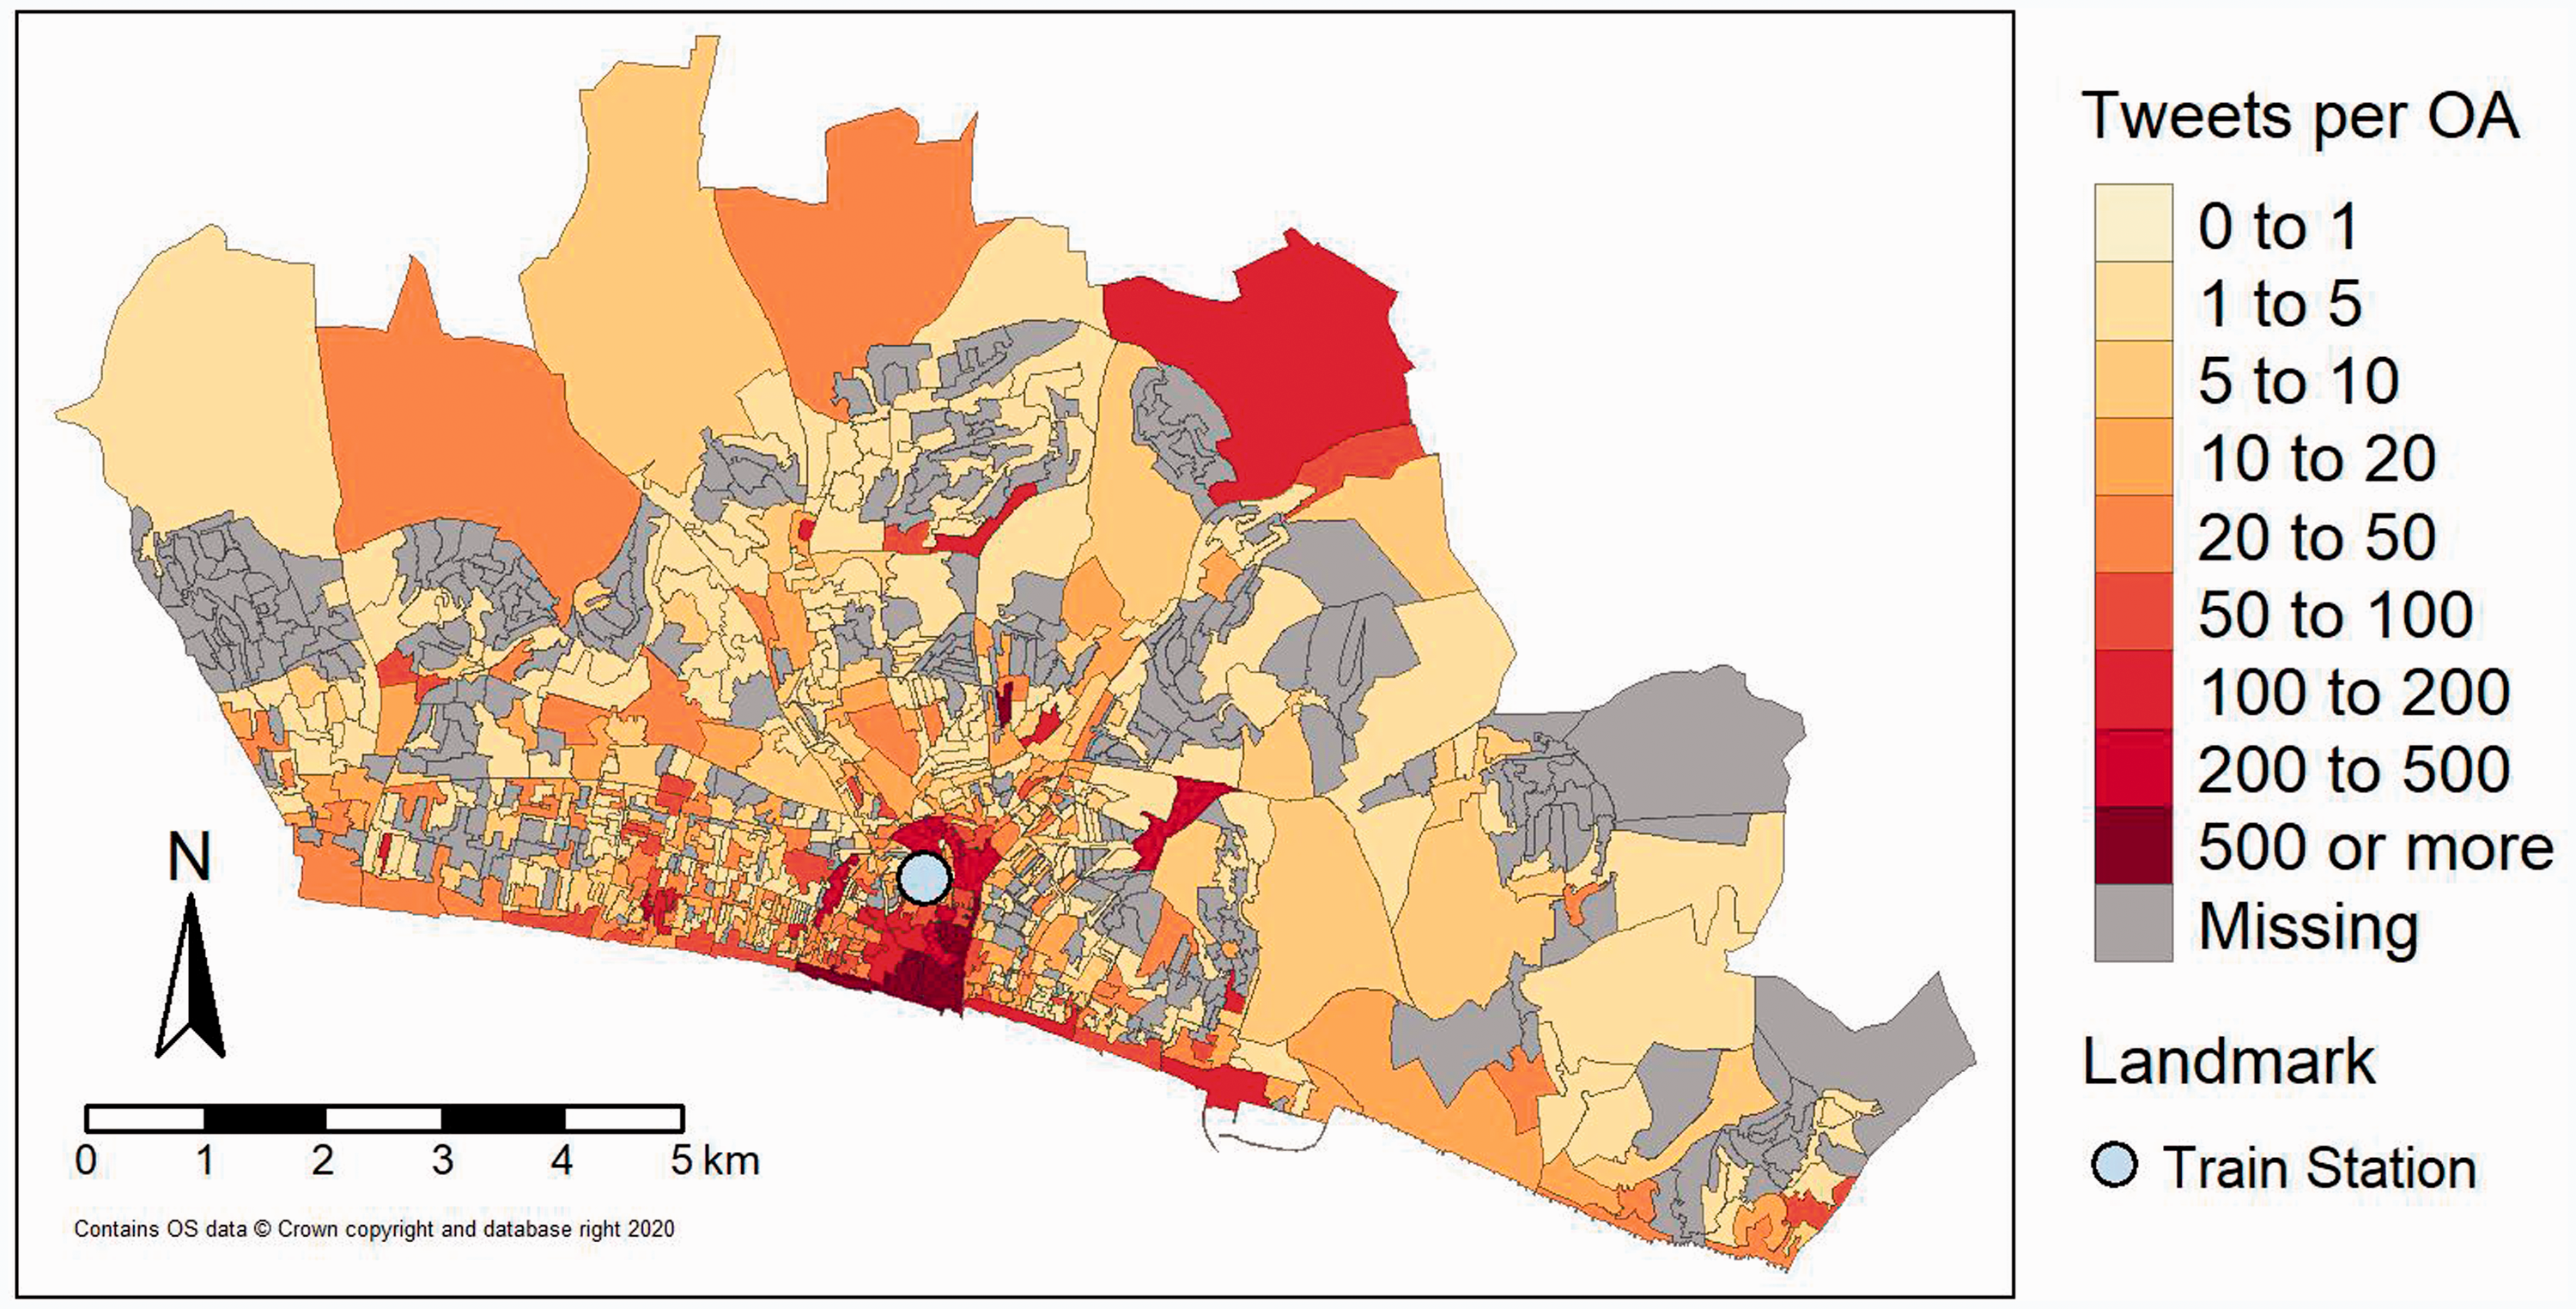
Tweets per output area (OA).
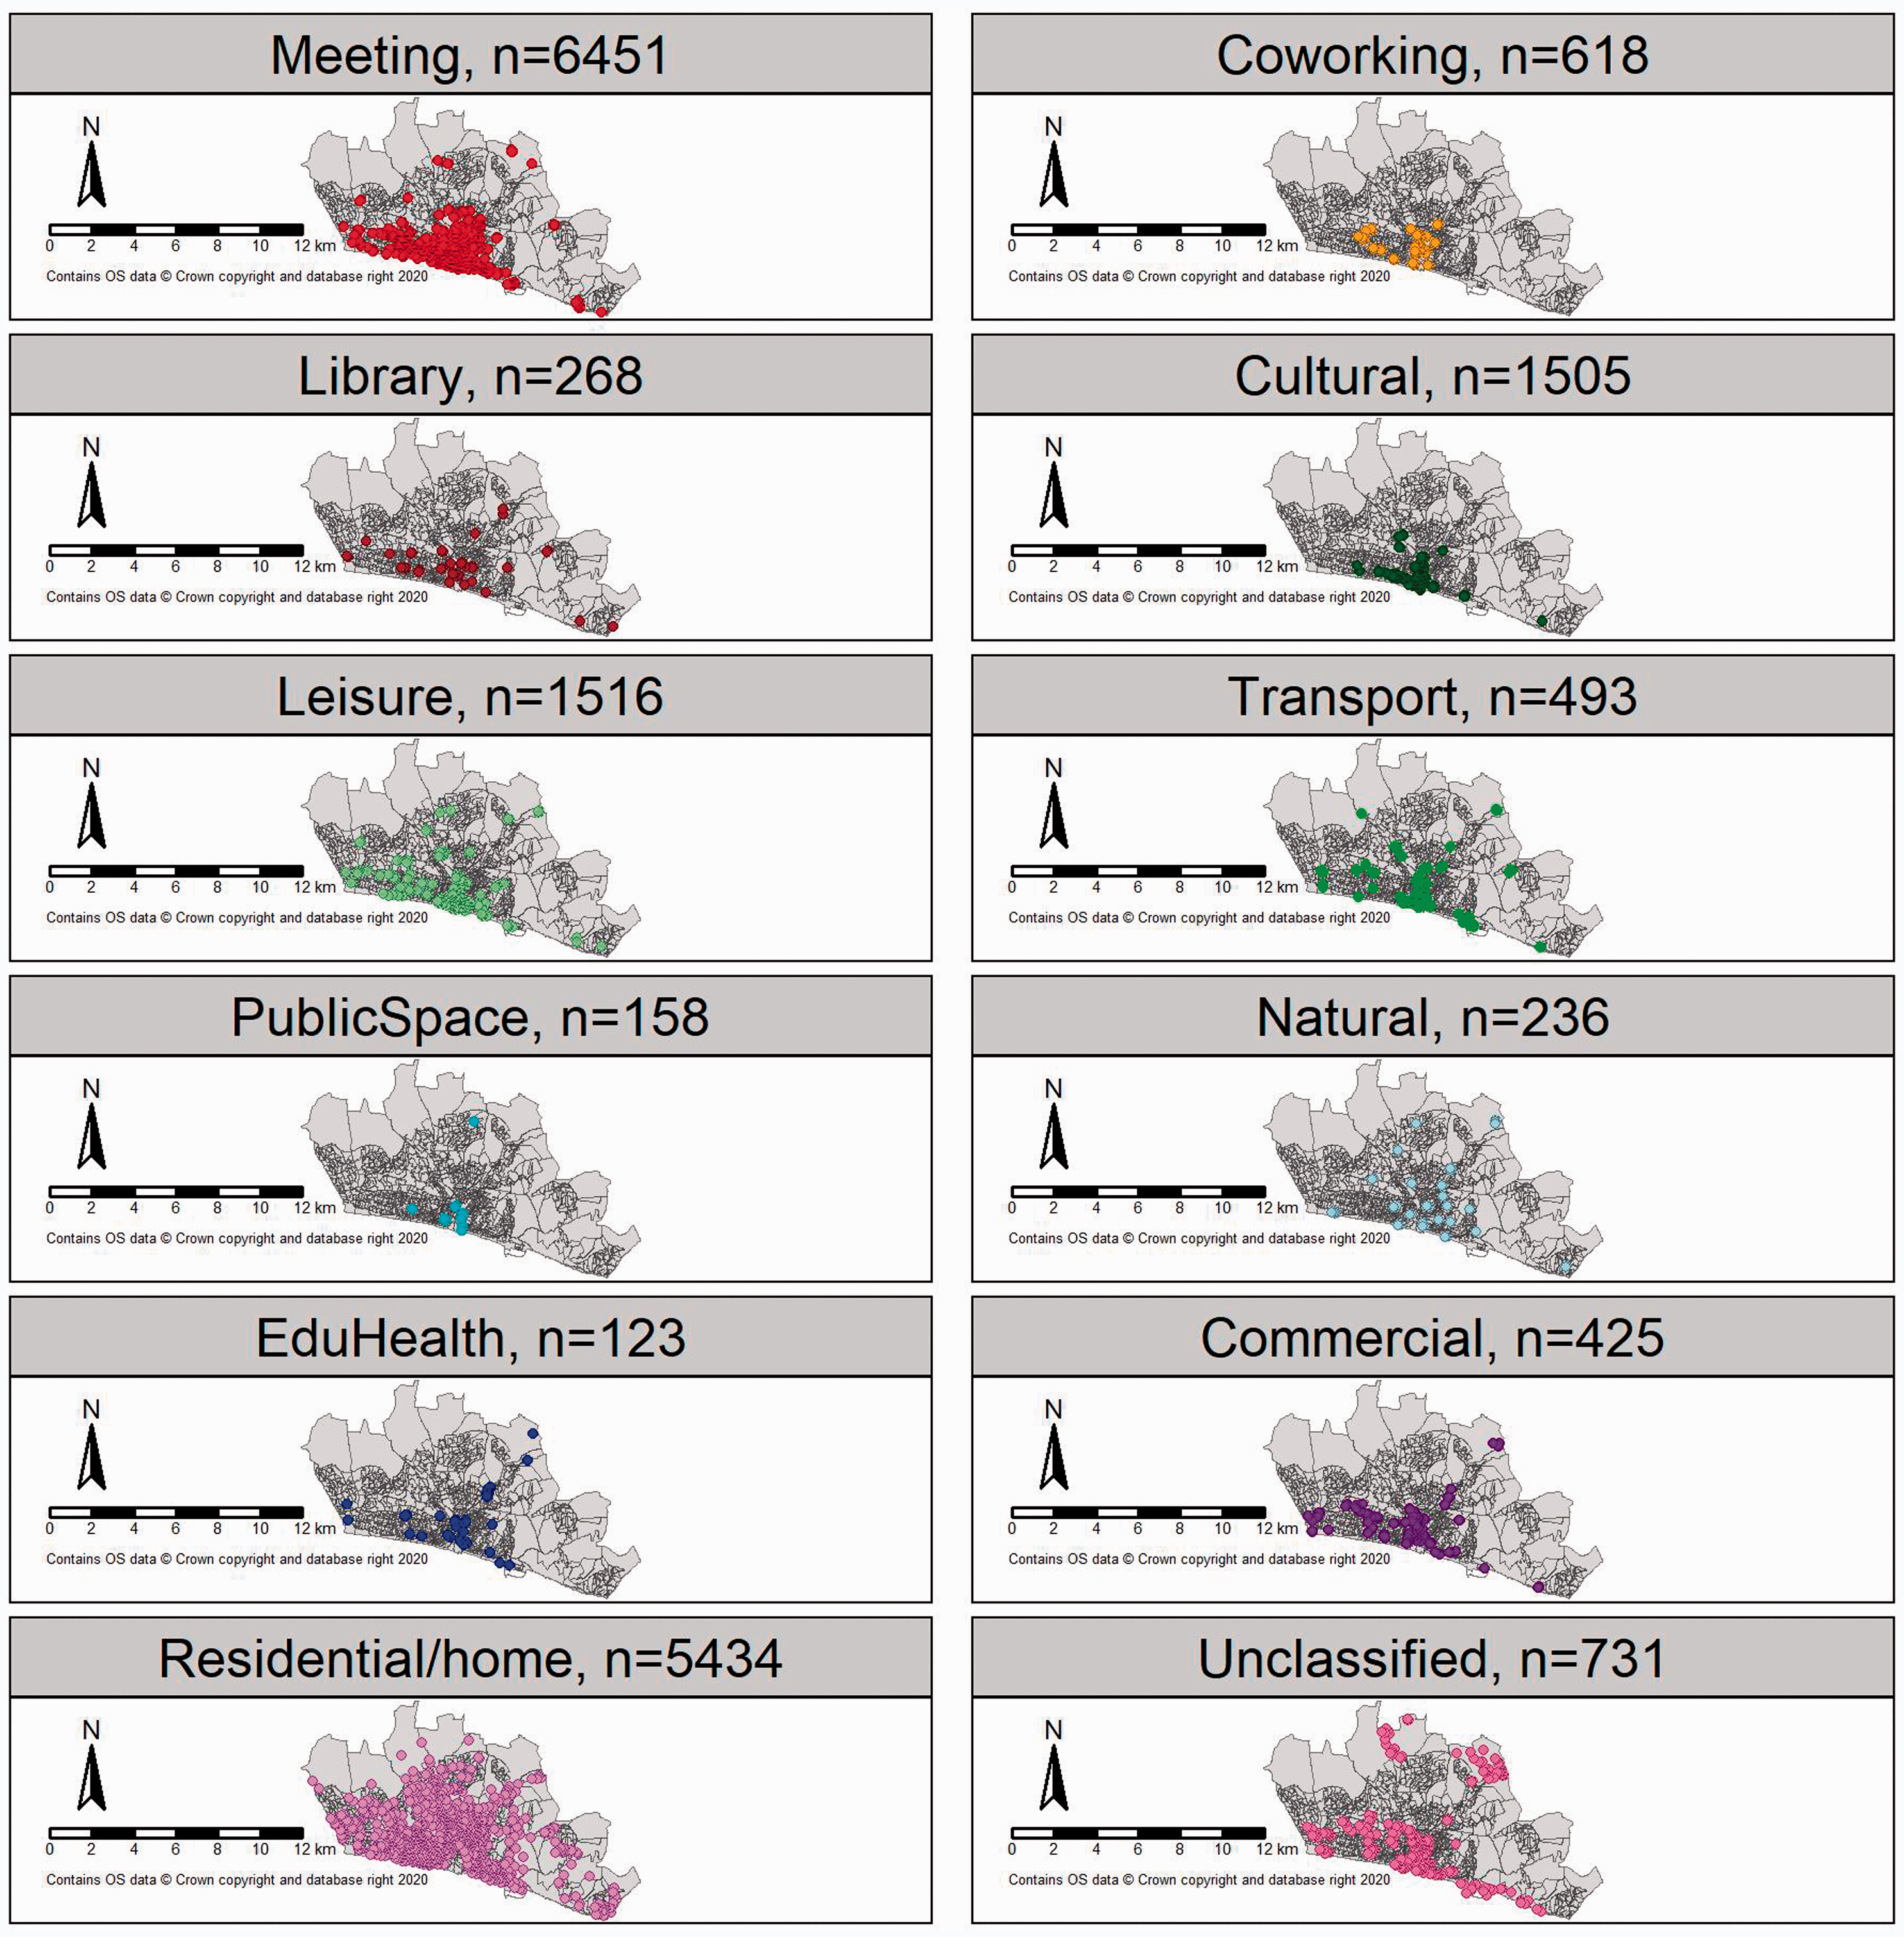
Tweets per type of place. Note: Total number of n=451 Twitter users with n=14,514 tweets. Source: Authors’ sample created from @WiredSussex.
Tweets by place categories for total sample and sub-sample excluding heavy users.
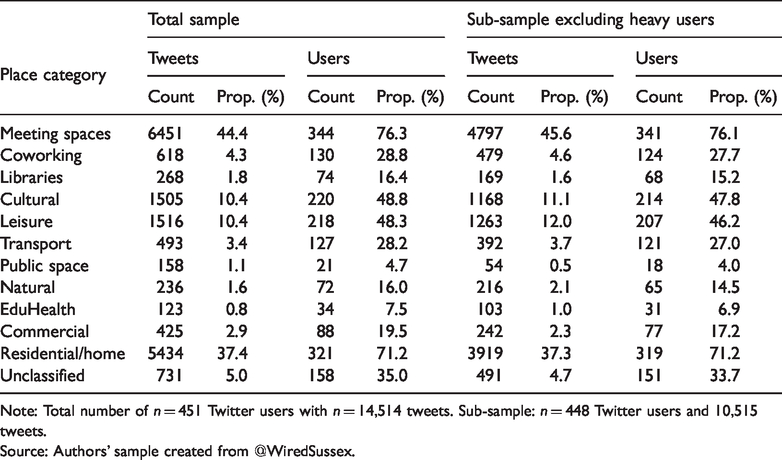
Note: Total number of n = 451 Twitter users with n = 14,514 tweets. Sub-sample: n = 448 Twitter users and 10,515 tweets.
Source: Authors’ sample created from @WiredSussex.
Table 1 summarises the distribution of tweets across our derived place classification. The proportions of tweets from our specified place categories is almost identical in the whole sample compared to the sub-sample that excludes heavy users indicating that heavy users’ tweets do not tend to be clustered in selected places different to users with fewer tweets in our data. The largest proportion of tweets in our sample came from cafés, bars and restaurants (‘meeting spaces’), and in total three-quarters of creative freelancers tweeted from these places. This confirms the importance of third place for creative freelancers and entrepreneurs which are likely to be visited for social interactions and professional networking as much as (if not more) for consumption. The clustering of tweets in ‘meeting spaces’ contributes to the spatial clustering of tweets in central locations in Brighton and Hove (Figure 1). Cultural and leisure spaces have substantially lower counts in tweets each (10% of our whole sample) than ‘meeting spaces’ but almost half of the freelancers tweeted from these urban amenities (49% and 48%, respectively) over our study period. Together this confirms that urban amenities attract creativity (Clark et al., 2002).
We expected a certain relevance of coworking spaces because recent literature has highlighted their role in cities for creative freelancers and entrepreneurs reflecting the need to connect with other creatives (Spinuzzi, 2012). We also found in our internet-based search a relatively high number of coworking spaces in Brighton and Hove (see the Classification of Places section) given Brighton and Hove’s population size (290,400 in 2018). 5 In total, we could assign 5% of tweets to coworking spaces which is substantially less than other third places in our classification indicating that perhaps the emphasis in the literature on coworking spaces as spaces of social interactions for creatives may be exaggerated. However, more than one in four of creatives in our sample tweeted from a coworking space. One explanation may be that creative freelancers did not frequently go to coworking spaces or went there for some events rather than using them more frequently as work sites or for networking. Another explanation could be that they were not tweeting as much whilst there. Because coworking spaces attract some creatives primarily for social networking (Merkel, 2015), they may not engage with social media whilst being in a coworking space.
We find tweets from libraries and community centres in our data although on aggregate the proportions of tweets from these places is low. However, one in six freelancers in our sample has visited these places which gives them a certain relevance as third place for economic creativity. Similarly, natural amenities have a low aggregate tweet count but they are used by almost one in six creative freelancers.
Previous work on the creative industries in cities has highlighted the importance of suburban areas and residential homes from which some creatives run their businesses (Gornostaeva, 2008; Kiroff, 2017). More than one-third of tweets (37%) originated from residential areas in our sample. This is a substantial proportion of tweets, and in total five out of seven freelancers tweeted from residential/home locations.
Transport facilities feature in our data. Public spaces, to contrast, are rare places in our study from which creative freelancers and entrepreneurs tweet which suggests that ‘mobile spaces’ and the often-cited trend towards ‘working on the move’ are relatively infrequent based on our data.
Furthermore, some freelancers used educational and health infrastructure which includes in our data colleges, school and dentist surgeries which could mean that some freelancers worked in schools whilst some tweeted when waiting for a dentist appointment. Tweets from commercial services and buildings are relevant in our data when the numbers of freelancers who tweeted from these places are considered. It could be that freelancers worked for clients, had own business premises or tweeted whilst shopping.
We checked seasonal changes to account for the fact that tweet activity from outdoor locations and mobile spaces may be fewer in winter months compared to summer months. However, there is little variation in the ranking of the derived place categories in our data with a strong prevalence of tweets from ‘meeting spaces’ and residential/home locations throughout the year (see supplementary documentation).
Combinations in tweet places
Most freelancers in our sample tweeted from more than one type of place in our classification whilst just above one in five freelancers (23%) tweeted only from the same type of place, most often only from residential/home locations (11% of freelancers) or only meeting spaces (6% of freelancers) whilst the remaining place categories were rarely exclusively used for tweeting. To better understand creatives’ spaces of practice, we therefore further explored the place combinations of their tweets using k-means cluster analysis (see the Identification of Combinations of Places section). The resulting pattern is shown in Table 2.
K-means clusters.
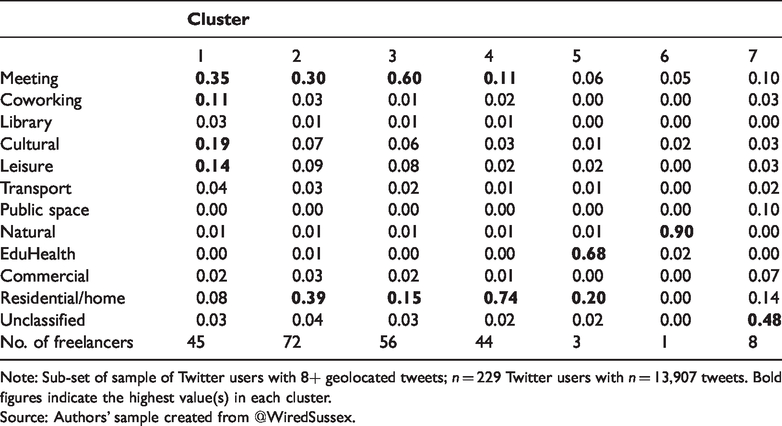
Note: Sub-set of sample of Twitter users with 8+ geolocated tweets; n = 229 Twitter users with n = 13,907 tweets. Bold figures indicate the highest value(s) in each cluster.
Source: Authors’ sample created from @WiredSussex.
The first cluster represents an urban amenities-type of freelancer who is attracted to cafés, bars, restaurants (meeting spaces) and cultural and leisure amenities. This type, who strongly resembles ‘bohemian’ preferences associated with the ‘creative class’ (Florida, 2002), also shows the highest attraction to coworking spaces in our sub-sample of users with eight and more geolocated tweets. The second cluster, which is numerically most prevalent in our data, combines residential/home locations with meeting spaces to almost the same proportions of their overall tweets. Contrasting this type are two further clusters; a third cluster of creative freelancers who mostly tweet from meeting spaces and much less often from residential/home locations whilst a fourth cluster tweets predominantly from residential/home locations and sometimes also from meeting spaces. A fifth cluster, although only represented by three freelancers in our sub-sample, combines educational/health facilities with residential/home locations. This combination of residential/home locations and other places further confirms the relevance of residential/home locations in the spatial tweet patterns.
One cluster consists of only one person in our sub-sample who has a strong preference for natural amenities. A small relevance of natural amenities also featured in the aggregate analysis of the whole sample (Table 1). A last cluster cannot be further classified with our data as tweets fall into places that we could not further classify. The number of freelancers falling into this cluster is relatively small.
Conclusion
Through using Twitter data and a city-based freelancer network in the creative/digital industries, we studied the location of economic creativity of freelancers and entrepreneurs in the creative industries in a novel way. Rather than being fixed in place, our research design allowed us to study the various places creative freelancers and entrepreneurs use in the city which revealed a greater variety and spatial dispersal of creativity than previously assumed using firm or occupational data and cluster approaches to locating creativity. Previous research has tended to follow a binary pattern of concentration of creativity in city centre locations versus suburban locations (Brennan-Horley, 2010; Gornostaeva, 2008). However, our findings highlight that creatives move around and work and socialise in different places including in residential neighbourhoods.
‘Big’ social media data allowed us to generate a sample of economic creativity that is substantially larger (n = 451 creative freelancers and entrepreneurs) than those used in previous studies based upon primary research data. Existing secondary data with information on self-employed freelancers (usually employment surveys) would also not allow lower city-level analysis due to relatively small numbers of freelancers in national samples. Our novel methodology therefore proved to be appropriate for studying economic creativity in a selected city and to address our first research aim. The freelancer tags we developed (Python code provided as a supplementary document) can be used in further research that is not limited to the freelancer network used in this study, for example the tweet content could be used to investigate further people–environment relations of creatives and how freelancers and entrepreneurs use space for their professional identities.
There are limitations though for spatial urban analytics due to the common issue that only a small fraction of tweets are geolocated. While we were able to generate a sufficient sample of freelancers in the creative industries for studying locations of tweets within our selected city, we were limited in exploring individual-level spatial patterns. It proved infeasible to study daily or weekly mobility patterns. However, our method still enabled us to investigate individual-level patterns in the locations over longer time periods. This allowed us to address our second research aim and to test the extent to which creative freelancers and entrepreneurs are attracted to urban amenities. We could identify a type of freelancer and entrepreneur who tweeted from urban amenities (cafés, restaurants, bars, art galleries, theatres and entertainment venues) and to a certain extent also from coworking spaces. The typology we generated was used to look at thematically different groups of creatives in terms of the types of places they tweeted from. A further line of analysis would be to look more explicitly at the geographical distribution of our different creative-types to better understand whether these different types of creatives were associated with different places within the city.
We identified creative freelancers and entrepreneurs who were using Twitter as professional online persona. However, using Twitter data, we were unable to identify tweets that captured the practice of ‘being creative’ or tweets obviously about creative work. As such, our data capture the locations inhabited and traversed by creatives but not necessarily the locations from which they ‘work’ in the sense that they were producing services or goods or new ideas in these places. However, since freelancers and entrepreneurs tweeted from these places as professional online persona, these places represent the spaces of practice of economic creativity in a broader sense including socialising/networking and mobility. Rather than purely for ‘quality of life’ or ‘lifestyle’ reasons as some creative class literature suggests (Bille, 2010; Clark et al., 2002), we revealed several ‘third places’ of creative practice (including libraries and community centres) that may be used by creatives for various reasons that directly or indirectly feed into their work. To this end, our methodology may have ideally captured the reality of creatives’ work practices in a city which are often a blend of work and non-work spheres and identities (Cockayne, 2016).
Where people work and hence creativity is located in the city have radically changed due to the Covid-19 pandemic. Our research, conducted before the pandemic outbreak, revealed besides proximity to urban amenities, spatial patterns of economic creativity that incorporate residential locations with no commercial activity close-by which are therefore likely to be people’s home locations. Whilst our findings suggest that local economic development should support the creation and maintenance of attractive places of social interactions across the city to foster creativity and innovation in the pre-Covid-19 landscape, this now seems more relevant than ever. This may include coworking spaces away from dense city centre locations and ‘pop up’ coffee shops in residential neighbourhoods.
Supplemental Material
sj-pdf-1-epb-10.1177_2399808320980745 - Supplemental material for Locating creativity in the city using Twitter data
Supplemental material, sj-pdf-1-epb-10.1177_2399808320980745 for Locating creativity in the city using Twitter data by Darja Reuschke, Jed Long and Nick Bennett in Environment and Planning B: Urban Analytics and City Science
Footnotes
Acknowledgments
This paper has greatly benefitted from discussions with and practical help provided by Susan Halford. We are extremely grateful for her contributions. We are also grateful to Samantha Cookings and Andy Harfoot (University of Southampton and GeoData) for pointing us at the ONS workplace classification and the OAWZRATIO variable in particular. We also would like to thank Donald Houston for comments on an earlier version of the paper.
Declaration of conflicting interests
The author(s) declared no potential conflicts of interest with respect to the research, authorship, and/or publication of this article.
Funding
The author(s) disclosed receipt of the following financial support for the research, authorship, and/or publication of this article: This study was funded by the European Research Council, the Starting Grant WORKANDHOME (ERC-2014-STG 639403).
Notes
Author Biographies
References
Supplementary Material
Please find the following supplemental material available below.
For Open Access articles published under a Creative Commons License, all supplemental material carries the same license as the article it is associated with.
For non-Open Access articles published, all supplemental material carries a non-exclusive license, and permission requests for re-use of supplemental material or any part of supplemental material shall be sent directly to the copyright owner as specified in the copyright notice associated with the article.