
Abstract
After the fall of the Berlin Wall, Central Eastern European cities (CEEc) integrated the globalised networks characterised by hierarchical interactions between cities. This article aims at revisiting the core-periphery and spatial diffusion of innovations paradigms among CEEc within multi-level interurban transnational company networks regardless of CEEc size in 2013. This article contributes to confirm that in spite of presenting less complex economic functions than the large urban centres, medium-sized and small cities, still involved in relations from the communist past, are bottom-up drivers of future innovations. These cities should be targeted by regional policies to reach the polycentric model of urban systems promoted by the European Union.
Keywords
Introduction
Cores are associated with high wages, technology and profit inputs and outcomes. Geographically, these processes have tended to concentrate and segregate, producing places with either core or peripheral domination processes (Fujita and Thisse, 2002). According to theories of polarisation of Hirschman (1958) and Myrdal (1957), the peripheral character represents an economic delay caused by the absorption effects determined by great agglomerations. The theory of hierarchical diffusion of innovation (Hägerstrand, 1967; Pred, 1977) explains how new activities and social practices are captured first by large cities with the information level, financial support, productive structures and employment skills required to adopt them at an early stage of development. Although these innovations tend to percolate down the urban hierarchies, they provide slightly higher benefits in terms of economic returns and social capabilities to the cities that took initial advantage of the adaptation (Pumain et al., 2006; Zdanowska et al., 2020).
Central Eastern European cities (CEEc) defined for this article as cities of post-communist countries part of the European Union since 2004 (Bulgaria, Croatia, Czechia, Hungary, Poland, Slovakia, Slovenia and Romania) are generally considered as peripheral within the European urban system (Pascariu and Ţigănaşu, 2017). They present distinct metropolisation gradients than the Western European cities (Pumain and Rozenblat, 2019). Recent findings prove the existence of an urban and economic West-East divide within Central and Eastern Europe (CEE) itself not depending on city-size, but rather on CEEc geographical distance to the Western European border (Zdanowska et al., 2020). This reveals the complexity of urban processes and the importance in the current globalisation of analysing cities as systems composed of flows and networks (Batty, 2013). The reduction of transportation costs, the development of new communication technologies and the dematerialisation of the economy make transnational networks of firms’ relevant research objects.
Among the interurban networks, those built by economic links defined by ownership of capital between firms in CEE have been given limited attention in the literature. Śleszyński (2007) has conducted work on foreign control functions of Polish firms. This kind of analysis for the whole CEE at city level is indeed rather scarce (Rozenblat and Di Lello, 2014), or concerns specific sectors only, e.g. the automotive sector (Bohan, 2016). Other existing literature is generally based on national or regional level analysis or for large cities only. Many studies on CEE threat of the arrival and the amount of foreign direct investment (FDI) in separate countries only (Hilber and Voicu, 2010; Pavlínek, 2004). Apart from being static, these studies use very different methods and are similar to monographs (Turnock, 2005). Many of them are of econometric nature (Karaszewski, 2004; Pakulska and Poniatowska-Jaksch, 2004) and employ models based on aggregated data at national or regional level (Da Silva Duarte and Simões, 2017) or for large cities only (Wójcik et al., 2018). As a result, it is difficult to make a coherent comparison between cities in CEE, and conduct a study of their interactions with other cities. In addition, it is essential to include all types of cities regardless their size in order to formulate appropriate policy recommendations especially that one of the criteria of polycentric urban systems fixed as a model for balanced regional development by the European Union is equal economic connectivity for small, medium-sized and large cities (ESPON 1.1.1, 2005; Geppert, 2009; Zdanowska, 2016).
This article aims at examining CEEc urban functions within multi-level ownership links between transnational firms in 2013. First the size of CEEc is examined within different orientations of interurban ownership links to question whether it is a determining factor for the highest revenues generated by FDIs resulting from the ownership links. The general patterns of the networks, but also the economic specialisation of CEEc involved in these links will be analysed, while considering the role of small, medium-sized and large cities regarding each of these aspects. We wish to test if as a result of a core-periphery structure and diffusion of innovations, smaller cities are better integrated at more regional scales – acting as potential bottom-up drivers of innovation in the future – compared to larger ones capable of competing with world-wide cities. To do so, this article will be organised as follows: materials and methods, followed by the results and finally a discussion section. This article extends the prior literature by tackling the core-periphery and diffusion of innovation paradigms in CEE by considering all types of CEEc regardless of their size, which is relevant to target gaps in urban policies formulated at national or European Union level.
Materials and methods
Two different sources are combined to explore CEEc urban and economic functions: Population of cities in 2011 defined as urban agglomerations with a common and harmonised definition of boundaries of cities from TRADEVE database constructed at University Paris 1 Panthéon-Sorbonne for the entire European Union (Guérois et al., 2019). For CEE, 29 large (more than 250,000 inhabitants), 185 medium-sized (50,000-250,000 inhabitants) and 620 small cities (10,000–250,000 inhabitants) are analysed (Supplemental File 1]); Ownership links between firms in 2013 aggregated at city level (within TRADEVE boundaries) from ORBIS database produced by the Bureau Van Dijk, listing all companies, located outside CEE, owning capital of CEE companies in all types of sectors. Additionally, information about CEE companies controlling the capital of other firms in CEE, but also outside CEE, is available (Zdanowska et al., 2020). The uniqueness of ORBIS is to provide data at city level, on both companies controlling capital and on companies they own, for the eight CEE countries considered.
These variables permitted the reconstruction of ownership links between cities where companies are localised and to understand which CEE cities are the most concerned by these links. A decomposition of the ownership links was carried out and led to the identification of capital control chains of several levels, according to the following scheme: a foreign firm (level N) controls the capital of a firm in CEE (level N-1). The latter itself owns the capital of another firm (N-2 level) in other cities of CEE, European Union, the post-communist space and outside Europe (Supplemental File 2). The orientation of the links is determined by the origin and destination of the firm in N and N-2. The three-level subnetwork of multinational firms and their ownership links in CEEc contains 2312 firms and 1562 ownership linkages. We have then calculated an index of intensity of the revenues generated by these ownership links at city level called later on ‘FDI revenues’. The latter is proportional to the share of capital owned by the foreign firm and the turnover generated by the owned firm, expressed at the level of the city where the owned firm is located (Śleszyński, 2007). An aggregation of the chains, passing through the same city in N-1, was carried out according to all FDI revenues generated in this city (Supplemental File 3).
In order to understand, which CEEc are most present in inter-regional networks of transnational firms, two indicators of network analysis – the betweenness centrality and degree centrality – were calculated to differentiate their economic functions in the networks. The betweenness centrality computes the number of shortest paths passing through a node (Albert and Barabasi, 2002; Brandes, 2001). It allows to determine the number of times a CEEc in N-1 is a crossing point relaying capital control links towards N-2. The higher this centrality is for the same node, the greater the importance in terms of role of gateway between network levels and diffusion of innovations. This indicator will be a measure of an advanced economic function of a city in the network. The degree centrality indicator counts the number of links passing by a node, while the degree IN counts the number of incoming links (Kawa, 2013). Thus, an important degree, but a weak betweenness centrality, potentially characterises only CEEc receiving ownership links, without relaying them thereafter and presenting less advanced urban economic function in the constructed network.
In addition, we chose to characterise the patterns of the ownership networks regarding their more or less complex morphology in order to evaluate the size of cities implicated in these different structures. The structure of networks is defined by the set of topological, geometric and metric information (Gleyze, 2007). There are many classical measures to characterise the structure of graphs (Parlebas, 1972) – as, for example, the beta index (number of links on number of vertices) or gamma index (number of links on the number of possible links). However, they are regularly challenged because of their limitations when comparing two city graphs – in our case, different capital chains. For this reason, for the purpose of this article a classification has been established of the most representative and recurrent forms of all multi-level ownership networks. Six more or less complex structures of capital control chains were identified: simple or ‘in chain’ (Parlebas, 1972: 8), hierarchical in Y, polygon, star, complex hierarchical and multigroup (Supplemental File 4).
An aggregation into the nine most representative foreign capital control sectors of firms in CEE has been applied. The sectors are the following: car industry (repair and sale of motor vehicles); finance/insurance/banking (life insurance, financial leasing); IT (IT services activities); industry (industrial production of chemical products, cement, textiles, plastics, household appliances, paper); media/advertising/communication (organisation of the television programme, radio, wireless telecommunications activities); real estate/tourism (real estate agency, hotels and similar housing); sales/trade (sale of machinery, chemicals, pharmaceuticals, textiles and food products); services/construction; energy.
Finally, statistical regressions and correspondence factor analysis have been driven to characterise the relationship between CEEc size and the type of networks implication (direction and structure) and economic specialisation. The matrices used are described in the relevant results subsections.
Results
Western CEEc as gateways of interactions
The first results show that four CEE capital cities – Budapest, Prague, Bratislava and Warsaw – are the most important intermediate cities with regard to the orientations of all capital links (Figure 1). This drives to a conclusion upon an extreme division between cities of the Western and Eastern facades of CEE in terms of their economic functions and a core-periphery effect within CEE itself. Budapest is the city with the highest betweenness centrality, followed by Prague, Bratislava and Warsaw. These four cities play the most important role in terms of gateways of capital links between companies and diffusion of scale effects. On the other hand, Zagreb’s, Bucharest’s and Sofia’s betweenness centrality is null, but their degree IN is the highest among all the cities. This means that these cities have only been receiving links. Połkowice, Łódź and many small towns in Slovakia are also in this situation. This division of economic functions of cities is a result of different stages of the process of diffusion of innovation (Hägerstrand, 1967), which affected Western capitals of CEE – Budapest, Prague, Bratislava and Warsaw – in the first place resulting from their geographical proximity with German, Austrian and Italian cities (Zdanowska et al., 2020). Reality is therefore much more complex than predicted by the core-periphery model as the periphery of Europe has itself very different urban dynamics and certain cities act as multiplier effect in terms of innovation within the interdependence between the core and periphery.
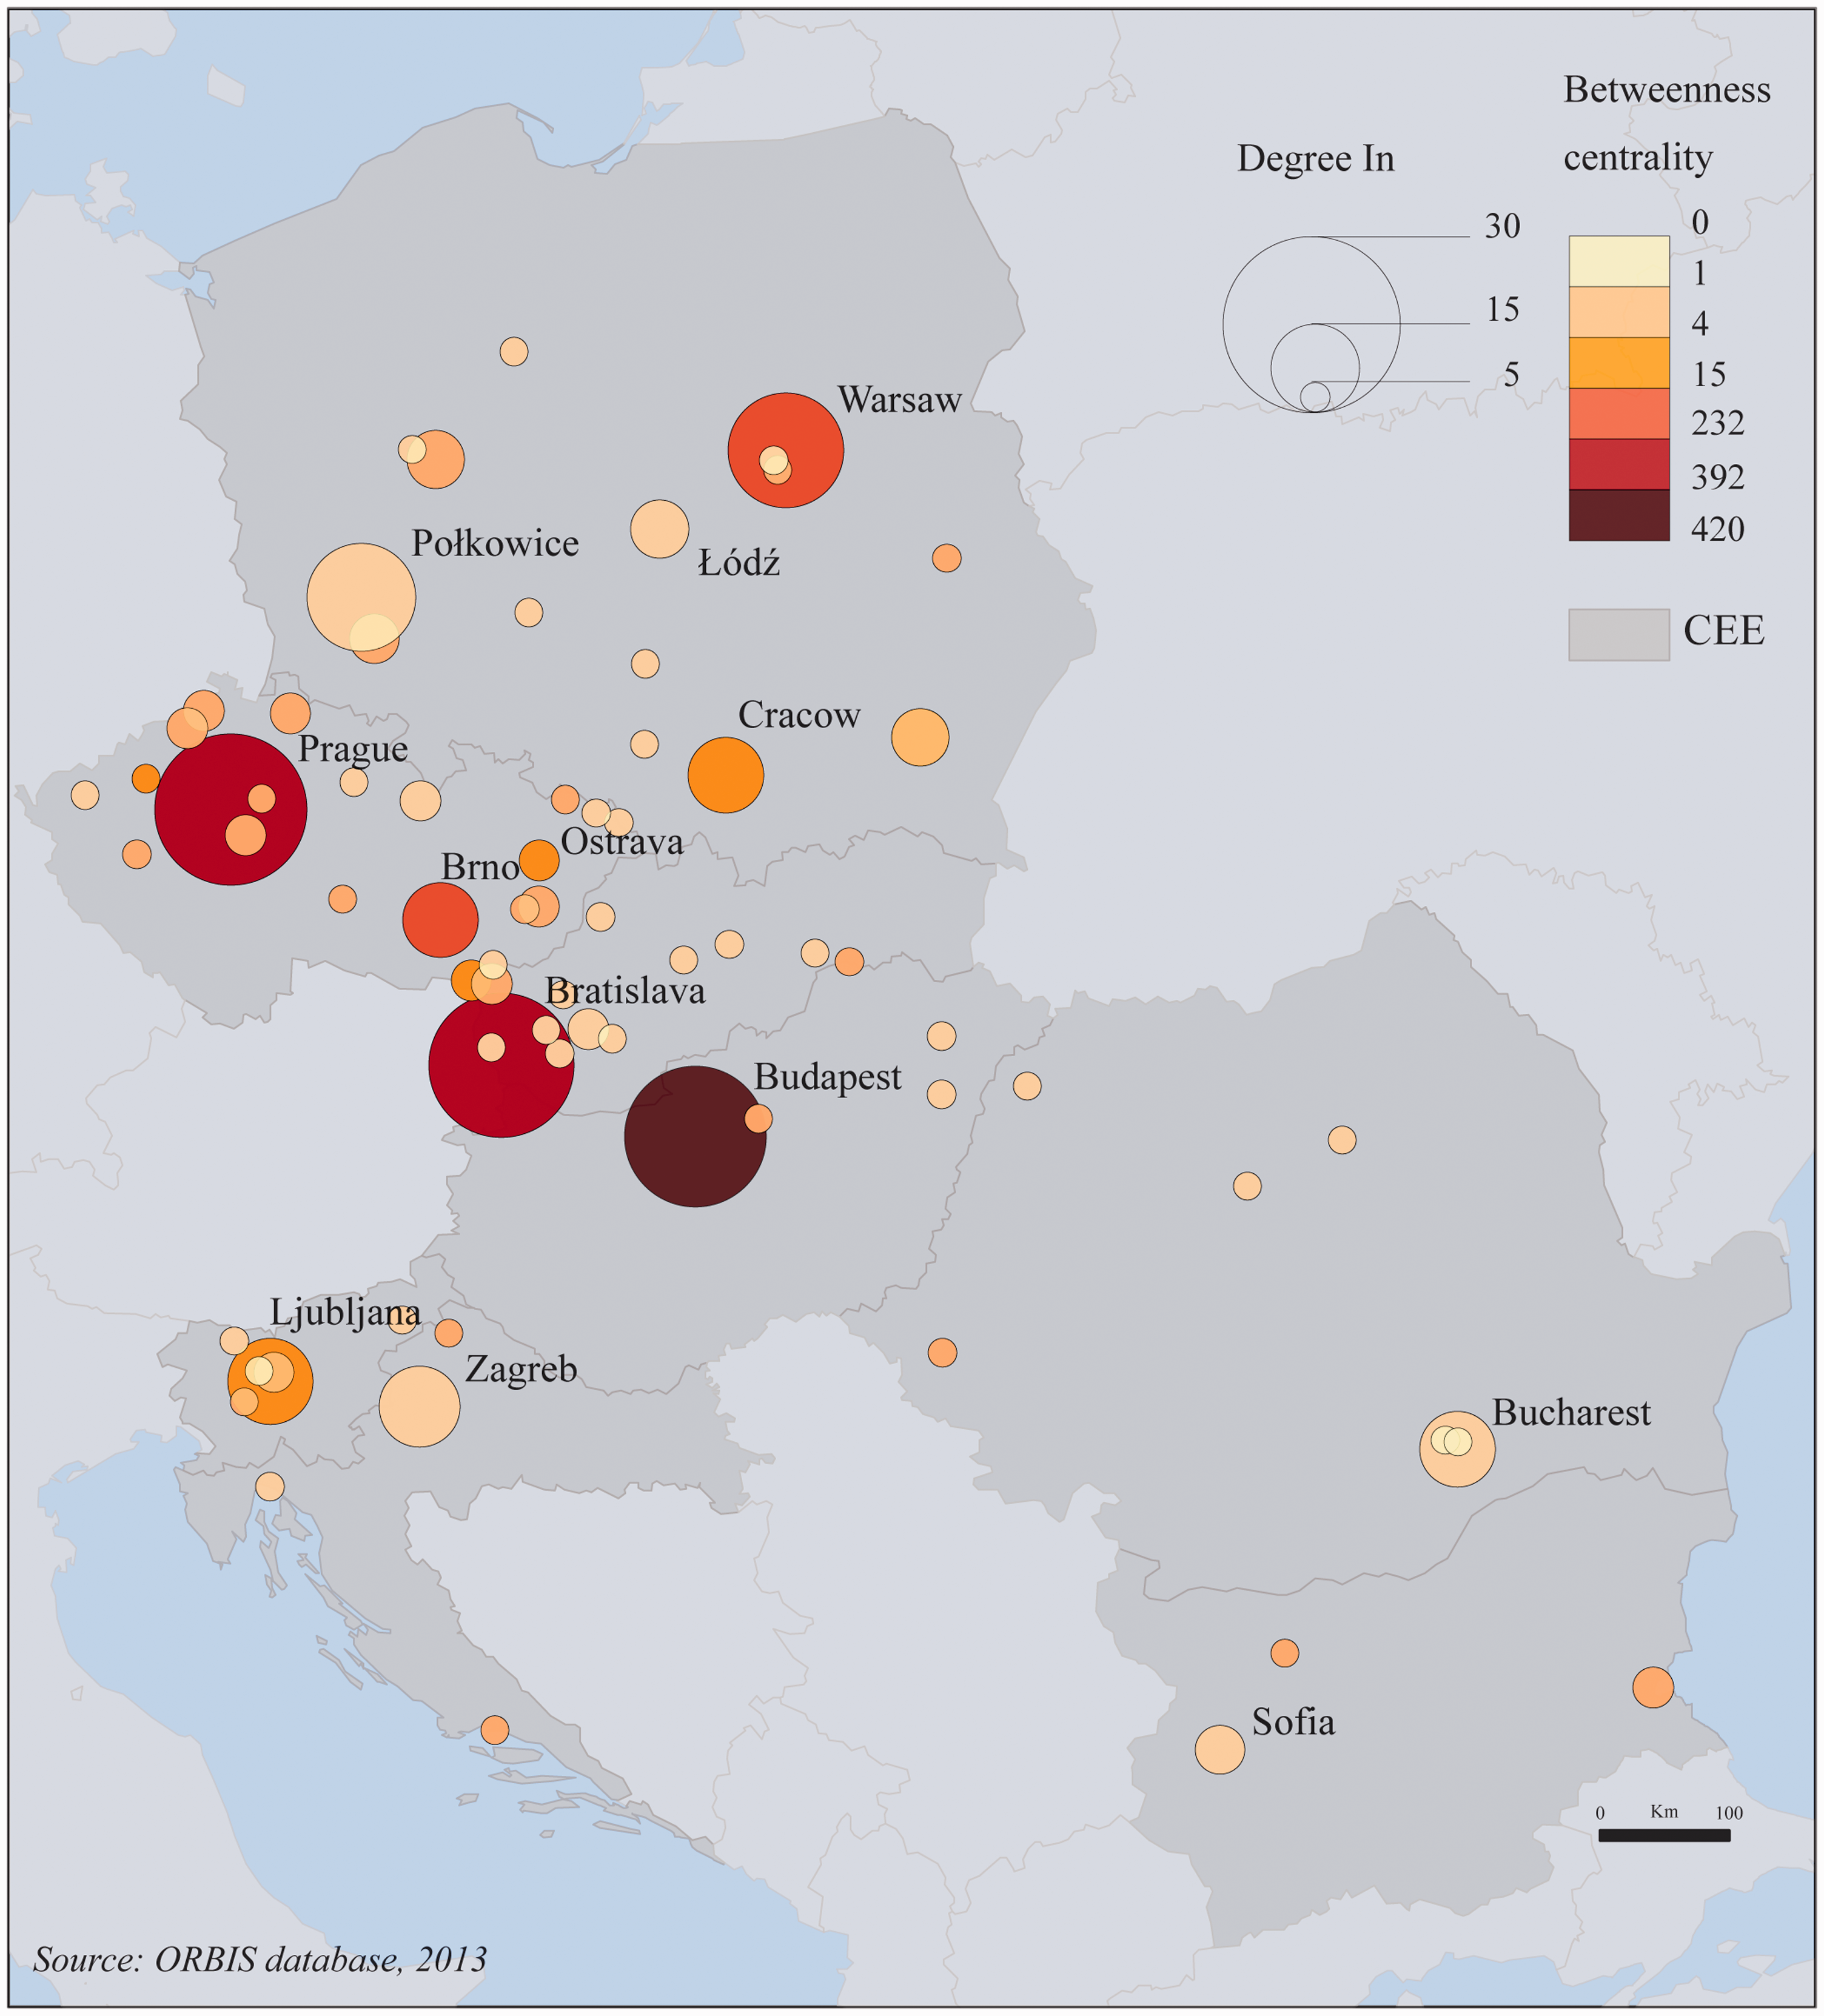
Differentiation of urban economic functions of CEEc: degree IN and betweenness centrality within all orientations of ownership links.
In addition, the decomposition of capital links leads to an important observation: the privileged destination of capital control by firms in CEE at N-2 are other firms from CEE (62% of the total number of links) and not companies in the European Union (26%). Links oriented towards the post-communist space and outside Europe account for 8% and 4%, respectively. In fact, the graph modelling ownership links oriented towards other CEEc (case 1, Scheme 1) is the most important in terms of size: 167 nodes and 456 links (Figure 2 (1). This result is contrary to what the core-periphery model would have predicted as the attraction towards the richest Western Europe – most of the time considered as the core in the model at the European scale – is not the strongest driving force of orientation of interactions. This confirms previous observation and highlights the dynamics of phenomena occurring within the CEE region. The links are mainly concentrated and oriented towards Budapest, Bratislava, Prague and Warsaw. Their betweenness and cumulated FDI revenues are the highest among all cities. Some other chains that are not connected to the main graph generate a significant amount of investment income. This is the case of the links between Seoul (South Korea), Jászfényszaru (Hungary) and Galanta (Slovakia), relative to the Korean group Samsung Electronics, which was at the origin of the largest FDI revenues in CEE in 2013. Finally, some cities with a low betweenness centrality can attract a large amount of investment income as for example, Brno, Ostrava (Czech Republic) and Ljubljana (Slovenia).
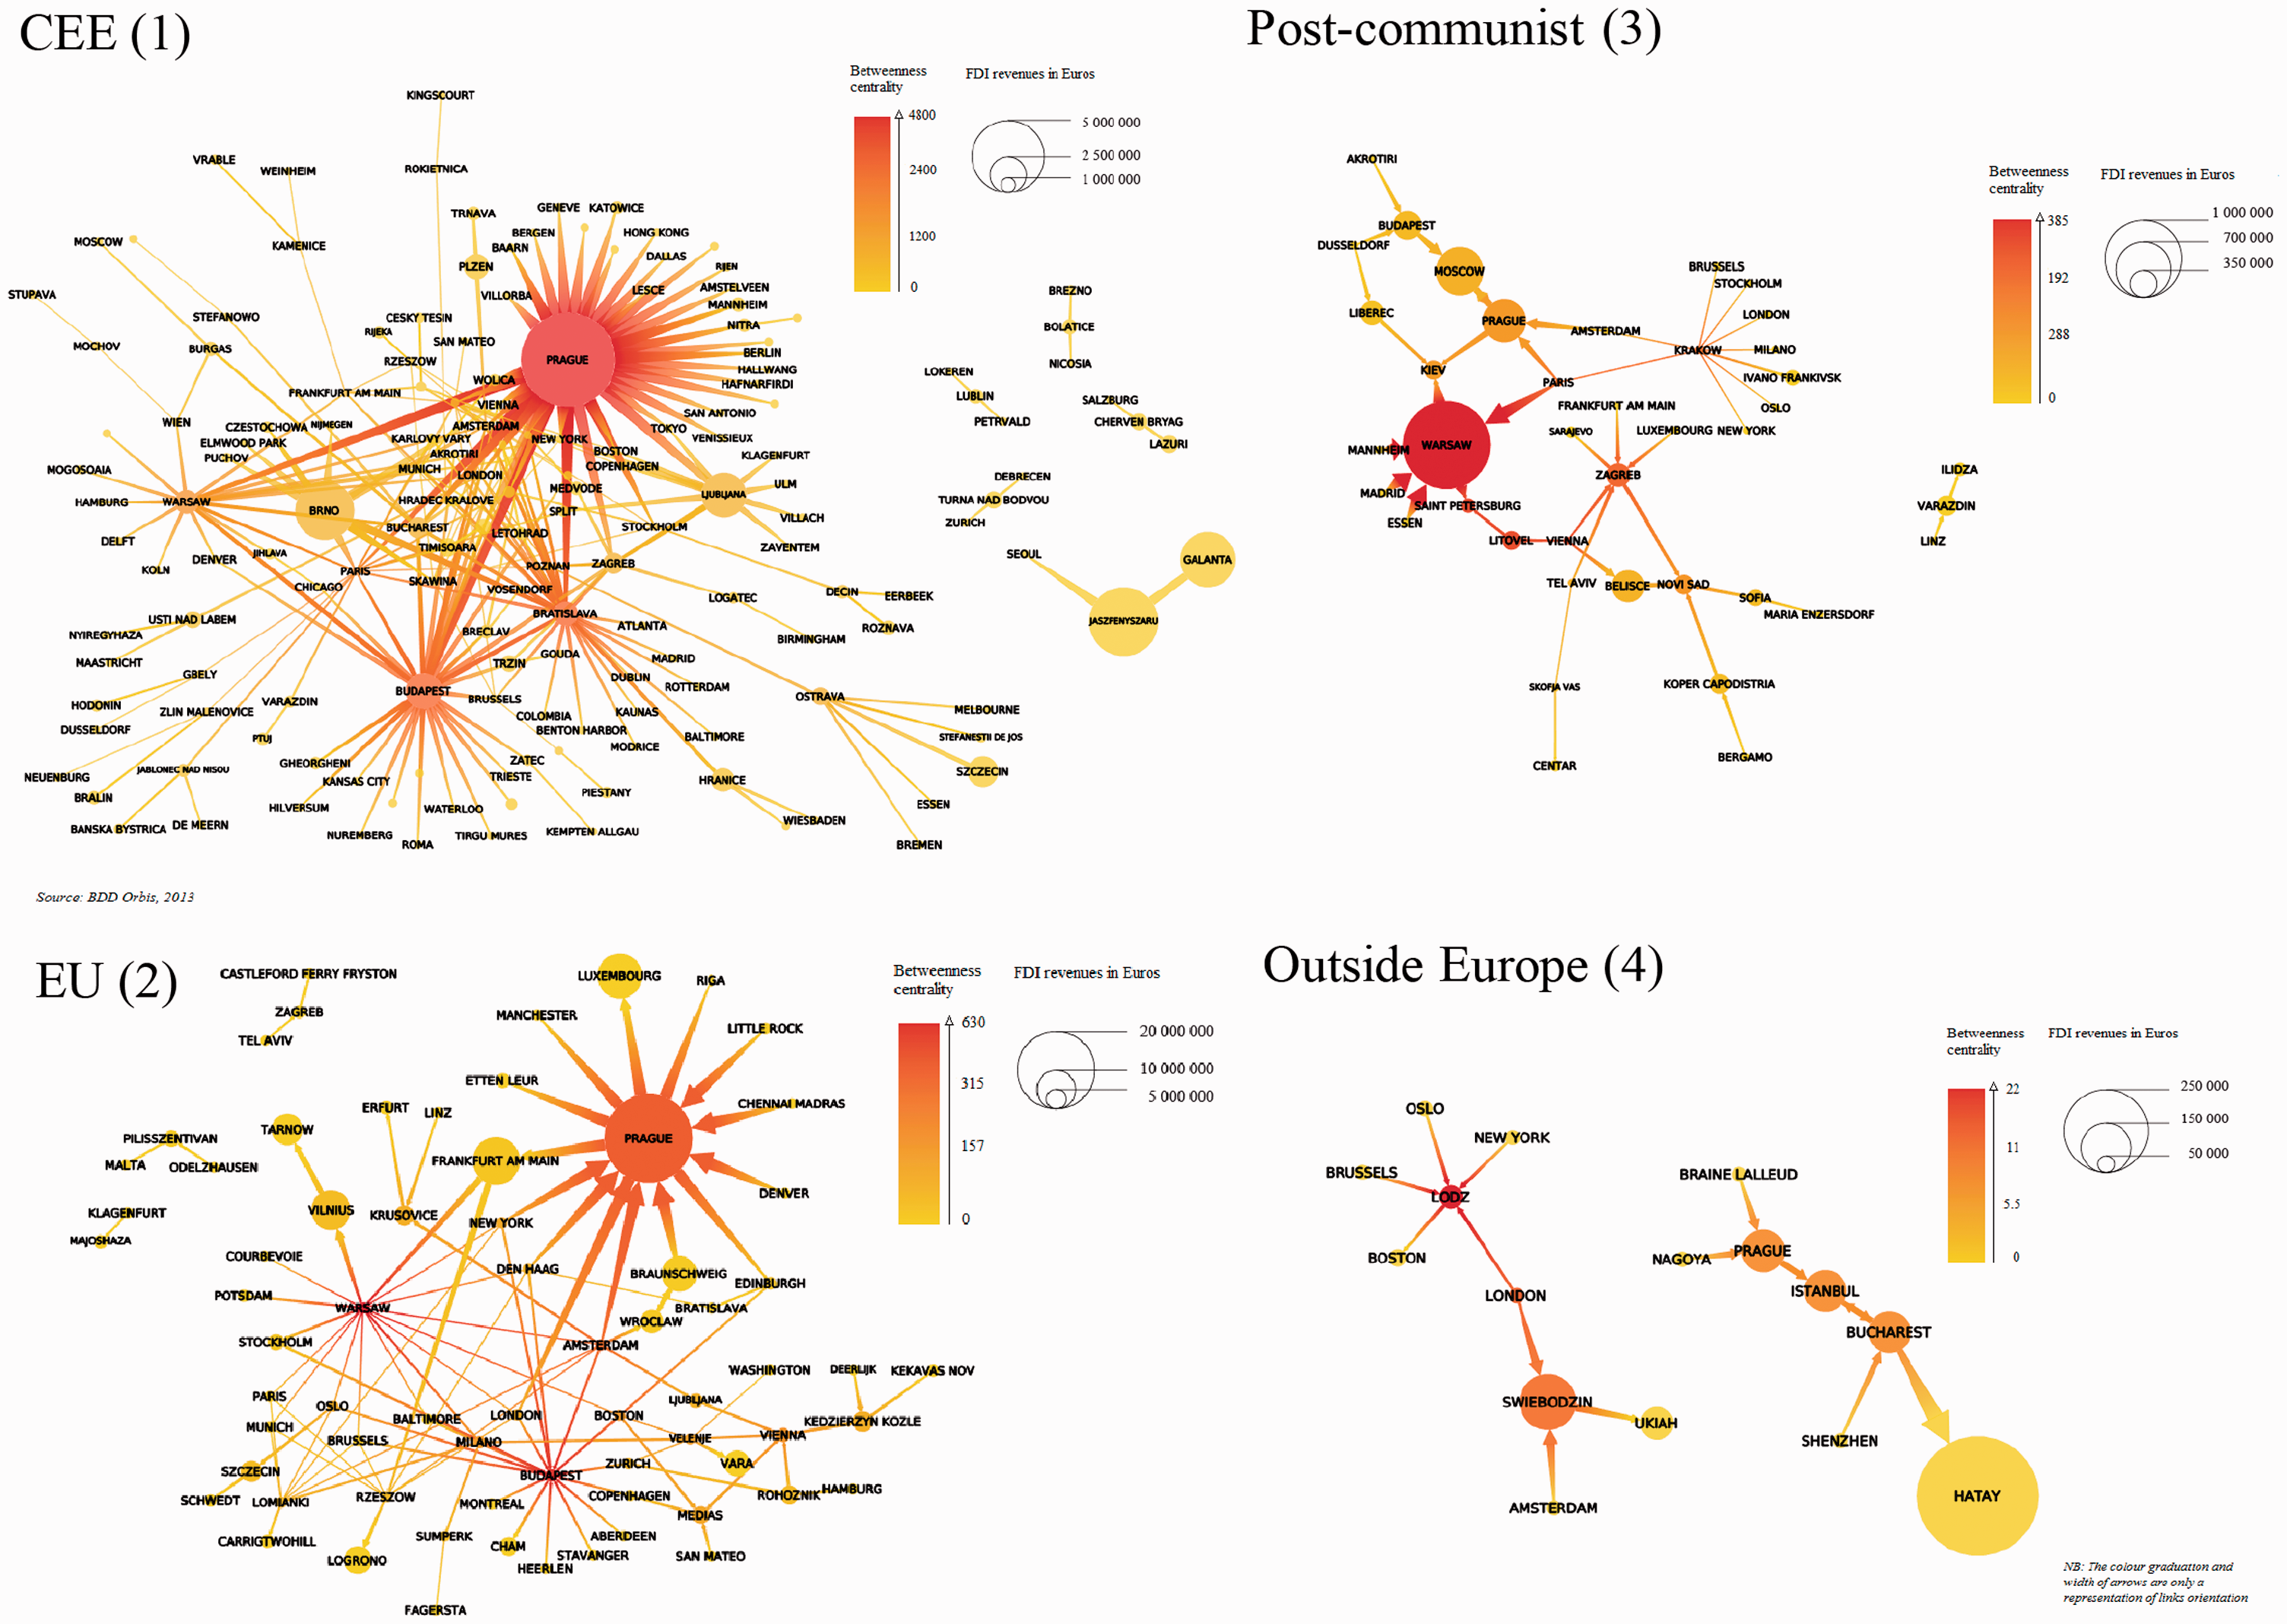
Differentiation of CEEc economic functions within subgraphs of multi-level ownership links oriented at N-2 level towards other cities of CEE (1), European Union (2), the post-communist space (3) and outside Europe (4). Note: The Hachul and Junger's FM3 specialisation algorithm was used for constructing these graphs in Tulip software. When two cities – for example Warsaw and Budapest – are related by a link in two directions, the representation will result in a double-thick link.
Ownership links oriented towards firms in the European Union, excluding CEECs (case 2, Scheme 1) generate four times more FDI revenue than in the previous case, which reflects still a strong ‘core’ effect of Western Europe on CEE, although it represents a smaller graph in terms of size (69 nodes and 205 links). The latter is more polarised on Budapest, Warsaw and Prague (Figure 2 (2)). Prague is a passage node of the largest amount of foreign investment income (about 20m euros), while Budapest is the gateway for the largest number of shortest paths.
The graph of links in the direction of firms in post-communist cities is much smaller in terms of the number of nodes (40) and links (60). It reveals the importance of Warsaw, but also the implication of cities from the south of CEE such as Sofia or those of the former Yugoslavia such as Sarajevo (Bosnia-Herzegovina) or Novi Sad (Serbia) (Figure 2 (3). This confirms that links from the communist past continue being relevant nowadays. Some CEEc (here Belišče, Zagreb and Sofia) are located at the intersection of links between firms in the European Union area (excluding the CEECs) and the former Yugoslavia (Serbia). We therefore, hypothesise that, in some cases, they are gateways between ‘Western’ and ‘Eastern’ Europe, which is a meaningful observation.
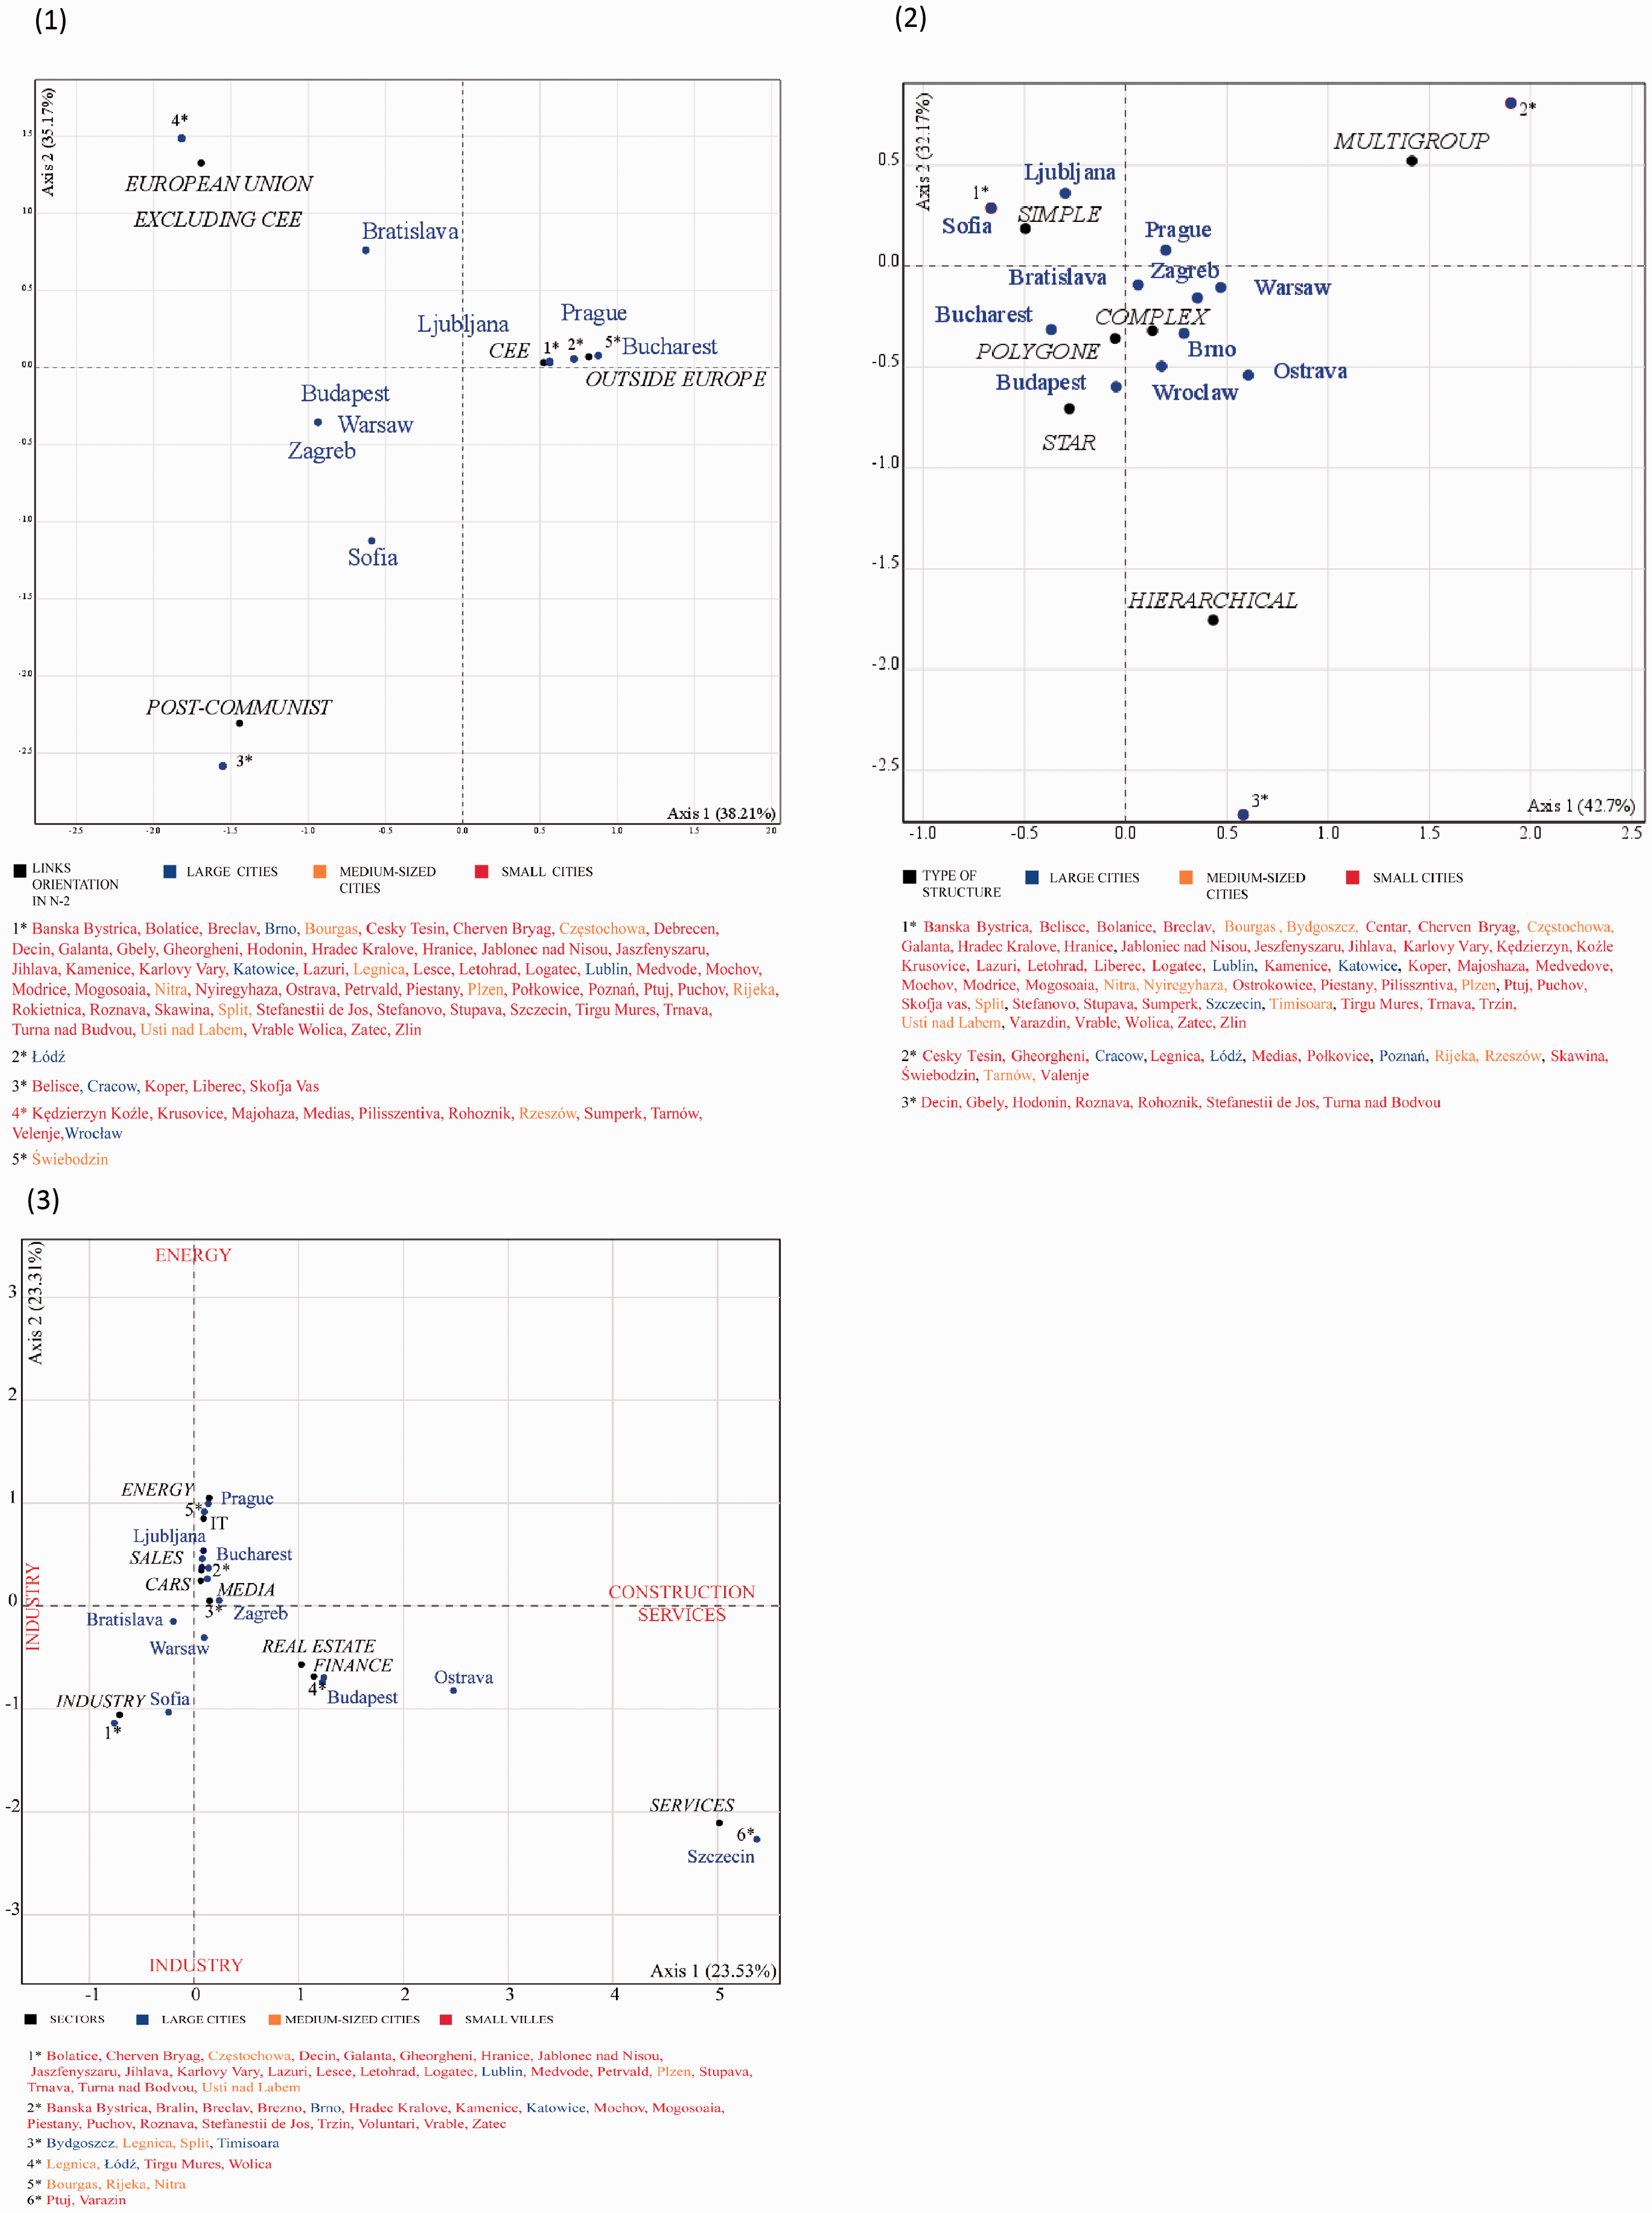
Characteristics of CEEc at N-1 level according to implication in: four orientations of ownership links (1), six structures of ownership networks (2), nine mains economic sectors of firms involved in ownership links (3).
Considering the non-European orientation of the ownership links, only two chains of the capital control are part of the graph (16 nodes and 20 links; Figure 2 (4)). Prague (Czech Republic), Łódź (Poland), but also Świebodzin (Poland) are the most central cities. Łódź, with the highest betweenness centrality, is the headquarters of Pharmena S.A., a pharmaceutical and biotechnology company. It is controlled by General Electric Company (New York) and the Government of Norway (Oslo) – public actors, as well as Aviva PLC (London) and KBC Group SA (Brussels) – private actors. The little amount of ownership links suggests that the CEEc are much less involved in strategies outside Europe, with the exception of Łódź, Świebodzin and Bucharest – absent from the other links orientations. In addition, Świebodzin is a small city, according to our classification (30,483 inhabitants in 2011), which is a type of city not appearing in other graphs’ orientation.
Small and medium-sized cities within interactions from the communist past
The last subsection revealed that small and medium-sized cities are involved rather in smaller networks of ownership links, in terms of generated income. Their role is too often put aside by analysis on global cities (Escach and Vaudor, 2014). To verify if the population of the CEEc is a determining factor of the orientation of interactions within transnational firms’ networks, a correspondence factor analysis was carried out on a matrix of data, counting the number of times a CEE city in N is involved in the different orientations of links in N-2 (Figure 3 (1)). The cities were represented on the two first factor analysis axis as they both represent 73.38% of the information.
Some cities mainly small and medium-sized have links oriented only towards other CEEc – such as Banska Bystrica, Bolatice, Bralin, Breclav or Cesky Tesin (1 *, Figure 3 (1)) – or post-communist ones – such as Belisce, Koper or Cracow (3 *, Figure 3 (1)). On the other hand, large cities, such as Budapest, Zagreb and Warsaw, have links oriented towards European Union areas outside the CEECs, CEE and post-communist areas at the same time. This is not the case, however, for all capital-cities. Ljubljana, for example, is positioned among links oriented only towards other CEEc. Sofia is present in only post-communist and CEE configurations. Bucharest, on the other hand, is characterised essentially by non-European implications – resulting of its proximity to the extra European Union border.
Small towns are the most representative of post-communist, CEE and European Union orientation of links. Medium-sized cities are mostly present in the CEE orientations (Table 1). This shows that large cities are not the only ones attracting capital links from abroad: small and medium-sized cities are also major growth drivers from an integrative and bottom-up approach. Cities such as Banska Bystrica, Bolatice, Bralin and Breclav have succeeded then after the post-communist transition shock to adapt, diversify their functions, and even transform themselves, becoming more resilient (Zdanowska et al., 2020).
Number of small, medium-sized and large cities in N-1 implicated in ownership links oriented in N-2 towards the European Union (EU), Central and Eastern Europe (CEE), the post-communist space (PC) and outside Europe (OE).

This subsection has highlighted the importance of including small and medium-sized cities in globalised networks – although they are not the source of the largest FDI revenues generated. This result confirms the theory of urban innovation diffusion in CEE (Hägerstrand, 1967). In fact, the largest cities in CEE have succeeded to adapt and diversify their urban and economic functions. However, smaller ones are just at a different stage of the innovation diffusion process as they are also part of the international networks.
Size effect and network structure
The classification of the graph structure drove to the results showing that the most recurrent structures are the simple (73 chains from 125) and the hierarchical in Y (46 chains from 125). They are polarised on a central node. As the construction of these chains implies that the node in N-1 is always a CEEc, the majority of the graphs give importance to these cities.
In fact, the star-shaped graph corresponds to the most polarised structure. The central node is an unavoidable passage for all links and its absence would lead to the disappearance of all links. The ‘hierarchical in Y’ structure (Parlebas, 1972: 3) is the next form in terms of the importance of polarisation, followed by the complex hierarchical structure. Conversely, the structure of a ‘multigroup’ graph is a decentralised structure with several central nodes.
To analyse how cities in N-1 are involved in these different structures, we have undertaken a correspondence factor analysis. The latter is based on a matrix of data including all the CEEc in rows, the six types of structures in columns and the number of times N-1 cities are involved in these structures in values. The first two factorial axes account for 74.8% of the total inertia, which is sufficient for further interpretations. The proximity of a city to a type of structure indicates its main implication in this given structure (Figure 3 (2)).
Among the CEE capitals, Prague, Zagreb and Warsaw are rather present in chains of complex or multigroup hierarchical type. Budapest is part of complex hierarchical chains and in the only star structure, Bucharest in polygonal structures, and Bratislava in complex and hierarchical forms. Ljubljana and Sofia are involved in essentially simple type of structures as the other remaining cities. In 97% of cases, these are small or medium towns (69% and 28% respectively; Table 2). Conversely, large cities are the only ones to be all in polygonal or star-shaped structures. They are also the main type of cities present in complex and multigroup chains. The size effect seems to be then relevant regarding the structure of networks. These results fit in the innovation diffusion process, which conducted larger cities to be involved in more complex structures of economic networks compared to the smaller ones.
Small, medium-sized and large cities in N-1 according to the different types of capital chain structures (in %).

CEEc’ economic activity and city-size
Following the same intuition as in the last subsection, we tried to understand if the diversity of economic activity is related to city-size in CEE. In this purpose, to determine the main economic specialisation of CEEc concerned by foreign capital control links, a correspondence factor analysis has been conducted based on a matrix of CEE cities, in rows, and the most respective economic specialisations of the companies in columns (Figure 3 (3)). The most important observation is the existence of certain cities, which are the headquarters of transnational companies specialised in high-technology intensive sectors, such as Prague, while others, such as Sofia, are rather specialised in low technology. Other cities, mainly small as Bolatice, Cherven Bryag, Decin or Galanta (except Sofia), are specialised only in single type of industries, while Warsaw or Budapest are characterised by companies from several sectors.
In fact, cities where automotive firms are located are mainly large ones (72% of cases), the media sector (75%) and real estate (100%; Table 3). Firms in the IT sector are exclusively located in large and medium-sized cities, with an identical distribution. In contrast, firms in the industrial sector are, in more than half of the cases, small urban centres (53%), and in 20% of the cases, medium-sized towns. The same structure is characterising the sales sector (50% small, 21% average). A clear size effect can therefore be identified on the scale of the global value chain, ranging from the most innovative service sectors in the case of large cities to the low value-added industries, for small towns. This confirms the diffusion of innovations theory.
Share of small, medium-sized and large cities by N-2 firm sectors of ownership links (in %).
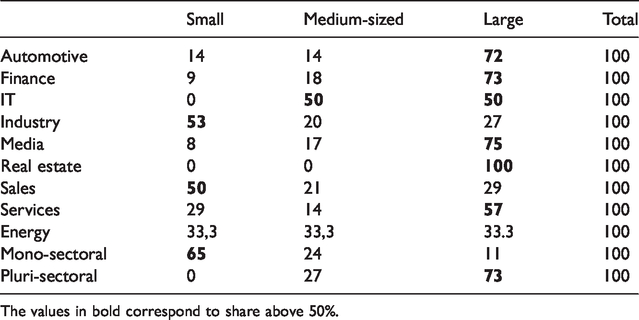
The values in bold correspond to share above 50%.
In addition, large cities are mainly pluri-sectoral (73%), as are some medium-sized cities (27%), while small cities are only mono-sectoral – and in 65% of cases in our sample (Table 3). The mono-specialisation of cities, in a type of activity, results from a new cycle of innovations having ‘specifically selected a particular group of cities by specialising them in relation to the rest of the urban system’ (Bretagnolle and Pumain, 2010: 8). With regard to the CEEc, during the industrial revolution it has concerned small towns in the old mining and steel basins of Silesia, but also in the big industrial cities created during the communist period. The multi-sectoral cities are mainly capital cities. The latter are also the ones that gave birth to new technologies of the nineteenth century, stimulating the development of high-level services, particularly in the automotive sector (Pavlínek, 2019).
Discussion
This article aimed at observing urban and economic functions of CEEc within ownership networks of firms in 2013 by distinguishing the role of large, medium-sized and small cities in order to revisit the core-periphery and diffusion of innovations paradigms in the context of CEE.
A strong opposition has been revealed between cities of the Western and Eastern facade of CEE in terms of centrality measures in networks. Budapest is the city with the highest betweenness centrality, followed by Prague, Bratislava and Warsaw. These are playing the most important role in terms of gateways of capital links between companies. All other cities are mainly only receiving or are at the origin of ownership links. This observation has been confirmed within different orientations of links, although small and medium-sized cities – as Banska Bystrica, Bolatice, Bralin and Breclav– are more present in the post-communist and Central Eastern European orientations of ownership links. This highlights the importance of including these cities in globalised networks in terms of an integrative and bottom-up approach as they are the major growth drivers of the future. They should be one targeted by regional development funds of the European Union in order to reach the polycentrism model in Europe (ESPON 1.1.1, 2005).
Further analysis showed a differentiation between, medium-sized and large cities, according to several aspects. In terms of ownership networks structures in which cities are involved in N-1, small cities are mainly present in simple ones, while large cities are involved in more complex networks (hierarchical, star). Moreover, in terms of the economic specialisation of firms, small and medium-sized cities are mainly mono-sectorial and specialise in the low-intensive industry, while larger ones are multi-sectoral and specialised in high-intensive sectors as finance and media.
We thus spot a size effect that oscillates along the global value chain of the economy, ranging from the most innovative service sectors for large cities to the low-intensive industry for smaller cities. All these results confirm the theory of urban innovation diffusion (Hägerstrand, 1967). In fact, mainly the largest cities in CEE have succeeded to adapt and diversify their urban and economic functions. However, smaller ones are not excluded from globalisation processes and are just at different stages of the innovation diffusion.
The article’s results on extreme oppositions between CEEc also permit to open a discussion regarding the application of the core-periphery model in the context of CEE. The analysis has revealed that some dynamic cities such as Budapest, Warsaw, Bratislava and Prague play an important role at the European scale as gateway between the ‘West and the East’. Other smaller cities from the Eastern facade of CEE still remain mono-sectoral, which confirms the diffusion of innovation paradigm and the fact that larger cities remain privileged comparing to the smaller ones. This drives to the conclusion of existence of several cores and peripheries in Europe and more specifically within Central Eastern Europe itself which confirms previous findings regarding population dynamics (Zdanowska, 2020; Zdanowska et al., 2020). These results provide significant insights for filling the gaps of regional policies of the European Union. Policy makers should put emphasis on the development of medium-size and small cities in CEE as Banska Bystrica, Bolatice, Bralin, Breclav, Łódź and Cracow – presenting relevant economic function within ownership networks – in order to reduce the gap between Warsaw, Prague, Budapest, Bratislava and the rest of the cities. This falls into the polycentrism model of the European Union and the idea behind structural funds developed unfortunately at regional level only.
Supplemental Material
sj-zip-1-epb-10.1177_2399808320977863 - Supplemental material for Central Eastern European cities within multi-level transnational company networks: cores, peripheries and diffusion of innovation
Supplemental material, sj-zip-1-epb-10.1177_2399808320977863 for Central Eastern European cities within multi-level transnational company networks: cores, peripheries and diffusion of innovation by Natalia Zdanowska in Environment and Planning B: Urban Analytics and City Science
Footnotes
Declaration of conflicting interests
The author(s) declared no potential conflicts of interest with respect to the research, authorship, and/or publication of this article.
Funding
The author(s) received no financial support for the research, authorship, and/or publication of this article.
Supplemental material
Supplemental material for this article is available online.
References
Supplementary Material
Please find the following supplemental material available below.
For Open Access articles published under a Creative Commons License, all supplemental material carries the same license as the article it is associated with.
For non-Open Access articles published, all supplemental material carries a non-exclusive license, and permission requests for re-use of supplemental material or any part of supplemental material shall be sent directly to the copyright owner as specified in the copyright notice associated with the article.