
Abstract
This research examines two major phenomena that have driven the transformation of cities in Central and Eastern Europe (CEE) following the fall of communism: intensive urban sprawl and population decline. Using a quantitative methodology to examine the patterns and dynamics of built-up areas and population in 93 cities from CEE, the article assesses their transformation between 1990 and 2018. The findings show that, while there are overall similarities in the dynamics of built-up area and population changes in CEE cities, there are also notable differences that vary by country, city size, proximity to Western Europe and economic attractiveness.
Introduction
Urbanisation is a global phenomenon that has brought significant changes to the social, economic and built fabric of cities. In the post-socialist cities from Central and Eastern Europe (CEE), the fall of communism and the transition to a market economy presented unique challenges that had a profound influence on the urban landscape. Urban planning stopped suddenly being the responsibility of the state and CEE cities became affected by market forces that are more volatile and difficult to control, such as land prices, privatisation or real estate dynamics. The transition from communism to a market-based economy resulted in rapid urbanisation as people moved from rural to urban areas in search of work and a better quality of life, leading to the development of larger cities. At the same time, many smaller cities in CEE experienced population declines as they struggled to adapt to the changes brought about by the shift to a market-based economy. The processes and institutions that govern the transformation of Western cities were now in play in CEE cities, but often applied in a way that initially resulted in structural and organisational chaos in places with a strong legacy of centralised planning (Brown, 2007; Enyedi, 1992; Stanilov, 2007c). As a result, when describing the post-socialist city from CEE, the literature frequently acknowledges (uncontrolled) urban development as one of the key outcomes of the transition to a market system.
However, and despite the growing recognition of the significance of these issues, as well as the intensity of transformations, there have been few in-depth studies that measure the impact of this sudden transition across cities in CEE, focusing on the interplay between population decline and urbanisation. The current literature tends to concentrate more on the spatial change processes rather than specifically targeting them. Although population loss leading to shrinking cities has been prevalent in CEE since the fall of communism, most of the emphasis is on the socioeconomic implications rather than the relationship between built-up area growth and population decline. However, there were early indications of this shrinking cities phenomenon before the fall of the Berlin Wall as urban population growth had already slowed across CEE since at least 1980, following a post-war period of steady urban boom (Haase et al., 2016c). Furthermore, the presence of urban sprawl and urban shrinkage is not surprising when the socialist legacy is considered. The forced relocation of population to new single-function cities in communist times was followed by structural crises as well as extensive deindustrialisation and suburbanisation trends – particularly in the larger cities – after the demise of communism (Wu et al., 2022b). More recently, the demographic decline of many cities in CEE has been exacerbated by the persistent emigration to Western Europe and spatial polarisation processes. One could make the argument that cities in CEE are following the same urban development patterns as their Western counterparts: industrialisation, deindustrialisation and suburbanisation. From this perspective, they are then bound to face the same dynamics and issues. Nevertheless, it should be noted that cities in Western Europe and the United States experienced the aforementioned processes gradually, over a much longer period of time. Cities in CEE, in contrast, have seen these processes unravel much more rapidly and in a more dramatic fashion. They are, then, bound to face more divergent phenomena within a particular historic context, which evokes and implies path dependency (Kubeš and Kovács, 2020; Musil, 1993). It all ultimately comes down to the ongoing discussion between the two schools of thought – historical versus ecological – over whether or not the notion of the post-socialist city stands (Hirt, 2013).
By addressing the divergent growth of built-up areas in relationship to the population loss, this study will provide valuable insights into the dynamics of urbanisation in CEE cities over the last three decades. In particular, the study will focus on the analysis of the demographic and built-up area dynamics of 93 post-socialist cities in CEE. To standardise the analysis, the spatial unit of analysis employed is the functional urban areas (FUAs) developed by the Organisation for Economic Co-operation and Development (OECD) (OECD, 2013). A FUA is defined by the European Union (EU)-OECD as a geographical area consisting of a densely populated city and its surrounding commuting zone or metropolitan area. A FUA consists of the city and its surrounding municipalities or localities, where there are strong commuting flows between the city and these areas due to work, education, services and other daily activities (Dijkstra et al., 2019).
Using a quantitative approach to compare cities across CEE, the aim is to connect the dynamics of the urban fabric to the dynamics of the population in order to uncover what trends and patterns have characterised both since 1990. The aim of connecting the dynamics of the urban fabric to the dynamics of the population is a crucial one, as it can provide a more holistic view of the changes taking place in CEE cities from 1990 to 2018, enriching the existing literature on urban shrinkage and urban sprawl in CEE and better informing the urban planning strategies in the region.
The article is structured as follows. The first section will provide a thorough overview of the existing literature on the demographic and spatial development in CEE since the fall of communism. This will help to expand on the current understanding of the topic and provide a basis for the main hypothesis driving the analysis. The next section will present the European Environment Agency (EEA) and European Commission (EC) spatial and demographic datasets used in the analysis. Additionally, the quantitative methodology used in the analysis will also be outlined. The results sections will present and assess the findings of the analysis on the spatial growth of post-socialist CEE cities in the face of population decline, drawing on the literature and emphasising the study’s contribution. The final section summarises the findings on the similar, but also distinct, patterns of urban growth and shrinkage in the post-socialist cities from CEE.
Post-socialist urban development in Central and Eastern Europe: Between extensive urbanisation and population decline
As Sýkora and Stanilov (2014) highlight, cities in CEE have undergone remarkable transformations after the fall of communism, reflecting the region’s specific political and socio-economic histories. Scholarly research on post-socialist urban development often focuses on the socio-economic and political factors that have driven changes in these post-socialist cities, with less attention paid to the specific spatial implication of these shifts. Urban sprawl, in particular, has been a major focus of research due to its widespread occurrence in many post-socialist cities (Cirtautas, 2013; Ianoş et al., 2016; Nuissl and Rink, 2005; Schmidt et al., 2015; Siedentop and Fina, 2012) being driven by a combination of economic, demographic and political factors, including the transition from a planned to a market-based economy, the growth of the middle class and the expansion of the automobile-based transportation network.
Suburbanisation has been one of the most significant changes in post-socialist cities in CEE, and, as such, is the most analysed change of post-socialist cities in the literature (Hirt, 2007; Kok and Kovács, 1999; Ouředníček, 2007; Soaita, 2013; Tsenkova and Budic, 2006). The transfer of powers from the state to local authorities, the lack of planning agencies and institutions (at least in the early years) and the legislative ambiguity that followed the fall of communism created a situation in which suburbanisation was able to flourish (Stanilov and Sýkora, 2014). The inadequate and low-quality housing conditions inherited from the socialist era, combined with the fact that there were no more restrictions on population movements and the rise of individual housing preferences, led to a growth in demand for suburban housing (Stanilov, 2007a, 2007b). Moreover, the rapidly growing differences in land and rental prices between the city centre and the outskirts, as well as the motorisation of households, further fuelled suburbanisation, as people sought to escape the high costs and congestion of the city centre in favour of more spacious and affordable housing in the outskirts (Robert, 2011).
Nevertheless, the CEE countries are also affected by a constant population decline (Batog et al., 2019; Wolff and Wiechmann, 2018). The consequence of this is that they have one of the highest incidences of urban shrinkage, with several key factors having contributed to the phenomenon. The population decline in many CEE cities is largely a result of declining birth rates and increasing out-migration, particularly among young people and working-age adults (Haase et al., 2016b; Rink et al., 2014), but it is also a result of the declining economic opportunities and a lack of investment in many (smaller) urban areas, due to the economic restructuring following the transition from socialism (Cortese et al., 2014; Haase et al., 2011, 2016c), as well as being a result of the absence of effective planning and regulatory frameworks in many CEE cities (Rink et al., 2014; Scott and Kühn, 2012). While it is not a phenomenon unique to CEE, with European Western countries, the United States and China also affected (Wu et al., 2022a), CEE is one of the most affected regions in terms of the evolution of urban shrinkage (Haase et al., 2016a), which has resulted in numerous studies aimed at determining its prevalence and trends. Existing literature focuses on identifying trends and patterns of urban shrinkage in CEE, but the focus is usually either on a specific large city (Szafrańska et al., 2019) or, if an overall analysis is conducted, on a specific category of cities (Constantinescu, 2012; Pirisi and András, 2015). There are fewer studies looking at different city sizes across a country (Bănică et al., 2017; Eva et al., 2021; Musiał-Malago, 2016) or across CEE (Haase et al., 2016c; Steinführer et al., 2010). Underrepresented is also the analysis of both spatial and demographic trends across CEE, while taking into account the entire range of city sizes (Kazimierczak and Szafrańska, 2019; Schmidt, 2011; Schmidt et al., 2015). This narrow focus limits our ability to draw broader conclusions and insights about the dynamics of urbanisation in CEE. It is important to conduct more comprehensive and multi-scale studies to better understand the complexities of population decline and urbanisation in CEE cities.
Against this background, this research draws upon a variety of case studies in CEE and investigates the patterns of growth and/or decline in built-up areas and population by carefully addressing causes and effects specific to this group of countries. The goal is to see whether they have similar or divergent patterns and values, and if there is any clustering at the regional or national level.
I emphasise that, despite overall widespread growth in built-up areas across all CEE countries, demographic growth unfolds in gradients, with notable variations between different city sizes. Furthermore, as larger cities are more integrated with the West, I anticipate a more dynamic urban development the larger the size of the city in CEE.
Data and methodology
Data
The analysis of the dynamics of post-socialist cities’ built-up areas between 1990 and 2018 is based on data from two sources: the EEA’s Imperviousness database and the EC’s Global Human Settlement Layer (GHSL). The Imperviousness database provides raster images that show the spread of built-up areas in 2006, 2009, 2015 and 2018. However, the lack of data for the years between 1990 and 2006 makes it insufficient for a study focused on post-communist urban development. To fill this gap, the GHSL provides raster images derived from Landsat images that map the built-up areas for the years 1990 and 2000.
Both datasets provide information on the built-up areas in Europe and are based on Landsat imagery and other remote sensing data. They have a high spatial resolution of 10 m to 1 km, allowing for detailed analysis of the spatial extent and dynamics of built-up areas. There are, however, some limitations to consider. The spatial resolution is insufficient to capture small-scale features like car parks or private gardens. Furthermore, the datasets lack detailed information about various land-use types, limiting the possibility of more in-depth analysis beyond the overall dynamics of built-up areas within FUAs (Corbane et al., 2018; European Environment Agency, 2018).
In terms of demographic data, the study uses both the Eurostat database and historical population data gathered by the Land Use-based Integrated Sustainability Assessment (LUISA) modelling platform, which was supported by the Directorate-General for Regional and Urban Policy, and aggregated population data at the level of Local Administrative Units by FUA (Kompil and Lavalle, 2016).
Methods
The aim of this research is to analyse the changes in both the spatial and demographic aspects of post-socialist cities in CEE. The study will focus on the evolution of built-up areas and population dynamics in order to understand the similarities and differences that have emerged after the fall of communism. The research aims to answer the following key questions:
Is there a common trend in terms of built-up areas and population growth and decline across CEE cities, or do these dynamics differ depending on city size/location? Are the trends in CEE’s Eastern and Western parts divergent or convergent?
How do the growth rates of built-up areas in CEE cities over time relate to population growth rates, and what role do they play in shaping the spatial and demographic dynamics of these cities? Which phenomenon is more prevalent: shrinking cities or urban sprawl?
Two main indicators were computed to analyse the spatial and demographic dynamics of post-socialist cities at different levels (data dependent) in order to give insights into their development from 1990 to 2018, as follows:
The built-up area growth rate (%) at FUA, country and CEE levels for the following intervals: 1990–2000, 2000–2006, 2006–2009, 2009–2015, 2015–2018 and 1990–2018.
The population growth rate (%) at FUA, country and CEE levels for 1990–2018.
Indeed, in the analysis several intermediate periods are considered, depending on data availability, as well as key events that may have influenced the transformation of cities, such as the post-2007 economic crisis. The time intervals analysed are as follows: (1) the years following the fall of communism, 1990–2000; (2) the years preceding the economic crisis, 2000–2006; (3) the years including the economic crisis, 2006–2009; (4) the rebound period after the economic crisis, 2009–2015; and (5) the period of recovery following the economic crisis and before the COVID-19 pandemic, 2015–2018. Because of data constraints, the first interval is longer than the others, but given that the urban fabric changes slowly and the fall of communism first triggered political, socioeconomic and then urban morphological changes, one could argue that it is a good interval to capture the immediate effect on the urban fabric. Due to data availability limitations for FUAs, the population data were not analysed using the same intervals, and only the overall period was considered. A population-based city typology was used in the analysis, in accordance with the OECD (2013) guidelines: (a) very large cities (those with a population of more than 1,500,000 inhabitants); (b) large cities (those with a population between 500,000 and 1,500,000 inhabitants); (c) medium-sized cities (those with a population between 200,000 and 500,000 inhabitants); and (d) small cities (those with fewer than 200,000 inhabitants).
The study employs a quantitative approach to investigate the particular characteristics of urban development in 93 CEE cities. The focus is on the long-term spatial patterns and dynamics of the urban fabric and population. Firstly, the growth rate of the built-up areas was calculated using the following formula for temporal dynamics:
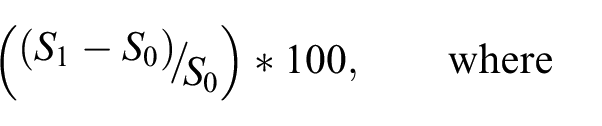
S 1 = the built-up area in the year of analysis, t1, and S0= the built-up area in the initial year, to.
An overall CEE average as well as country average growth rates were calculated to examine if any special trends or similarities could be uncovered. The growth rate for the period 1990–2018 was then computed for each of the 93 cities included in the analysis in order to assess the long-term transformation of the urban fabric in terms of spatial growth.
The population growth rate was also calculated using the same formula as before, but this time the built-up area was substituted for the population in each city.
Moreover, one-way analysis of variance (ANOVA) will be used to test the hypothesis that there are significant differences in the growth rates of built-up areas and population across different city sizes in CEE – specifically, the growth rates of built-up areas and population for very large, large, medium-sized and small FUAs – and whether these differences are statistically significant. In addition to calculating the ANOVA F-test statistic, the p-value will also be calculated to assess the statistical significance of the results. To determine whether there is enough evidence to reject the null hypothesis of equal means, a significance level of 0.05 will be used. One-way ANOVA will also be used to test the hypothesis that there are significant differences in the growth rates of built-up areas and population across different countries in the CEE, following the same reasoning mentioned earlier. Indeed, by conducting a one-way ANOVA, the aim is to determine whether city size or country is a significant factor in shaping the spatial and demographic dynamics of urban growth in this region.
Finally, all of these indicators are used to quantify the patterns and characteristics of post-socialist cities in CEE, and as a means to bring to the surface the dynamics of the urban fabric and population, in an attempt to provide a more holistic understanding of urban growth in the CEE.
Results and discussions
In the first part of this section, the growth rate of the built-up area FUAs at several scales – CEE, country and city level – will be examined. The goal of looking at different levels is to see if the patterns of urbanisation are comparable overall or if there are differences between countries or even within specific countries. In the second part of the section, the built-up area growth rate is compared to the demographic growth rate in order to identify parallels throughout CEE.
Spatial patterns and dynamics of the urban fabric in the post-socialist cities of CEE
When examining the growth rates of built-up areas within FUAs, there are notable differences in growth intensity when analysing intermediate periods. Specifically, the years between 2000 and 2006 displayed the greatest increase in built-up areas, with a growth rate of 42.61%. Indeed, the period 2000–2006 coincided with significant economic and political changes in the region, such as the accession of some CEE countries to the EU, which could have triggered increased investment in urban areas, leading to higher growth rates. Other factors, such as economic growth, demographic changes, technological advancements and infrastructure investment, could also have all played a role. Growth rates were at their lowest between 2006 and 2009, with a growth rate of only 2.21%, coinciding with the onset of the economic crisis. Nevertheless, beginning in 2015, the growth rate regained significant momentum, reaching 12.51%. This suggests that built-up areas within FUAs have continued to grow recently after a period of slower growth during the economic downturn.
This is consistent with Schmidt et al. (2015), who also report a take-off in growth since 2000. Indeed, many countries in the region experienced an increase in economic activity and foreign investment, leading to urbanisation and a rise in demand for housing and commercial properties (Hamilton and Carter, 2005). The 2007 economic crisis had a substantial impact on the pace of urbanisation, as projected, delivering a severe shock for cities in CEE. In the years immediately after the economic crisis (2009–2015), cities struggled to recover the progress made between 2000 and 2006. However, the post-crisis recovery marked a new stage for CEE cities. Many of them showed substantial signs of recovery between 2015 and 2018. These ups and downs in urban performance support Rey’s (2013) concept of asymmetric and asynchronous evolutionary loops that characterise the development of post-socialist countries in CEE. This was possibly a consequence of the convergence of contemporary socio-economic dynamics with past temporalities, namely the socialist legacy that is difficult to reconcile with contemporary forces of the liberal economic market.
Numerous differences between FUAs can also be observed when comparing the built-up area growth rate of each city to the CEE and country average for the period 1990–2018 (Figure 1). First, there is a diminishing North–South gradient, with most Baltic and Polish cities growing faster than the regional average while the rest of the countries were still catching up. In some cases, significant within-country differences are in evidence. This is the case in Bulgaria and Poland, where a diminishing West–East gradient may be detected. This supports the concept of a multi-speed CEE, in which Poland – and, particularly, its Western part – has benefited from its proximity to Germany, in terms of socioeconomic urban revitalisation. This geographical advantage has provided high accessibility, facilitating enhanced economic connectivity and trade between the two regions, having fuelled the economic performance of cities like Wrocław, Gorzów Wielposki, Poznan and Słupsk. Nevertheless, while the proximity to Germany has played a pivotal role, it is important to acknowledge that there are also other factors that have contributed to the higher urbanisation in post-socialist cities in Poland compared to other CEE countries. Firstly, Poland’s historical urbanisation patterns provided a solid foundation for continued urban development. Additionally, Poland’s early and extensive implementation of economic reforms, along with political stability and institutional development, created a favourable environment for urban growth (Stryjakiewicz, 2002). Furthermore, Poland’s urbanisation has been significantly boosted by its EU accession and access to pre-accession programmes such as PHARE (Poland and Hungary: Assistance for Restructuring their Economies) and ISPA (Instrument for Structural Policies for Pre-Accession) (Stryjakiewicz et al., 2012). These initiatives have played a vital role in fostering higher levels of urban development throughout the country, and the access to European structural funds once Poland joined the EU has further propelled the urbanisation process. Indeed, the convergence of these factors has created a favourable environment for urban development, making Poland, and particularly its Western part, prosperous and attractive for investment and development.
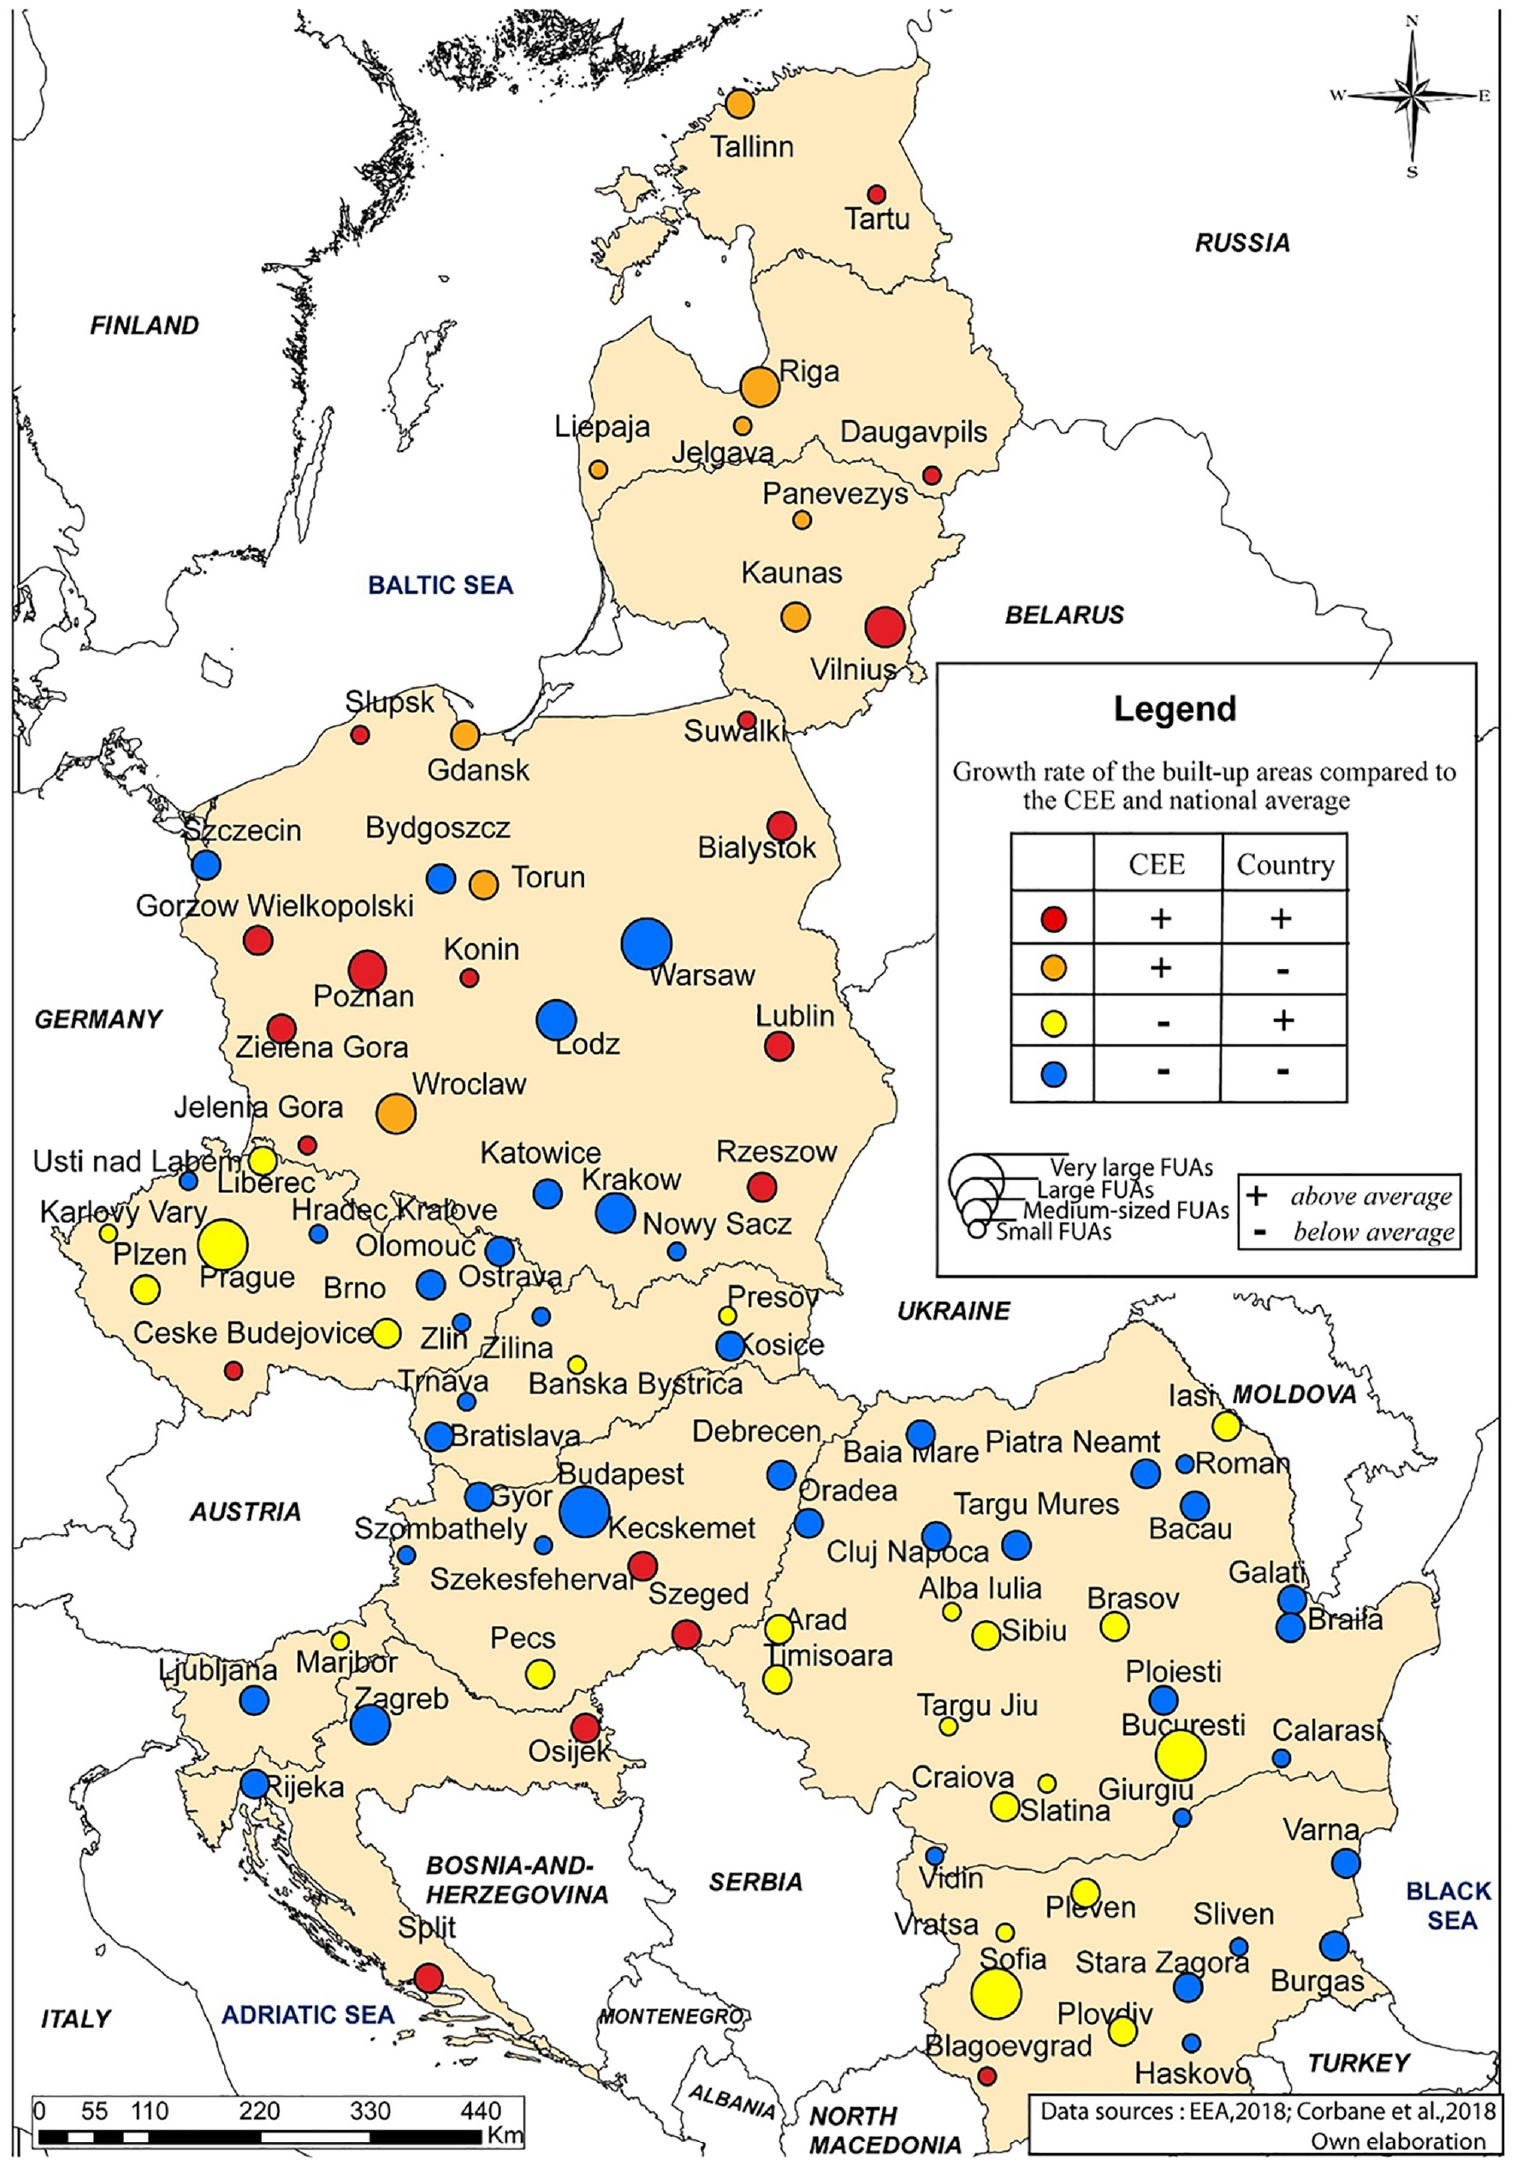
Growth rate of the built-up areas compared to the CEE and national average (1990–2018).
Furthermore, some FUAs within individual countries have built-up area growth rates that are lower than the CEE average but higher than their respective national averages. This highlights the differences that exist within each country, which can be attributed to a variety of factors. Indeed, the status of a city as a capital or major urban centre can contribute to differences in built-up area growth rates within countries. These cities frequently have greater access to resources, infrastructure and economic opportunities than smaller cities. For example, many CEE capital cities, such as Prague in Czechia, Bucharest in Romania and Sofia in Bulgaria, have seen higher growth rates for the built-up areas than other cities within their respective countries. Moreover, geographic features can also significantly impact a city’s spatial expansion. Cities with natural barriers may have limited room for outward expansion (Piatra Neamţ), while those without such barriers (Roman) may have more space to grow but face other challenges related to infrastructure and socio-economic opportunities.
However, the majority of cities fall into the category representing those with values below both the CEE and the national average. Almost half of the cities analysed are in this category. The bulk of cities performing below average can be found in Bulgaria, Czechia, Hungary, Romania, Slovakia and Slovenia. Most of them are old industrial cities, such as Galaài, Ploieşti, Bacău and Oradea in Romania; Györ and Debrecen in Hungary; Ostrava, Brno and Olomouc in Czechia; Krakow and Lodz in Poland; Burgas in Bulgaria; or Rijeka in Croatia. Many of these cities experienced a sustained boom during the socialist era, but quickly fell behind after the demise of communism, as most of them hosted industries which found limited markets in a more integrated capitalist world. In most situations, the closeness of the trajectories is attributable to the economic weight that cities have in the urban hierarchy (Zdanowska, 2018). Cities with a higher built-up area growth rate have been able to either move towards tertiarization and the development of other competitive urban functions (e.g. Wroclaw, Plovdiv, Sibiu, Iaşi and Poznań) or have converted old industrial factories into more productive industries (e.g. Gdansk, Brno, Brasov, Katowice, Białystok and Szeged). Those with a lower growth rate between 1990 and 2018 are generally small or medium-sized industrial cities (e.g. Roman, Giurgiu, Călăraşi, Nowy Sacz, Silven and Vidin), which have struggled to recover after the fall of communism.
Therefore, the overall trend is a rather constant dynamic evolution of the urban fabric in (very) large FUAs, with ups and downs depending on the regional and worldwide socioeconomic context. Namely, these areas attract economic investors due to the multiple socio-economic opportunities they provide, as well as their high accessibility and increased polarising capacity (Rodríguez-Pose and Storper, 2020), factors which support a cycle of urban growth and development. Small and medium-sized cities are, however, still seeking ways to deal with the changes brought about by market liberalisation, with some appearing to be frozen in time, unable to find effective solutions to the crisis caused by the collapse of industries left over from the communist era (Schmidt et al., 2015). This simply serves to perpetuate, if not exacerbate, the inequality in the CEE urban hierarchy.
Spatial and demographic dynamics in CEE post-socialist cities
When built-up area and population growth rates are examined together, it is possible to argue that CEE cities are subject to an unusual combination of urban sprawl, while simultaneously shrinking in population (Figure 2). Around half of the cities in the sample have had a negative population growth rate since 1990. ‘Artificial’ population increase must be noted since it has the potential to misrepresent reality. While population growth in Iaşi is statistically high, it is skewed by factors such as Romanian diplomatic policies and historical ties with the Republic of Moldova, as well as the European Neighbourhood Policy. Many Moldovan citizens register their residency in Iaşi even if they have never resided there, in order to get Romanian citizenship or the benefits associated with residency in an EU member country (Iftimoaei and Baciu, 2018; Tabac and Gagauz, 2020).
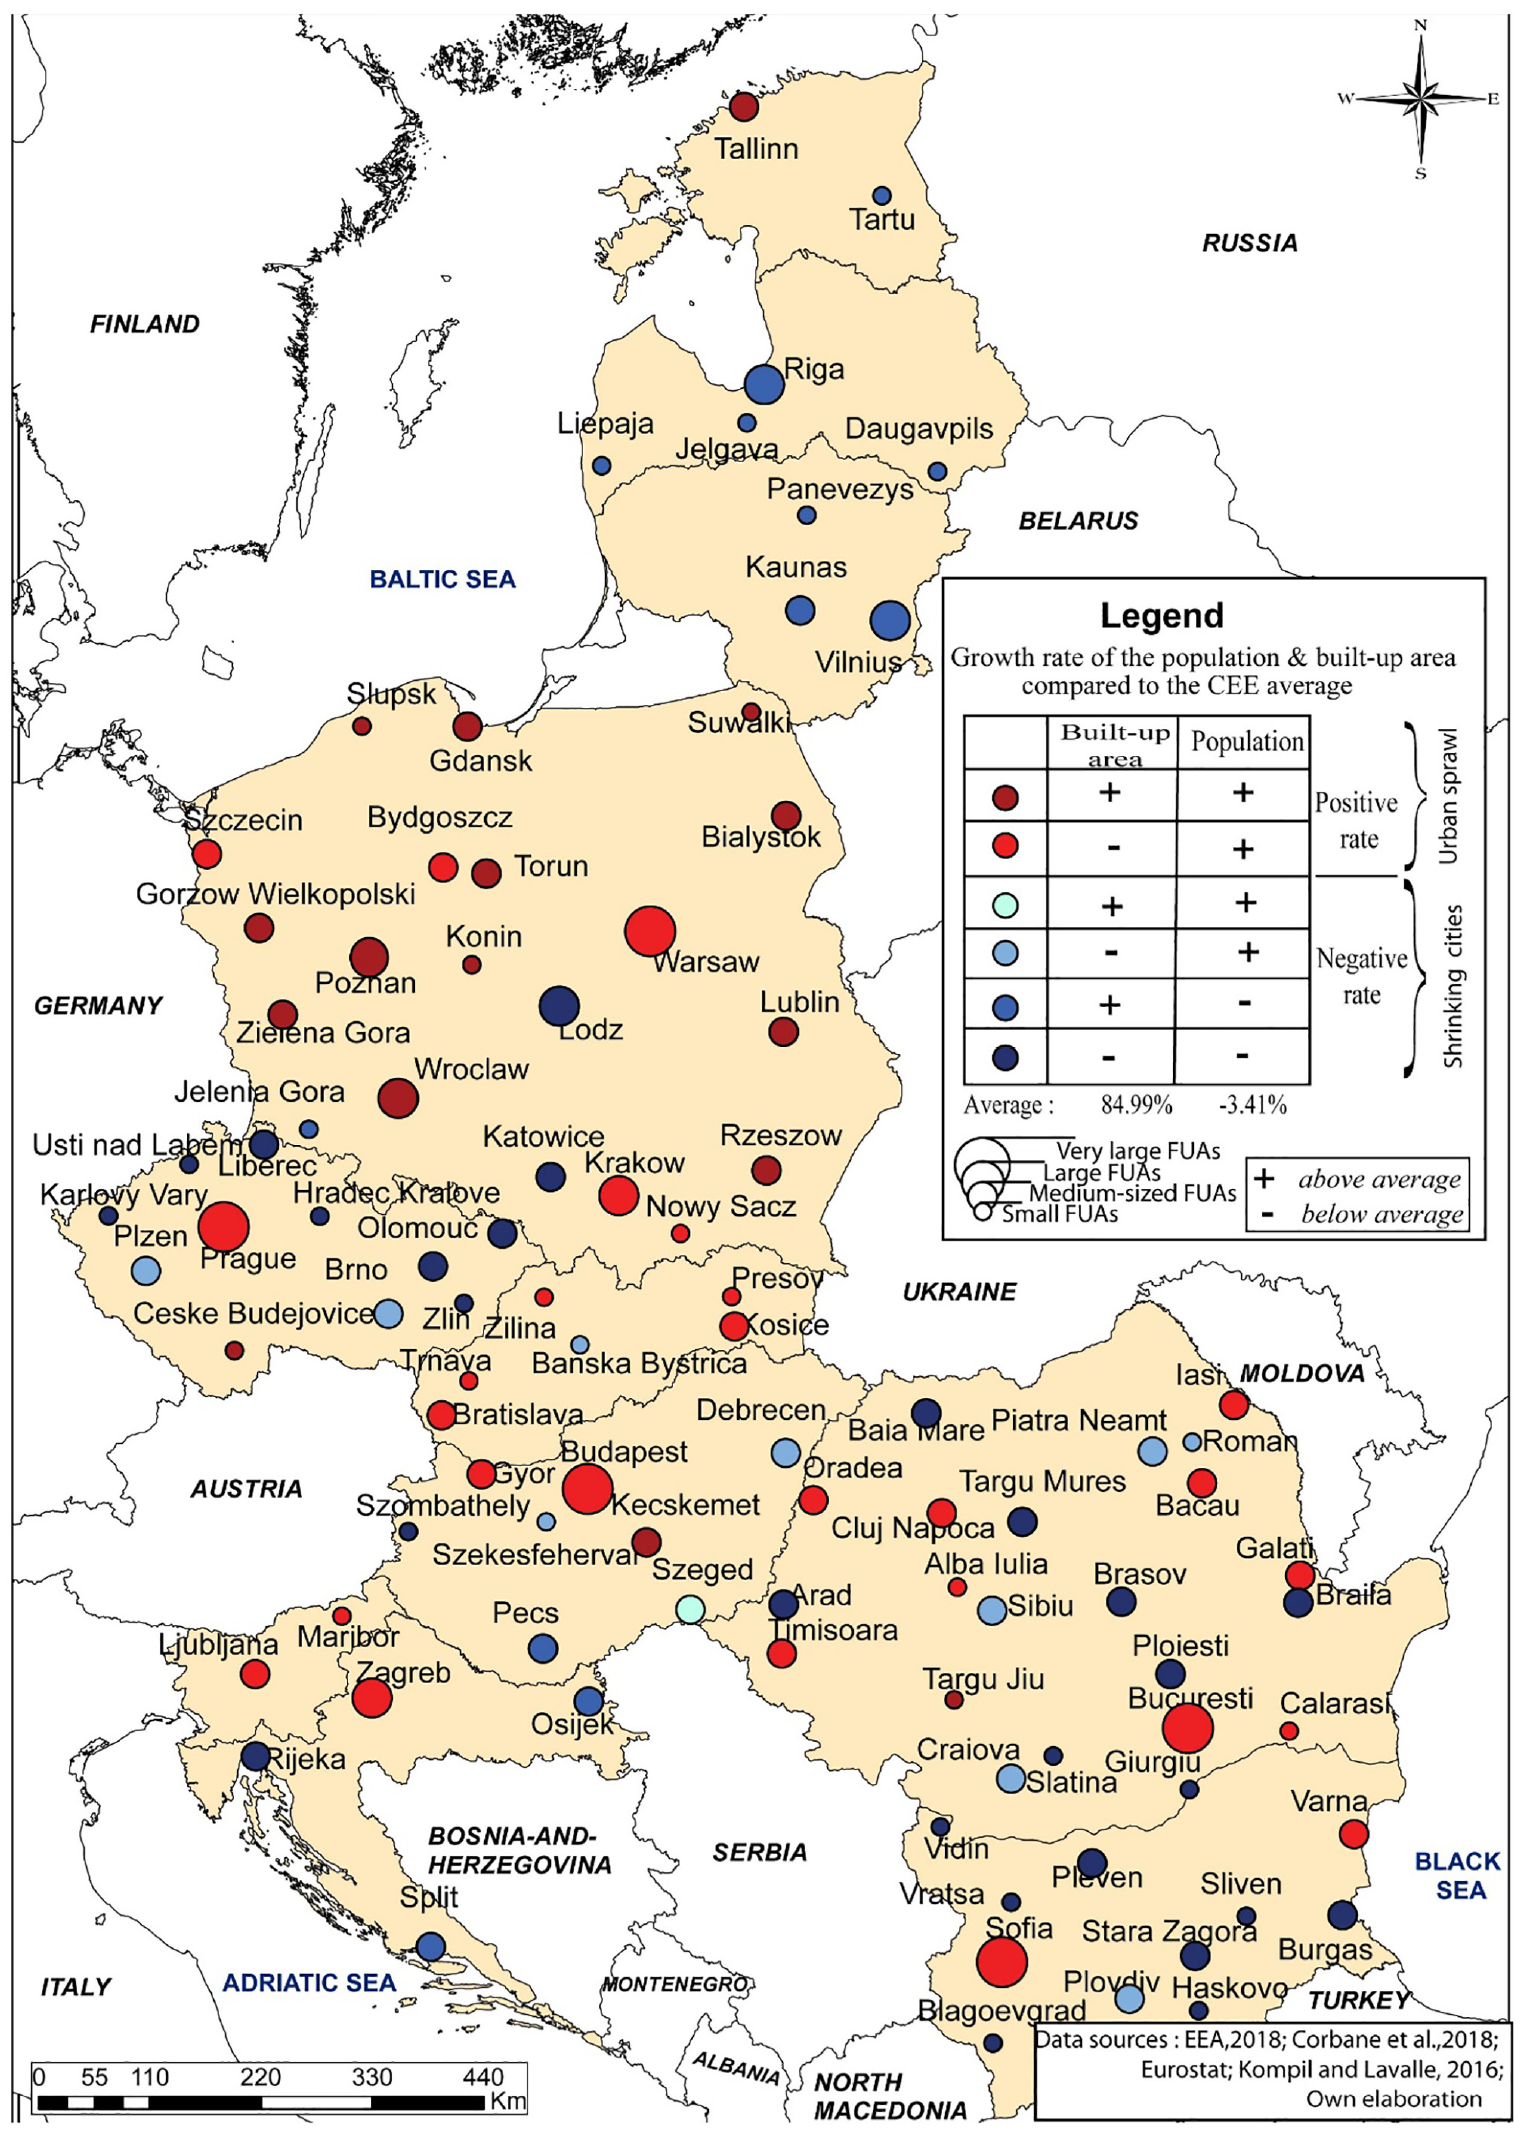
Built-up areas versus population growth in CEE.
Cities with considerable urban growth are dispersed rather evenly across CEE, but the situation varies within each nation, with more pronounced discrepancies in Romania, Poland, Hungary and Bulgaria. These internal differences highlight the primacy of capitals and (very) large cities, while small and medium-sized cities continue to lag behind. CEE capital cities are also experiencing different patterns of growth. Vilnius and Riga stand out as they are experiencing a decline in population but have an increase in built-up area growth that exceeds the CEE average. In contrast, most other CEE capitals are experiencing simultaneous population and built-up area growth, but with a population growth rate that exceeds the CEE average and a built-up area growth rate that is below the CEE average.
Overall, almost half of the cities studied displayed an urban sprawl phenomenon, which means the built-up area grows faster than the population, outpacing it, albeit both are positive. The Baltic countries and Bulgaria are notable exceptions where considerable population decline is still occurring. Indeed, the population decline is more prevalent in small and medium-sized cities, which is to be expected in the context of CEE.
Another essential point to consider is the incidence of shrinking cities. More than half of the cities analysed have experienced a decrease in population while simultaneously expanding their built-up areas (Figure 2). This particular situation may be explained by two main factors. Firstly, Western European companies are attracted to CEE countries due to the availability of cheaper land and labour costs, and they tend to invest in areas with good infrastructure and economic potential (Wroclaw, Poznan, Györ, Plovdiv and Brasov). Secondly, the population decline is largely due to a combination of outmigration (primarily for work) and demographic ageing (Schmidt et al., 2015). The situation is particularly pronounced in the Baltic countries (e.g. Lithuania), which are experiencing both outmigration and population decline, alongside an increase in built-up areas (Cirtautas, 2013). This highlights the complex interplay between economic growth and population dynamics in these regions.
Hence, a clear population decline has not dented or contributed to a decay in the urban fabric. It has grown substantially, with urbanisation happening in the absence of population pressure, and even in the face of declining population. Thus, one potential driving force for this trend could be economic development. Larger cities with a robust economy tend to attract more investment and development, leading to the expansion of the built-up areas. Additionally, policy interventions and the quality of institutions (Rodríguez-Pose, 2020) are also likely to exert influence on the urbanisation process in CEE cities. Indeed, there is a substantial difference between the demographic component of urbanisation and its spatial dynamics which varies between and within countries in CEE, but it also influenced by the size of cities. Further evidence regarding this topic will be discussed below (see Table 1).
One-way ANOVA hypothesis testing results.
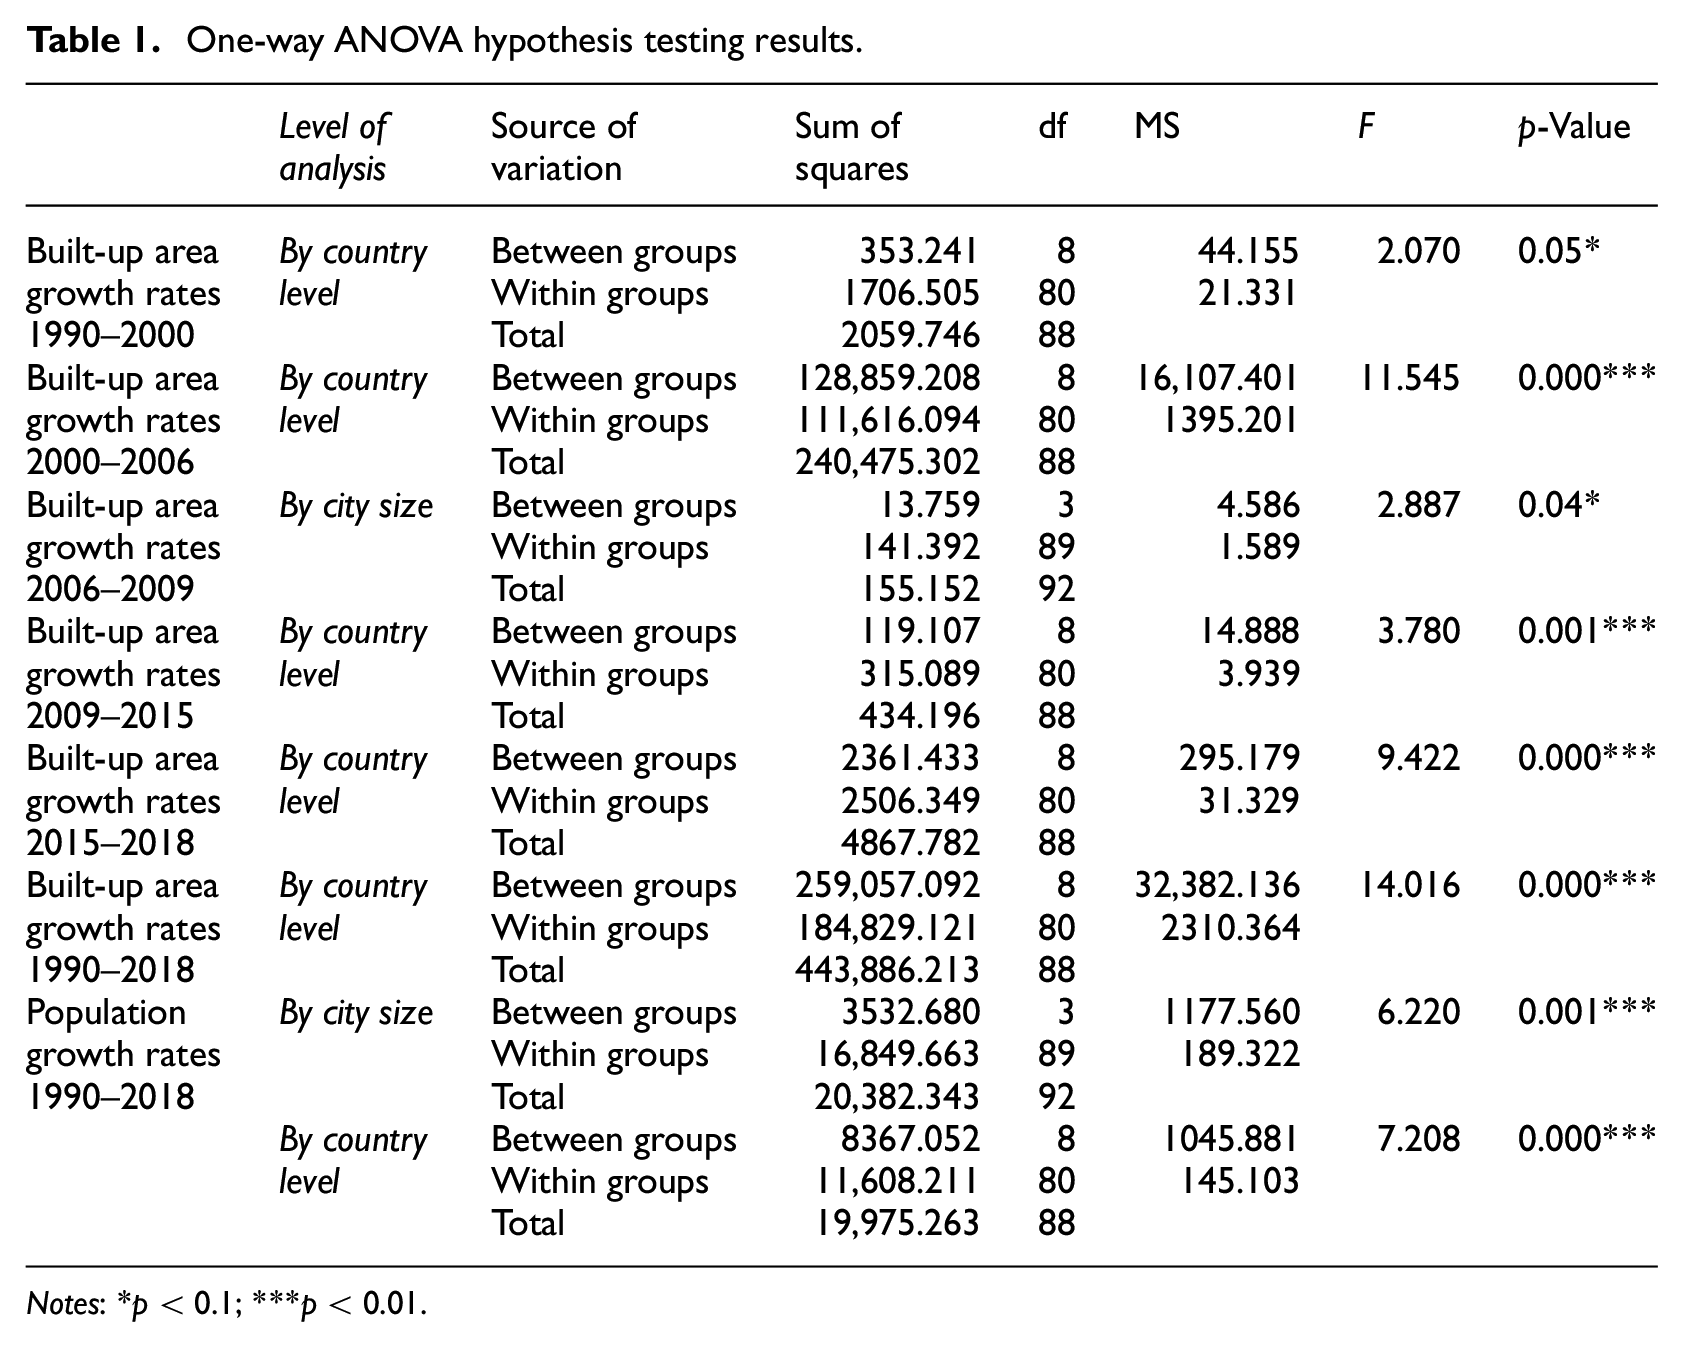
Notes: *p < 0.1; ***p < 0.01.
One-way ANOVA hypothesis testing for the built-up areas and population growth rates across the countries in the CEE region reveals significant differences in growth rates at the country level (p-value ranging from 0.04 to 0.001; see Table 1). However, when the differences are analysed based on city size, there is no significant difference in the growth rates of built-up areas in cities of different sizes. The exception is for the period between 2000 and 2006 when there is a significant difference in growth rates based on city size. Indeed, other factors, such as economic context (economic crisis) and government policies, appear to have had more influence than city size in determining built-up area growth rates during these periods. Nevertheless, for the population growth rates, there are statistically significant differences both at the country level and when considering the different city sizes.
For the period 2000–2006, this suggests that, among other factors influencing the growth of built-up areas during this time period, city size played a significant role. It could be that the availability of land or infrastructure varies by city size, and that these differences contribute to the observed growth patterns. Alternatively, it could be that government policies or economic conditions are more favourable for growth in certain city sizes, which in turn affects the growth of built-up areas. It is important to note that this significant difference at the city size level during this specific period does not indicate a general pattern in the data. However, since this period had the highest urbanisation growth rate, it is an important factor to consider when examining the urbanisation dynamics in CEE.
The statistical significance of the ANOVA testing at the country level suggests that the built-up area growth rates in CEE were largely influenced by country-level factors (Table 1). For instance, the economic and political conditions in each country had an impact on the availability of resources and investment opportunities for urban development, as well as the demand for urban spaces. Furthermore, geographical factors, such as proximity to Western Europe, and a high level of integration with the global economy, as well as access to transportation infrastructure, also played an important role in the expansion of built-up areas in CEE countries (Schmidt et al., 2015).
Finally, the results of the ANOVA testing for population growth rates indicate that the growth rate is influenced not only by country-level factors but also by local factors, such as city size (Table 1). This is in contrast to the results for built-up areas, where no significant differences between city sizes were observed except for the period 2000–2006. The fact that population growth rates are influenced by city size is not surprising, as the size of a city can have an important impact on the demographics. Larger cities may have more job opportunities and a more diverse economy, attracting people and driving population growth, whereas smaller cities may struggle to attract new residents and businesses, leading to a stagnant or declining population, which is mostly the case in the CEE macrocephalic urban development (Romania, Bulgaria etc.) (Siedentop and Fina, 2012).
Conclusions
Cities in CEE have had to deal with a variety of socioeconomic and spatial changes since the fall of communism. This article has explored their patterns and dynamics in relation to urbanisation and population changes. The analysis of 93 cities allowed for a comprehensive study at several geographical levels, enhancing the general knowledge of post-socialist city demographic and spatial growth patterns.
The article demonstrated that these differ depending on the size of the city and the country. In CEE cities, there is no consistent trend, with some cities experiencing population growth and an expansion of their built-up areas, while others undergo population decline while still observing built-up area growth. Prominent West–East gradients linked to both the centre–periphery model that still characterises most CEE countries and Western Europe’s neighbouring effect (most visible in the case of Poland) are still in evidence. Furthermore, as the evidence has shown, the evolution of the built-up area is in contrast to demographic trends in numerous cases. About half of the cities studied experienced population decline, and yet continued to grow in built-up areas. Shrinking cities are widespread in CEE, but less so in Poland and Slovakia. Indeed, the study found that there is no consistent link between built-up area growth rates and population growth rates in CEE cities over time. This suggests that factors beyond population growth play a more important role in driving urbanisation in the region. Some possible factors include economic development, government policies and the quality of institutions. Economic development may attract investment and development to a city, leading to expansion of the built-up area. Government policies and institutional quality may also influence urbanisation patterns, such as zoning regulations or incentives for developers to invest in certain areas.
Moreover, while spatial dynamics in CEE mostly vary by country, city size played an important role in shaping these dynamics during the period with the highest urbanisation rate. The population dynamics also varied by country and city size, indicating that CEE remains a region with varying speeds of urban development. Indeed, the primacy of capitals and (very) big cities is significant. By contrast, the majority of small and medium-sized cities more often than not experienced less coherent spatial and demographic developments.
Indeed, the findings highlight two key challenges in CEE. On the one hand, there is an expanding phenomenon of urban sprawl. On the other hand, many urban areas are witnessing a population decline. Indeed, given that the shrinking cities phenomenon has a wide geographic dimension and affects about half of the cities analysed – the majority of which are those dealing with the failure of inherited communist industrial branches – it is concerning to see that this problem remains overlooked in most urban development policies in the region. Firmer spatial development regulations should be explored, while also considering the socioeconomic context, as well as the potential market and demographic attractiveness of each city.
Overall, this study offers a comprehensive comparative analysis of urban growth and population decline across multiple CEE countries at various scales, ultimately contributing to a more nuanced comprehension of the phenomenon in the CEE region, thereby enhancing the existing body of knowledge. By examining a larger sample of cities within the region, it provides a broader understanding of the phenomenon and its variations across different countries. While previous studies have mainly focused on individual country-level analyses or approached CEE as a whole, incorporating country averages enhances comprehensiveness, capturing overall trends while considering individual country characteristics. Indeed, the analysis demonstrated the importance of country characteristics in understanding the patterns of urban growth and population decline in CEE. By incorporating more recent data, the study not only provides additional insights but also updates the existing literature. Moreover, the research takes a less conventional approach by examining cities of different sizes, revealing how these patterns vary across the urban hierarchy. This is in contrast to the more common focus on (very) large cities in the CEE region.
Finally, there are several limitations that need to be acknowledged. Firstly, despite density being an important factor in understanding land use efficiency and intensity in urban areas, particularly in the context of sustainable development policies, the analysis did not account for the densities of new urban areas due to the lack of such detail in the analysed data. Secondly, incomplete or inconsistent socio-economic data at the city level in CEE hindered the inclusion of comprehensive indicators to analyse the phenomenon of urbanisation without subsequent population growth. However, future research could focus on a smaller sample of cities to explore this phenomenon in greater detail.
Footnotes
Acknowledgements
I would like to thank the anonymous reviewers for their constructive comments and recommendations, which led to the improvement of the article’s quality, as well as the editor for assistance during the editorial process.
Declaration of conflicting interests
The author(s) declared no potential conflicts of interest with respect to the research, authorship, and/or publication of this article.
Funding
The author(s) received no financial support for the research, authorship, and/or publication of this article.