
Abstract
A framework for calculating a weighted random walk on an urban street segment network is described, and tested as a predictor of pedestrian and vehicle movement in London and the wider region. This paper has three aims. First, it proposes the simplest possible model of agency in that individuals have neither memory, goals nor knowledge of the network beyond street segments immediately visible at an intersection. Second, it attempts to reconcile two divergent approaches to urban analysis, graph centrality measures and agent simulation, by demonstrating properties of topological graphs emerge from the lowest level agent behaviour. Third, it aims for far faster computation of relevant features such as the foreground street network and prediction of movement than currently exists. The results show that the idealised random walk predicts observed movement as well as the best existing centrality measures, is several orders of magnitude faster to calculate, and may help to explain movement without perfect knowledge of the map, by demonstrating the street network is structured such that long range information on optimal paths correlates with geometrical features locally visible at each intersection.
Introduction
The nature of movement and non-local information
Network centrality measures are excellent predictors of urban movement (Blanchard and Volchenkov, 2009; Hillier and Iida, 2005; Omer and Jiang, 2015; Serra and Hillier, 2019). These do not explicitly commit to an explanation of how an individual moves through space, but two possibilities are implied. The first, due to centrality measures based on a definition of shortest paths, is that navigating agents are route optimisers. Angular betweenness centrality, which counts the proportion of least-angle paths through a given point, would suggest that an agent can choose this optimal route: i.e. it has operational knowledge of the map and acts on it to select a full shortest path in advance. But this assumes global information that agents may not possess in reality: it cannot account for a traveller with limited or no knowledge of the map, or the fact that our ability to recollect angle is imperfect even for familiar spaces (Sadalla and Montello, 1989).
More parsimonious is the exosomatic assumption: that the relevant information is not in the agent but in the space itself (Turner and Penn, 2002). The notion of a purely random walk on a network, without memory or projected goals, yields alternative measures of centrality (Blanchard and Volchenkov, 2009; Fidler and Hanna, 2015; Jiang, 2009) that are equal or better predictors of movement. In theory, these are simpler because they assume no knowledge of the map beyond the current position. Instead, their predictive capacity is thought to be due to underlying scale-free and small world properties of the network graph itself (Jiang, 2009). These properties occur when the fundamental spatial unit is taken to be the whole axial line (continuous line of sight) or natural street (allowing for gradual curvature), units which prioritise the topology of the city over its geometry (Ma et al., 2018; Penn, 2003), and have considerable variance in the number of units to which they connect. They are presumed not to occur among street segments (the portion between intersections), which vary only in the geometry of their angles, rather than their connectivity.
But, like route optimisation, these accounts also make an assumption about non-local information. Axial lines or ‘natural’ streets are not minimal units, as each one encapsulates essential geometrical information as a ‘straight line of sight’ or ‘path of limited curvature’. This information content has been proposed as their definition (Serra and Hillier, 2019): they are divisions of space that best minimise the information of their internal angles, thereby reserving the main information of major turns to be conveyed by graph links to adjacent nodes. Unfortunately, this information structure is not actually visible at every point in a real city. Our visual field is limited, and where it is not possible to identify all the streets adjoining the axial line one is on, it is not possible to fully know even the local node. Still more is required for the random walk measures above: PageRank (Jiang, 2009) and its agent-based approximation (Jiang and Jia, 2011) are the most parsimonious, but even these have agents ‘jump’ to adjacent streets based on a probability weighted by the degree of their subsequent nodes, requiring knowledge of the map two major turns away. One turn more would yield the ‘radius-3’ frequently used for axial integration (Penn et al., 1998), a measure which assumes route optimisation.
The theoretical position of the exosomatic random walk is that a traveller can do without this wider knowledge. If it is meant to be analogous to human navigation, the question is whether a random walk can simulate movement using only information within the actual visual field of the agent at the point of decision, i.e. at the intersection terminating each street segment. If, instead of navigation, it is structural properties that are revealed, the question is whether these also apply to the more fundamental geometrical unit of the segment. Does the geometry of the city convey global information at the most local level?
This paper investigates whether any non-local information, either in the form of whole-route optimisation or aggregated topological representations, is required to explain movement, or whether a simpler model will suffice. A minimal model is proposed of the memoryless random walk, using only information immediately available where a decision is made, i.e. visible angles of streets at that intersection. To do so, the angular segment representation is modified slightly to better reflect how space is experienced, which also turns it into a directed graph as used in PageRank and related measures of internet structure (Page et al., 1999). This simulates movement not at the resolution of the whole street, but of the finer street segment, so is tested against the best currently known predictors of segment by segment movement. The results are similar, and the simplicity of the calculation has significant implications for computation speed.
Bridging methods: Graph vs. agent, structural vs. cognitive
Several theoretical and methodological questions stem from bridging two markedly contrasting types of analysis. Graph measures are structural, top down methods, based on the network, whereas agent simulation is cognitive, phenomenological and based on the individual. The two have been explicitly contrasted by Batty (2001), who described the graph approach of Space Syntax as a merely descriptive measurement of accessibility (integration) on street networks, which ‘cannot account for the dynamics of movement’ simulated directly by agent based models. Subsequent developments have partially bridged this gap, including the introduction of segment angular choice (Hillier and Iida, 2005) to replace topological axial street graphs, and the introduction of exosomatic visual agents (Turner and Penn, 2002) in space syntax, both of which implicitly or explicitly measure routes through locations; however, the theoretical relationship between the approaches is not always clear.
One issue is that inferring individual cognitive factors from aggregate movement may be impossible, as strategies that minimise metric or topological distance can resemble angle optimisation in aggregate (Omer and Jiang, 2015). Ma et al. (2018) have argued on this basis that (a) the effectiveness of Space Syntax in modelling activity is entirely due to the collective scale-free properties of the network, rather than cognitive factors and (b) activity is driven by topology (axial lines or streets) rather than local geometry (segment angles). Yet evidence of real, individual navigational decisions suggests cognition and geometry are relevant both at the scale of path angle minimisation (Turner, 2007) and in visual cues immediately visible at street intersections (Emo, 2014). To the extent a random walk weighted by such local features does correspond with real urban scale movement, it bridges theoretically between (a) the small scale cognitive and larger network approaches, and (b) between the geometrical and topological views of space. The results would suggest the cognitive-geometrical and structural-topological are simply different descriptions of the same phenomena.
Another issue is that, while both methods provide remarkable predictions of movement, they apply to different scales and contexts. Centrality measures, particularly angular betweenness, called choice in Space Syntax, correlate highly with observed traffic from neighbourhood (Hillier and Iida, 2005) to national (Serra and Hillier, 2019) scales, where movement is constrained to roads. Memoryless agents with randomised path selection correlate very well with pedestrian movement in buildings (up to r2=0.76 in the Tate Britain gallery; Turner and Penn, 2002) where movement is free, in open spaces. Computational cost makes these less feasible for larger scale urban pedestrian movement, where correlations are also somewhat lower (up to r2 =0.67; Turner, 2003). A street-segment random walk model would help to explain these as the same phenomenon, and make the latter feasible at larger scales.
More broadly, while true random agents require a cumbersome pseudo-random computation, the effects of random walks in related fields of mathematical graph theory and network engineering, and occasionally applied to urban movement (Blanchard and Volchenkov, 2009; Newman, 2005), are deterministic properties of the graph often calculated directly. The eventual steady state of random agents is equivalent to eigenvector centrality (Bonacich, 1972), which is given by the first eigenvector of the graph matrix, and Google’s PageRank algorithm (Page et al., 1999), which sorts website search results, is a version of this. The method used in the paper, like these, calculates an idealised random walk in that all possible paths are taken simultaneously, but is concerned with more than the final state. As with true agent simulation, the change in distribution over time will be shown to be relevant, as it may reveal aspects of urban structure not visible in other methods.
Method
Turner and Penn’s (2002) exosomatic visual architecture (EVA) agents execute an actual random walk through a model of building-scale space, iteratively selecting a new direction as a random selection from a 170° cone of vision weighted by the distance visible in each direction. This is a memoryless Markov process in which the agent is more likely, but not determined, to walk where it can see farthest. Their final distribution converges towards an eigenvector calculation, but this computation is expensive, and discrete agents are used instead to approximate it.
The eigenvector is similarly expensive to calculate for large urban graphs. An approximation is made here by running a version of an idealised agent simulation, but one in which all possible paths are taken simultaneously. This is both more efficient, and also allows investigation of the distribution over time. It is this idealised distribution that will be compared against empirical data of vehicles and pedestrians, and with other graph measures.
Random walks
A random walk for a single agent on a graph involves an iterative series of steps from node to node, with an agent choosing its next node based on a probability given by the relative weights of the graph links to all adjacent nodes. But if we are concerned with the relative distribution of a population of agents, this can be calculated without summing the paths of multiple discrete agents by using the total probability distribution, in effect allowing the agent to split itself over all paths.
A graph of n nodes is represented by a square n × n matrix A, in which A(i,j) is the weight between any connected nodes i and j, or A(i,j) = 0 for all unconnected nodes. For weights describing angle, a straight (0 degree) path is a maximum of 1.0, and sharper turns lesser values between 0 and 1. Any distribution of agents on the graph is given by an n × 1 column vector S containing the number of agents at each node, which need not be integers. A transition matrix T is derived from A by normalising all columns to sum to 1.0, the total probability of the agent transitioning to all adjacent nodes, thereby conserving the total number of agents on the graph from step to step. Beginning with S = 1.0 agents on each node, each subsequent distribution S’ of agents on the graph is calculated simply by multiplying the previous distribution by the transition matrix: S’ = S × T.
This framework has several distinguishing features as distinct from many agent simulations. First, the agents have no goal, and no memory or foresight beyond their current node: they move based entirely on the weighted probability as given by their current position in the graph. This differs from methods in which route optimisation is performed or where previous states determine the probabilities at a location due to forward vision (Turner and Penn, 2002, with qualifications, see Section ‘Double node segments and directed graphs’), or where weighting is derived from connections to subsequent, unseen nodes (Omer and Jiang, 2015). Second, the distribution of agents at every step is deterministic: agents are infinitely divisible and take all paths simultaneously, and so there is no need to inject a pseudo-random element to choose paths. These features both contribute to a third, the simplicity of the calculation: all that is required at each step is merely a multiplication of the current distribution vector by the transformation matrix. This has important implications for the efficiency of computation.
Angular weighting
The minimal random walk has just one relevant parameter: the weighting of links connecting the nodes. This study follows ample precedents for angular weighting (Hillier and Iida 2005; Omer and Jiang 2015; Serra and Hillier, 2019; Turner, 2009) but whereas these calculate the cost of a path such that greater angles are weighted highest, the random walk requires a probability of turning such that the greater angles are weighted least. This might appear a simple inversion of the cost weighting function, but is not. Crucially, the route cost function serves to compare entire routes, whereas relative probability applies purely locally, and there is no way to map one to the next (supp figure 1).
A more subtle issue is that whereas angular choice uses a linear weighting of angle (0 for continuing straight, to a maximum cost for 180° turns), evidence suggests non-linear functions might be preferable (Frith, 2017). Taking the turn probability as a simple inversion of the angle would imply that a 90° turn is half as likely as continuing straight ahead. Given the apparent preference of pedestrians and drivers for straighter paths (Turner, 2009) this seems unusually high, but it is not obvious how intermediate values should be distributed within a range [0,1]. In general, the probability of turning from segment i to segment j will be dependent on some function g(.) of angle
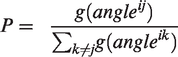
The question is what that function g(.) should be. This paper considers this an empirical question and tests two different hypotheses.
Both resemble the EVA agent (Turner and Penn, 2002), which selects a direction using a weighted probability equal to the proportion of its isovist (i.e. total area) seen in that direction. In an urban environment, an agent can see more of a street straight ahead, and correspondingly less of those at sharper angles. The total amount of the street seen over time as an agent approaches an intersection can be calculated as a function of its angle (supp figure 2). This is closely approximated as an area by an exponential function of the angle θ from perpendicular, g = e1.076θ, and as a distance by power functions, angle4 or angle5 (supp figure 3). The primary difference between the two functions is that the exponential weights acute turns relatively higher, allowing doubling back, whereas acute turns are very unlikely using the power function. The exponent of the latter is also easily varied such that higher powers make straighter routes increasingly preferable (supp figure 4), so a range of exponents is tested empirically.
Double node segments and directed graphs
A crucial innovation in representation is required to handle forward motion. Travellers do not normally turn 180°, but a graph representation of street segments as individual nodes (Hillier and Iida, 2005) does not allow a forward step to be easily distinguished from a reversal to the node behind. This is not a problem for shortest path analyses, where the possibility of an agent turning back on itself is ruled out by the inherent extra cost in path length, but it is for a memoryless Markov process that considers only the current move.
Consider a forward moving agent (supp figure 5), with the probability of choosing the next segment expressed as directly proportional to the angle of turn. It will be exactly half as likely to make a 90° turn left or right (weighting 0.5) as to continue straight (weighting 1.0). But given the weights to all adjacent nodes are derived directly from angles, the same likelihoods apply to those nodes behind the agent, and it will be just as likely (1.0) to make a 180° turn as to go straight ahead, and just as likely to turn to the right angles behind, for a total of 270°, as it is to turn a simple 90°.
This is solved by representing both position and orientation in the graph. Each segment becomes two nodes, each representing a different direction of travel for the agent. This is a much simpler version of what occurs in the case of an EVA agent (Turner and Penn, 2002), which has forward facing vision (170°) in an unconstrained space with many possible orientations; the linear space of the street here limits the agent to just two. Each of the resulting nodes (supp figure 5, right) has outgoing connections only to three segments in the forward facing direction, and the representation now becomes a directed graph, i.e. a connection [i,j] no longer implies one for [j,i]. This preserves forward motion within the random walk framework with minimal additional computation. While the number of nodes is doubled, the number of links remains the same, and as a sparse graph transition matrix, consisting primarily of zeros, it can be stored and accessed efficiently.
Results
Detailed analyses were performed on a map of London within the M25, taken from the Ordnance Survey (OS) Integrated Transport Network layer of July 2011. Segments represent road centrelines. The map covers an area of roughly 61 km by 55 km, and consists of a total of 312,037 segments, with a mean length of 74.2 m, resulting in 624,074 graph nodes when each segment is represented by two nodes. To test prediction of fine scale movement, results were compared empirically against actual pedestrian counts from Barnsbury (109 segments), Clerkenwell (56) and Kensington-Knightsbridge (156), and vehicle counts from the same neighbourhoods (82, 43 and 110 segments, respectively). These were chosen for continuity with much previous research, which used the same data in testing axial, segment and random walk based measures (Fidler and Hanna, 2015; Hillier and Iida, 2005; Jiang, 2009; Penn et al., 1998).
To corroborate these results at a much larger scale, the 2019 OS regional map of National Grid sectors TL and TQ was analysed, a 100 km by 200 km area surrounding and including greater London, approximately from the south coast to Peterborough, resulting in a 1.2 million node graph. Traffic data were taken from the annual average daily flows of vehicles recorded in 2018 and publically available from the UK Department for Transport. Of 899 counts from B-roads and smaller, those 710 identified within 10 m of a map segment were used to test the results. Motorways and A-road counts were not used, in part because of the greater role of signage and other aids in long range navigation, and in part due to simplifications in the segment map that do not accurately reflect the true path or angles at junctions in many of these roads which are essential to the method.
To compare with existing centrality measures, choice and mean depth calculations were made in DepthmapX (2017) across a range of 21 different radii from 50 m to 50 km, and the entire graph (radius n) of the London map only, computation of these being too complex for the regional map.
Correlation with movement
It is often the final, convergent distribution that is reported of the random walk, but the idealised, deterministic algorithm is also a dynamic process of change over time. Figure 1 shows the result, over 100 iterations, of the Pearson correlation with actual pedestrian movement in the three neighbourhoods and across the larger region studied. These begin very low, with the initial uniform distribution across nodes, but quite rapidly increase over the first 10–30 iterations before levelling out. After 50 iterations, there is very little change in correlation, and almost all appear to reach a stable plateau by 100 iterations. In practice, the walks have been run for no more than 100 iterations for all experiments in this paper, using the distribution at this point as the final state of the simulation.
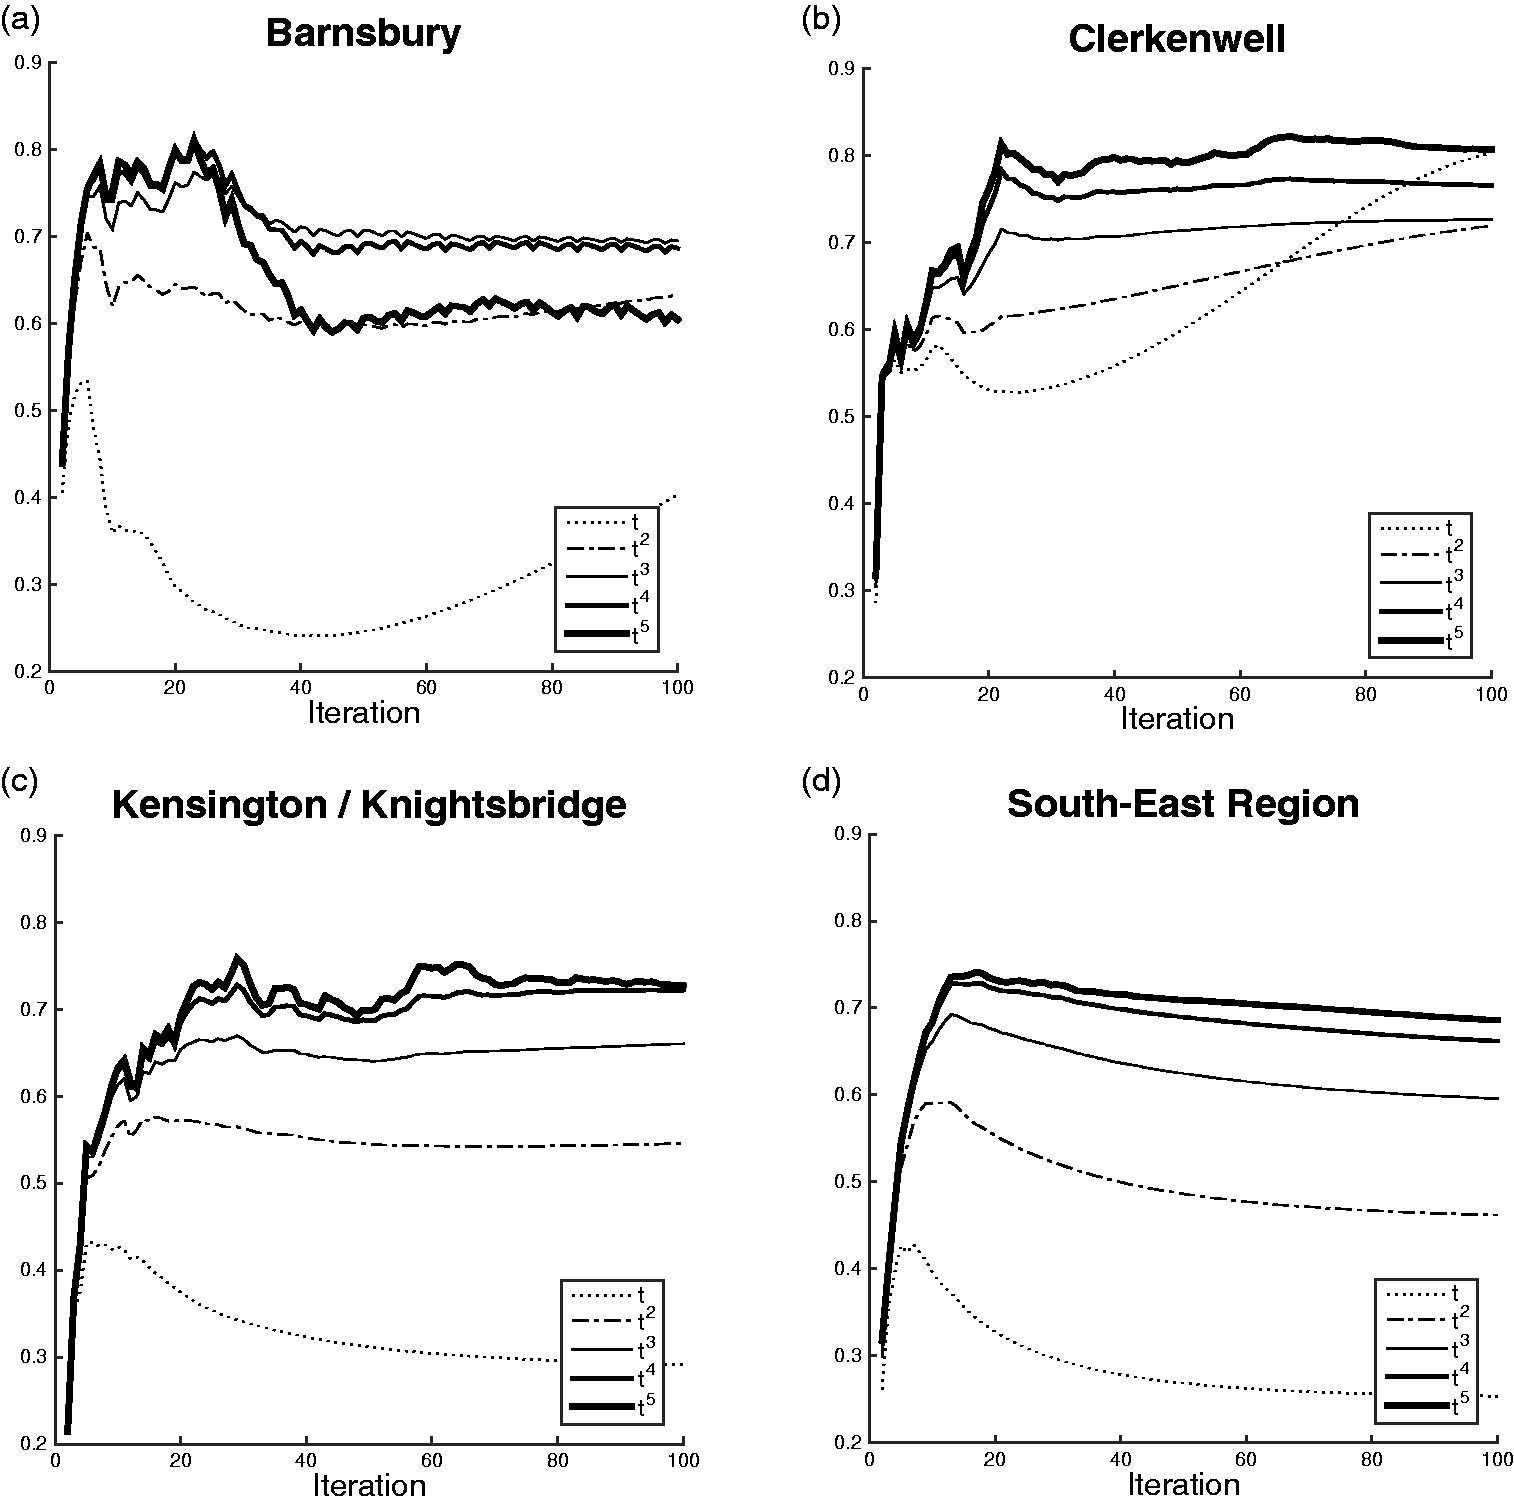
Correlation of random walk over 100 iterations, with pedestrian data for Barnsbury, Clerkenwell and Kensington/Knightsbridge, and with total vehicular data for the South-East Regional map.
The weighting of the graph as a function of turn angle was tested by comparing movement correlations with successive powers of angle (as Section ‘Angular weighting’, and supp figure 4) for angle1 to angle5. The correlations are seen to improve steadily as the exponent increases, up to about 4 or 5. This is not perfectly consistent, but averaging across all pedestrian and vehicular counts in the three neighbourhoods, the overall correlations peak at the angular weight raised to the power of 4, corroborating the hypothesised function of Section ‘Angular weighting’ (supp figure 3).
The plots in Figure 1 also display a notable peak between around 20 and 30 iterations, after which the correlation drops slightly before plateauing. The most likely explanation for this would appear to be that pedestrian and vehicular journeys are themselves finite, and so better approximated by agents making journeys of only a limited distance. This suggests that a better, alternative predictor of movement may be the running of a random walk for a much shorter time, rather than to convergence. Two options are apparent for this number of iterations. The first is to base the walk on actual journey lengths: the average walking journey as recorded in the UK National Travel Survey (Department for Transport Statistics, 2019) is known to be 1.51 km, or with the mean segment length of 74.2 m, between 20 and 21 iterations of the random walk. The second is based on the assumption that the random walk calculates similar properties to those calculated by angular choice: Figure 4 (left) shows how these two measures correlate for all segments in the London map. As with correlation between the random walk and traffic, there is an initial peak before levelling off, in this case yielding a maximum correlation with a choice radius 4000 m, at which point the two measures reach their maximum agreement at 26 iterations. These two limits are quite close to one another, and both within the range of the typical peaks observed in correlation. In preference for determining the stopping point of the model entirely from properties of the street graph itself, prior to any observations of actual traffic, the second point of 26 iterations is recorded in this paper as an alternative to convergence at 100 iterations.
As a predictor of movement, the random walk can be compared to existing measures of segment centrality: both angular choice (betweenness centrality) and mean depth (the reciprocal of closeness centrality). It was found that the best correlation to the London neighbourhood movement data with each of these was at radius 4 km for choice, with an overall r = 0.75, or r = 0.61 when plotted on a log/log scale, and radius 50 km for mean depth, with r=–0.58, or r=–0.65 log/log. Table 1 shows the more detailed breakdown for each neighbourhood and traffic mode, compared with each of the hypothesised versions of the random walk. Using the function of angle raised to the power of 4, as above, and running the model for a full 100 iterations, yields r = 0.73, or r = 0.69 on a log/log scale. Using the exponential function of turn angle, g = e1.076θ, yields a similar overall correlation of r = 0.71, or r = 0.70 on a log/log scale. Stopping the walk earlier at 26 iterations improves this slightly to r = 0.74, or r = 0.71 log/log. These figures suggest that the distribution of agents in the random walk is at least comparable, if not slightly better, than the best predictions of the movement data by existing measures of choice and depth.
Correlations of observed traffic with choice, mean depth and random walks.
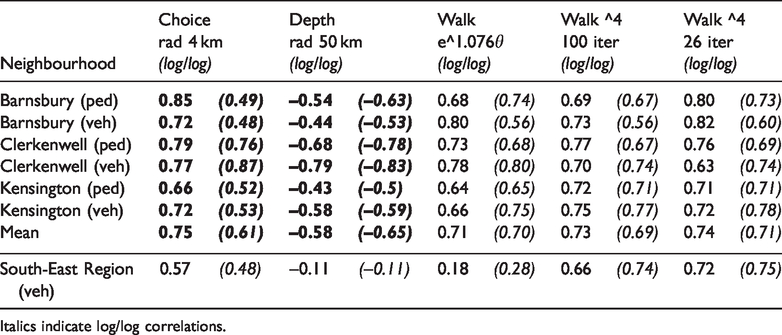
Italics indicate log/log correlations.
For the larger regional map, the entire dataset was used for random walk results. Choice and depth correlations were limited to 424 traffic count points within London, but the choice result resembles the ρ = 0.61 recorded nationally by Serra and Hillier (2019). At this regional scale, the data are somewhat skewed, suggesting log/log is a better assessment. Like the London neighbourhoods, the random walk using angle4 correlates well with traffic (and slightly improves at angle5: r = 0.73, or 0.77 log/log), but at this regional level the exponential function is a significantly poorer predictor. A significant difference between the two data sets is that, while the neighbourhood counts include most segments within a set area, the regional counts are biased towards higher-trafficked, higher-speed, main routes. The fact that the function of angle that permits more acute and backward turns fails to predict traffic along these routes is in line with the reasonable assumption that such movements are less likely for fast moving vehicles than for local drivers and pedestrians.
Relationship to angular betweenness
In addition to movement prediction, angular choice or betweenness is effective in distinguishing the foreground network of streets from background, and does this at different scales: e.g. high radii highlighting main routes through and between cities, and low radii local high street centres. The idealised random walk is not equivalent to choice, but reveals some of the same graph properties, which can be seen by the analysis of the graph in the absence of actual traffic counts.
Figure 2 shows the walk distribution in the full London street network over time, displaying the 24,000 highest value segments of the total 609,979 (4% of the graph). Agents begin uniformly distributed, but begin to concentrate on the major through routes and high streets by 26 iterations. As suggested by the convergence noted above, there is little change observed between 26 and 100 iterations, except a slight shift in density towards the centre of London (likely due, in part, to an edge effect). Comparing this with Figure 3, which shows the London foreground network as picked out by angular choice at radius 4 km, there is a clear similarity. The network revealed by choice is perhaps more obviously continuous than the random walk at 26 iterations, and more distinct in the centre than the random walk in its final state of 100 iterations, but the same pattern of main routes is picked out.
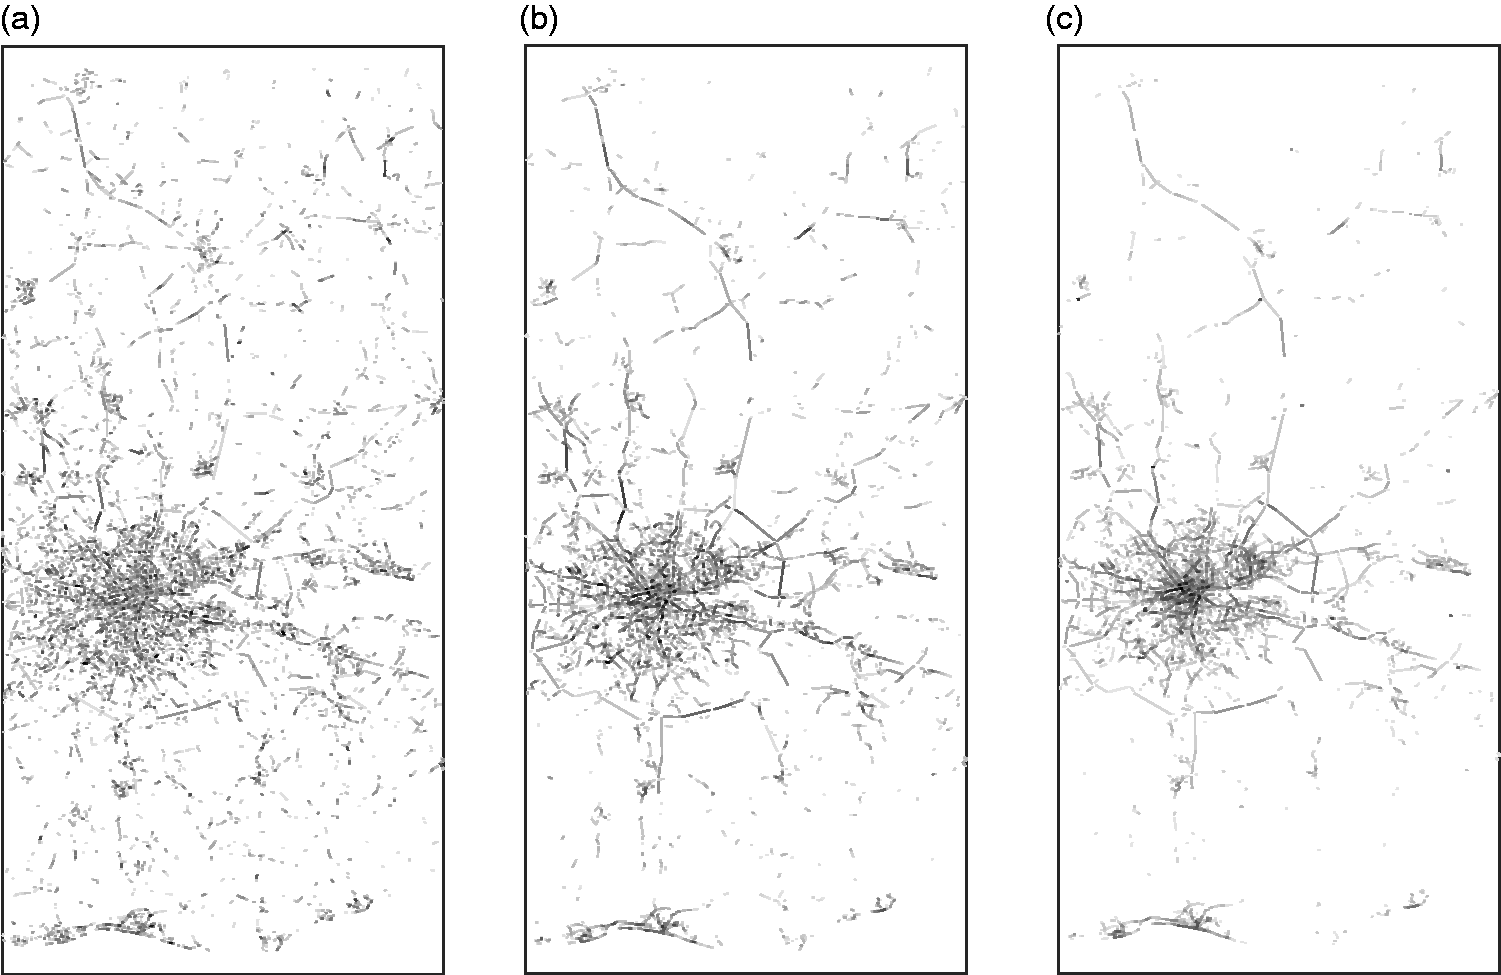
The 24,000 highest value segments regionally at iterations 5, 26 and 100.
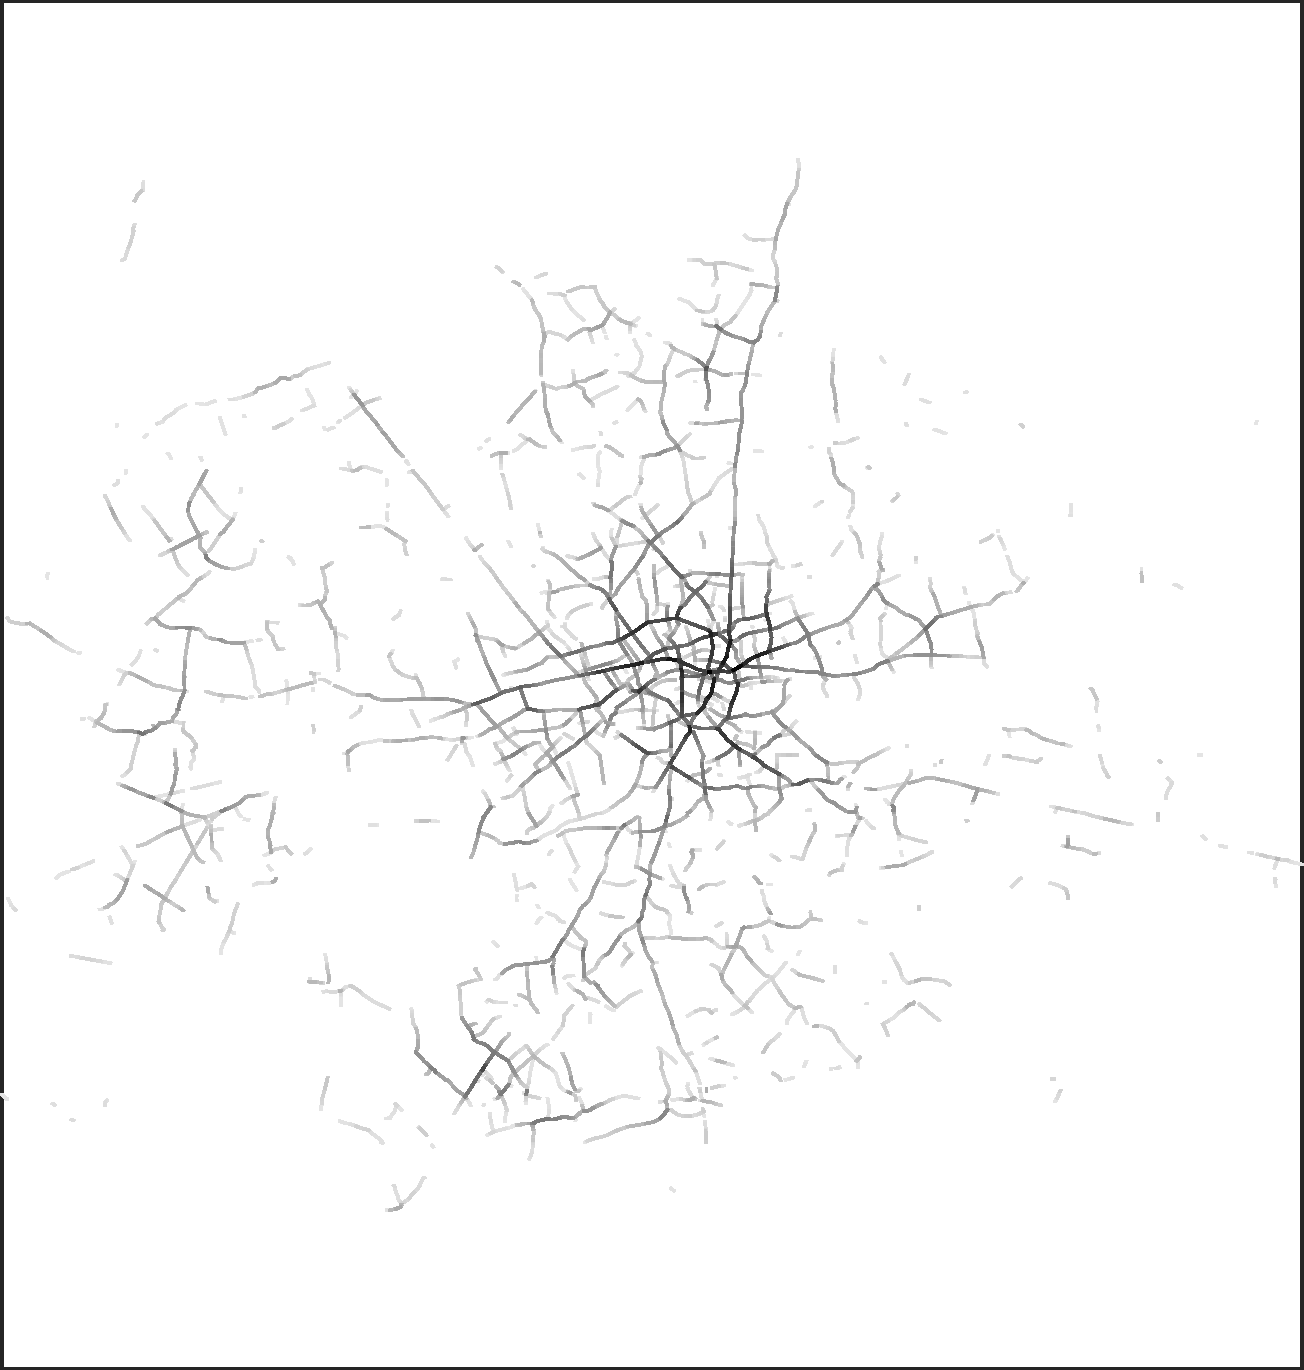
The 12,500 highest value segments in London for the angular choice radius of 4000 m.
If the random walk on all London segments is compared to angular choice at various radii, Figure 4 (left), three things are notable: the radius at which choice correlates best with the random walk is the same at which it correlates best with movement, 4 km; the number of iterations (26) at which the random walk correlates best with choice is also typically a peak correlation with movement; and the correlation between the two measures peaks at r = 0.72, nearly identical to that between either of the two measures and movement. This suggests that the process of the walk over time is relevant, and is worth some further elaboration.
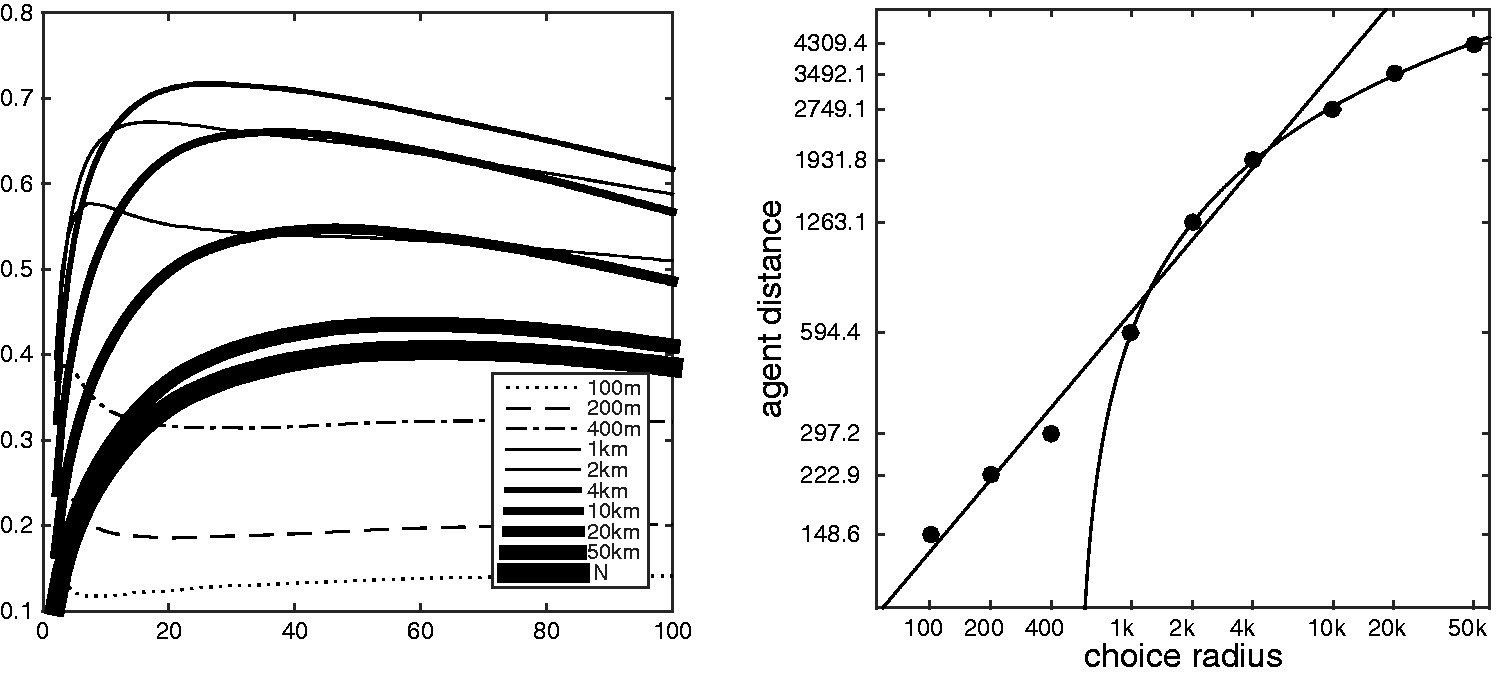
All London segments correlation between random walk and choice at various radii (left), and estimated distance travelled at peak against each radius (right).
Angular choice measures do not progress dynamically over time as does the random walk, but journey distance is implied in the radius at which it is measured: a radius of 1000 m accounts for all journeys of that length and picks out local centralities relevant at that scale. Given that successive iterations of the random walk effectively simulate successively longer journeys, there is at least a conceptual analogy between the progress of a random walk and the measure of choice at increasing scales. Figure 4 (left) corroborates this. At every radius of choice, the resemblance between the measures increases over the course of the random walk to an initial peak, and then declines. While some radii correlate better or worse overall, all have such a peak, and this maximum consistently moves to later iterations as the radius increases: the earliest phases of the random walk correspond with low radii, and the later phases with high.
If the actual distance travelled in the random walk is estimated by the average segment length of 74.2 m, the relationship between the random walk distance and the angular choice radius at these peaks can be seen (Figure 4, right). For low radii, these are approximately equal: 100 m choice most resembles the random walk at 149 m, 200 m choice at 223 m and 400 m choice at 297 m. These peaks are remarkably predictable, and have a linear relationship for a range between 100 m and 4 km, with a correlation of r = 0.9912. At larger scales this declines, with the highest radius of 50 km most closely resembling a random walk at only 4.3 km; however, the relationship at these scales is even more precise, with the agent distance most closely resembling the logarithm of the choice radius. From 1 to 50 km, the log/linear correlation is a near exact r = 0.9998. This remarkable correlation is not necessarily the case for graphs more generally, and appears to be an element of global structural information, i.e. choice, available in the locally driven process of the angular weighted random walk, which is not evident in the final steady state but only in the dynamics of the walk over time.
Discussion
The base representation of the graph raises several caveats. In the present study, road segments are represented as centrelines, rather than segments of the axial lines of longest sight originally used in angular choice analyses (Hillier and Iida, 2005). While centreline representations are now commonly used (Serra and Hillier, 2019), there are good reasons to suppose they are not optimal for idealised random walk analyses, as the memoryless agent may be more sensitive to certain geometries than a route optimiser. Just as axial line representations have shown better correlations in many previous studies of centrality measures, a preliminary test of this method indeed found correlations as high as r = 0.88 for Barnsbury, for example (Hanna, 2019). This suggests the results are likely conservative lower bounds, and details of the issue are worth noting.
Visible local angles are all important to the representation, and in addition to approximations of motorway junctions and roundabouts, considered in the regional map data, several types of common geometries are likely to misrepresent these (supp figure 6). The first is a situation in which a street jogs slightly as it crosses another, causing its two centrelines not to meet, but each to meet the crossing street at a different point. Even a small jog will turn a continuous line of sight into two right turns. The second is the common type of a square, generally surrounding a small garden or park, which axial maps represent as a diamond shape with relatively shallow angles, but centrelines show as 90° turns. In both, there is little additional cost in route optimisation, but a memoryless agent is highly unlikely (only 6%, using angle4) to resume its original direction. Both situations appear common in the London map, with 299 segments less than 1.0 m and walks trapped in squares showing up as dark spots in later iterations (Figure 2).
It is possible that these representational issues contribute to the slight drop in correlation after the 26th iteration. It is difficult to make a full comparison between the 100th iteration of the finite random walk and the actual eigenvector centrality it approximates as it converges, as the calculation of this for a square matrix of n > 600,000 is infeasible. Unpublished preliminary assessments have been made for smaller graphs, such as the axial segment map of Barnsbury mentioned above (Hanna, 2019), using an approximation to the eigenvector in Matlab (Lehoucq and Sorensen, 1996), which suggest both methods yield similar results, within 5% of one another.
Conclusion
The method introduced here, of the idealised random walk, was found to predict the distribution of movement comparably to the best alternative segment-based centrality measure, angular choice at 4 km, as indicated by Table 1. The main methodological innovation is the use of two nodes to represent each segment. This results in a far simpler computation, both conceptually and practically, which has several implications.
Practically, it would appear to be the fastest computation of its kind. Its algorithmic complexity is nominally equivalent to the topological PageRank used by Jiang (2009), but whereas PageRank is run until convergence, the random walk need only be run for a fixed number of iterations (Section ‘Correlation with movement’) making it approximately logn times faster for large graphs (see Page et al., 1999), in addition to yielding a finer resolution output for every segment. When compared to computations at the resolution of street segments, such as angular choice, the efficiency is far greater still. Because the transition matrix is sparse, and urban graph nodes typically have a relatively fixed limit of connections (i.e. to six adjoining segments), the random walk run time is well below O(n2) and approaches a linear O(2n) with efficient storage of the matrix. By contrast, efficient algorithms for betweenness centrality have a time complexity of at least O(n2logn). For the full London map used here, the random walk required <3 s for a full calculation of 100 iterations, roughly 50,000 times faster than a Depthmap X calculation of choice radius n at 40 h.
Compared to both random walks on topological representations and to route optimisation, it is a much simpler model of agency, which does not require, on the part of the agent, any foreknowledge of the map itself. The assumptions of the model are few – agents have no memory, no future goals and assume only a plausible function of angular weight based on view area (Section ‘Angular weighting’). This function of angle was tested empirically, and the hypothesised angle4 found to correlate best with the actual data. The results support the exosomatic account of movement, strengthening it further by demonstrating that Jiang’s (2009) topological results apply also to segment geometry, thereby eliminating the need for weighting by properties not visible to a real traveller, and by extending Turner and Penn’s (2002) description of free movement within small spaces to road networks of any scale. It seems plausible that the random walk described is, in fact, the minimal possible model of agency compatible with observed movement.
As an explanation of human navigation, this is not to suggest that real travellers actually operate as random walkers. What the model does demonstrate, however, is that no information beyond the immediate visual field is necessary for realistic movement.
The implication of this is a novel insight into the information bearing structure of the road network. It appears to be a property of London, and perhaps cities in general, that street geometry conveys information on optimal routes to an ignorant agent at every point, i.e. it is constructed such that global measures of centrality tend to converge with local. Similar properties have been noted in whole street or axial line representations: their scale-free properties correspond with optimal routes (Jiang, 2009) and the space syntax measure of intelligibility is the resemblance between global and local similarly deemed essential for cognition (Penn, 2003). But the results of this paper yield at least three new observations. First, this global information is not something that emerges only at the scale of the axial line, or a radius of two, but is available at the finest scale of every segment or street intersection, where it can actually be perceived visually. Second, important information may be revealed over time, prior to the random walk’s convergence, in that movement is best predicted at the distance of an average journey, and there is a remarkable correlation between walk distance and choice radius (Section ‘Relationship to angular betweenness’). Third, it is not simply a property of the graph (i.e. topology), nor of the agent (i.e. cognition), but of how former is read by the latter. Two behaviour criteria are essential for the agent: that they be forward directed, and that they use the appropriate angular weighting, here tested empirically as approximated by angle4 or angle5.
Theoretically, these observations help to link separate branches of urban analysis still partially at odds for at least two decades, namely agent simulation and direct measures of graphs. Where axial lines or streets are defined as basic topological units by their minimised angles, or information, an agent’s probability function which strongly weights the straightest routes does the same. With this function, when it is correct, it would appear that the topological level structure is an emergent description of the information contained in the segment angles, but the lower level segments are more fundamental. This paper has demonstrated how they might be perceived directly. Most broadly, there may be parallels to still wider phenomena of navigation. By doubling nodes as presented here, the city we perceive has been shown more closely to resemble the directed graphs seen in web page links, which can be effectively navigated from any decision point using a strategy identical to Google’s PageRank. If it is indeed the case, as this paper suggests, that we have constructed our cities to convey longer range navigational information to a traveller’s immediate visual field, it is notable that the means constructed as our vision to navigate an abstract space like the internet is so similar.
Supplemental Material
sj-pdf-1-epb-10.1177_2399808320946766 - Supplemental material for Random walks in urban graphs: A minimal model of movement
Supplemental material, sj-pdf-1-epb-10.1177_2399808320946766 for Random walks in urban graphs: A minimal model of movement by Sean Hanna in Environment and Planning B: Urban Analytics and City Science
Supplemental Material
sj-zip-2-epb-10.1177_2399808320946766 - Supplemental material for Random walks in urban graphs: A minimal model of movement
Supplemental material, sj-zip-2-epb-10.1177_2399808320946766 for Random walks in urban graphs: A minimal model of movement by Sean Hanna in Environment and Planning B: Urban Analytics and City Science
Footnotes
Declaration of conflicting interests
The author(s) declared no potential conflicts of interest with respect to the research, authorship, and/or publication of this article.
Funding
The author(s) received no financial support for the research, authorship, and/or publication of this article.
Supplemental material
Supplemental material for this article is available online.
References
Supplementary Material
Please find the following supplemental material available below.
For Open Access articles published under a Creative Commons License, all supplemental material carries the same license as the article it is associated with.
For non-Open Access articles published, all supplemental material carries a non-exclusive license, and permission requests for re-use of supplemental material or any part of supplemental material shall be sent directly to the copyright owner as specified in the copyright notice associated with the article.