
Abstract
In many places, streets are still primarily designed for the convenience of motorists, considering mobility function as the principal design goal. There is a scarcity of empirical evidence on the relationship between the design of a street and how it is experienced by pedestrians who use it. This work focuses on quantifying pedestrians’ perception of walkability through a stated preference survey using a dynamic 3D representation of various street designs in Toronto, Canada. The stated preference scenarios are generated through a rule-based 3D environment (Esri’s CityEngine) and animated using a gaming engine (Unity). A random sample of 600 Torontonians is used for the empirical investigation by estimating a mixed multinomial logit model. The results indicate that there is a high preference for (i) streets that include transit lanes as opposed to car-exclusive lanes, (ii) the presence of trees on the sidewalk, and (iii) two-way cycle paths on the curb lane. Furthermore, pedestrians are willing to trade sidewalk width for the presence of trees and outdoor dining. The survey’s innovative presentation mode and its findings can contribute to the development of much-needed evidence-based design tools to assess the trade-offs required between the many possible uses of roadway space, while focusing on the overlooked role of the pedestrian experience.
Introduction
Complete streets accommodate the varying and often conflicting needs of street users and promote sustainable transportation modes. In many places, streets are still primarily designed for the convenience of motorists, with the fulfillment of the mobility function as the primary design goal. The City of Toronto is focusing on making the city friendlier for sustainable transportation modes. Efforts to achieve this include a Walking Strategy (City of Toronto, 2009), Complete Streets Guidelines (City of Toronto, 2016), and several ongoing pilot projects. The City’s Proposed Downtown Plan emphasizes a “Walkable Downtown” with a key objective being “to prioritize the pedestrian experience to maintain and enhance the walkability of Downtown” (City of Toronto, 2017).
Clearly, a wide range of factors must be considered in the evaluation of complete streets (see the review paper by Hui et al. (2018)), including the context-sensitive fulfillment of movement, environment, and place functions of a street. Hui et al. (2018) find a scarcity of empirical evidence on the relationship between the design of a street and its place function, especially how it is experienced by pedestrians. The majority of existing research focuses on the level of service (LOS) assessments of walking environments or the urban form as it correlates to walking at the neighborhood scale. While much attention is given (justifiably) to the number of walking trips made in a neighborhood, the quality of walking trips and pedestrians’ user experience and perceptions have been much less investigated. While observational measures of physical properties are important, they are incomplete, as people’s perceptions may affect and be affected by physical activity (Nasar, 2008). Furthermore, urban design guidelines for streetscapes—if present—are rarely based on empirical evidence of their relationship to pedestrians’ attitudes and behavior.
We address the above gaps by conducting and analyzing empirical data from a stated preference (SP) “Walkable Streets 3D Survey”, completed by a random sample of 600 Torontonians. This web-based survey applies a dynamic 3D visualization technique to simulate the real-world environment seen from the pedestrian eye-level while controlling for possible confounding factors. The survey is dynamic in that it visualizes different street designs from the view point of a moving pedestrian in an environment with moving cars, transit, and cyclists. The ultimate goal is to understand how pedestrians experience and rate the walkability of streets and the trade-offs that influence their choices, while controlling for socio-demographics and travel habits. Developing a virtual environment in an SP choice environment with statistically controlled attribute variations, yet while maintaining realism to the extent possible, is expected to produce an empirical evidence-base that adds to the walkability literature and addresses needs of streetscape design professionals.
The paper focuses on street segment-level roadway and sidewalk physical design attributes. Such characteristics (e.g. the presence and location of vehicle through lanes, transit, and trees) are fundamental building blocks of a street, and once built, are costly to modify. While adjacent land use and streetwall/building characteristics are also known to influence pedestrians’ perception of street attractiveness (Ewing et al., 2016), they are not the focus of this study.
This work is a multi-stakeholder interdisciplinary collaboration between academia, public organizations (Waterfront Toronto and the City of Toronto), and industry (Esri Canada). This survey uses an innovative methodology and a wide range of professional and academic stakeholders in its design. Its findings can contribute to the development of much-needed evidence-based design tools to assess the trade-offs required between the many possible uses of roadway space while focusing on the overlooked role of the pedestrian experience.
Literature review
Strands of research with backgrounds ranging from transportation, spatial planning, and urban design to public health investigate the link between the built environment and walking behavior. The majority of existing research focuses on the urban form determinants of walking at the neighborhood scale (for reviews, see Ewing and Cervero 2010; Wang et al. 2016). There are also established lines of research on audits and the LOS assessment of walking environments (Asadi-Shekari et al., 2013; Moudon and Lee, 2003) and the simulation of pedestrian movement (Papadimitriou et al., 2009).
The main knowledge gap is the scarcity of empirical evidence to identify the effect of specific micro-scale built environment characteristics and street design variables on walking levels and perceptions (Adkins et al., 2012; Park et al., 2019).
Several studies investigate the relationship between street-level attributes, such as roadway and sidewalk characteristics, and pedestrian activities on streets. Studies that investigate the amount of walking activity usually apply a revealed preference (RP) approach where street features (acquired by GIS or street-level environmental audits) are linked to observed levels of pedestrian activity such as pedestrian counts (e.g. Ewing et al., 2016; Sung et al., 2015) or movement trajectories of pedestrians across space (Foltête and Piombini, 2010; Kim et al., 2011; Willis et al., 2004). For instance, Sung et al. find that streets with more lanes and streets where automobiles and bicycles are mixed have higher pedestrian numbers than pedestrian-only streets (Sung et al., 2015). The presence of trees is found to be associated with higher street-level walking activity (Sung et al., 2015). There is, however, a caveat in explaining the associations between pedestrian counts and physical design features such as trees and wider sidewalks. Such association could also be due to reverse causality since areas with higher pedestrian activity are more likely to be equipped with features such as wider sidewalks and trees (Sung et al., 2015).
Other studies investigating perceptions toward different street design attributes use the SP approach. In the SP approach, actual or potential street users are asked to rate or rank the attractiveness of existing or hypothetical streets (Adkins et al., 2012; Borst et al., 2008; Kaparias et al., 2012; Kelly et al., 2011; Lusk et al., 2018). The importance (utility) of various design attributes is then estimated based on the respondents’ indicated preferences. It is shown, using SP surveys that wider sidewalks are generally preferred (Kim et al., 2011; Talavera-Garcia and Soria-Lara, 2015) and lateral separation from traffic, operationalized in the form of sidewalk setbacks and on-street parking, increase streets’ attractiveness (Adkins et al., 2012). The presence of trees is also found to be associated with positive perceptions of street attractiveness (Lusk et al., 2018; Talavera-Garcia and Soria-Lara, 2015), specifically by the elderly (Borst et al., 2009).
The existing literature confirms that the SP method is suitable for analyzing perceptions of street attractiveness. Importantly, the SP method can be used to investigate preferences about specific design interventions or policy factors and to prioritize maintenance and investment decisions regarding street infrastructure (Schwartz et al., 1999; Weiss et al., 2018). Furthermore, it enables the investigation of the trade-off between various attributes through an experimental environment where certain variables are controlled.
SP scenarios are typically presented in text format which outline the attributes, their levels, and sometimes (manipulated) photos or videos. Nasar (2008) compares the advantages and disadvantages of presentation modes including on-site exposure, color video or film, virtual reality (VR) walk-through, and color/black-and-white slides/photos (of models) for measuring the perceptions of environments for active living. He concludes that computer-generated virtual walk-through environments address both internal and external validity because they create an experience similar to an on-site experience while allowing for environmental control. Furthermore, behavior in a virtual environment is shown to be a suitable surrogate for actual behavior (Cubukcu and Nasar, 2005). It is argued that the lack of movement in photos or static renditions of spaces can limit the perceptions of the environment (Heft and Nasar, 2007). Computer-generated virtual walk-through environments can overcome this problem by setting the speed and eye-level to that of a specific street user, in this case, a pedestrian.
This survey uses procedural rule-based 3D modeling (explained further in the “Walkable Streets 3D Survey” section) to simulate a real-life experience in a controlled experimental environment. In this context, Perdomo et al. investigate pedestrians’ perceptions of safety of different roundabout designs, using a web-based video simulation (Perdomo et al., 2014). Further, Erath et al. investigate the efficacy of VR generated by procedural modeling and traffic microsimulation as a platform for a cycling simulator (Erath et al., 2017). However, to the best of our knowledge, a dynamic 3D SP survey focusing on the pedestrians’ perception of segment-level street attractiveness has not been conducted.
Method
Walkable Streets 3D Survey
The Walkable Streets 3D Survey uses an SP method where respondents are asked to rate systematically manipulated street-level scenarios with different street designs in a controlled environment (a permanent link to the survey can be found at http://ecce.esri.ca/icitysurvey/). These scenarios differ in terms of their street design attributes and visualize the street and sidewalk attributes of four of Toronto’s waterfront and downtown streets recommended by an expert panel consisting of City of Toronto, Toronto Waterfront, academics from the University of Toronto, OCAD University, and Esri Canada. The set of streets chosen by the expert panel are a result of their high current/predicted pedestrian activity and the ongoing/potential plans for their redesign. The four streets include two parts of the Queens Quay (a prominent waterfront boulevard), Villiers Street (a wide street in the currently undeveloped, but planned for development, Toronto Port Lands), and King Street (a major downtown arterial roadway undergoing a pilot to become a transit priority corridor at the time of the study). Figure 1 shows the locations of these streets on a map of the downtown Toronto waterfront area.
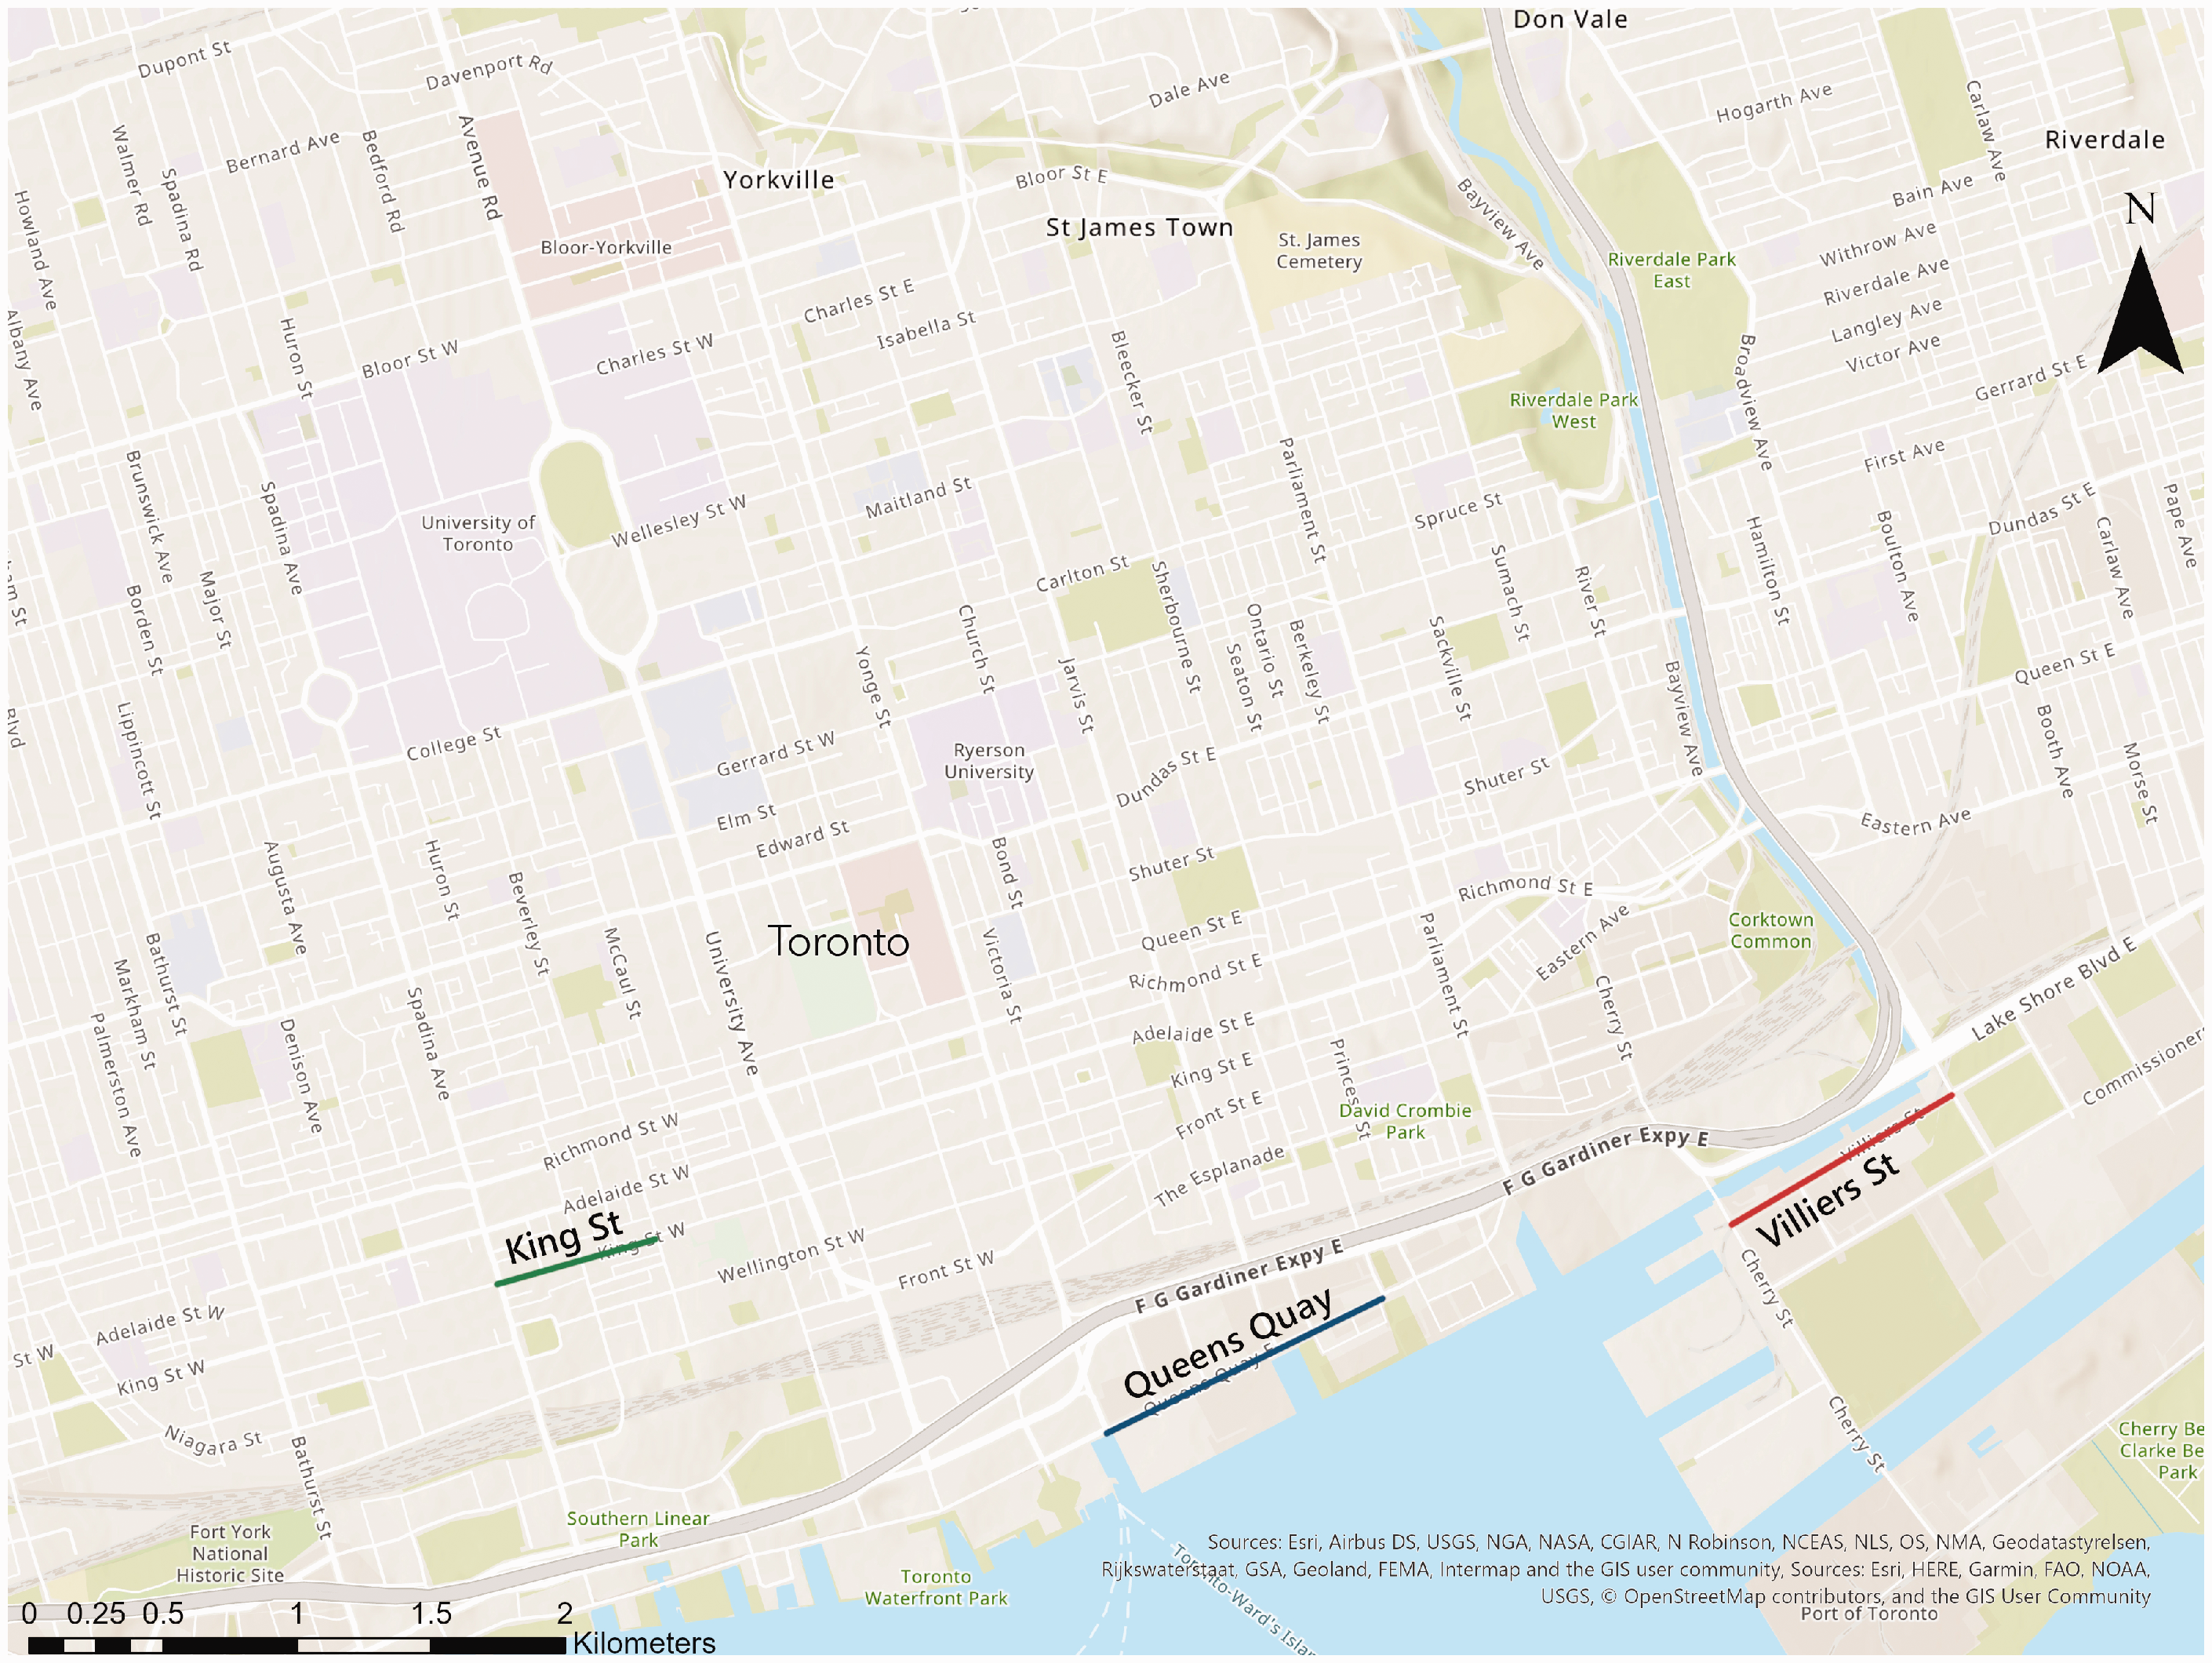
Map outlining the streets chosen for the survey simulations. King Street (green), Queens Quay (blue), and Villiers Street (red).
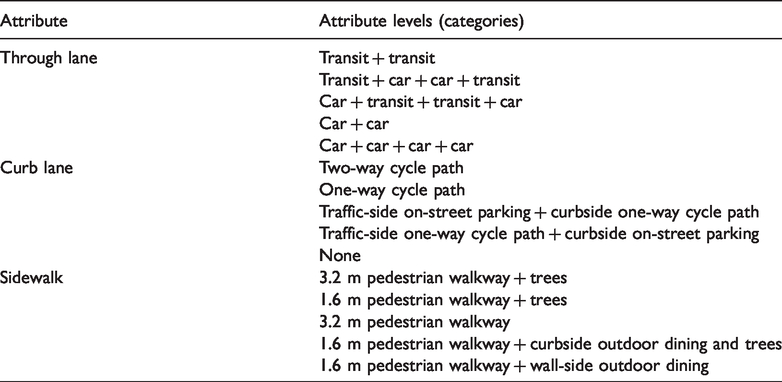
The choice of street attributes for investigation is also based on several criteria decided by the expert panel. First, the attributes include physical characteristics which potentially affect recreational walking. Second, the attributes are limited to roadway and sidewalk characteristics, since adjacent buildings and land use characteristics are harder to control for, and their inclusion has the potential to increase the SP respondent burden exponentially. Third, the attributes are structural, meaning that they need to be planned in advance and are costly to change later. Fourth, they are specific to the context of downtown Toronto (e.g. the minimum sidewalk, car lane, and transit lane widths required by the City or streetcars as investigated transit mode) but can be easily modified procedurally to accommodate other designs in other locations. Table 1 shows the investigated attributes and their levels, i.e. the different categories of each attribute.
Investigated attributes and their levels (categories).
For the design of the SP scenarios, an orthogonal design approach is taken. The choice alternatives are unlabeled; hence, the consideration of a D-efficient design is not attractive. A full factorial design is also deemed infeasible because of the large number of possible combinations and the presence of unrealistic attribute combinations. As a result, we use an orthogonal design approach as it guarantees that attributes vary independently from each other. In the final design, the attribute levels are balanced, meaning that they appear the same number of times in the design and that their combinations are equally distributed. The final number of scenarios presented, after removing the infeasible ones (i.e. transit-only streets with on-street parking) is 27. We ensure that no scenario is dominant over the others, meaning that no case is given where, according to the literature on pedestrian preferences, all attributes of that scenario are better than the attributes of any other scenarios. All scenarios are geometrically symmetric except for those with a two-way cycle path. Here, the cycle path is located on one side of the street, i.e. adjacent to the sidewalk where the pedestrian observer is walking. Table 2 shows details for each scenario and for each attribute, including widths of car lanes, transit lanes, bicycle lanes, and sidewalks components.
Complete street scenario details (a) and attribute details (b).(a)
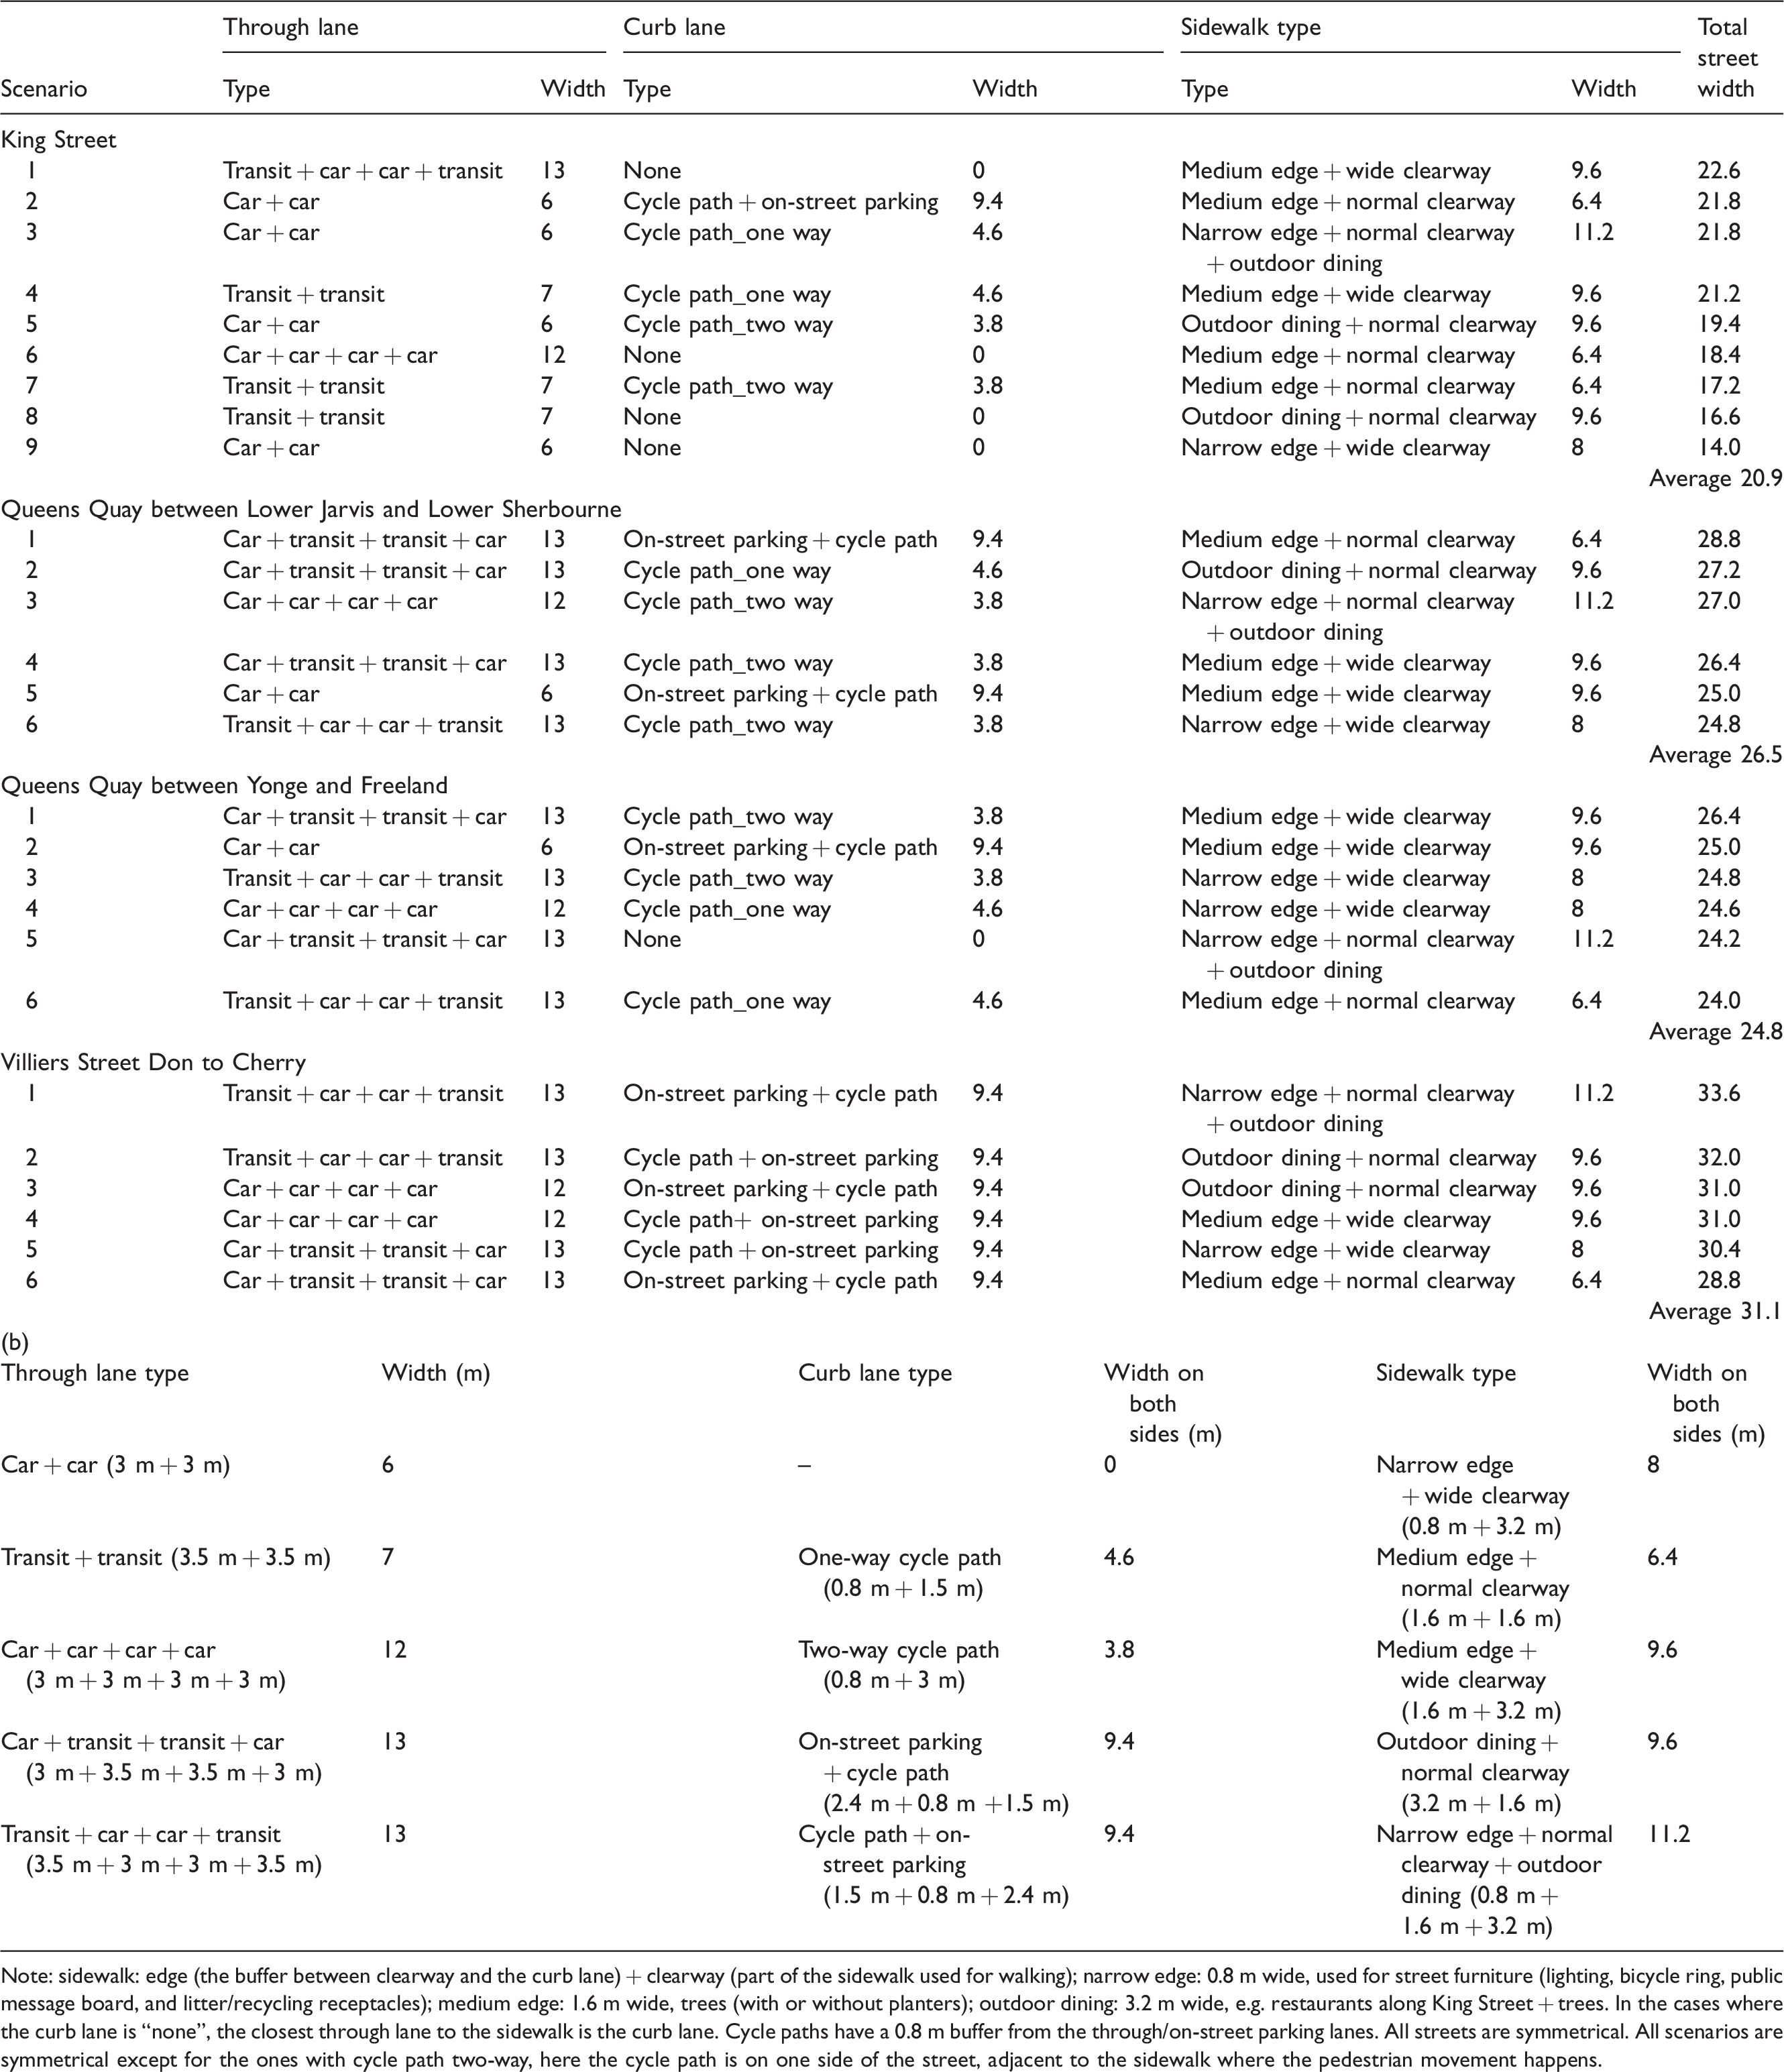
Note: sidewalk: edge (the buffer between clearway and the curb lane) + clearway (part of the sidewalk used for walking); narrow edge: 0.8 m wide, used for street furniture (lighting, bicycle ring, public message board, and litter/recycling receptacles); medium edge: 1.6 m wide, trees (with or without planters); outdoor dining: 3.2 m wide, e.g. restaurants along King Street + trees. In the cases where the curb lane is “none”, the closest through lane to the sidewalk is the curb lane. Cycle paths have a 0.8 m buffer from the through/on-street parking lanes. All streets are symmetrical. All scenarios are symmetrical except for the ones with cycle path two-way, here the cycle path is on one side of the street, adjacent to the sidewalk where the pedestrian movement happens.
Some trade-offs are made between enhanced realism and the introduction of bias into the choice experiment. The potentially confounding roles of surrounding elements such as the land use and building wall characteristics are controlled for by keeping them constant in the scenarios of each street and by making them as neutral as possible. Figure 2 presents a workflow diagram describing the development process for SP scenarios. The SP scenarios are first modeled using a “digital 3D twin” (a digital replica including the physical assets) of downtown Toronto in a 3D GIS platform, namely, Esri’s CityEngine software. CityEngine provides the necessary tools to efficiently generate 3D parametric forms from 2D data. Computer-Generated Architecture rules are applied to 2D GIS spatial data (e.g. street center lines and building footprints), providing the ability to adjust parameters as necessary to create accurate 3D representations of existing conditions, including the build-out of streets, sidewalks, and surrounding built form.
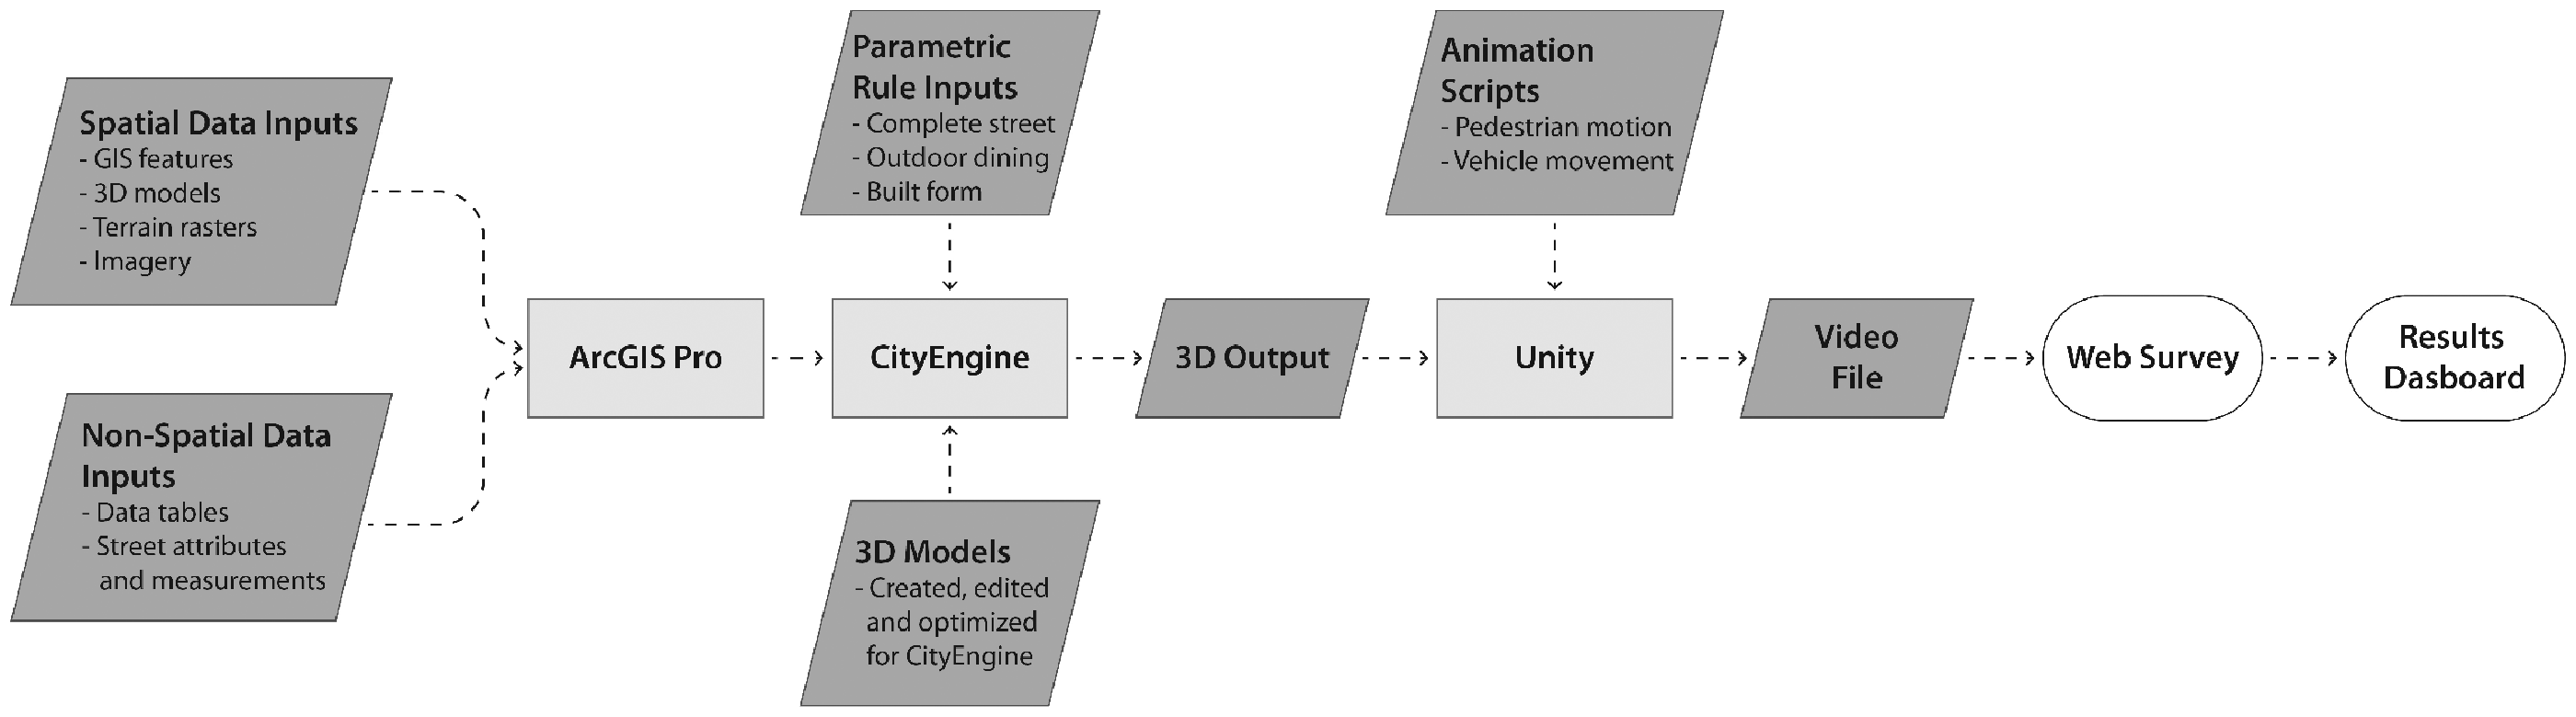
Workflow diagram outlining complete street 3D scene creation and animation.
Once a “digital 3D twin” of the study areas is accurately generated, parameters are adjusted to generate new scenarios in accordance with new scenario data attributes. The model is then brought into Unity game engine, where moving cars, transit, cyclists, and pedestrians are animated to provide a real-life immersive experience for respondents.
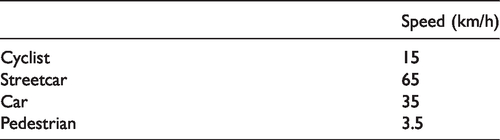
The scenarios are dynamic as they are seen from the viewpoint of a moving pedestrian in an environment with moving cars, transit, and cyclists depending on the attributes of each scenario. Table 3 shows the approximate speed of these animated components. The number and speed of pedestrians, cars (moving and parked), and streetcars are fixed in all scenarios to avoid their potentially confounding role (e.g. streets with more pedestrians might be perceived to be more walkable).
Approximate speed of animated components in scene.
The 27 scenarios are presented to respondents as nine sets of three choices. Thus, respondents are asked, for each set, to indicate their first and second favorite scenarios (Figure 3). Respondents can play all scenario videos at once or pause and watch a specific video in an enlarged format in order to make their decision. Scenarios are randomized so that each respondent experiences a different succession of streets and scenarios for each street. In addition to the scenarios, several questions on the socio-demographics and travel habits of the respondents are asked to analyze the connection between street design preferences and various segments of the population.
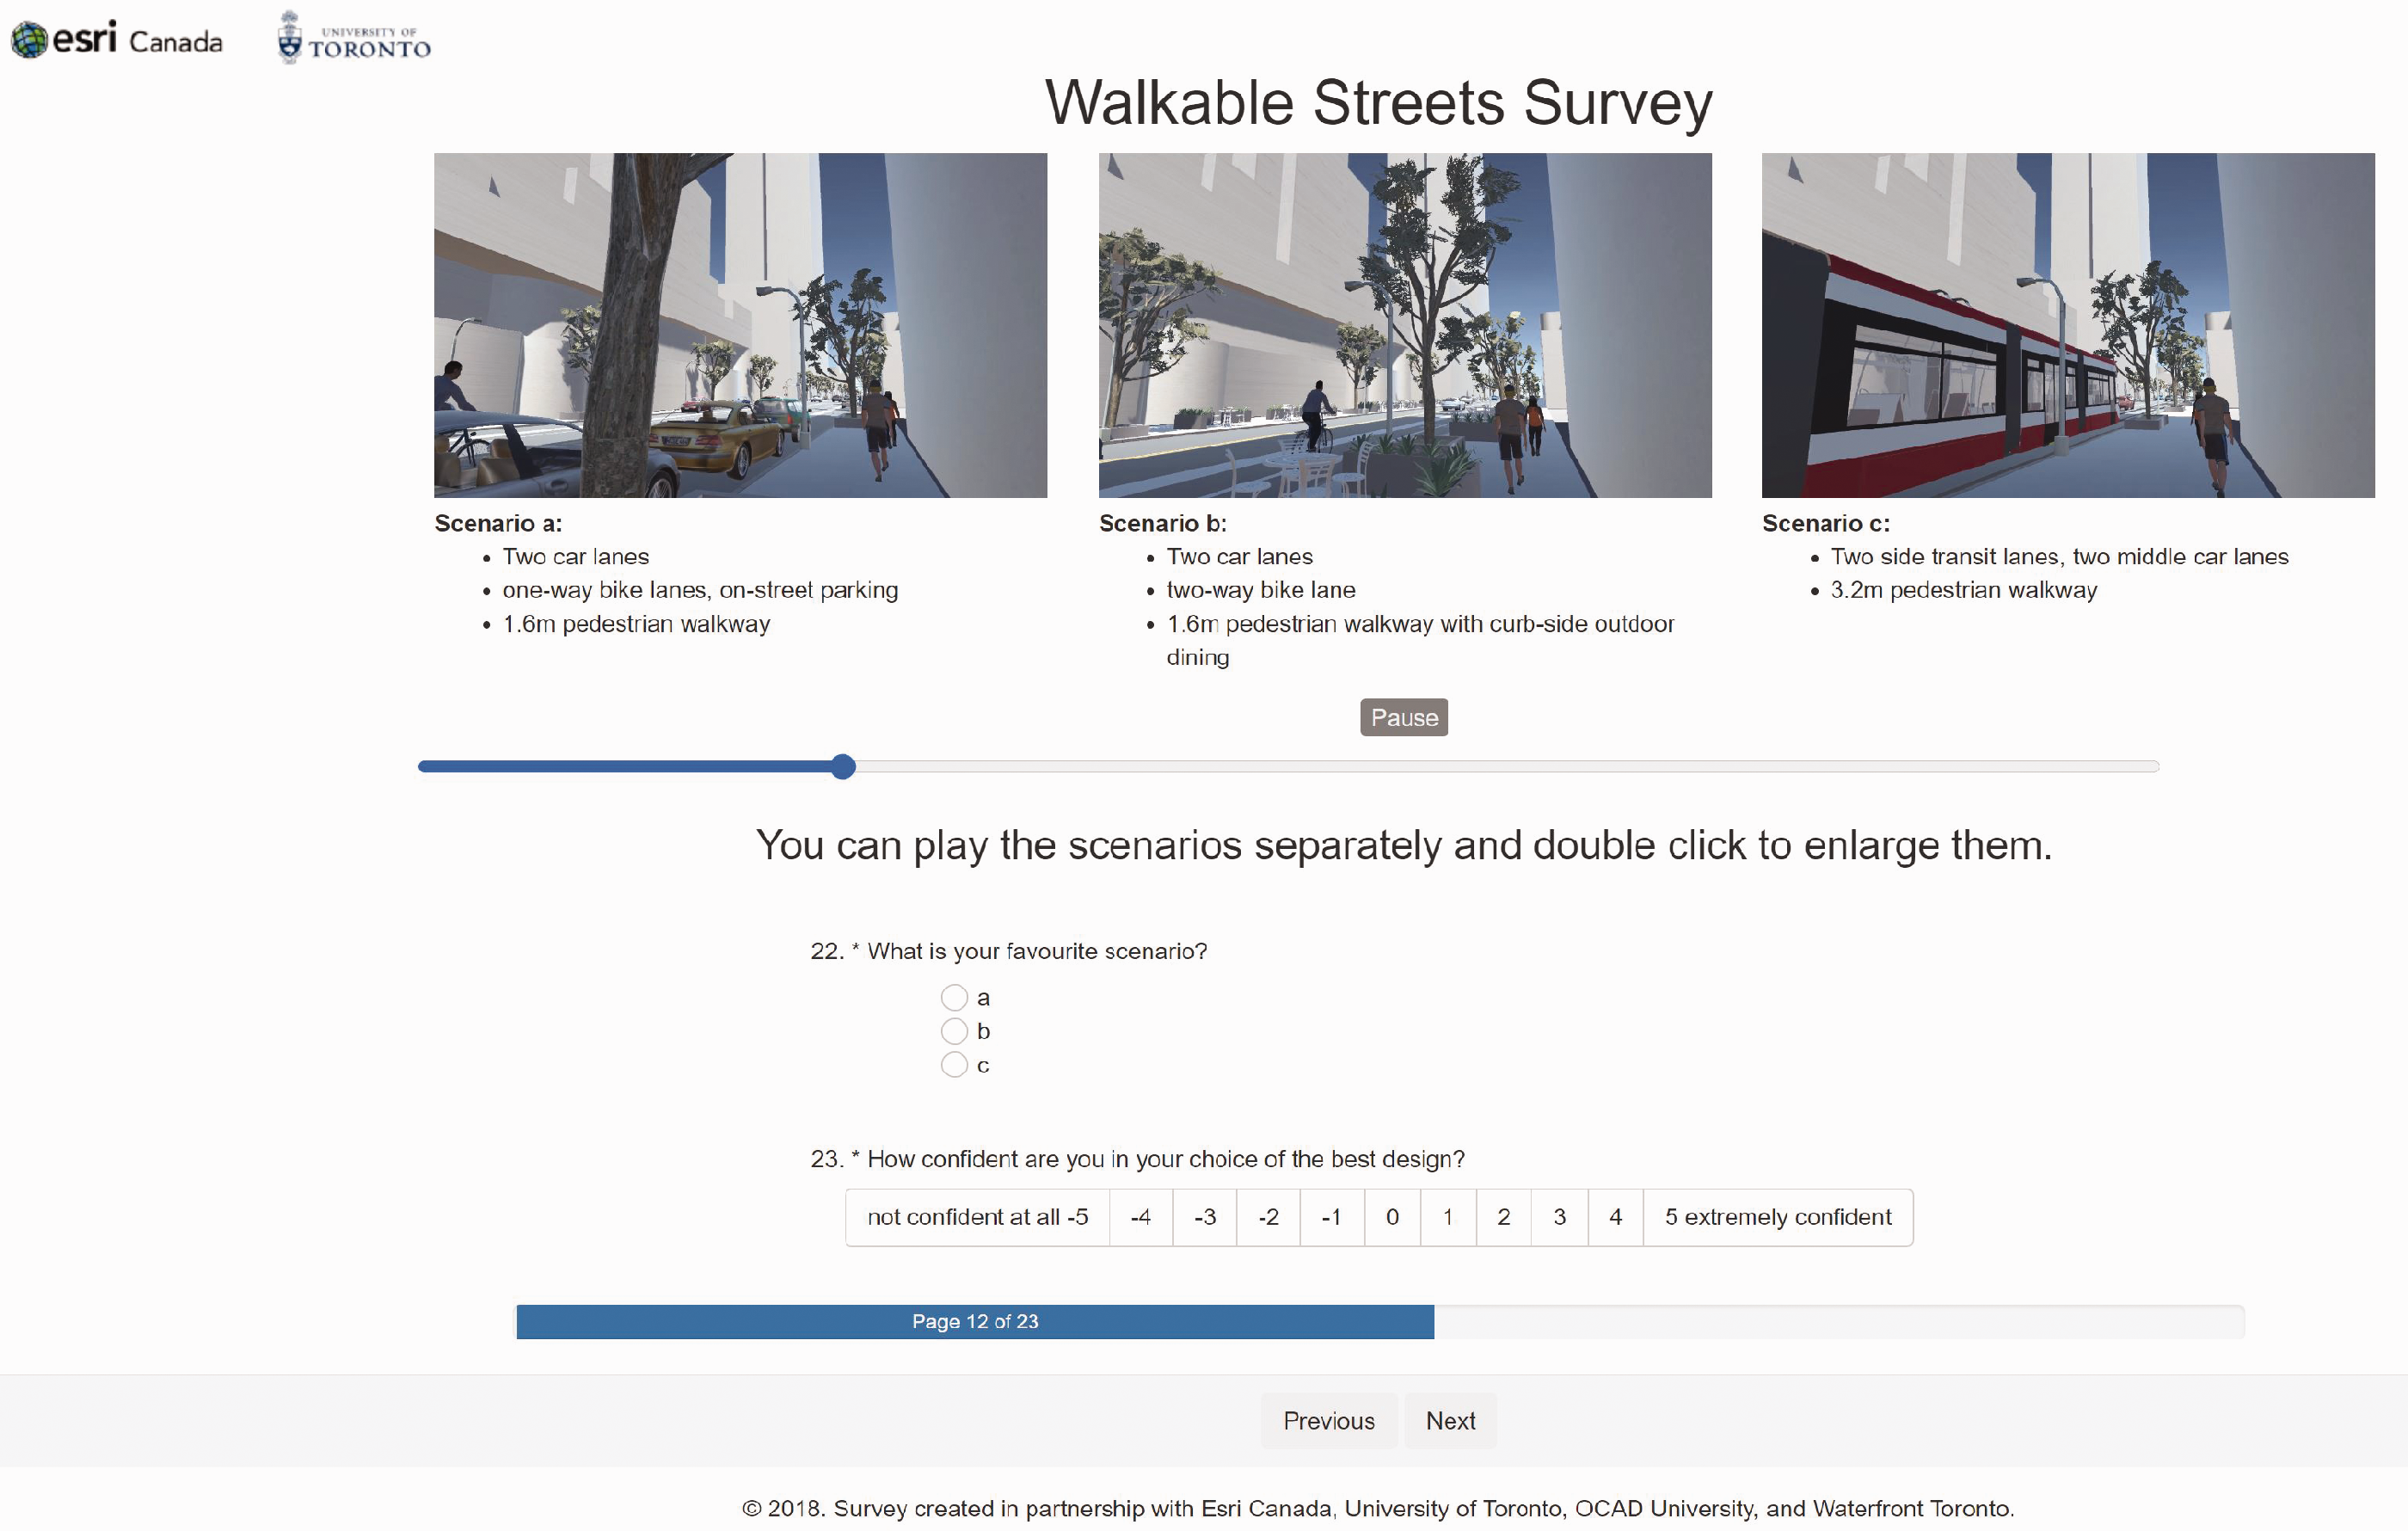
A screenshot of the dynamic Walkable Streets 3D Survey.
The investigated attributes, locations, and visualization details are discussed and refined throughout the survey design with input from expert meetings with different project partners. The survey was first piloted on a sample of 100 students, staff, and planning contacts of the University of Toronto. Reported attitudes toward the survey respondent burden are mixed. Almost half of the respondents admit that it was hard to distinguish between the three scenarios on each webpage by only looking at the videos, while the other half report no difficulty in doing so. Most of the respondents agree that they could not easily identify scenarios that were better than the rest, indicating that they had to make trade-offs in their choices. Based on the feedback, attribute levels are specified more clearly in the form of bulleted text below each scenario to draw respondents’ attention to the specifically investigated attributes and facilitate the differentiation between the scenarios.
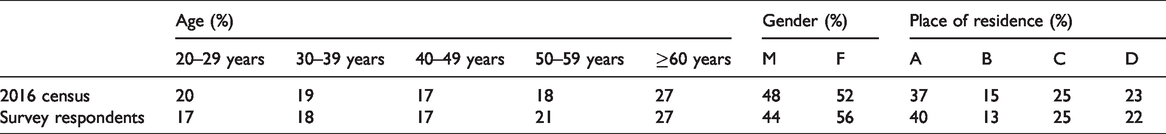
The survey consists of 600 Torontonians recruited through “Canadian Viewpoint”, a market research firm. Filtering questions are incorporated at the beginning and end of the survey to ensure a representative sample of Torontonians. The final sample resembles the general population of Toronto by age, gender, and place of residence, as shown in Table 4.
Survey respondent profile versus census profile regarding age, gender, and place of residence in percentages.
Mixed multinomial logit model
Respondents’ choices are analyzed using a discrete choice model. A logit model is used for discrete choice contexts, in which a decision maker makes a discrete choice out of several mutually exclusive and collectively exhaustive alternatives (Train, 2002). This model becomes a multinomial logit (MNL) model when the number of alternatives within a choice set is more than 2. Here, the decision maker would obtain utility for specific alternatives, but since there are aspects to the utility that the researcher cannot observe, random utility theory suggests that the utility function takes the form of equation (1) (Train, 2002)


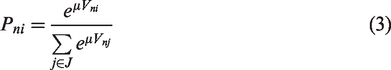
In equation (1), Uni is the utility obtained by the decision maker n from choosing alternative i, Vni is the systematic or representative utility observed by the researcher using the explanatory variables and parameters shown in equation (2), and εni is the random utility (error term) which captures the factors affecting the utility not included in Vni (Train, 2002). A logit model assumes that the error terms of all alternative utility functions (of corresponding choice alternatives) are independently and identically distributed (IID) Type I extreme value with the common scale parameter of μ. Based on this specification of the error term, the choice probability given J number of alternatives in an MNL model is represented in equation (3) as
For this study, a mixed multinomial logit (MMNL) model is used as a variation to the MNL model. The MMNL model is used to overcome the shortcoming of the MNL model regarding its assumption of the error term as IID extreme value. The IID assumption implies that the introduction or improvement of any alternative has the same proportional impact on the probability of each other alternative (Wittink, 2011). More specifically, the MNL model does not consider multiple observations for the same person (panel effect) and fails to account for random preferences (differences in parameter β between surveyed individuals) (Cascajo et al., 2017). The MMNL model can overcome these restrictions by allowing randomness in coefficient β across individuals and correlation in unobserved factors for different choices made by the same respondent (Train, 2009). The equation for MMNL is shown in equation (4) as

Here, the error term, εnit, is distributed as IID Type I extreme value for choice task (t), decision maker (n), and alternatives (i). However, to accommodate for the fact that all choice tasks made by a particular respondent can be correlated, one or multiple parameters (β) are considered to be multivariate normally distributed with a probability density function of f(β).
As a result, the choice probabilities of the MMNL model are integrals of a standard logit model over a probability density function of random parameters, shown in equation (5) as
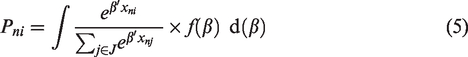
This probability equation is a weighted average of the logit formula at different random values of β with a density, f(β). As a result, there are two sets of parameters entering the model: the parameter β with a density f(β), and the parameters describing this density. In this study, β was assumed to be normally distributed with a mean and variance used to describe f(β) (Train, 2009). Also, the choice of the variable for the random coefficient in the model was determined by specification tests based on the Akaike Information Criterion (AIC) and associated t-statistics. The AIC test is defined in equation (6) as

Results
Model results
Data are analyzed using an open-source choice modeling software called BIOGEME (Bierlaire, 2015). Specification testing is carried out in three stages. First, each attribute level describing the through lane, curb lane, and the sidewalk is tested to determine its singular effect on the utility. Second, different combinations of statistically significant variables from the previous step are tested. Third, socioeconomic variables are interacted with the attribute levels to test preferences of specific socioeconomic groups. The final MMNL model with explanatory variables and their parameter values, as well as an MNL model for comparison, is shown in Table 5.
MMNL panel model results from survey data and MNL model for comparison.
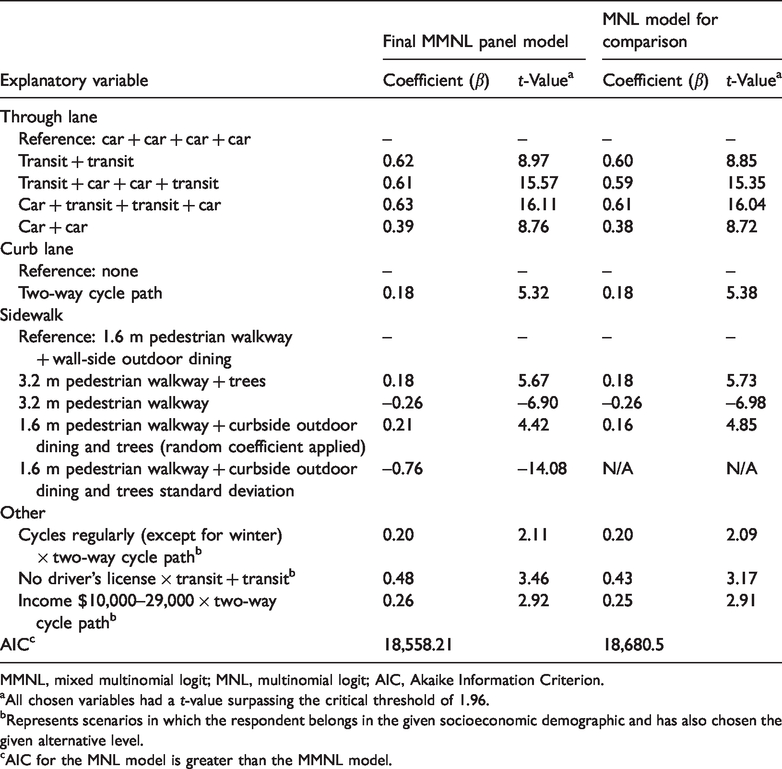
MMNL, mixed multinomial logit; MNL, multinomial logit; AIC, Akaike Information Criterion.
aAll chosen variables had a t-value surpassing the critical threshold of 1.96.
bRepresents scenarios in which the respondent belongs in the given socioeconomic demographic and has also chosen the given alternative level.
cAIC for the MNL model is greater than the MMNL model.
Each model trial is assessed by considering three indicators, namely, the value and sign of β compared to a reference variable, the t-value which should pass the threshold critical value of 1.96 (absolute value) for a two-tailed t-test at the 95% confidence level, and the AIC where a smaller value means a better model. The final MMNL model’s parameters are all statistically significant (α ≤ 0.05), and it has the lowest AIC among all trials while meeting the threshold t-value and exhibiting β values with reasonable sign and magnitude.
For the through lane, all the options with transit are preferred over the four-lane car reference variable. The car + car through lane option also performs better than the reference but has a lower preference than the transit options. This demonstrates a general favorability for transit options in the through lane for the entire survey population. In addition, those who do not have a driver’s license have a stronger preference for the option with transit-only lanes. This is expected as this group of respondents would not have access to a personal automobile as a mode of transport and, as a result, would prefer transit options.
For the curb lane, the two-way cycle path performs better than the alternative “none” where the sidewalk is adjacent to the through lane. This preference is observed more strongly for respondents that cycle regularly (except for winter), and those within the income bracket of $10,000–29,000. Participants that cycle regularly are more likely to prefer designs with more cycling infrastructure as it would sustain their mode of choice. Additionally, the $10,000–29,000 is a lower income bracket, and their greater choice of cycle paths could be related to the expense associated with personal automobile and transit modes, which may lead them to a greater affinity for cycling infrastructure. Interestingly, neither the on-street parking option nor the one-way cycle path option has a significant effect on the choice meaning that they are not clearly preferred compared to the reference option with a through lane adjacent to the sidewalk.
In the sidewalk scenario, the options “1.6 m pedestrian walkway and curbside outdoor dining and trees” and “3.2 m pedestrian walkway + trees” yield positive results. The option with the outdoor dining has a higher parameter magnitude, which shows that respondents prefer some amount of activity on sidewalk curbside instead of just a wider walkway with trees as a general preference. In contrast, the option with just a 3.2 m pedestrian walkway has a lower preference compared to the reference. This shows that there is a general preference for the sidewalk to have some activity and trees even if it means having a narrower sidewalk.
Conclusion and discussion
This paper’s main contribution is the use of an innovative SP survey generated using a rule-based dynamic 3D digital environment to investigate the importance of and trade-offs between roadway and sidewalk attributes in the pedestrian attractiveness of streets. The responses of a representative sample of 600 Torontonians are analyzed using a MMNL model with panel effects. While the scenario locations are based on actual streets in Toronto, they are represented in a sufficiently generic way to allow the generalization of results to a wide range of streets with varying widths in any location in any city. Hence, the findings of this survey could be useful for other cities that require an evidence-base for selecting street design attributes to enhance pedestrian experiences. The survey setup and methodology can be applied elsewhere in combination with context-specific attributes. This survey also provides an example of a multi-stakeholder interdisciplinary collaboration between academia, public organizations, and industry.
The findings of this research have several implications for the (re)design of existing and new streets to increase their attractiveness from a pedestrian viewpoint. First, of the roadway and sidewalk characteristics included in this study, the number and type of through lanes (car or transit) are the most critical influencers of street attractiveness to pedestrians. There is a high preference for streets that include transit lanes over streets with car-exclusive lanes. Thus, it is necessary to provide a balanced mix of car and transit options where demand for transit is present. On-street parking, on the other hand, does not enhance street attractiveness for pedestrians and should not be introduced for the purpose of providing a buffer from the through lanes to improve the pedestrian experience. The location of transit in the center lanes rather than the curbside, which is the case in many existing Toronto streets, also does not have a significant effect on perceived attractiveness.
Second, wide cycle paths which can accommodate two-way cycling on the curb lane show the highest preference, compared to those where the sidewalk is directly adjacent to the through lanes. Regular cyclists and those within the lower income bracket of $10,000–$29,000 show greater preference for this alternative, which can be attributed to the economic benefit of cycling as a mode of travel by those who cannot afford the costs of private car ownership and transit use.
Third, on the sidewalk, high priority should be given to preserving existing trees and introducing new ones. For new streets, trees should be incorporated in the design from the beginning because they are costly to add later. The combination of trees and curbside outdoor dining is highly rated. This is a potentially effective solution that combines the benefits of trees, lateral separation from the traffic and activity on the sidewalk. For existing streets that lack trees, introducing parklets that combine trees and activities such as outdoor dining, on former curbside parking spots is a useful strategy. This strategy, which has recently been piloted on King Street in downtown Toronto (Figure 1), should be considered on other streets. Finally, it is found that widening of the sidewalks alone is not enough to make the streets attractive for pedestrians. More trees and activities on the sidewalk, especially on the curbside, are preferred even if they come at the cost of sidewalk width.
A number of limitations of this study could lead to productive improvements in future research. It is important to acknowledge that some of the choices of controlled variables that implicitly set the context of the animated scenarios may have influenced the results and impose some limitations on the generalizability of the conclusions. These choices include the assumption of daytime conditions, a relatively low density of pedestrians shown in the animations, non-inclement weather, and traffic conditions that are uncongested. Other elements of context have not been defined, for example temperature, the size of the walking party, and travel purpose (e.g. leisure versus commuting). This study also limits the SP analysis to elements of street design, while analysis of other important urban design elements, such as building facades, shelter, lighting, street art, and the treatment of intersections, are all possible areas of investigation for future research.
The effects of respondent burden associated with the new dynamic 3D survey, in comparison to conventional SP survey presentation modes, also calls for further analysis. Future research can build on the research of Patterson et al. (2017) and Arentze et al. (2003) and specifically investigate the potential survey-introduced bias and respondent burden between dynamic 3D visuals versus text- or image-only SPs.
Furthermore, while SP surveys are suitable for investigating perceptions of street attractiveness, there may be a discrepancy between respondents’ indicated preferences and their actual behaviors (Louviere et al., 2000). To overcome this issue, specific benchmarks can be used to gauge the respondents’ indicated choices (Hasnine et al., 2017). Here, we have collected the respondents’ confidence in their ratings for each choice set, which will be used to estimate a joint SP-RP model in future research.
This paper also only focuses on pedestrians, an overlooked group in the literature (Hui et al., 2018). In the context of design for complete streets, it would be interesting to investigate how different streetscape designs are perceived by other street users (motorists, cyclists, and business owners), to identify and plan for the points of contention and compromise.
Finally, this survey is easily adapted to a VR platform, which could provide a greater degree of realism in a behavioral survey to investigate the effects of various design characteristics (Erath et al., 2017).
Overall, the research has contributed substantively to the evidence-base on pedestrian-based perceptions of street design, via a novel application of 3D animation in a carefully constructed SP survey design and a rigorous mixed logit modeling technique. 3D animation in SP surveys can be considered a viable approach and methodology for planners faced with making challenging trade-offs concerning the best use of valuable street space in urban areas.
Footnotes
Acknowledgements
We acknowledge the input from many people from the City of Toronto, Ontario College of Art and Design, University of Toronto, and Waterfront Toronto and that gave valuable input and advice on the design and conduct of the survey.
Declaration of conflicting interests
The author(s) declared no potential conflicts of interest with respect to the research, authorship, and/or publication of this article.
Funding
The author(s) disclosed receipt of the following financial support for the research, authorship, and/or publication of this article: This project was made possible with funding from the Ontario Research Fund—Research Excellence Round 7 Project 07-039, the City of Toronto and Esri Canada.