
Abstract
In order to contain commuting distance growth and relieve traffic burden in mega-city regions, it is essential to understand journey-to-work patterns and changes in those patterns. This research develops a planning support model that integrates increasingly available mobile phone data and conventional statistics into a theoretical urban economic framework to reveal and explain commuting changes. Base-year calibration and cross-year validation were conducted first to test the model’s predictive ability. Counterfactual simulations were then applied to help local planners and policymakers understand which factors lead to differences in commuting patterns and how different policies influence various categorical zones (i.e. centre, near suburbs, sub-centres and far suburbs). The case study of Shanghai shows that jobs–housing co-location results in shorter commutes and that policymakers should be more cautious when determining workplace locations as they play a more significant role in mitigating excessive commutes and redistributing travel demand. Furthermore, land use and transport developments should be coordinated across spatial scales to achieve mutually beneficial outcomes for both the city centre and the suburbs. Coupled with empirical evidence explaining commuting changes over time, the proposed model can deliver timely and situation-cogent messages regarding the success or failure of planned policy initiatives.
Keywords
Introduction
Most mega-city regions around the world are suffering from an ongoing increase in both the number of commuting trips and the average passenger kilometres travelled in journeys to work (Aguilera et al., 2009). Understanding commuting patterns and long-term changes in those patterns is crucial not only because commuting patterns can reflect residents’ responses to planned urban changes, but also because analysing these patterns can contribute to better decision making that optimises urban spatial structure and reduces excessive commuting (Glaeser, 2011).
However, investigating commuting patterns and changes is never an easy task. Well-established commuting origin–destination (OD) matrices are rarely accessible, particularly at lower-level geographic units (Stopher, 2009). Moreover, the causal relationship between changes in urban form and spatial interaction is difficult to quantify due to the complicated mechanisms underlying urban growth (Jun, 2020).
This research aims to address these challenges by developing a decision support tool that reveals relationships between commuting pattern changes (bottom-up) and planned urban developments (top-down) using quantifiable evidence. It introduces increasingly available mobile phone data (MPD), as well as conventional statistics, into a theoretical urban economic framework (i.e. recursive spatial equilibrium) to understand causality. Through calibration and validation, the proposed planning support model can be used to conduct counterfactual simulations to identify the key determinants in observed changes and can be further extended to forecast policy outcomes across a variety of hypothetical (‘what-if’) scenarios.
The proposed model offers a practical contribution to urban planners, namely explaining the factors that lead to commuting changes and exploring what the influence of a particular policy would be on commuting patterns. Quantitative evidence from the model findings supports the identification of key stakeholders and facilitates the plan-making process in a local context (see, for instance Deal and Pan, 2016; Pan et al., 2019; Pelzer et al., 2014). In addition, the collaborative use of the model and MPD partly addresses the persistent criticism regarding the data hungriness of the theoretical models (Lee, 1973). The enrichment and more in-depth exploration of empirical data sets (especially those dealing with individual behaviours) provide an unprecedented opportunity to better calibrate theoretical urban models and test their predictive ability over time. This deepens the modellers’ understanding of the capabilities and limitations of the theoretical models in their practical application.
The rest of the paper is organised as follows. The next section reviews the existing literature in this area, describing the determinants of journey-to-work patterns and identifying gaps that must be closed. A planning support model, based on a recursive spatial equilibrium framework, is then proposed to understand commuting patterns and changes. Next, the model is applied to the case study of Shanghai, highlighting the processes and results of the base-year calibration and cross-year validations. The model results are further discussed through comparing observed realities with counterfactual scenarios. Finally, the research concludes with policy implications for planners and urban decision-makers.
Literature review
A growing body of literature has extensively studied the determinants of commuting patterns. Although it is acknowledged that the geographical distribution of jobs and residential locations play a critical role in explaining journey-to-work patterns (Levine, 1998), the empirical findings regarding the effects of the jobs–housing relationship are inconclusive. Some researchers find that a tight jobs–housing relationship – regardless of adopted measurements (e.g. jobs–housing ratio and relative distance) – reduces travel time or distance (Cervero and Wu, 1997; Hu et al., 2020). However, other evidence suggests that, in light of other more critical factors, the impact of jobs–housing co-location on commuting patterns is marginal (Giuliano and Small, 1993; Levine, 1998). For instance, socioeconomic attributes and neighbourhood quality also influence residential location choices and journey-to-work patterns (Aditjandra et al., 2013; Pan et al., 2020; Yuan, 2018). Due to contextual differences in socioeconomic background and urban development stages, it remains inconclusive which factor – jobs, housing or some other element – is more determinant in influencing commuting flows.
From a theoretical perspective, the standard economic analysis of where people choose to live and work hinges on a locational trade-off between commuting and housing costs (Anas et al., 1998). In high-employment areas, inadequate housing supply drives up rent prices and leads to longer commutes (Yang et al., 2019a). It is clear that urban spatial structure and travel are influenced by a variety of actors – such as firms, households and governments – in a dynamic relationship (Bröcker and Mercenier, 2011; Lim et al., 2015). Changes in urban form result in shifts in spatial interactions. For instance, urban policies oriented towards employment suburbanisation tend to reduce excess commuting (Hu et al., 2020), whereas residential suburbanisation lengthens commute travel time and distance (Burapatana and Ross, 2007). However, urban economic models are seldom applied to detailed geographic scales due to their hungriness for data in various urban sectors (e.g. estate property and labour) that are more likely to be available at the regional or country level.
The data challenges facing empirical studies of the job–commute–residence nexus increase when taking into account cross-year changes. Commuting data sets that allow for the systematic tracking of change are conventionally derived from the results of costly and time-consuming official surveys administered on a regular basis (Bricka and Bhat, 2006). These survey results are typically not easily accessible at a fine spatial scale, even in developed countries (Hickman and Banister, 2015). Recent years have seen the emergence of new digital sources (e.g. location-based services and cellular signalling data) that have great potential to illustrate individual travel behaviours across years (Jahani et al., 2017). These data are especially promising for low- and middle-income cities where established commuting data sources are not available (Yang et al., 2019a).
This study aims to bridge the gaps between practical implications, theoretical models and empirical data in understanding and quantifying cross-year commuting changes with fine spatial granularity. This research contributes to the literature on urban form and travel by proposing a collaborative use of emerging location-based data source, conventional statistics and theoretical urban economic models for reciprocity.
A planning support model for understanding commuting patterns and changes
Theoretical framework
This study adopts a computable general equilibrium framework of the spatial economy (Arrow and Debreu, 1954; Burfisher, 2011), in which spatial costs determine the location choices of consumers (i.e. households) and producers (i.e. firms) as well as the accompanying changes in urban flows (i.e. journeys to work and freight trips). Specifically, this research used a recursive spatial equilibrium model developed by Jin et al. (2013) and Yang et al. (2019a) to simulate the interactions between the labour, 1 product 2 and floorspace 3 markets, in response to land use and transport planning policies. Although there are many similar land use-transportation interaction models (for a detailed list, see Wegener, 2004), the spatial equilibrium approach was selected here for its advantage in determining market price with solid microeconomic foundations, which is regarded as a key determinant in location choices (Anas et al., 1998). There are many systematic reviews of applied urban models, such as Batty (2009) and Wegener (2014). However, this paper focuses primarily on how these computer models can be combined with empirical evidence and how that combination can contribute to planning practice.
The proposed theoretical model differentiates between the ‘predictable’ and the ‘unpredictable’ in its application stage. On the one hand, many changes in the future are hard to predict and are therefore identified as model inputs. ‘Unpredictable’ changes include (a) uncertain events (e.g. geopolitics and trading relations), (b) uncertain outcomes of political processes (e.g. specific housing targets) and (c) decisions about large-scale infrastructure (e.g. accessibility improvements). On the other hand, the law of large numbers ensures the predictable behaviours of business, institutions and citizens, in response to the unpredictable changes mentioned above. These predictable behaviours are endogenously determined in the model and include (a) residents’ location choices and consequent commuting patterns, (b) property prices and (c) utility changes. A technical description of this model, providing details about its variables, parameters and equations, is documented by Jin et al. (2019).
The scenario planning exercises applied in this research follow the multidirectional temporal analysis proposed by Deal et al. (2017). Moving beyond traditional forward-looking forecasting (Geertman and Stillwell, 2004), this study explores the science of planning support through addressing historic ‘what-if’ questions, known as counterfactuals (Ma and Jin, 2019). Given the certainties from what actually happened, counterfactual scenarios can be navigated throughout the timeline to help model users (e.g. academics, planning practitioners and policymakers) better understand urban changes.
Calibration and validation
Figure 1 illustrates the complete workflow of model development. The planning support model begins with the base year for calibration and is run through the present year for validation with observed data sets. A full commuting OD matrix in the model base year is essential to calibrate all model parameters. For cities with systematic and accessible commuting data sets, the full OD matrices from the official statistics can be applied directly. However, such data sets are neither readily available nor easily accessible in developing countries, especially for lower-level geographic units. In such situations, estimations are prevalent, leveraging the available partial flow data (i.e. MPD) and zonal constraints (i.e. the number of employed residents and workers based on the official statistics) to construct a full OD matrix.
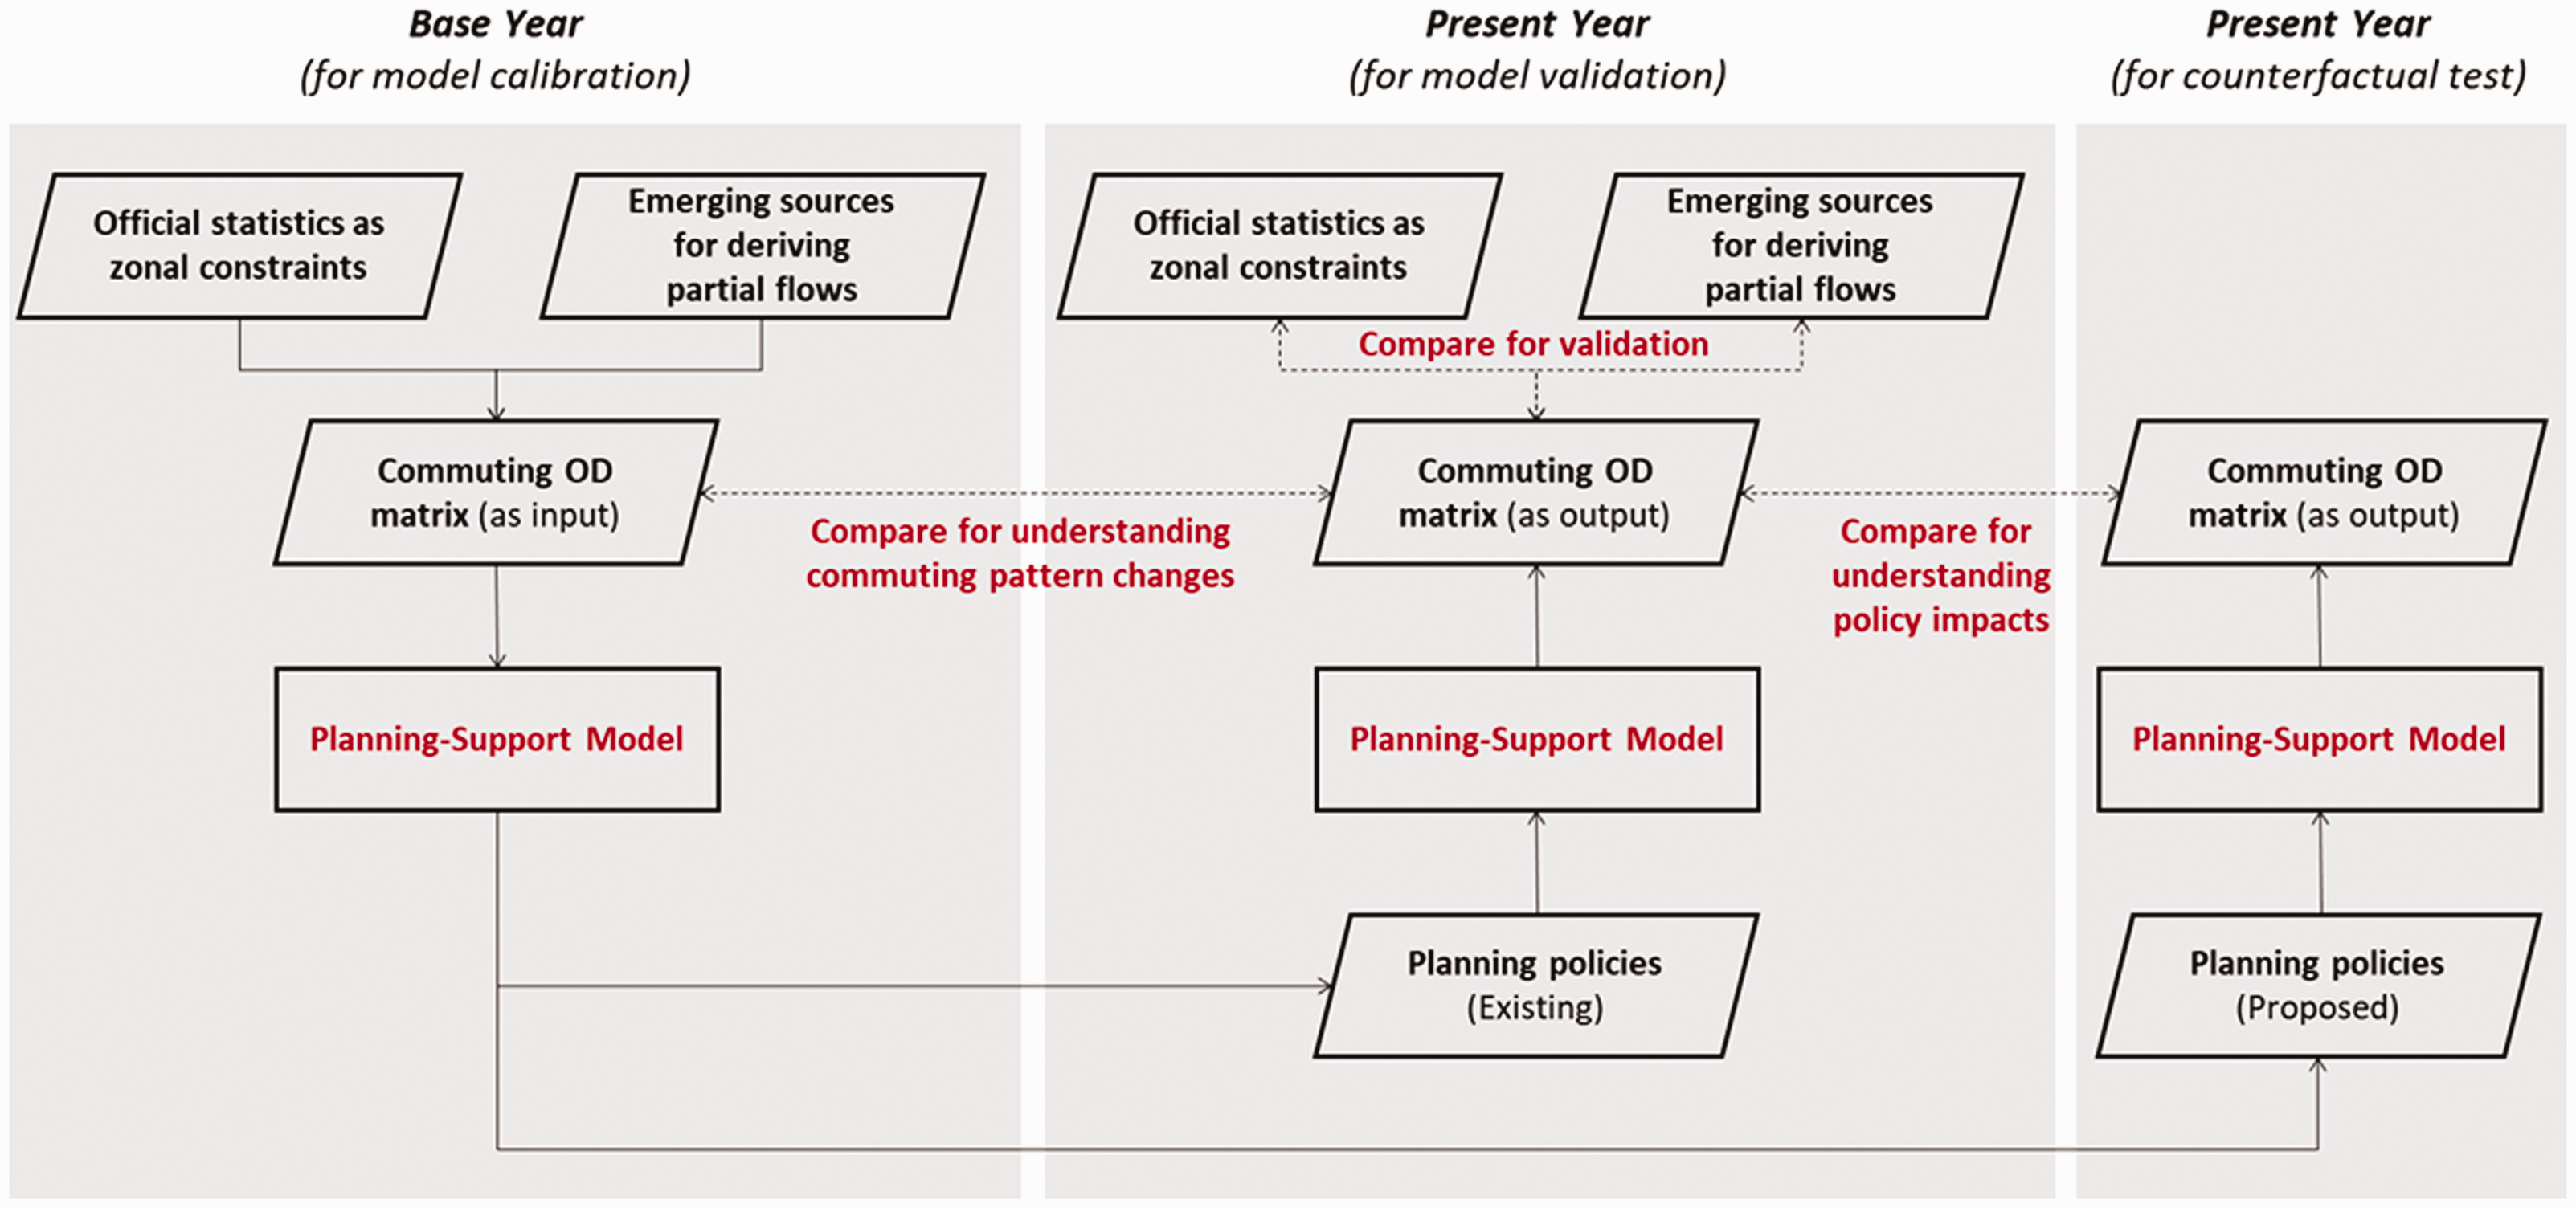
Framework of the counterfactual analytical model for understanding commuting changes. OD: origin–destination.
The calibration is followed by cross-year validations, which aim to test the model’s ability to forecast and to verify the stability of the model parameters (Miller et al., 2011). Based on the calibrated base-year model, the model inputs can be changed for other years. The updated model outcomes can be then compared with the observed realities for years when local statistics are available. This helps to explicate a model’s performance and to identify variables and geographical areas that are not adequately explained and predicted by the model simulation.
Counterfactual test for understanding policy impacts
Using a well-calibrated and validated model, counterfactual policy inputs can be designed to test a range of alternative urban development options (Deal et al., 2017). The resulting changes in commuting patterns can then be compared with the benchmark to measure the influence of a given policy. The causality derived from the spatial equilibrium framework enables model users to explore causes and effects during counterfactual tests.
The same approach can be extended to understand the longer-term commuting effects of planned interventions where the local comprehensive plan over an extended period of time is available and quantifiable (see, for instance Yang et al., 2019a). It is important to note here that the value of the counterfactual test is not its ability to precisely quantify the ‘predictable’, but its role in explaining the extent of the impact of policy interventions on travel.
Model applications
Study area
This study applied this theoretical model framework to Shanghai. In Shanghai, massive spatial restructuring and changing commuting patterns have been observed (Day and Cervero, 2010), but little quantitative evidence exists on the relationship between them. As indicated in Figure 2, the city growth is characterised by (a) a highly dense city centre wherein the highest zonal density of employed residents reaches over 20,000 per square kilometre, (b) a sprawl trend in which employed residents’ density begins to fade in the near suburbs and diminishes in the far suburbs and (c) polycentric developments, as reflected in the density peaks in remotely planned sub-centres.
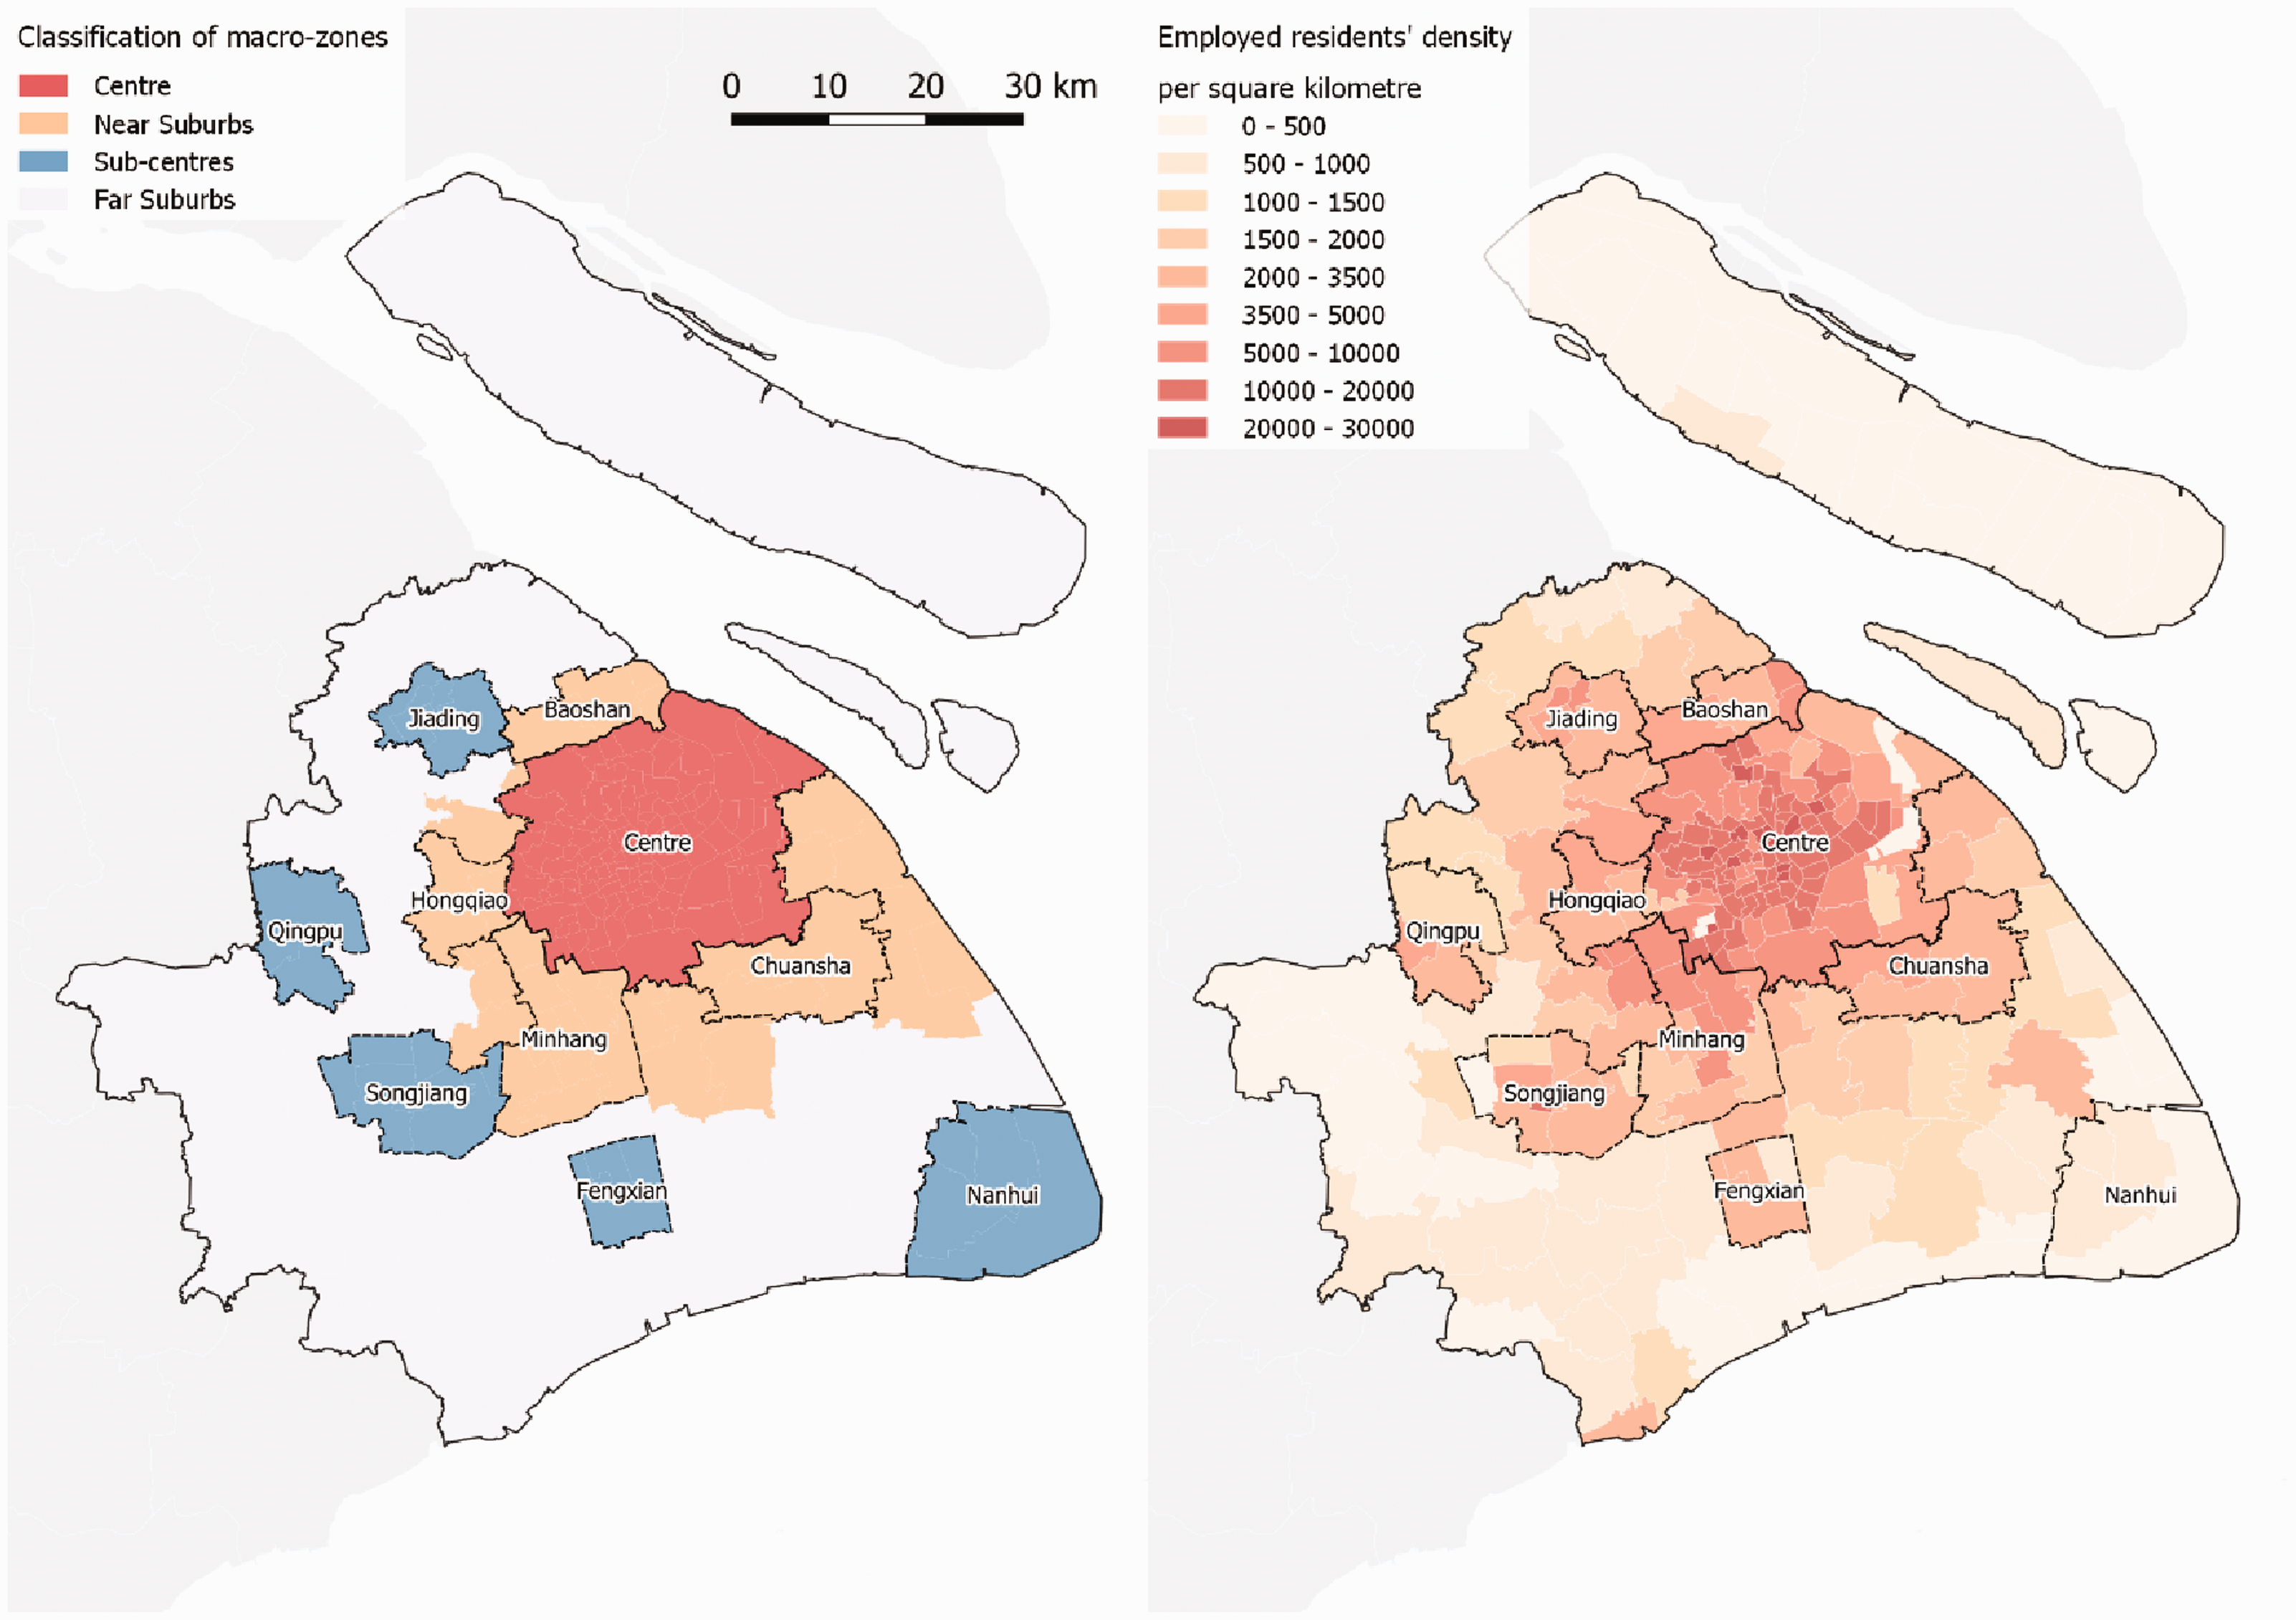
Zonal types and employed residents’ density.
Shanghai’s zoning system follows the sub-district-level administrative divisions, creating 233 zones in total (‘micro-zones’). To enable a more general overview in the following analysis, these micro-zones are grouped into four macro-zones – the centre, near suburbs, sub-centres and far suburbs – in accordance with their delineations in the latest Shanghai Comprehensive Plan (2017–2035).
The distributions of population and economies at the zonal scale are regularly surveyed and released on a five-year basis. However, how residents travel across zones remains unclear. In addition, despite ongoing planning efforts to relieve the overcrowded urban core, traffic conditions have continuously worsened, particularly in the city centre (Cervero and Day, 2008). The rapid urbanisation process is expected to bring more migrants to Shanghai from the wider catchment area in the Yangtze River Delta (Yang et al., 2019b). As a result, this case provides a representative example for understanding commuting changes in other urbanising mega-city regions characterised by booming transport demands and increasing congestion.
Model development
The MPD has been utilised here to generate partial journey-to-work flows. After a cell phone communicates with its cellular network via a cell tower, a record of this communication is generated, consisting of a cell tower ID (used for aggregation to the zones defined above), a device ID (anonymised for research uses), a timestamp and a description of phone activity (e.g. calls, messages and periodic location updates). These records can identify the specific zones in which a mobile phone user tends to be located at different times over the course of a day.
In this case study, two sets of MPD records were collected from the largest local cell phone carrier (with a penetration rate of over 50% of the total population) for two weeks in March 2011 and two weeks in March 2014. The locations of the cell towers with the highest accumulated visiting hours during the day (9:00 a.m. to 5:00 p.m.) and night (midnight to 6:00 a.m.) were assumed to be the potential locations of a mobile phone user’s workplace and residence. The identification of a particular location as a user’s workplace or home was considered valid only when the most-associated cell tower appeared in more than 5 out of 10 weekdays in the data collection period. In total, 3.81 million commuters 4 with valid workplaces and homes were identified in 2011, and 3.82 million 5 were identified in 2014.
It is worth noting that 2000 and 2010 were official census years in China, while intercensal sampling (i.e. 1% of the total population) was undertaken in 2005 and 2015 to support population estimations between official census years. The base year for model calibration was therefore set to 2010 because of the comprehensiveness and reliability of data for that year. Cross-validations will be run between 2000–2010 and 2010–2015. Although MPD records are only available for 2011 and 2014, the overall changes in the commuting patterns between 2010 and 2015 can still be partially reflected.
For the base year 2010, a full commuting OD matrix was estimated using the Fratar (1954) method. The Fratar method is a conventional approach to estimating commuting patterns (Florian et al., 1988) given the observed partial flow patterns and zonal totals. This study used (a) the numbers of employed residents and workers (based on census data) as zonal constraints; (b) the travel disutility (using data from online maps services) with a discrete choice model for constructing matrix seeds (Ben-Akiva and Lerman, 1985); (c) the percentages of intra-macro-zonal commuting (based on MPD) as matrix constraints; and (d) the city–regional-level commuting distance (using data from official travel surveys) as the overall calibration target.
With the changes in the location of jobs and housing floorspace as key inputs, residents’ choices regarding where to live and the corresponding commuting matrix could be generated. The reliability of this prediction has been validated, which is detailed in the ‘Results’ section.
Scenario design
A series of counterfactual scenarios were designed to understand the impacts of policy on commuting pattern changes. To ensure that the scenarios were comparable, the counterfactuals were designed using the same macroeconomic growth (i.e. population, economy and labour at the city–regional level) as that which was actually observed between 2010 and 2015.
As shown in Table 1, recent urban developments (2010–2015) were characterised by a sharp disparity between job growth and housing supply across macro-zones. The number of jobs grew much faster (3.3% annual increase) than housing supply (1.7% annual increase) at the city–regional level. The situation was even worse in the city centre, which witnessed the highest job increase (3.6% annual increase) but the lowest housing supply growth (0.9% annual increase).
Key inputs across scenarios.
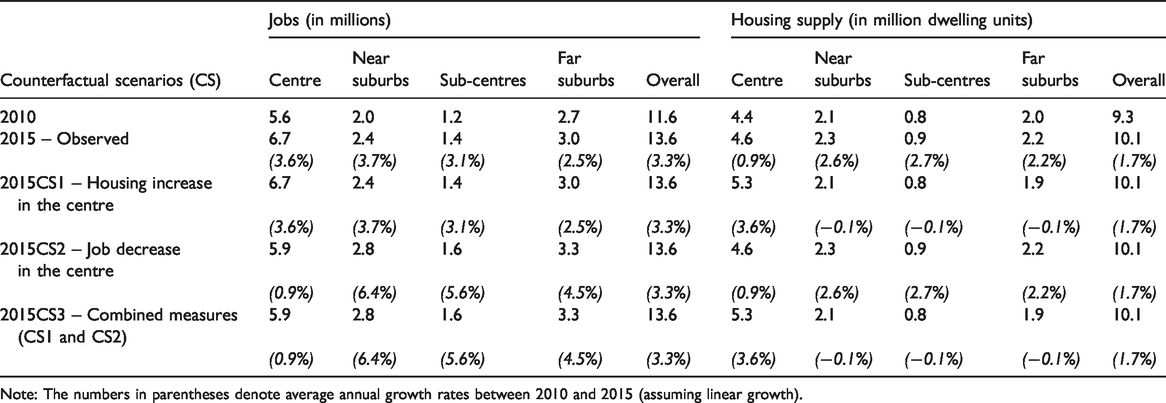
Note: The numbers in parentheses denote average annual growth rates between 2010 and 2015 (assuming linear growth).
Based on the above observations, and with the aim of alleviating traffic pressure in the city centre and across the city region, three counterfactual scenarios were proposed: (a) Housing increase in the centre (CS1), where the jobs and housing share the same annual growth rate (3.6%). (b) Job decrease in the centre (CS2), where employment opportunities are decentralised outside the historic city core. The annual growth rate of jobs in the centre is as low as that of the housing supply (0.9% annually). The decreased number of jobs is then distributed proportionally to suburban areas. (c) Combined measures (CS3), in which the housing supply increases, as in CS1, and jobs reduce, as in CS2.
Note that this study maintains the pattern of zonal growth subject to the designed constraints. In CS2, for instance, the job growth rate in the centre is cut off to match the lower growth rate of housing units (from 3.6 to 0.9%), while the difference in number (0.8 million jobs) is then added to the other zones (outside the centre) proportionally, following the observed zonal growth pattern between 2010 and 2015. Therefore, the city–regional level total remains the same.
Results
Comparison: Changes in commuting patterns
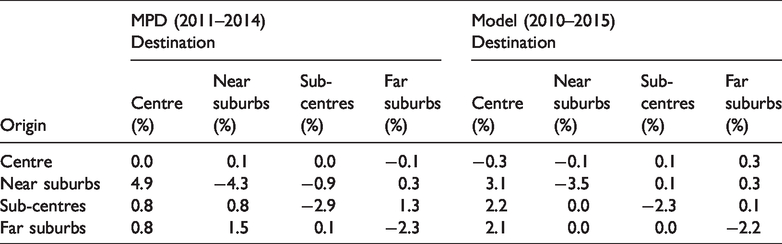
The observed data sets (2011–2014) and modelled outcomes (2010–2015) display similar changes in journey-to-work patterns (Table 2). Overall, the ratios of commuting within macro-zones sharply decrease, with the exception of the city centre, while the percentage of commuters living and working in the near suburbs declines most. The commuting inflow into the city centre grows significantly; residents who used to live in the near suburbs are more likely than before to find a job in the city centre. Overall, the model reveals general changes similar to those observed in the MPD.
Changes in observed and modelled commuting patterns (based on origins).
The commuting distances derived from the MPD and the model both increase with time (Table 3). Due to the calibration of the model, the overall commuting distance at the city–regional level for the modelled outcome in 2010 is the same as that in the travel survey. In comparison, the empirical MPD data sets yield much shorter commuting distances. This is attributed to the overestimation of short-distance commuters, as students and non-employed individuals with regular shopping or recreational behaviours are usually miscounted as commuters (Williams, 2016). It is also noteworthy that, while not calibrated, the modelled commute inflow into the centre yields a distance similar to that reflected in the official statistics. However, the MPD results fail to illustrate a longer commute to the city centre in both year segments.
Observed and modelled commuting distance (in kilometres).
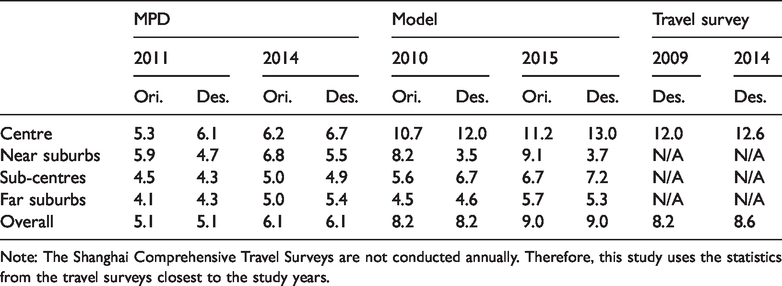
Note: The Shanghai Comprehensive Travel Surveys are not conducted annually. Therefore, this study uses the statistics from the travel surveys closest to the study years.
Whatever the source of pattern changes, the overall commuting situation has grown worse here, as residents and workers in all macro-zones have a longer commute than before. This should serve as a caveat to local planners.
Model validation through the backward and forward forecast
Using the location of jobs and the number of housing units as key inputs, residents’ predicted locations have a good fit with the observed locations (Figure 3). The R-squared value reaches 0.91 in the year 2000 and 0.98 in the year 2015. The model predicts location choices well, with the exception of zones with very dramatic changes, i.e. urban villages 6 and relocation areas. 7
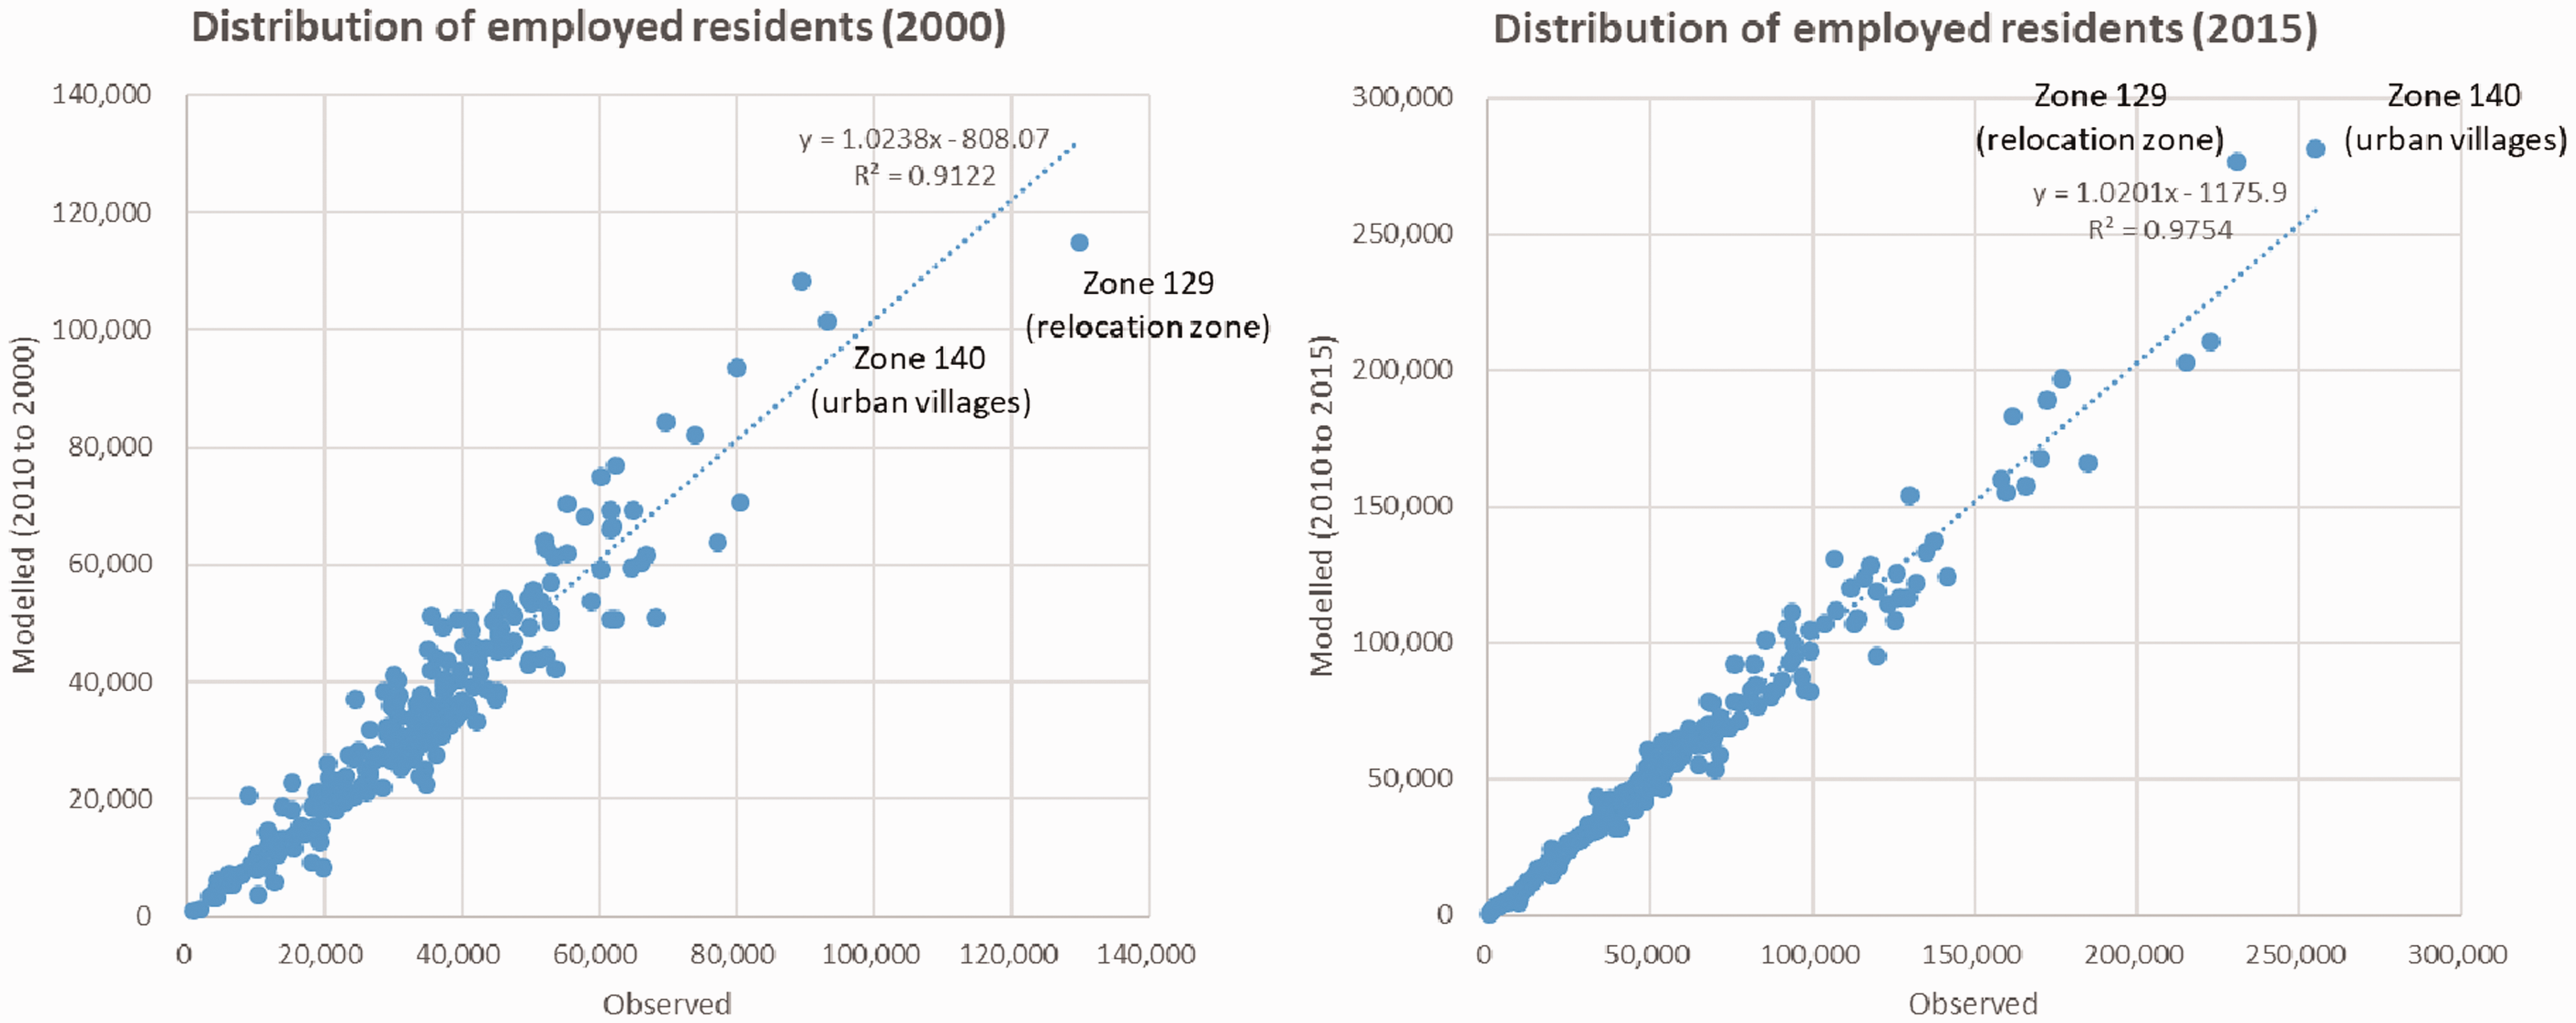
Comparison between observed and modelled resident distributions. (a) Distribution of employed residents (2000) and (b) distribution of employed residents (2015).
Although an illustration of the detailed validation process is beyond the scope of this research, an investigation into the outliers has been carefully examined according to the methods used by Wan and Jin (2017). Those identified dramatic changes can be incorporated into the model forecast beyond 2015 with additional analysis.
Counterfactual simulations as planning support evidence
The observed commuting changes in Shanghai between 2010 and 2015 were characterised by longer journeys across the city and heavier traffic burden in the centre. The average commuting distance grew by 10%, from 8.2 kilometres in 2010 to 9.0 kilometres in 2015 (Table 4). The number of one-way journey-to-work trips within the centre increased from 4.8 to 5.5 million, while the suburban commuting inflows into the centre rose from 0.9 to 1.2 million (Table 5).
Commuting distance growth.
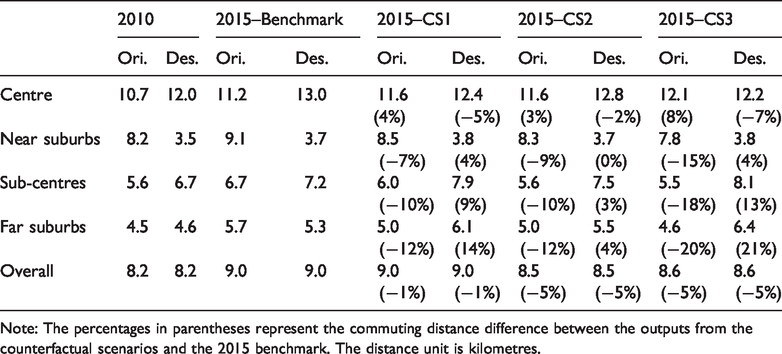
Note: The percentages in parentheses represent the commuting distance difference between the outputs from the counterfactual scenarios and the 2015 benchmark. The distance unit is kilometres.
One-way commuting trips by number (in million) and percentage.
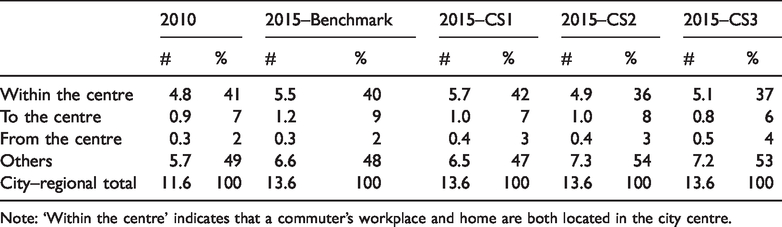
Note: ‘Within the centre’ indicates that a commuter’s workplace and home are both located in the city centre.
The increased trip length and additional travel demands in the centre can be attributed to a mismatch between jobs and housing. During this five-year period, the centre and near suburbs witnessed the highest annual growth rates in employment opportunities (3.6 and 3.7%, respectively), whereas the housing supply was mostly channelled to the sub-centres (with an annual growth rate of 2.7%).
The findings that all counterfactual simulations generated shorter commutes across the city are not surprising, given that all counterfactual scenarios encouraged a better jobs–housing balance, particularly in the city centre, which has the largest population representation. However, a shorter commuting distance is not necessarily associated with better traffic conditions, since the increase in journey-to-work trips in the city centre may also lead to congestion.
In CS1, the increased provision of housing space in the city centre lowers rental prices, thereby attracting more residents. This largely mitigates long commuting trips in the central areas. However, the decrease in average commuting distance to the city centre as a job destination comes at the expense of increasing the number of commuters (5.7 million in CS1 compared with the benchmark of 5.5 million) in central areas during rush hours. Therefore, traffic congestion is likely to be worsened, despite efforts to encourage workplace and home co-location.
Furthermore, the jobs–housing mismatch in the sub-centres and far suburbs is exaggerated in CS1 due to the limited growth of housing stock, which is reflected in longer journeys to work for employees working in these areas. This is consistent with previous research findings that excess commuting is often associated with the misallocation of dwelling units (see, for example Ma and Banister, 2006).
In CS2, the decentralisation of jobs yields shorter overall commutes (8.5 kilometres) and fewer commuting trips (4.9 million) in the city centre compared to CS1 and the benchmark. This scenario best addresses the jobs–housing relationship, since almost all categorical zones yield more coordinated development in the local context. The overcrowded centre can be relieved through the relocation of jobs and resulting residential relocations, whereas the suburban areas lacking employment opportunities can benefit from the employment inflows. These findings provide quantifiable insights based on the existing qualitative studies regarding the travel impacts of jobs and housing provisions (see, for example Hu et al., 2020).
The combined measures in CS3 simultaneously stimulate centralised housing and decentralised jobs. Although this scenario leads to a more balanced jobs–housing relationship in the centre and near suburbs, the counterfactual setting of minimal housing growth and excessive job opportunities in the sub-centres and far suburbs generates longer commuting trips for local employees. At the city–regional level, the combined measures do not lead to an additional decrease in the average journey-to-work distance, despite shorter commutes created in both CS1 and CS2. Indeed, CS3 serves as a representative case indicating that there are no simple solutions to the problems of commuting distance reduction and traffic burden relief, due to a persistent trade-off across geographical areas (e.g. local optimum versus regional efficiency). The spatial trade-off in terms of jobs and housing development calls for a more detailed investigation into the local context (i.e. at the micro-zonal level) to support more carefully designed development options and to achieve mutually beneficial outcomes.
Discussion and conclusions
This paper takes Shanghai as an exemplary city region to experiment with a planning support model that is capable of identifying changes in commuting patterns and examining key drivers behind those changes. This enables urban planners and decision-makers to better understand urban commuting flows at a familiar scale (i.e. following the administrative boundaries at a lower level) and capture the complex interactions between different urban markets (e.g. labour, product and floorspace markets) that result in commute changes.
The introduction of emerging partial flow data sets (MPD in this case) to the proposed model framework makes it possible to construct a complete base-year OD matrix for parameter calibration, although these data sets have numerous limitations in depicting overall commuting patterns if they are used separately (Yang et al., 2019a). Specifically, mobile phone traces reflect a clearer picture of the increasing daily inflows for work in Shanghai’s historic central core. However, the overall commuting distance generated by the MPD differs greatly from the official statistics. This variance might be attributed to the biased sampling of commuters, which is inevitable due to the inaccessibility of the penetration rate of cell phone carriers at the micro-zonal level. The utilisation of the spatial equilibrium model helps address this concern by simultaneously considering broad patterns from mobile phone traces, individuals’ utility and rationality in location choices, and overall commute distances documented in official statistics. Using the base-year commuting matrix, the model was used to generate backward and forward forecasts, which yielded a good fit between observed and modelled data.
The results of the counterfactual simulations reflect the importance of the co-location of jobs and housing in planning practice, while the quantifiable evidence can help formulate policies to reduce city-wide commuting distance and relieve traffic burden in the centre. The policy implications of this research are as follows. First, planners and decision-makers should be more cautious when determining workplace locations, as the location of a commuter’s workplace plays a more effective role in mitigating excessive commutes than the location of their residence. Planning incentives (e.g. provision of urban amenities and transport infrastructure) can be designed to attract employers to the near suburbs and sub-centres, rather than the conventional central business district. Second, although increased housing supply in the centre seems to engender a tighter jobs–housing relationship that leads to shorter commutes, it is also associated with higher commuting demands. Large housing development projects in the city centre should be carefully evaluated to understand whether additional commuters will worsen congestion if their journeys to work are not within a walkable or cyclable distance. Third, land use and transport developments should be coordinated across spatial scales. The findings in the combined measures counterfactual scenario (CS3) suggest that policies which favour only the city centre may yield adverse side effects (i.e. lengthened commutes) in remote areas. Such a zero-sum game can be avoided if more refined and localised policies are explored along with a city–regional planning scheme based on the proposed planning support model.
The planning support framework can be further extended to explore other policy packages and their impacts on commuting changes over the long term, for example, improvements to accessibility and amenities. Coupled with empirical evidence explaining commuting changes over time, the proposed model can deliver timely and situation-cogent messages regarding the success or failure of planned policy incentives. It also reveals a clear causal relationship that helps to identify key stakeholders (e.g. developers, firms and local governments) in the planning process.
A limitation of this study is that commuters have all been placed into the same general category and, as a result, behavioural differences between various socioeconomic or industrial groups have been neglected. Dealing with this issue is within our research agenda, given the availability of reliable data sources that can address the socioeconomic classification of commuting flows. In addition, non-commuting trips 8 and non-employed residents 9 are not addressed in this study. Although the contribution of these factors to weekday travel congestion during rush hours may be limited, investigating the role of non-commuting trips and non-employed residents will be critical in the future, due to the increasing number of linked trips for different purposes (e.g. a break to take a child to school during a journey to shop or workplace) during morning peak hours.
Footnotes
Acknowledgements
The author would like to thank Ying Jin, De Wang, the journal editors and referees for their thoughtful comments on earlier versions of this paper. The author is also grateful to De Wang and his research team for their data support.
Declaration of conflicting interests
The author(s) declared no potential conflicts of interest with respect to the research, authorship, and/or publication of this article.
Funding
The author(s) disclosed receipt of the following financial support for the research, authorship, and/or publication of this article: This work was supported by the Lincoln Institute of Land Policy (grant number i24R001); the Urban China Initiative; and the Cambridge Commonwealth, European and International Trust (Grace & Thomas C H Chan Cambridge International Scholarship).