
Abstract
Obtaining the time and space features of the travel of urban residents can facilitate urban traffic optimization and urban planning. As traditional methods often have limited sample coverage and lack timeliness, the application of big data such as mobile phone data in urban studies makes it possible to rapidly acquire the features of residents’ travel. However, few studies have attempted to use them to recognize the travel modes of residents. Based on mobile phone call detail records and the Web MapAPI, the present study proposes a method to recognize the travel mode of urban residents. The main processes include: (a) using DBSCAN clustering to analyze each user’s important location points and identify their main travel trajectories; (b) using an online map API to analyze user’s means of travel; (c) comparing the two to recognize the travel mode of residents. Applying this method in a GIS platform can further help obtain the traffic flow of various means, such as walking, driving, and public transit, on different roads during peak hours on weekdays. Results are cross-checked with other data sources and are proven effective. Besides recognizing travel modes of residents, the proposed method can also be applied for studies such as travel costs, housing–job balance, and road traffic pressure. The study acquires about 6 million residents’ travel modes, working place and residence information, and analyzes the means of travel and traffic flow in the commuting of 3 million residents using the proposed method. The findings not only provide new ideas for the collection and application of urban traffic information, but also provide data support for urban planning and traffic management.
Introduction
Background
With the rapid growth of the urban economy, population, and residents’ travels, a contradiction between urban traffic supply and demand becomes increasingly evident. Environmental pollution and waste of resources caused by traffic congestion have been a common problem facing major cities around the world (Levy et al., 2010; Schrank et al., 2012). These problems not only hinder the healthy development of cities, but also undermine the quality of life of urban residents (Pojani and Stead, 2017). In response to these problems, cities have proposed various measures such as improving road conditions, spatial structure optimization (Li et al., 2019), public transit systems (Smieszek et al., 2019), and the promotion of sharing travel (Machado et al., 2018). Without exception, all these measures call for a thorough understanding and analysis of urban residents’ travels such as their travel demand. Traditional approaches to data collecting are mostly travel surveys (Prelipcean et al., 2017), either in person, over the telephone, or via the Internet. These surveys, although relatively accurate, have a limited coverage of the population (Wolf et al., 2004) and lack timeliness (Ogle et al., 2005), making them unable to satisfy current demand for urban traffic management and development.
In recent years, with the continuous improvement of mobile positioning technology and data management analysis technology, it is possible to study residents’ travel and traffic demand using GPS, bus, subway card, mobile phone data, and other big data sources (Alexander et al., 2015; Ali et al., 2016; Pinjari and Bhat, 2011; Wang et al., 2012; Zhengfeng et al., 2017). Among them, GPS data have attracted much attention because of their very high spatial and temporal resolution. However, due to their large size, the collection, calculation and storage of GPS data become extremely complex (Auld et al., 2009; Wu et al., 2016). On the other hand, bus and subway card data can only be used to analyze the travels of residents who use these specific means of public transit, but not those of pedestrians or car drivers (Qi et al., 2019). Therefore, many researchers have turned to mobile phone data for related studies. According to the survey by the International Telecommunication Union, the global coverage of mobile phone users in the year 2017 was 103.5%, and statistics of the Chinese Ministry of Industry and Information Technology show that mobile phone coverage in China has reached 102%. With nearly full-sample coverage and high spatio-temporal resolution, mobile phone data have been widely used in various studies such as identifying features of residents’ travels, urban traffic recognition and simulation, urban spatial structure analysis, etc. (Smoreda et al., 2013; Widhalm et al., 2015; Wu et al., 2012).
Mobile phone data mainly include signaling data and call data. Compared with signaling data, call data are more sparsely recorded and thus more unevenly distributed in time (Chen et al., 2018b), making it more challenging to extract detailed travel information from mobile phone call data. At present, however, interpretation of the complete travel process is still lacking, in that analyses are often on origin and destination of travel, and rarely on purpose, means of travel, or on the overall travel status of cities (Phithakkitnukoon et al., 2017; Schlaich et al., 2010; Yamada et al., 2016). By fully mining the temporal and spatial semantic information in mobile phone call detail records (CDRs) and combining this with online map service data (AMAP API), the study proposes a research method comprising data pre-processing, semantic analysis of residents’ travel activities, and urban traffic analysis. The method analyzes not only the travel mode of individuals at the microscopic scale, such as the origin, destination, means and path of travel of each user, but also traffic demand and situation at the macroscopic scale, i.e. for city buses, the subway and roads. Results of the analysis can facilitate studies of the relationship between residents’ travel behaviors and their health, urban pollution, social habits, etc., and can also provide data for urban planners to improve road conditions, public transit systems, car-pooling and shared travels.
Related studies
Due to the ubiquity of mobile phones, mobile phone data are increasingly used to analyze residents’ travel activities. Related studies are mainly found on the following three aspects:
Studies on identifying the significant locations of residents
The methods used to identify significant locations can be classified into the following types: rule-based methods, frequency-based methods and clustering methods. Rule-based methods are the most frequently used, followed by frequency-based methods and lastly clustering methods. Using rule-based methods, several studies obtained significant locations by judging the duration of staying time (Horn et al., 2017; Kalatian and Shafahi, 2016; Schlaich et al., 2010; Widhalm et al., 2015). Using frequency-based methods, visiting frequencies were computed within different time windows (e.g. nighttime, daytime) to identify a person’s home or work locations (Phithakkitnukoon et al., 2017; Qu et al., 2015; Yamada et al., 2016). Using spatio-temporal clustering methods, significant locations were identified (Yang et al., 2014; Zhong et al., 2017). In short, frequency-based methods and rule-based methods are often employed to recognize frequent travels, such as home–work commuting. Compared with the two, clustering methods can much better deal with noise and outliers in the data.
Studies on recognition of travel means and modes
Most researchers use rule-based heuristics to identify means of travel. The method often involves human-crafted or curated rule sets, making use of prior knowledge (common sense or expert knowledge). Calabrese et al. (2011) used travel duration or speed to identify the means of travel while Qu et al. (2015) used travel distance to identify the means of travel. Other researchers have employed spatial proximity for travel means identification (Doyle et al., 2011; Holleczek et al., 2015; Horn et al., 2017; Poonawala et al., 2016; Wu et al., 2016). A few researchers have used the k-means method to cluster trips based on their duration, such as Wang et al. (2010). Xu et al. (2018) developed a probabilistic method to infer the means of travel such as driving, biking and walking.
Studies on urban traffic demand and traffic conditions
Eagle uses mobile data to analyze travel modes of users, their scope of mobility and social networks (Offenhuber et al., 2014). Robin calculates user traffic based on mobile data and demonstrates patterns and changes in urban traffic through visualization technology (Wilson et al., 2016). Wolf (2000) used neural network theory to analyze user’s staying time in a base station area and estimated road traffic congestion. Changes in user’s locations according to the sequence in the switching of mobile phone base stations were obtained in a case study in Rome, analyzing urban traffic demand distribution on weekdays and non-working days, and developing a city traffic monitoring system (Njuguna and McSharry, 2017).
In summary, previous studies seldom used long-period mobile phone call data for analysis. However, compared with GPS and smart card data, long-period mobile phone call data cover a much larger proportion and number of residents, facilitating a more effective analysis of the travel situation of the entire population. Compared with mobile phone signaling data, long-period mobile phone call data are smaller in volume and equally effective in depicting the travel features of residents, making it faster to obtain the results of analyses. Secondly, most previous studies identify each user’s home location and certain work locations as important location points without considering other frequently visited places of recreation or multiple working locations. Then, location identification is often based on statistical results, without considering complicated situations such as neighboring base station handoff. In addition, due to the limited coverage of traffic surveys, rule-based methods employed in previous studies for the recognition of travel means may lead to considerable errors in recognizing and distinguishing travels made by public transit and private cars (García et al., 2016; Phithakkitnukoon et al., 2017; Qu et al., 2015). Therefore, a research method based on mobile phone data, comprising data pre-processing, identification of important location points, semantic analysis of residents’ travel activities, and urban traffic simulation, is needed. The method presented here is expected to help urban planners to improve road conditions, public transit systems, car-pooling and shared travels.
Study area and data description
The study area, Wuhan (online Supplementary Figure 1), is the capital of Hubei Province, and a central city in Central China.
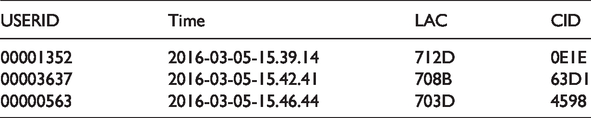
The data set used in this study is the CDRs between 1 and 31 March 2016, from a telecommunication operator in Wuhan. The data set records the time and base station number when a user makes a phone call as shown in Table 1. The data set has an average of 30 million entries daily, and a total of 1,044,532,547 records are generated in the 31 days by 6.78 million users, accounting for about 60% of the permanent resident population of Wuhan.
Sample of mobile phone CDRs data.
Base station location data are obtained together with CDRs, as shown in Table 2.
Sample of base station information.
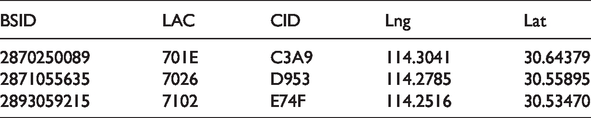
Table 2 shows the sample of base station information. The distribution of base stations in Wuhan is similar to the other big cities such as Beijing (capital of China) and Tallinn (capital of Estonia) (Chen et al., 2018a; Järv et al., 2014), where more base stations are placed in the city center than in the outer area. In the densest area, the distance between base stations can be less than 100 m.
Methodology
Based on the above research background and data sets, this study proposes a research process of using long-period CDRs to acquire residents’ origin–destination information and semantics of travel trajectory, and to analyze individual travel status as well as the traffic demand and status of the city at different times and locations. The overall process is shown in Figure 1.
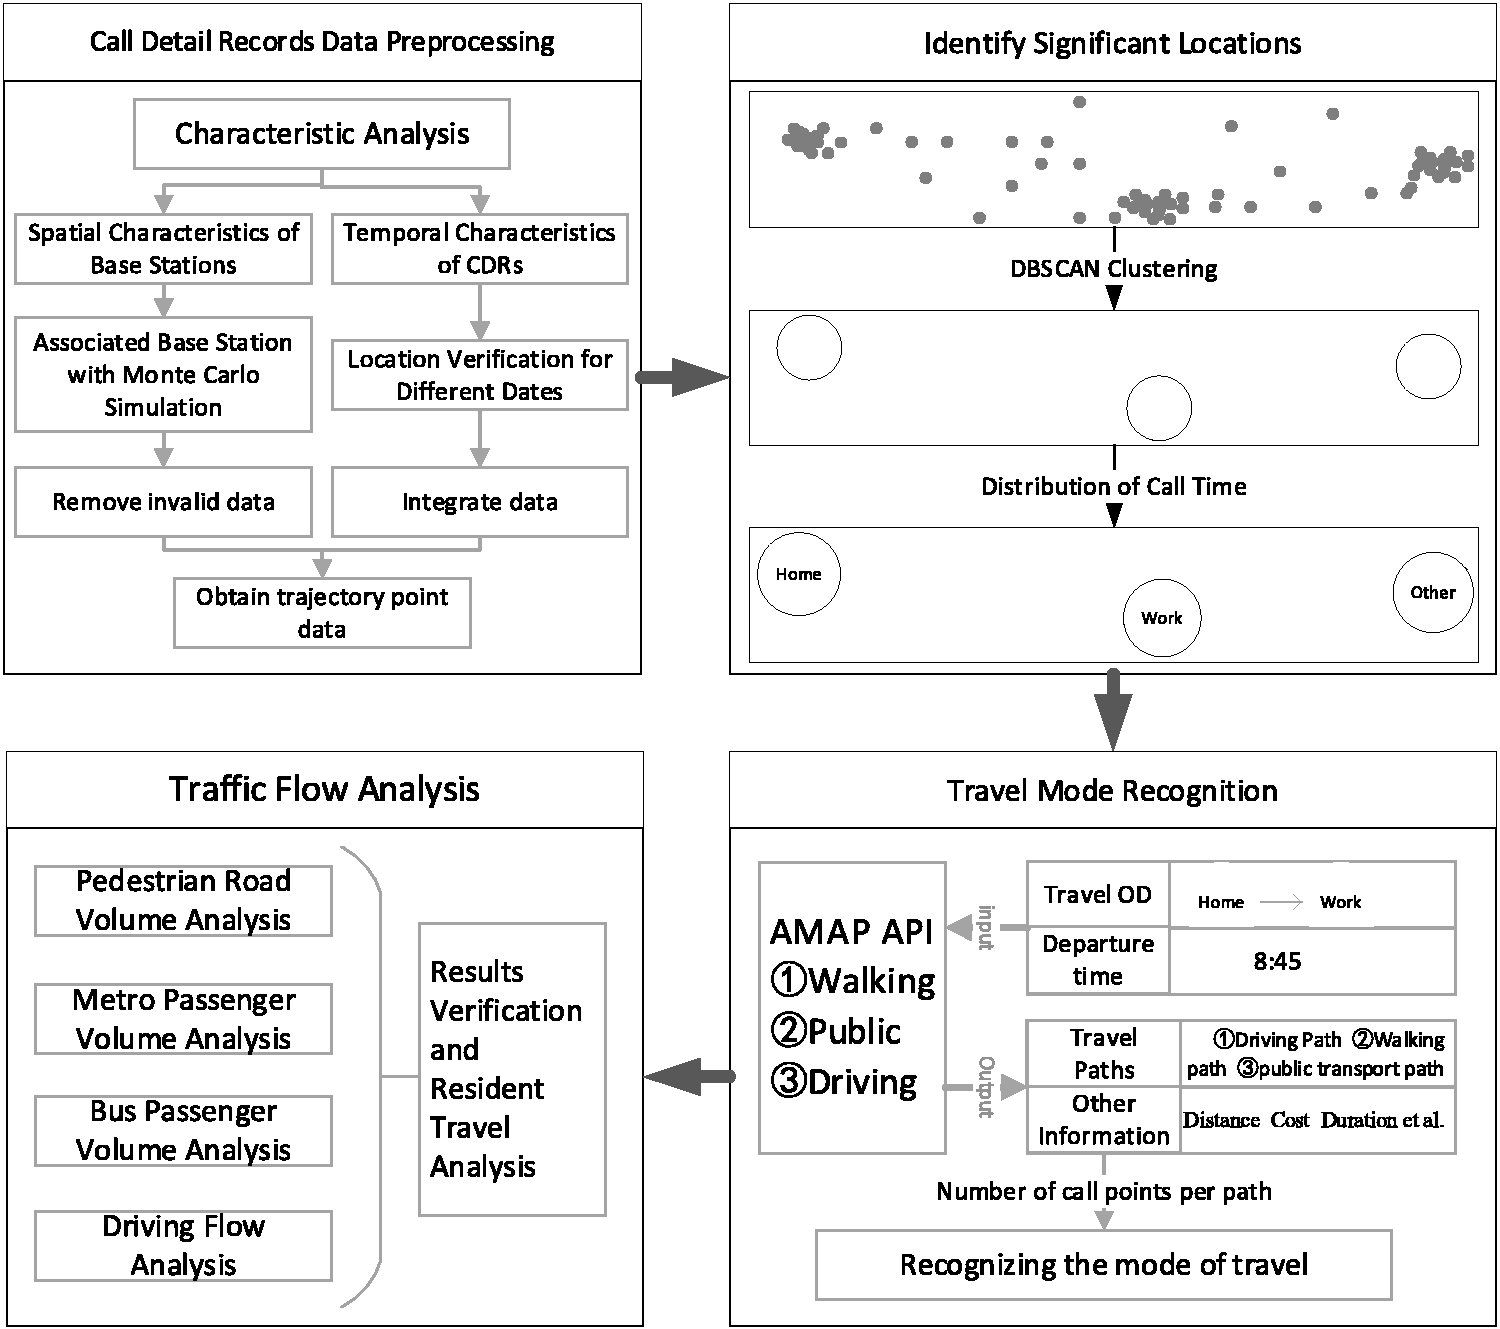
Flowchart of the proposed methodology.
First, CDRs are pre-processed and merged, corresponding to individual users and generating the travel trajectory of each user. Second, important locations and their types are identified. Third, user’s means of travel are analyzed, and the travel trajectory is semantically interpreted. Finally, based on the semantic trajectory of each user, individual travel status as well as the traffic demand and status of the city at different time and locations are analyzed, and propositions are made on the optimization of the road network and public transit.
CDRs data preprocessing
The first step is to match the raw data to the latitude and longitude of base stations to obtain the position of each call. Due to incomplete base station information and the fact that some call information is found outside of the study area, the matching rate is about 92%. Meanwhile, incomplete entries are directly deleted while duplicate entries are purged to keep only one entry. Finally, for the base station with a large service area, a Monte Carlo simulation is performed to assign the location of users for each phone call (see the schematic diagram in online Supplementary Figure 2). This means that call positions are randomly distributed within the service area of the base station, which not only reduces the error (Mynarik and Kuncova, 2012) but also helps the visualization in space.
After associating the base station to the data, the time and position information of each call of each user can be obtained. However, in the subsequent analysis, it was found that there exists a certain time sparsity in the CDRs data. Most users have a low number of calls within a single day and cannot extract valid information. By aggregating call frequency, it is found that users who have 15 calls or more per day account for 10% of all users, indicating that it is difficult to study the travel trajectory of users using single-day data where a lot of information is missed out. To address the problem of sparsity of single-day call data, this study attempts to merge the 31 days of data. Before merging, each user’s locations at different times are analyzed to determine the feasibility of merging. A total of 200 users are randomly selected to analyze the most frequently used base stations of their phone calls in three different periods: (1) 0 to 6 a.m.: off-work period; (2) 9 to 11 a.m.: morning working hours; and (3) 3 to 5 p.m.: afternoon working hours. It was found that 90% of the users are at similar locations at the same time period. Song et al. (2010) have also shown that 93% of people’s behavior can be predicted by mobile phone data.
Therefore, this study merges the data of each user over 31 days, i.e. the CDRs of working days in the 31 days. It is observed that when call frequency exceeds 30 times, the travel behavior can be effectively recognized, and when it exceeds 50 times, very good recognition results can be obtained. Statistics show that users with a call frequency over 30 times per month represent 81% of all users, and over 50 times, 70%.
This section mainly serves to process problems of CDRs data to prepare for further analysis. First, CDRs data are distributed within the service areas of base stations, which produce more accurate analysis results and better spatial visualization. Second, data over 31 days are aggregated to solve the problem of sparsity of single-day data. Since the virtual positioning data that may exist in the CDRs can be effectively avoided in subsequent analysis, they are not analyzed in preprocessing.
Identification of significant locations
Travel generally refers to the behavior of moving over a certain distance by taking one or more vehicles through the urban transport system. In this study, only the high-frequency travel behaviors of each user are semantically analyzed. In order to semantically interpret the trajectory, significant location points should first be identified, then the types of these locations, and finally the means of travel between different origins and destinations, which together complete the semantic analysis of travel trajectory.
Features of high-frequency travels include large numbers of travel times and long staying time, which give the origin and destination of high-frequency travels a higher possibility of making phone calls. By observing users’ call locations, it is found that the user’s call locations tend to aggregate in certain locations, i.e. the origin and destination of high-frequency travels; other areas are discrete, i.e. the path points or temporary travel destinations of users. Considering the aggregating features, the clustering method is used in the present study to identify the origin and destination of a user’s high-frequency travels. The DBSCAN algorithm is a classic density-based clustering algorithm (Daszykowski and Walczak, 2009). Its advantage is that it can automatically determine the number of clusters, can find clusters of any shape, and can remove noise caused by path points. Therefore, the DBSCAN algorithm is used to identify the significant locations of users. Then, the type of the point is determined by the distribution of call time at the point, and then the travel paths using each means of travel between the origins and destinations are obtained using the AMAP API. These paths are then matched with the trajectory points of the user to identify the most possible means of travel.
The DBSCAN algorithm contains two parameters, Eps and minPts. Eps is the domain range of each sample and represents the distance between one sample and the other sample. Since 90% of the call location points can be associated to a base station with a service radius of <250 m, this parameter is set to 250. minPts represents the smallest number of samples in each category. When the number is smaller than the set value, a category is identified as noise. The set value here is one-tenth of the total number of samples.
DBSCAN is used to cluster the data of all users, which are divided into four types, namely, single-point clustering, representing people who have a close home–work distance, or are without work; two-point clustering, representing people who regularly commute between home and work; three-point clustering, representing people who often go to fixed destination for dining, shopping, or entertainment on top of their home and work; and multi-point clustering, representing people whose working places are not fixed (See online Supplementary Figure 3).
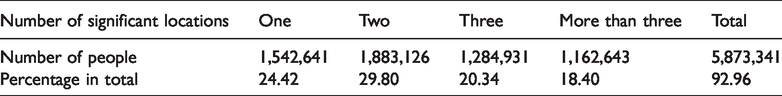
When the number of calls is less than 10, the result obtained may be inaccurate. Therefore, data of users with call numbers less than 10 are removed and data entries of 5.87 million users’ means of travel remain, accounting for 93% of total users. Statistical results of clustering show that the largest group of users have the two-point commuting mode, meaning that a considerable part of Wuhan citizens only travel regularly between home and work. The specific results are shown in Table 3.
Analysis of travel mode.
Upon obtaining the origin and destination locations of each user, it is also required to determine the attribute of the points, i.e. whether a point is the home or work locations of the user. By observing the time of calls of several users in different locations, significant differences can be found, which can help distinguish their attributes. Therefore, the work, home, and entertainment locations are determined in this paper by looking at the call distribution in different locations. In addition to the single-point clustering users, the significant locations of users where calls are mainly distributed at night are identified as the home locations, while their locations of work and other activity locations are the significant locations where calls are mainly distributed during the daytime.
Travel mode recognition
Through analysis in the previous section, locations of each user’s home and work can be identified. Use the two locations as the origin and destination of travel, the means of travel of each user can then be determined. Methods used in the past are judgment based on rules or estimation based on survey data, which are not only inaccurate but also unable to obtain travel paths. The present study proposes a new method to identify user’s travel paths, i.e. the AMAP API.
Specifically, the AMAP API is first used to obtain the shortest travel paths for users in three modes of travel (driving, walking, public transit). Next, a 250 m buffer is defined for different paths in ArcGIS. The means of travel is determined by comparing the number of trajectory points in the buffer polygon of different paths.
The AMAP API is a free map solution interface for developers, offering services such as global positioning, route planning, real-time navigation, indoor map, street view, etc. The present study mainly uses the route-planning interface, which can query the travel routes by walking, cycling, driving, public transit, etc. from one point to another at a specific time, travel duration, travel cost, etc. Table 4 shows the public transit API web address and parameters.
Public transit API web address and parameters.
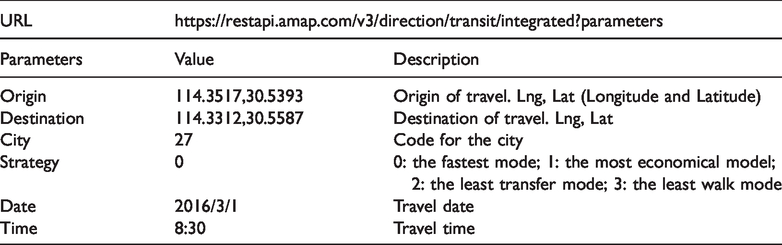
Putting these parameter values into the URL and using Python to undertake the request, the data retrieved are shown in online Supplementary Table 1. The origins and destinations are obtained from the previous analysis, and the default values are used for the remaining parameters. The departure time for work is set as the average time of the users’ calls in the working place between 6:00 and 10:00 in the morning (the hours of going to work in Wuhan). The result includes the origin and the destination of the trip. Then it contains the distance of the whole trip as well as walking distance. It also includes travel time and monetary cost. Last and more importantly, it contains the travel trajectory made up by points and route numbers of public transit. The walking API and driving API are similar to the public transit API, with only minor differences in parameters (online Supplementary Tables 2 to 7).
As travel paths made up of points cannot effectively support subsequent analysis, they are converted to vector paths using Arcpy (A python library based on ArcGIS) where the discrete points are connected as a vector path. Online Supplementary Figure 4 shows the driving path results of 10,000 users. It can be seen that these paths basically cover the whole road network of Wuhan City.
Using the AMAP API, three travel paths from each user’s home to work, by means of walking, driving, and public transit, are obtained. Further, by comparing the numbers of call location points in the buffer area of each path, the path with the largest number of call locations is identified as the actual travel path for the user. When the routes of different travel means are of similar distance or the difference is <250 m, based on the average travel distance and speed of different travel means, the following rules are established to recognize the specific means of travel in the present study: (1) when the walking distance is <1500 m, the travel means is directly determined as walking (or biking) and (2) when the walking distance is >1500 m, an analysis by public transit will be conducted. Furthermore, when the remaining walking distance is still >1000 m, the travel means is determined as driving (or taking a taxi); when the remaining walking distance is <1000 m, the travel means is determined as public transit. For example, the result of one user’s morning travel for work retrieved through the AMAP API is shown in Figure 2. It can be seen that the number of trajectory points in the buffer area formed by public transit is the largest, so it is determined that the user’s travel means is public transit.
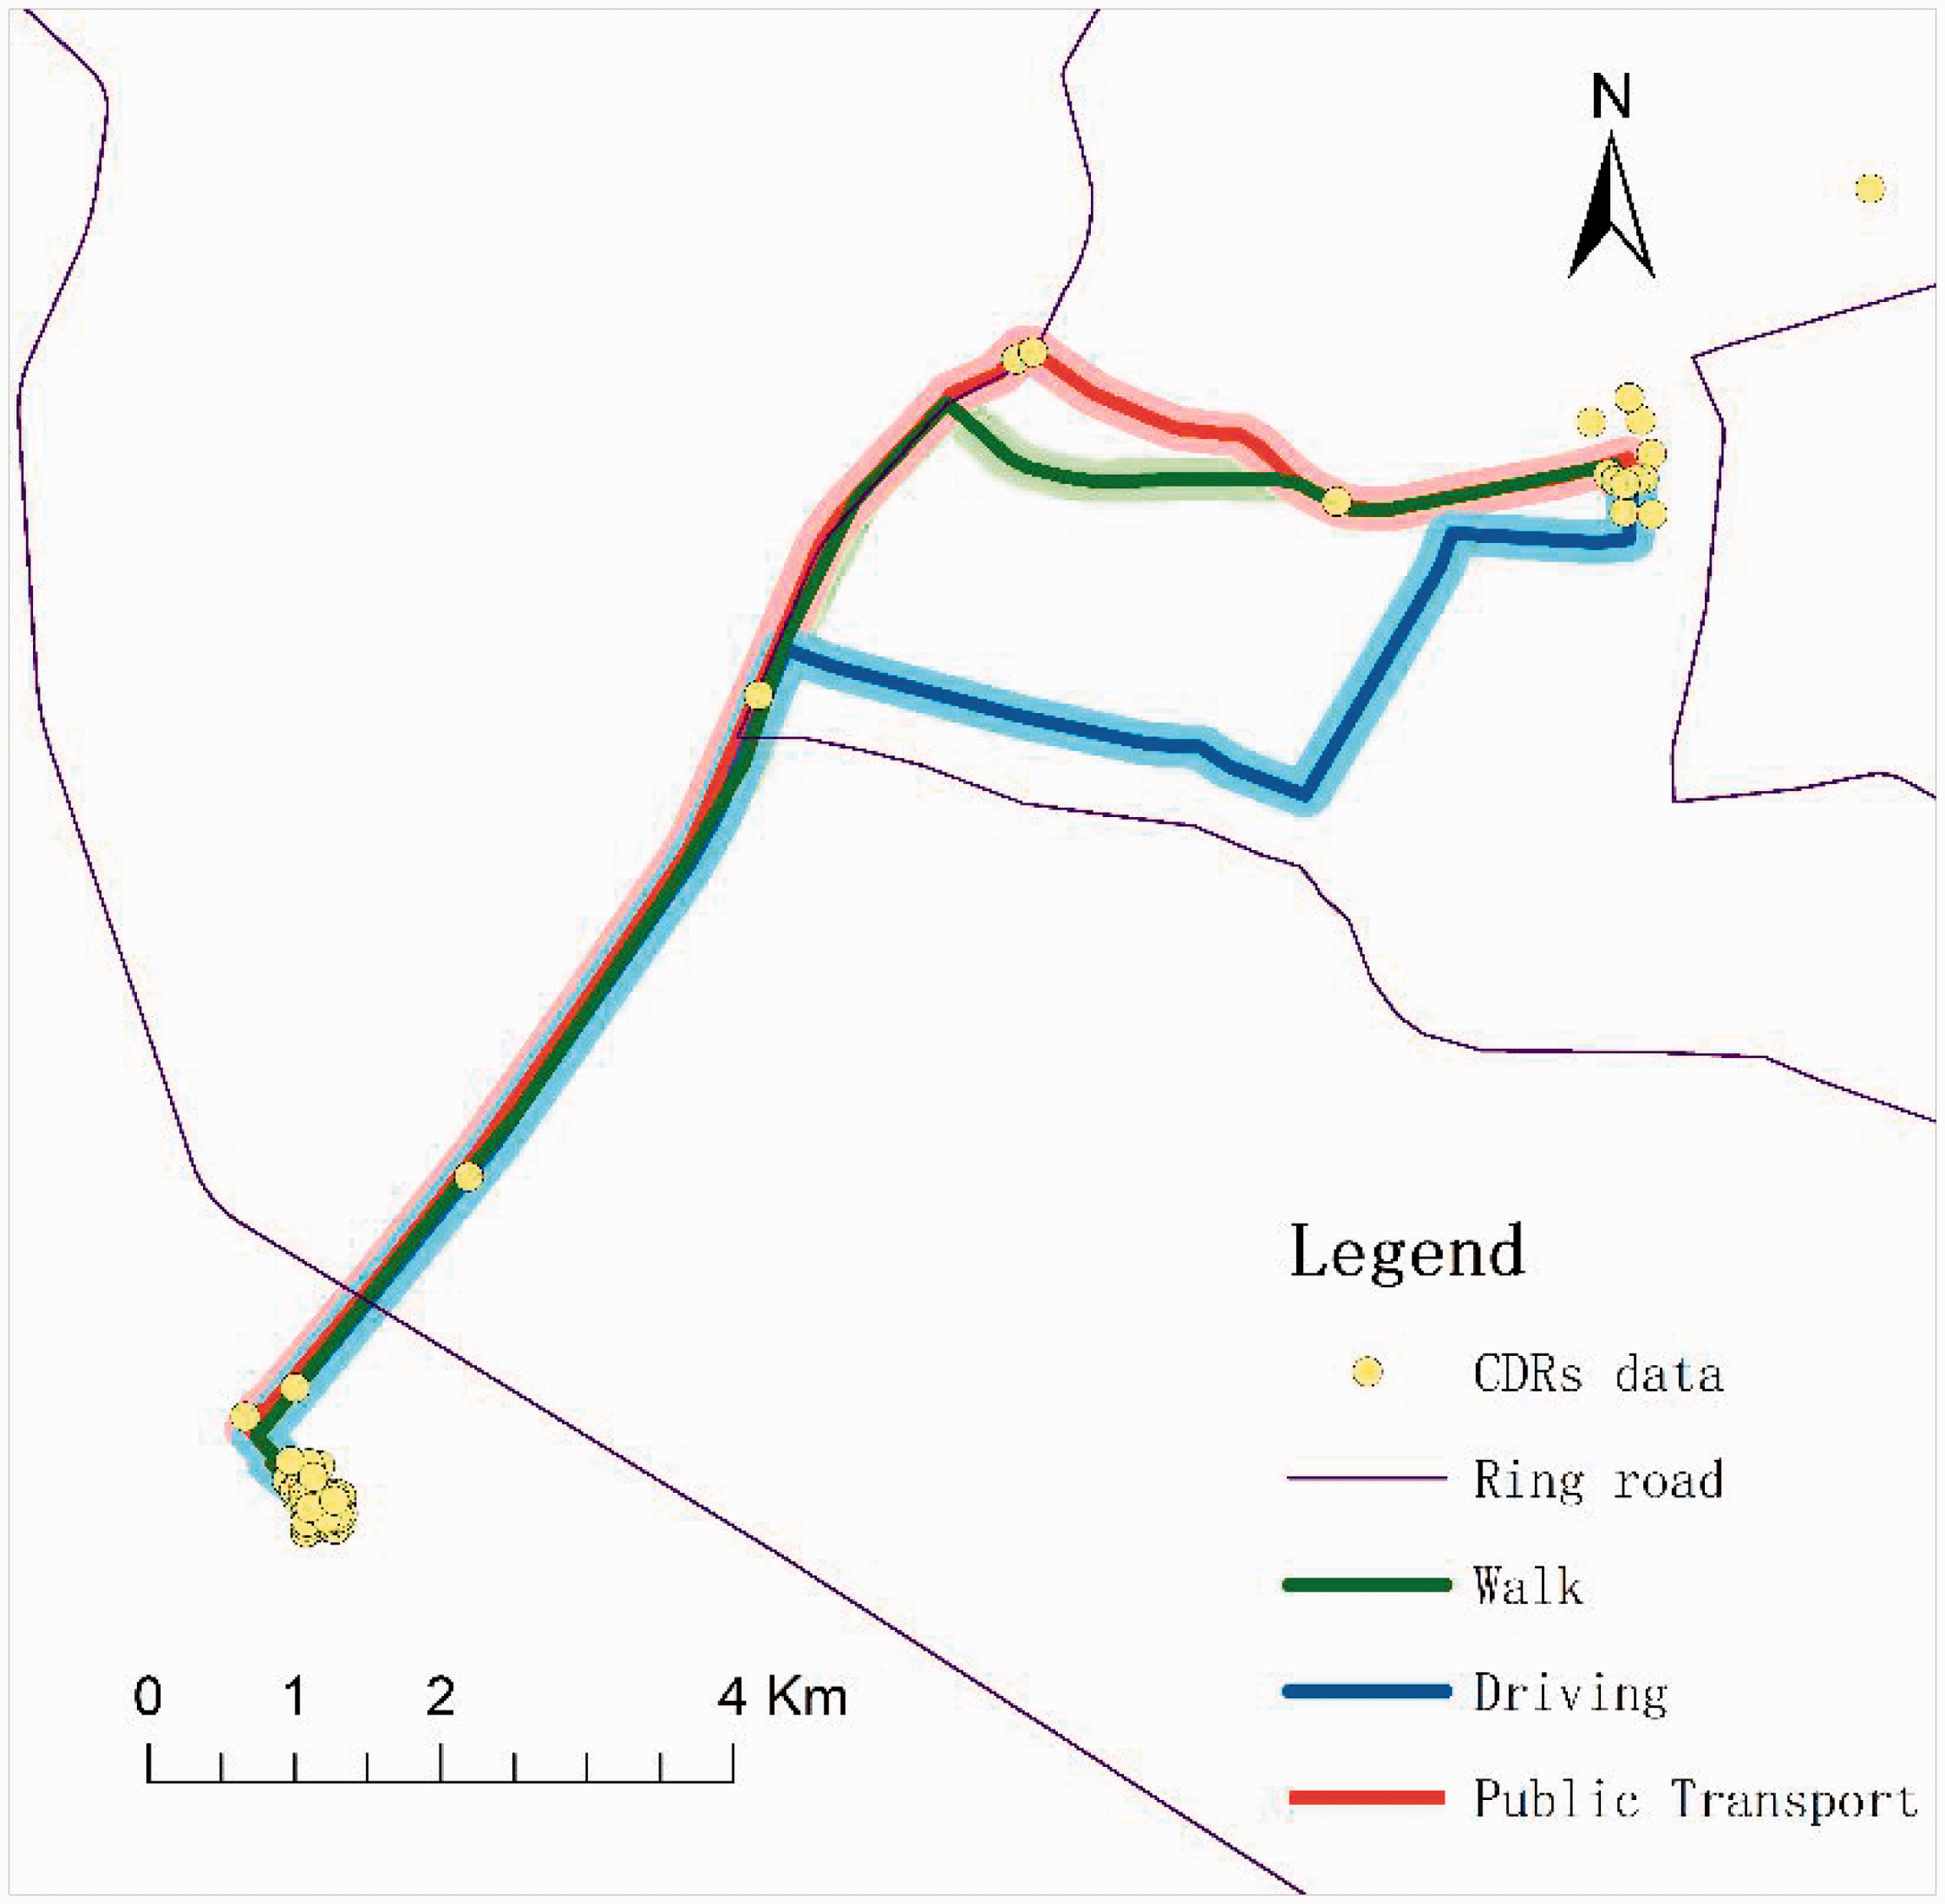
Diagram for identifying the means of travel.
Result and discussion
The analysis and experiment in the present study mainly bring three results: first, recognizing the significant locations of all users include home, work, and others; the second is identifying the travel mode of some users when commuting; the final and most important is analyzing the status of urban traffic demand, including walking, public transit, and driving.
After analyzing all users’ means of travel, their means of travel from home to work in the morning is spatially displayed according to their home locations. Diagrams on the left show the number of users who use a certain means of travel in the grid, while diagrams on the right shows the proportion of users who travel by a specific means out of the total number of users in the grid. When the number of users in the grid is less than 50, the ratio may generate an abnormally high value which is to be omitted. The result is shown in Figure 3.
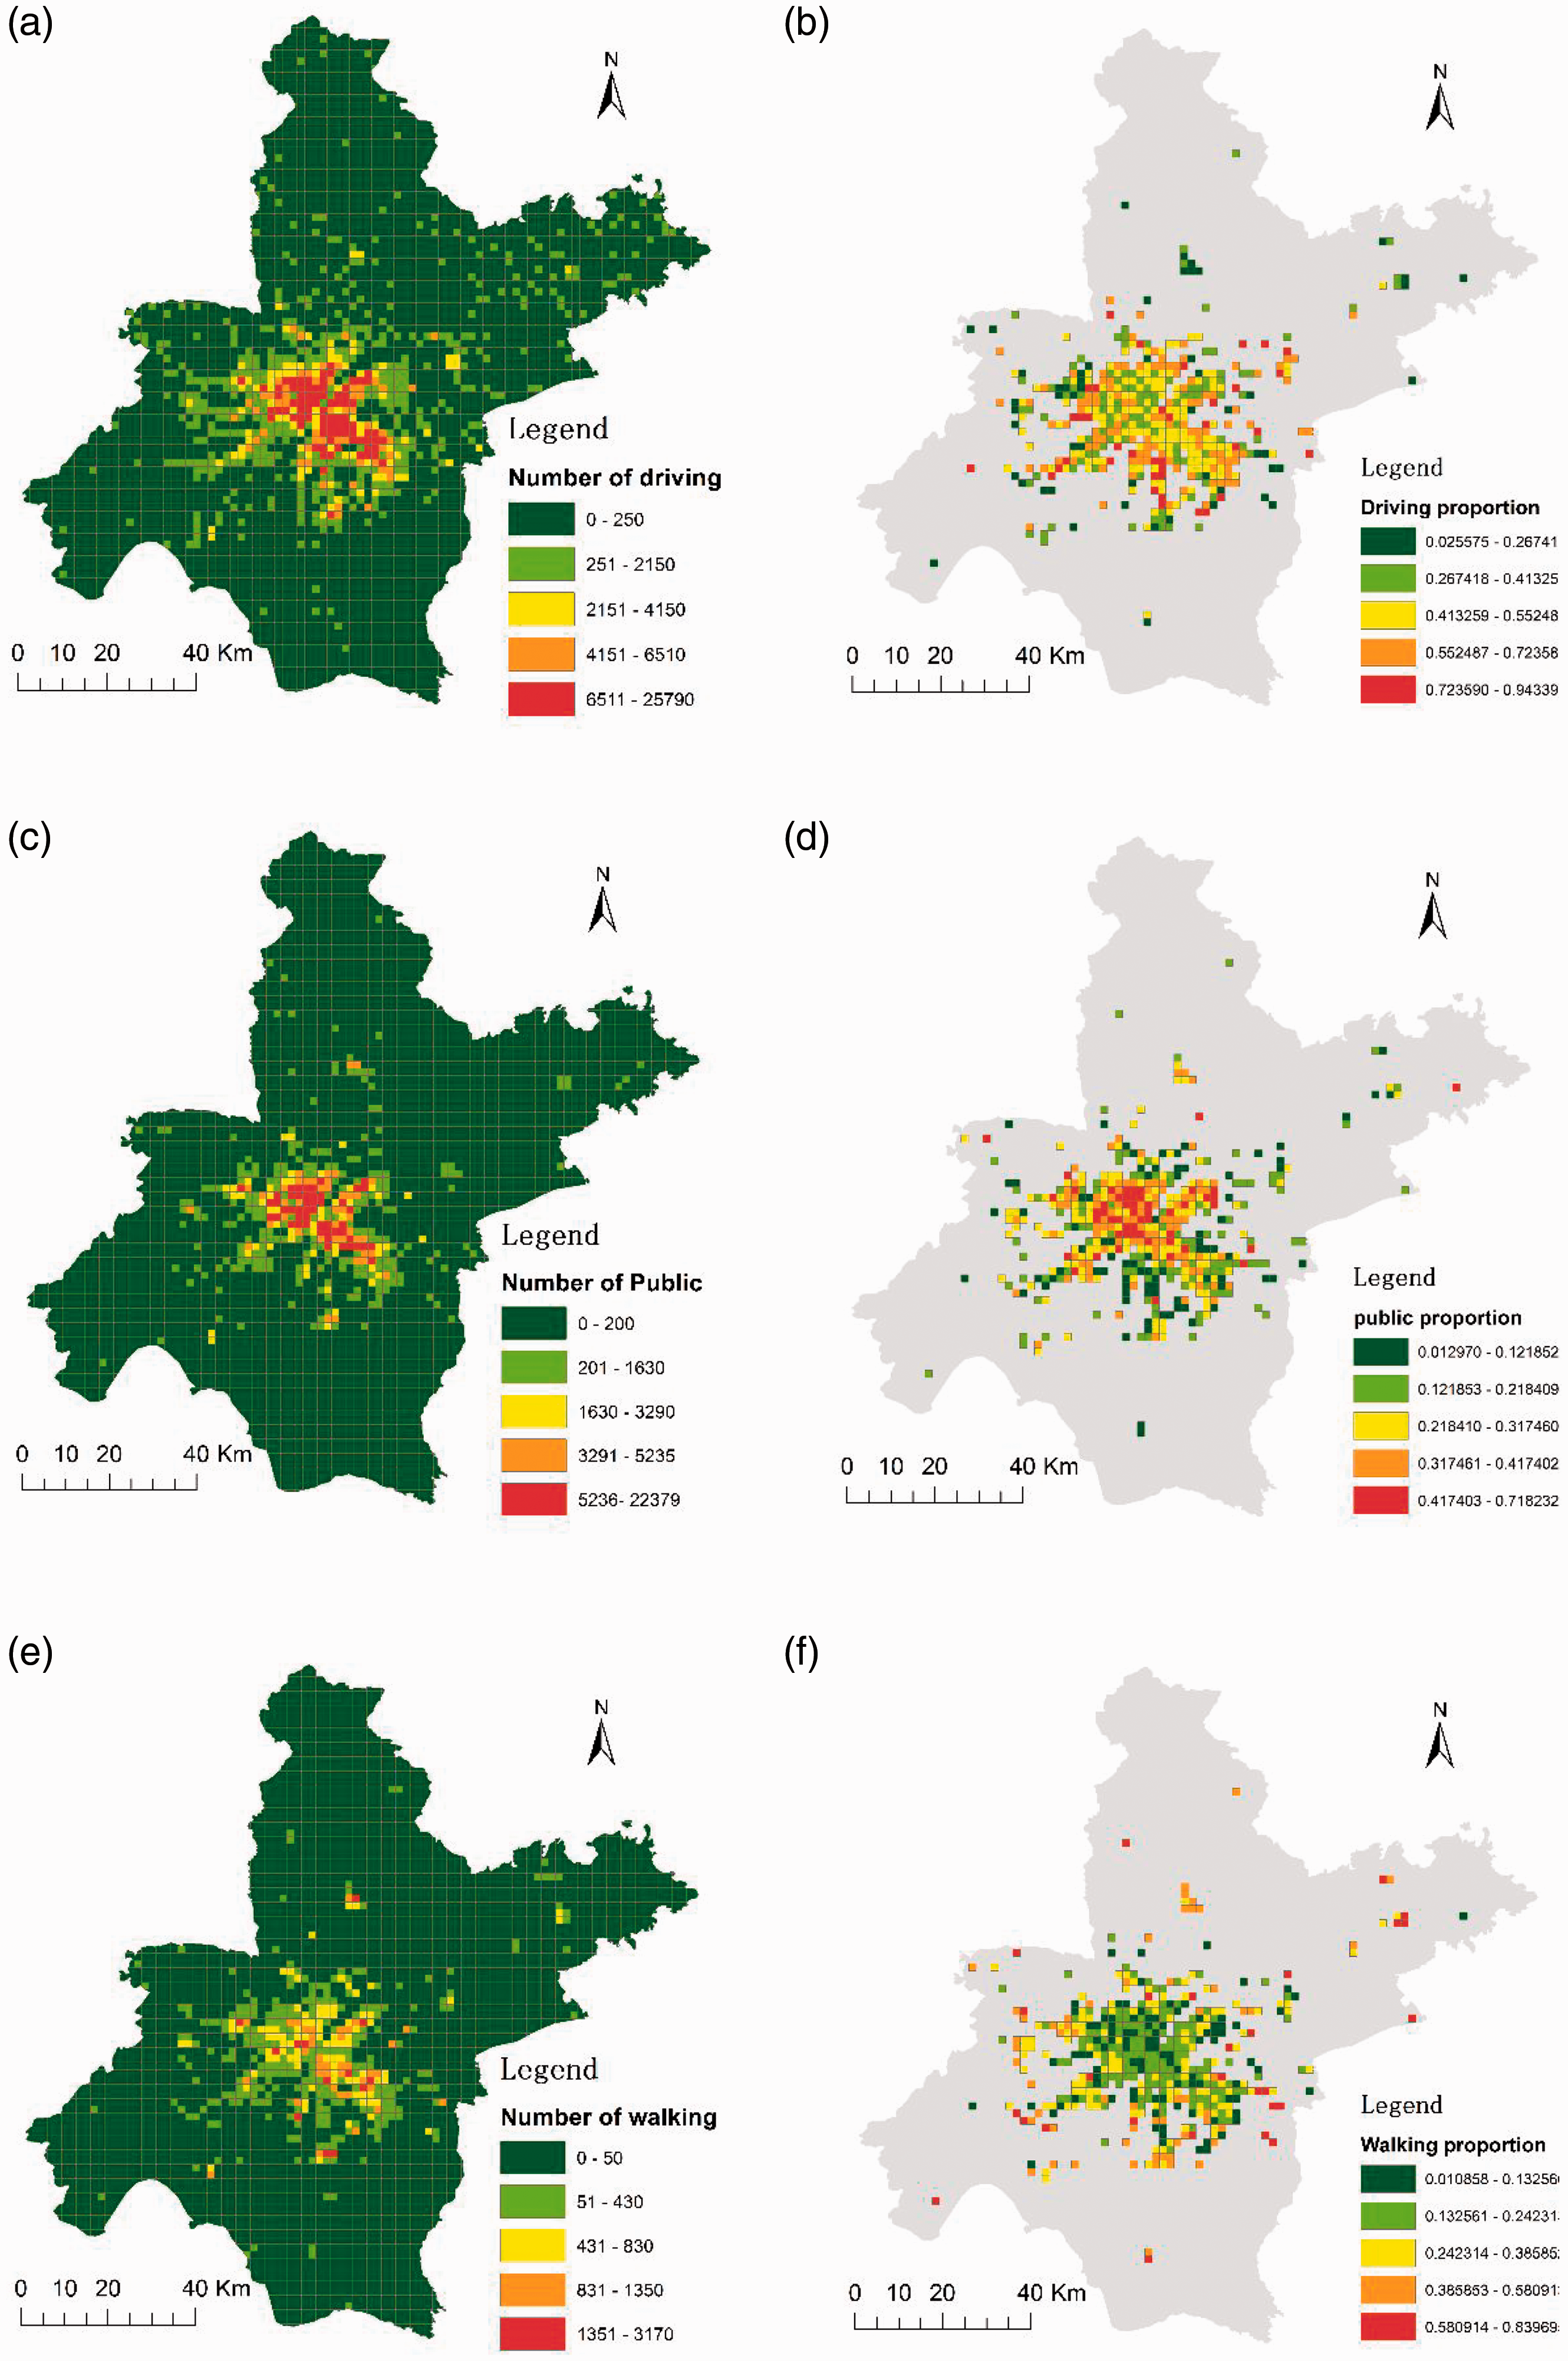
Distribution and proportion of users by different means of travel. (a) Distribution of driving users; (b) proportion of driving users; (c) distribution of public transit users; (d) proportion of public transit users; (e) distribution of walking users and (f) proportion of walking users.
In terms of quantity, whether it is by driving, public transit or walking, the numbers of users all decrease from the city center to the suburbs. Specifically, the number of travels by public transit is densest in the city center, and decreases more rapidly toward the suburbs, while the number of travels by driving is higher in more areas; the number of travels by walking is higher in fewer areas and decreases slowly toward other areas. However, in terms of the proportion, the proportion of driving in the suburbs is much higher than that in the city center, while the proportion of public transit is higher in the latter; whereas the proportion of pedestrian users in all areas is generally low, in some areas in the remote suburbs, the proportion tends to be higher because of the smaller number of people who travel. Results obtained from these analyses, such as home and work locations (the distribution of population in housing–job spaces), the spatial distribution of the population with different commuting distances and commuting times, etc., can be used in studies on the urban housing–jobs balance.
While obtaining travel paths from the AMAP API, it is also possible to obtain the total length and driving time of the path. For public transit, the total length of the public transit path, the walking distance of the public transit, and the time spent on public transit can all be obtained. For traveling by walking, the total length of the walking path and the walking time can be obtained.
Results of the statistical study of the travel distance and travel time of all users are shown in online Supplementary Figure 5. It can be seen that the average travel distance of residents within the second ring is shorter while that of the suburban residents is generally longer. However, there are also parts of areas in the suburbs with shorter travel distances. In addition, it is found that the status of travel time is similar to that of travel distance.
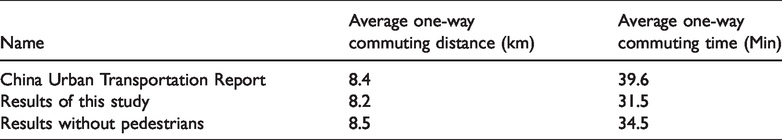
Statistics also show that the average one-way commute distance in Wuhan is 8.2 km, and the average travel time is 31.5 min. The results are both lower compared with the results in the China Urban Transportation Report (Produced by AMAP). Considering that the data collected by AMAP are mainly collected from the users using AMAP products while residents who travel over short distances tend to use map services less frequently, the pedestrian users in our study are removed, and the subsequent statistical result is similar to those provided by AMAP, indicating that the method used in the study is of good accuracy. The specific result is shown in Table 5. By aggregating paths of each user, the status of traffic flow in the city can be obtained, which is then subject to verification.
Comparison with statistics in the China Urban Transportation Report.
The travel paths of the users by subway are aggregated and the result is shown in online Supplementary Figure 6 where the red color represents high passenger flow and the flow status of different subway routes in Wuhan varies greatly due to different areas the routes go through. The busiest line is Subway Line 2, followed by Line 1 and Line 7, which go through the downtown areas, while Line 8 has a smaller passenger flow because it goes mainly through the suburban areas.
To ensure carrying capacity, the subway company has taken measures of “different routes, different time periods, different departure intervals” to suit varying passenger flow and to lower costs. A statistical analysis is made, comparing the interval of subway vehicle on different routes during peak time and passenger flow results of the present study, and a good linear relation is found between the two as shown in Figure 4(a). We also compared the actual metro passenger flow data of line 1 (data collected in 2014) with our simulated data, and found that the passenger flow trend of each station maintained the basic consistency in the overall trend, indicating that the results of metro passenger flow generated in the study are comparatively accurate (Figure 4(b)).
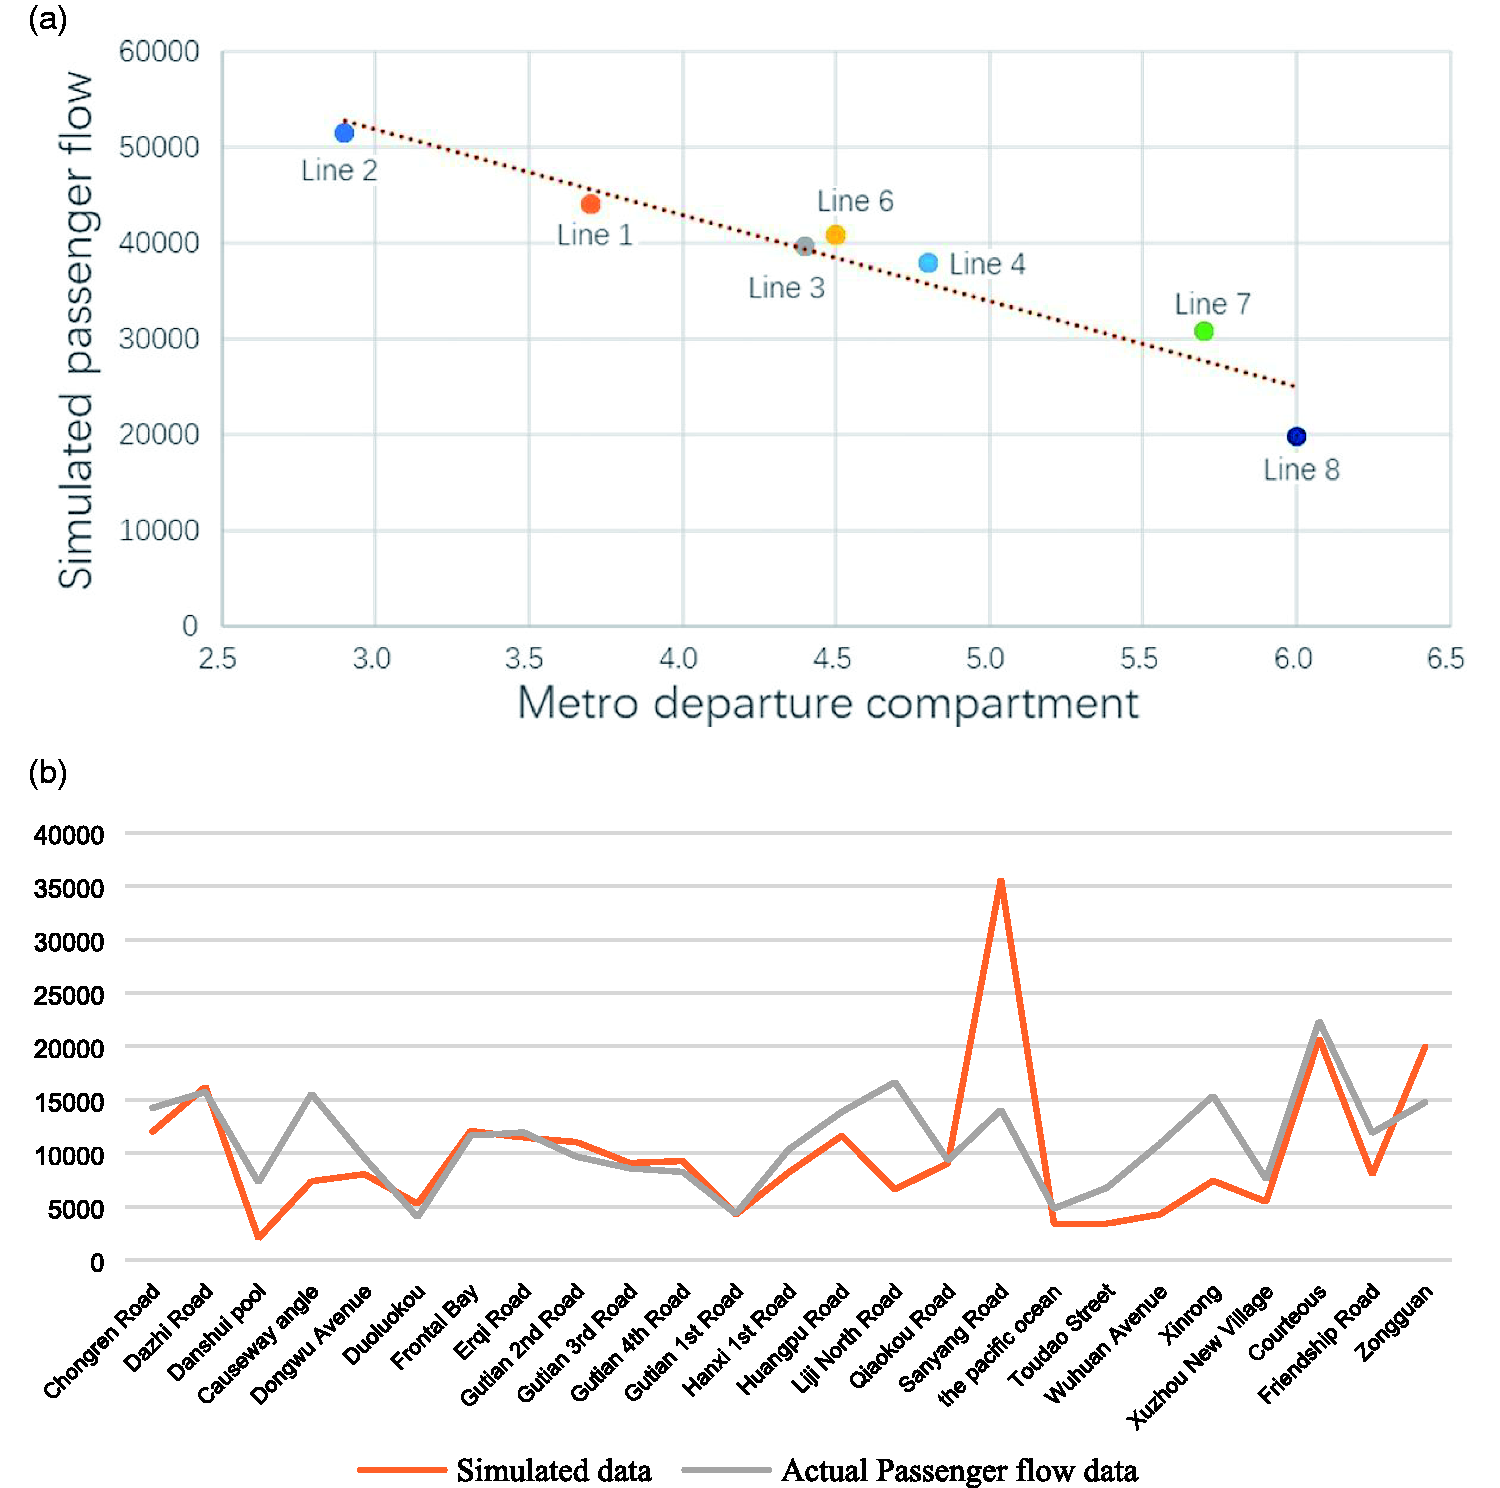
Analysis of metro passenger flow data and simulated data. (a) Relevance between departure interval and passenger number in metro and (b) the comparison between simulated data and actual passenger flow data.
Results of the analysis of users who travel by car are shown in online Supplementary Figure 7. Online Supplementary Figure 7a shows the traffic flow analyzed in this study, and online Supplementary Figure 7b is a real-time road traffic map at 9:00 in the morning provided by AMAP. The red color on the left diagram represents large traffic flows, and that on the right represents a relatively congested section. When traffic volume is large, the possibility of congestion on the road section is high. From the two diagrams, it can be seen that large traffic volume calculated in the study does accord with some actual congestions of the road sections. For the inconsistencies, a possible explanation is that we assume all travelers as starting at the same time, while the actual situation is that the departure time for work may vary. However, despite the inconsistencies, the analysis results of this study can still provide a basis for the causes of traffic congestion and corresponding traffic optimization measures. Some phenomena could also be found in the statistics of urban traffic flow, which could be useful for the urban decision-making. For example, an analysis of pedestrian users reveals that there are about 11 road sections with relatively larger pedestrian flow, as shown in online Supplementary Figure 8. Through the research results, we can provide a more specific list of roads that could be better optimized for walking. When analyzing the passenger flow of buses, it is observed that some bus stations tend to have more passengers and therefore experience more congestions during rush hour. Taking the No. 703 bus as an example, its passenger flow simulation results are shown in online Supplementary Figure 9. The passenger flow on the left side of the line is much less than that on the right side, which is larger. Therefore, it is proposed to add short-distance buses to the right-side section of the line, so as to reduce the pressure of passenger traffic on the right section of the line and enhance the experience of users.
The recognition and verification of travel means are mostly conducted by comparing analysis results with official statistics or institutional reports, such as average travel distance, time, or the percentage of the population travelling by different means, to identify the differences (García et al., 2016; Phithakkitnukoon et al., 2017; Qu et al., 2015; Wang et al., 2010). Compared with the results of the aforementioned researchers, our results have relatively higher accuracy. But due to the lack of benchmark data sets and standardized evaluation procedures, it is indeed difficult to assert that the recognition method proposed in this paper performs better than other methods.
Conclusion and future prospects
This research proposes a new method for recognizing the travel mode of residents. Based on an analysis of mobile phone call data, this study obtained the travel modes, working place, and residence information of 6 million residents in Wuhan, and depicted the spatial distribution of residents’ travels. Using trajectory information and online map service data, a method for recognizing travel means is proposed. Using this method, the means of travel used in the commuting of 3 million residents in Wuhan are recognized. The results show that 1.63 million residents commute by driving, accounting for 53.4% of the total number of people whose means of travel are successfully identified; 140,000 by walking, 4.6%; and 1.28 million by public transit, 42%. The results are also verified in comparison with other data sources, demonstrating a high accuracy of the method. To address the difficulty of simultaneously obtaining large data from multiple sources in urban space, the study proposes a method to recognize the travel modes of residents with lower costs and a rapid speed. In the study, Monte Carlo simulation is used to improve the accuracy of user location analysis results when processing the data, and then to supplement the identification of important significant locations of users. Of course, there are also limitations and aspects to be improved with the present study. The method proposed is not suitable for users with too few calls or too many calls. In addition, there is still a lack in recognizing certain features of user locations. It is also true that the chances of phone calls when driving are less than by other means, and hence, the number of travels by driving as identified in the analysis results can be smaller than the actual number. In future studies, through richer travel information obtained by the AMAP API, more in-depth studies can be conducted on issues such as the urban housing–job balance and traffic congestion, as well as discussions on the equity of urban travel.
Supplemental Material
sj-pdf-1-epb-10.1177_2399808320983001 - Supplemental material for Travel mode recognition of urban residents using mobile phone data and MapAPI
Supplemental material, sj-pdf-1-epb-10.1177_2399808320983001 for Travel mode recognition of urban residents using mobile phone data and MapAPI by Zhenghong Peng, Guikai Bai, Hao Wu, Lingbo Liu and Yang Yu in EPB: Urban Analytics and City Science
Footnotes
Declaration of conflicting interests
The author(s) declared no potential conflicts of interest with respect to the research, authorship, and/or publication of this article.
Funding
The author(s) disclosed receipt of the following financial support for the research, authorship, and/or publication of this article: The research was funded by the National Key Research and Development Project (2019YFB2101803); National Natural Science Fund of China (No. 51978535 & No. 52078390); the MOE Layout Foundation of Humanities and Social Sciences (No.19YJCZH187).
References
Supplementary Material
Please find the following supplemental material available below.
For Open Access articles published under a Creative Commons License, all supplemental material carries the same license as the article it is associated with.
For non-Open Access articles published, all supplemental material carries a non-exclusive license, and permission requests for re-use of supplemental material or any part of supplemental material shall be sent directly to the copyright owner as specified in the copyright notice associated with the article.