
Abstract
Population increases and environmental degradation are challenges for urban sustainability. Planning support systems are available to assist local authorities in developing strategies toward sustainability and resilience of urban areas, but are not always used in practice. We adapted an open-source planning support system to the case of Stockholm County, Sweden, where there is a productive working relationship between researchers, city planners, and regional planners. We employed a collaborative approach in extending and updating the planning support system and analyzed the outcomes, in order to both improve the planning support system and to investigate the process of planner engagement in planning support system development. The approach involved systematic interactions with local planning authorities and e.g. additional data processing, integrating scientific knowledge, policy, and engagement by planners in the complex process of planning for sustainable urban development. This made the planning support system more user-friendly for local planners, facilitating adoption by planning authorities through overcoming common quality and acceptance barriers to the use of planning support system in practice. Involving planners in planning support system development thus increases (i) planning support system quality, producing relevant and up-to-date outputs, and (ii) acceptance for planning support system by regional planners. Further assessment is required to determine whether planners can operate the adapted planning support system unaided.
Keywords
Introduction
Planning support systems (PSSs) are designed to help planning authorities and other urban and regional planners understand complex urban systems, and plan for more sustainable and resilient future cities (Deal et al., 2017a; Kalantari et al., 2019a, 2018; Pettit et al., 2018). PSSs are used to analyze and link different aspects of urban planning (e.g. land use, transportation, environmental issues, water quality, water scarcity) to improve understanding of these as an inter-connected system (Kalantari et al., 2019b, 2017; Kumar et al., 2019; Waddell, 2002; Yegemova et al., 2018). PSSs are evolving to enable planners to process and exploit the large amounts of data (e.g. soil geography to daily movements by millions of people) involved in rational decision making for meaningful and effective actions (Harris and Batty, 1993; Klosterman, 1997; Rodrigo-Comino et al., 2018). In addition to identifying existing problems and patterns, PSSs can be used to simulate and analyze “what-if” future scenarios, which is valuable in a field where other types of experimentation and testing are often expensive or impossible (Quan et al., 2013). PSSs can be used with current and historical data to forecast and assess possible consequences of current policy decisions for a city, helping planners understand the implications of these decisions (Deal et al., 2013). They can also be used with techniques like backcasting, in which planners can decide on a desired future outcome and then use PSSs iteratively to identify the combination of current and future decisions and actions most likely to lead to that outcome (Deal et al., 2017b; Haslauer et al., 2012).
Different PSSs are now available to users, ranging in cost and accessibility from open-source, freely downloadable to expensive, and from very simple and intuitive to complex systems requiring intensive training in their use (Pettit et al., 2018). While PSSs can be very useful to planners, there has been a lag in their implementation and use in practice (Russo et al., 2017). Vonk et al. (2005) found several bottlenecks preventing adoption of PSSs by planning authorities, many relating to the lack of knowledge or awareness among planners, institutional inertia, and shortcomings of PSSs themselves. Geertman and Stillwell (2009) divided the barriers to PSS adoption into three categories: instrumental quality (i.e. how useful the system itself is), diffusion (difficulties in getting the systems into institutions), and acceptance (planners not understanding or trusting PSSs).
Babelon et al. (2017) investigated the use of public participation geographic information systems by planners in the Stockholm Region and found that issues impeding adoption could be clustered into three themes: tool design and affordances (i.e. functionality), organizational capacity (to access and understand the software), and governance (the wider planning and public participation context in the planning organizations). They proposed using a “cyborg approach” focusing not only on technological, but also on human (user and organizational) elements of the planning process, to ensure that all elements are combined to form a functional whole.
A study in the Netherlands found that considering users and the planning context was a very important factor in the success of PSS application (McEvoy et al., 2018). Analysis of case studies using PSSs in participatory planning in the Netherlands identified the importance of ensuring a suitable fit for context, since an otherwise “good” PSS, when applied with the wrong users or context, can hamper the planning process rather than supporting it. Those authors suggested using a “task-technology fit” when choosing or developing a PSS, taking perceived usefulness (by planners or other participants) as a measure of PSS goodness-of-fit for a particular planning task (Pelzer et al., 2015). Thus, current evidence suggests that considering users and their planning needs when developing a PSS and tailoring it for use in the intended context are very important to ensure its successful adoption in planning practice.
To this end, Russo et al. (2018) suggested inclusion of users in PSS development as a way of overcoming barriers to PSS adoption and improving PSS usability for planners. The concept of user involvement (UI) is popular in software development (Alvertis et al., 2016), where it can be helpful in improving software (Bano and Zowghi, 2015). Analogously, McIntosh et al. (2011) studied development and use of 19 different environmental decision support systems (EDSSs), in order to identify challenges and best practices for their development. They found similar adoption and user engagement challenges to those relating to PSSs, and assessed which EDSSs were best able to overcome these challenges, and why. They then devised a set of best-practice guidelines for EDSS development in which they recommended UI throughout the software development process, from collaboration in establishing the purpose of the tool, to providing feedback on its usability and sharing expertise between developers and users.
PSS research and development will not assist in achieving sustainable urban and regional development unless PSSs are actually used in practical planning, where improved scientific knowledge can inform and improve policies and decisions. This paper describes the process of planner engagement in adapting an open-source PSS, the Land use Evolution and impact Assessment Model (LEAM; Deal and Pallathucheril, 2008), to the case of Stockholm County, Sweden (Kalantari et al., 2019c; Mörtberg et al., 2017; Pan et al., 2018). This case was chosen because there is a productive working relationship between researchers, Stockholm County planning authorities at the growth and regional development board (Tillväxt- och regionplaneförvaltningen, TRF), and because the existing PSSs needed to be adapted and updated. This provided an opportunity to work in a deliberate, collaborative manner and document and study the process and outcomes. Adaptation was needed to overcome instrumental quality and acceptance barriers, and make LEAM Stockholm more functional and useful to local planners. The work was performed in close collaboration with planners, so that they could better understand, contribute to, and use the model to help inform and support planning and policy decisions.
Methodology
Case study: Stockholm County
Stockholm County is the most populous region in Sweden. It lies on the east coast (Figure 1(a)) and had a population of 2,231,000 in 2015, most living in the Swedish capital Stockholm, and in Södertälje, a city to the south. Stockholm County’s population is expected to grow up to 3,338,000 by 2050, mostly due to immigration and urbanization (SCB, 2016; TRF, 2017). Providing housing and infrastructure for this growing population is a challenge, particularly in Stockholm, which is already struggling with a housing shortage (Moore, 2018).
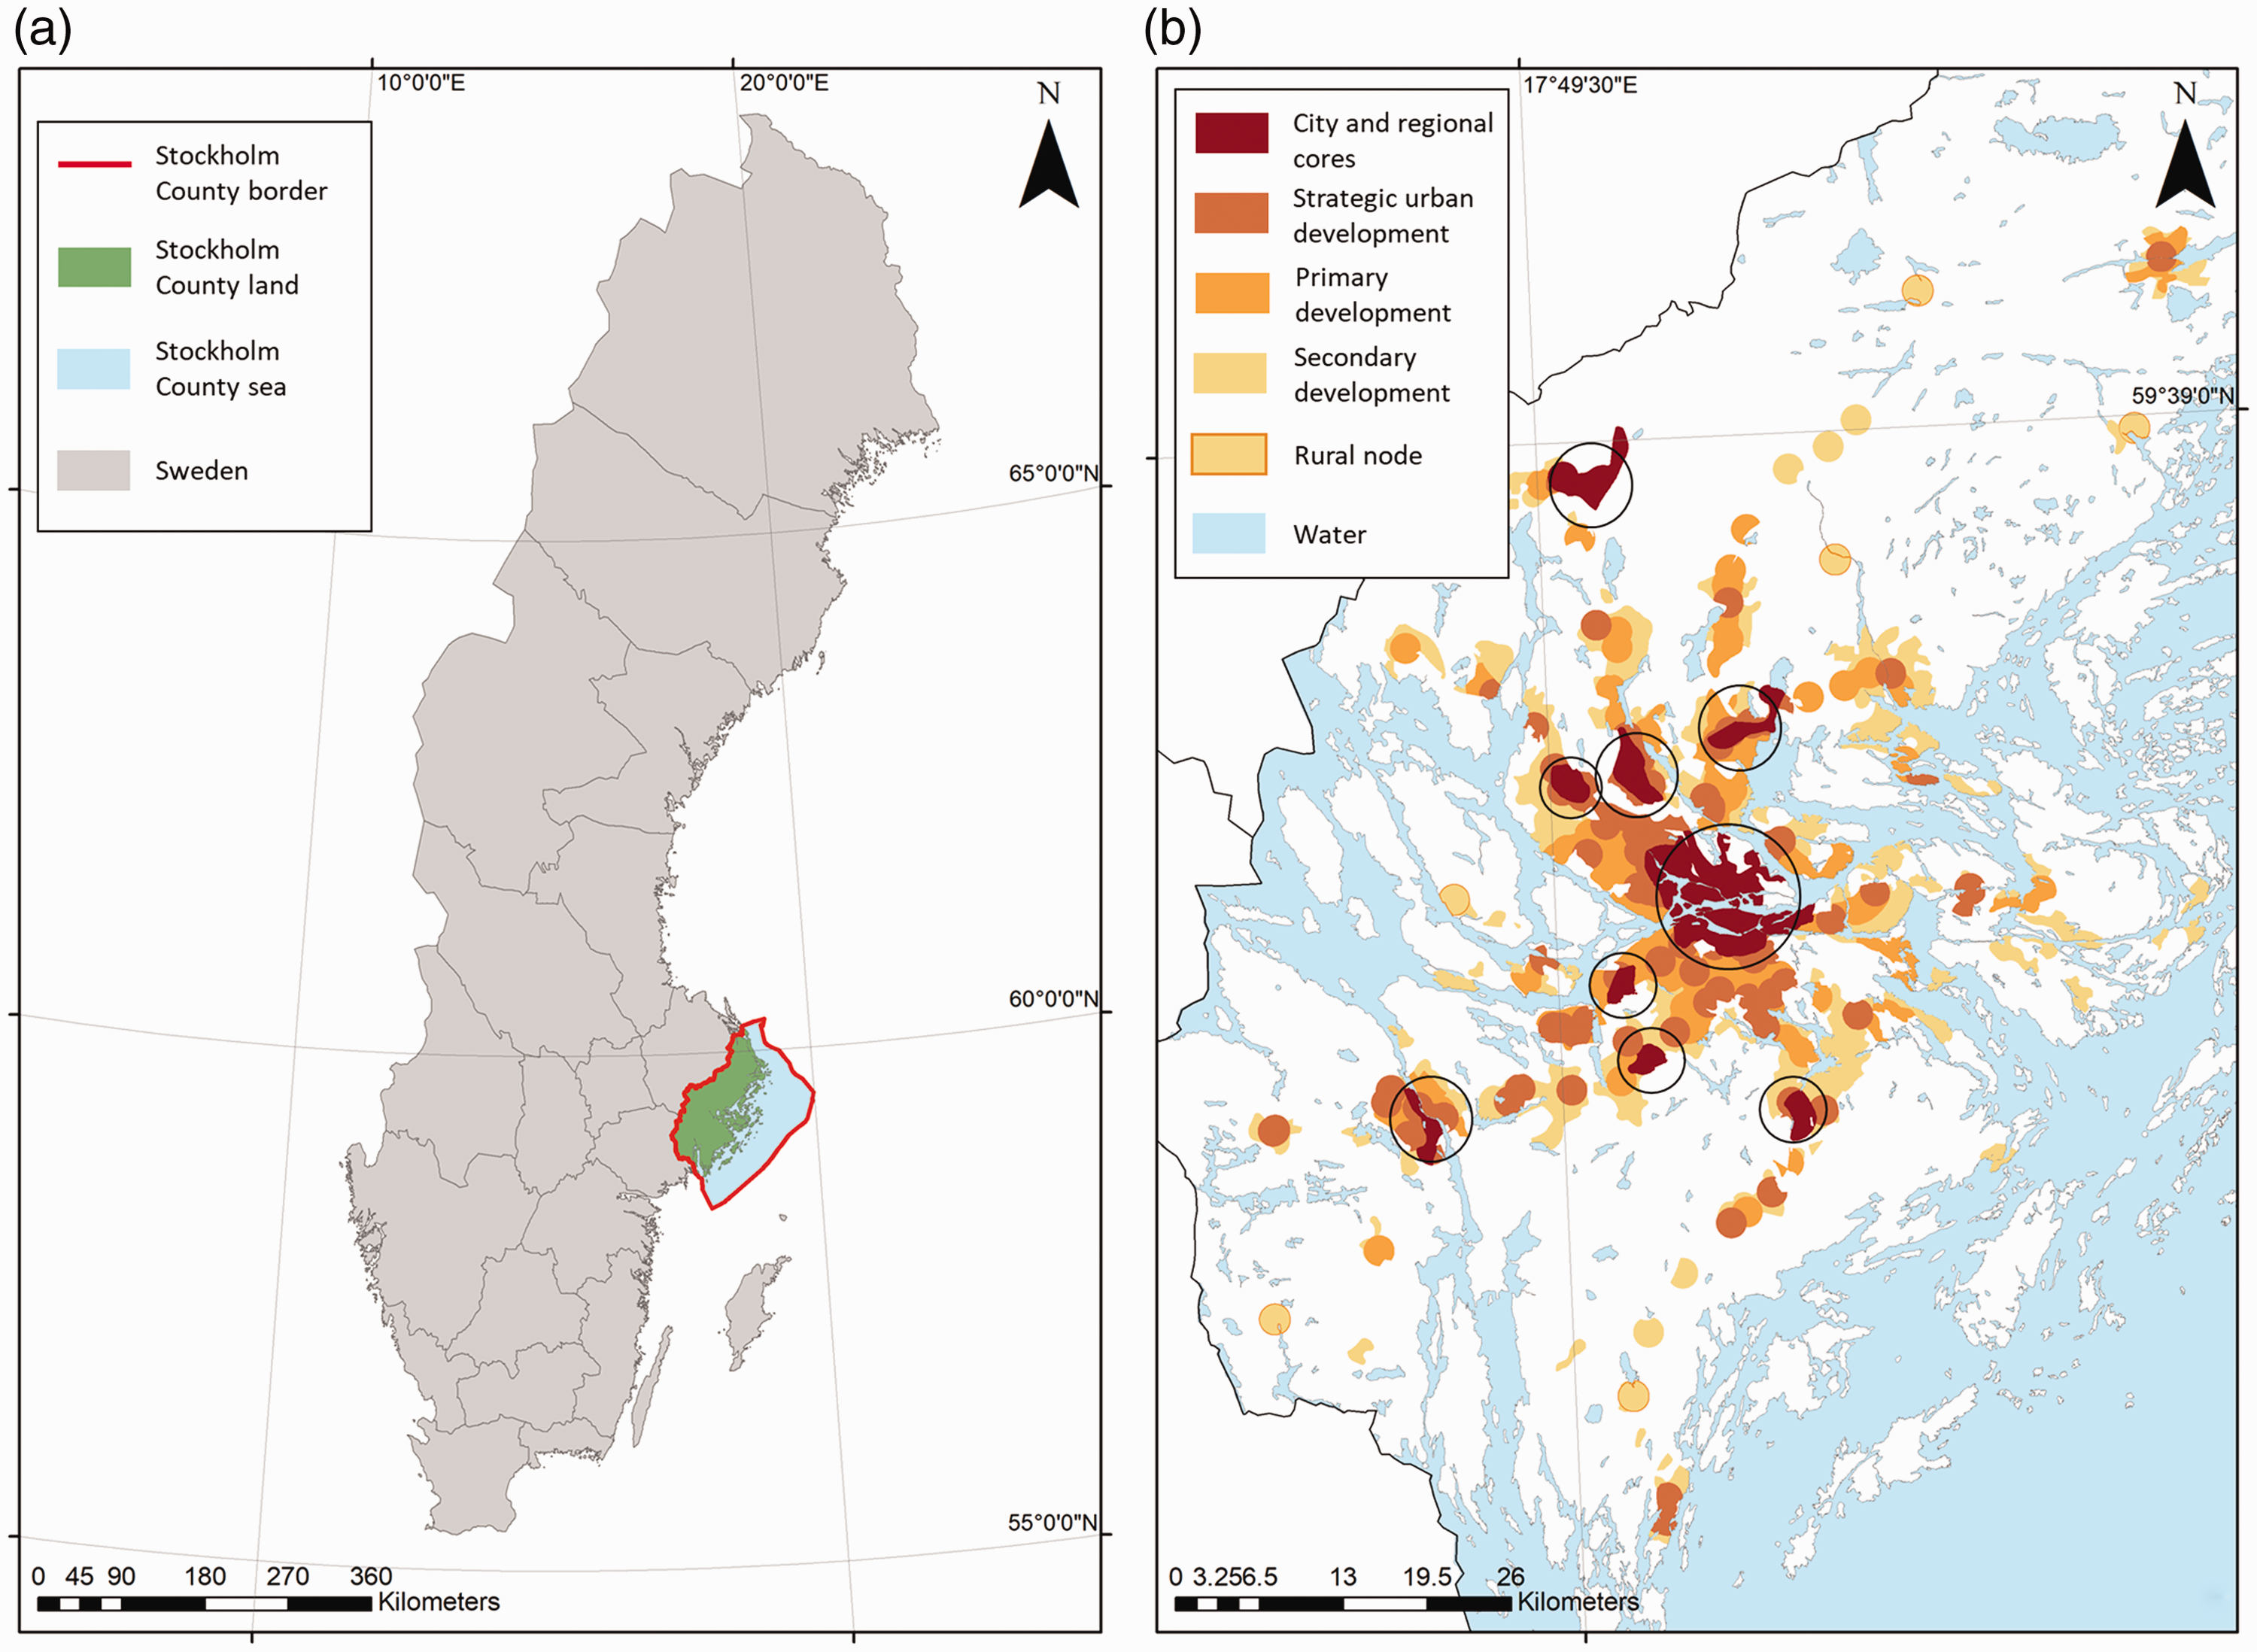
(a) Location of Stockholm County within Sweden and (b) planned development structure for Stockholm County according to the regional plan RUFS 2050 (TRF, 2017). Stockholm City and the eight other main regional development cores are circled.
Stockholm City, other municipal authorities, and TRF are committed to sustainable growth and to meeting various climate change and sustainable development goals, such as “Fossil Fuel Free Stockholm by 2040” (Stockholms Stad, 2016; TRF, 2017). PSSs can support planners in achieving these goals.
The current regional plan for Stockholm County (RUFS 2050, developed by TRF) covers the development of the entire county until 2050 (TRF, 2017). In RUFS 2050 (Figure 1(b)), most development is planned for the center of Stockholm City and eight additional regional urban cores located in strategic, well-connected areas of the county (dark red in Figure 1(b)). Each regional core will be connected to Stockholm City center through road and rail connections, with some further urbanization planned around and between these cores and along the transport connections. The regional cores are intended to provide easy access to urban services for surrounding areas, as well as being pleasant dense urban environments themselves. The strategic urban core areas (dark orange in Figure 1(b)) thus have high regional accessibility and potential to become dense urban environments, while primary development areas (light orange in Figure 1(b)) outside the core and strategic areas have good public transport connections (lying within 1200 meters of a railway station or major bus terminal) and will be less dense, but still have some urban qualities. Secondary development areas (yellow in Figure 1(b)) will see some development (mostly residential and some small local businesses) and are identified as areas from which it is possible to reach major public transport connections within 15 minutes’ travel by local bus (TRF, 2017).
LEAM—Stockholm PSS
Model description
In this study, the PSS LEAM was adapted to the regional planning process in Stockholm. LEAM is a geographically based model, with 30 meters × 30 meters resolution, of how land use in an area is likely to evolve in the future, based on inputs of current land use, topography, and urban development drivers. These drivers include land zoning and development restrictions, population changes, and attractors to development, such as existing population and employment centers (Mörtberg et al., 2017, 2013; Pan et al., 2018). The likelihood of both residential and commercial development is calculated for each cell using Monte Carlo simulations, with the development attractiveness of each cell calculated according to its proximity to main population and employment attractors (Deal et al., 2013). The model runs online, and requires the user to enter various input data (see Table S1 in Supplemental material), to produce a number of probability maps showing how and where future land use change is most likely to take place (Deal et al., 2016). These maps show where residential and commercial developments are most likely to occur for given population growth over a study period. Population and development densities are not provided, but can be assessed by analyzing the areas over which development is spread in different scenarios, given an estimated final total population for each scenario. From the simulated land use maps, coupled models and integrated model modules can be used to analyze environmental impacts, such as hydrological impacts of urban expansion (Kalantari et al., 2019b, 2019c) or greenhouse gas emissions (Pan et al., 2019a, 2019b). Figure 2 shows a schematic diagram of the functioning, inputs, and outputs of LEAM Stockholm.
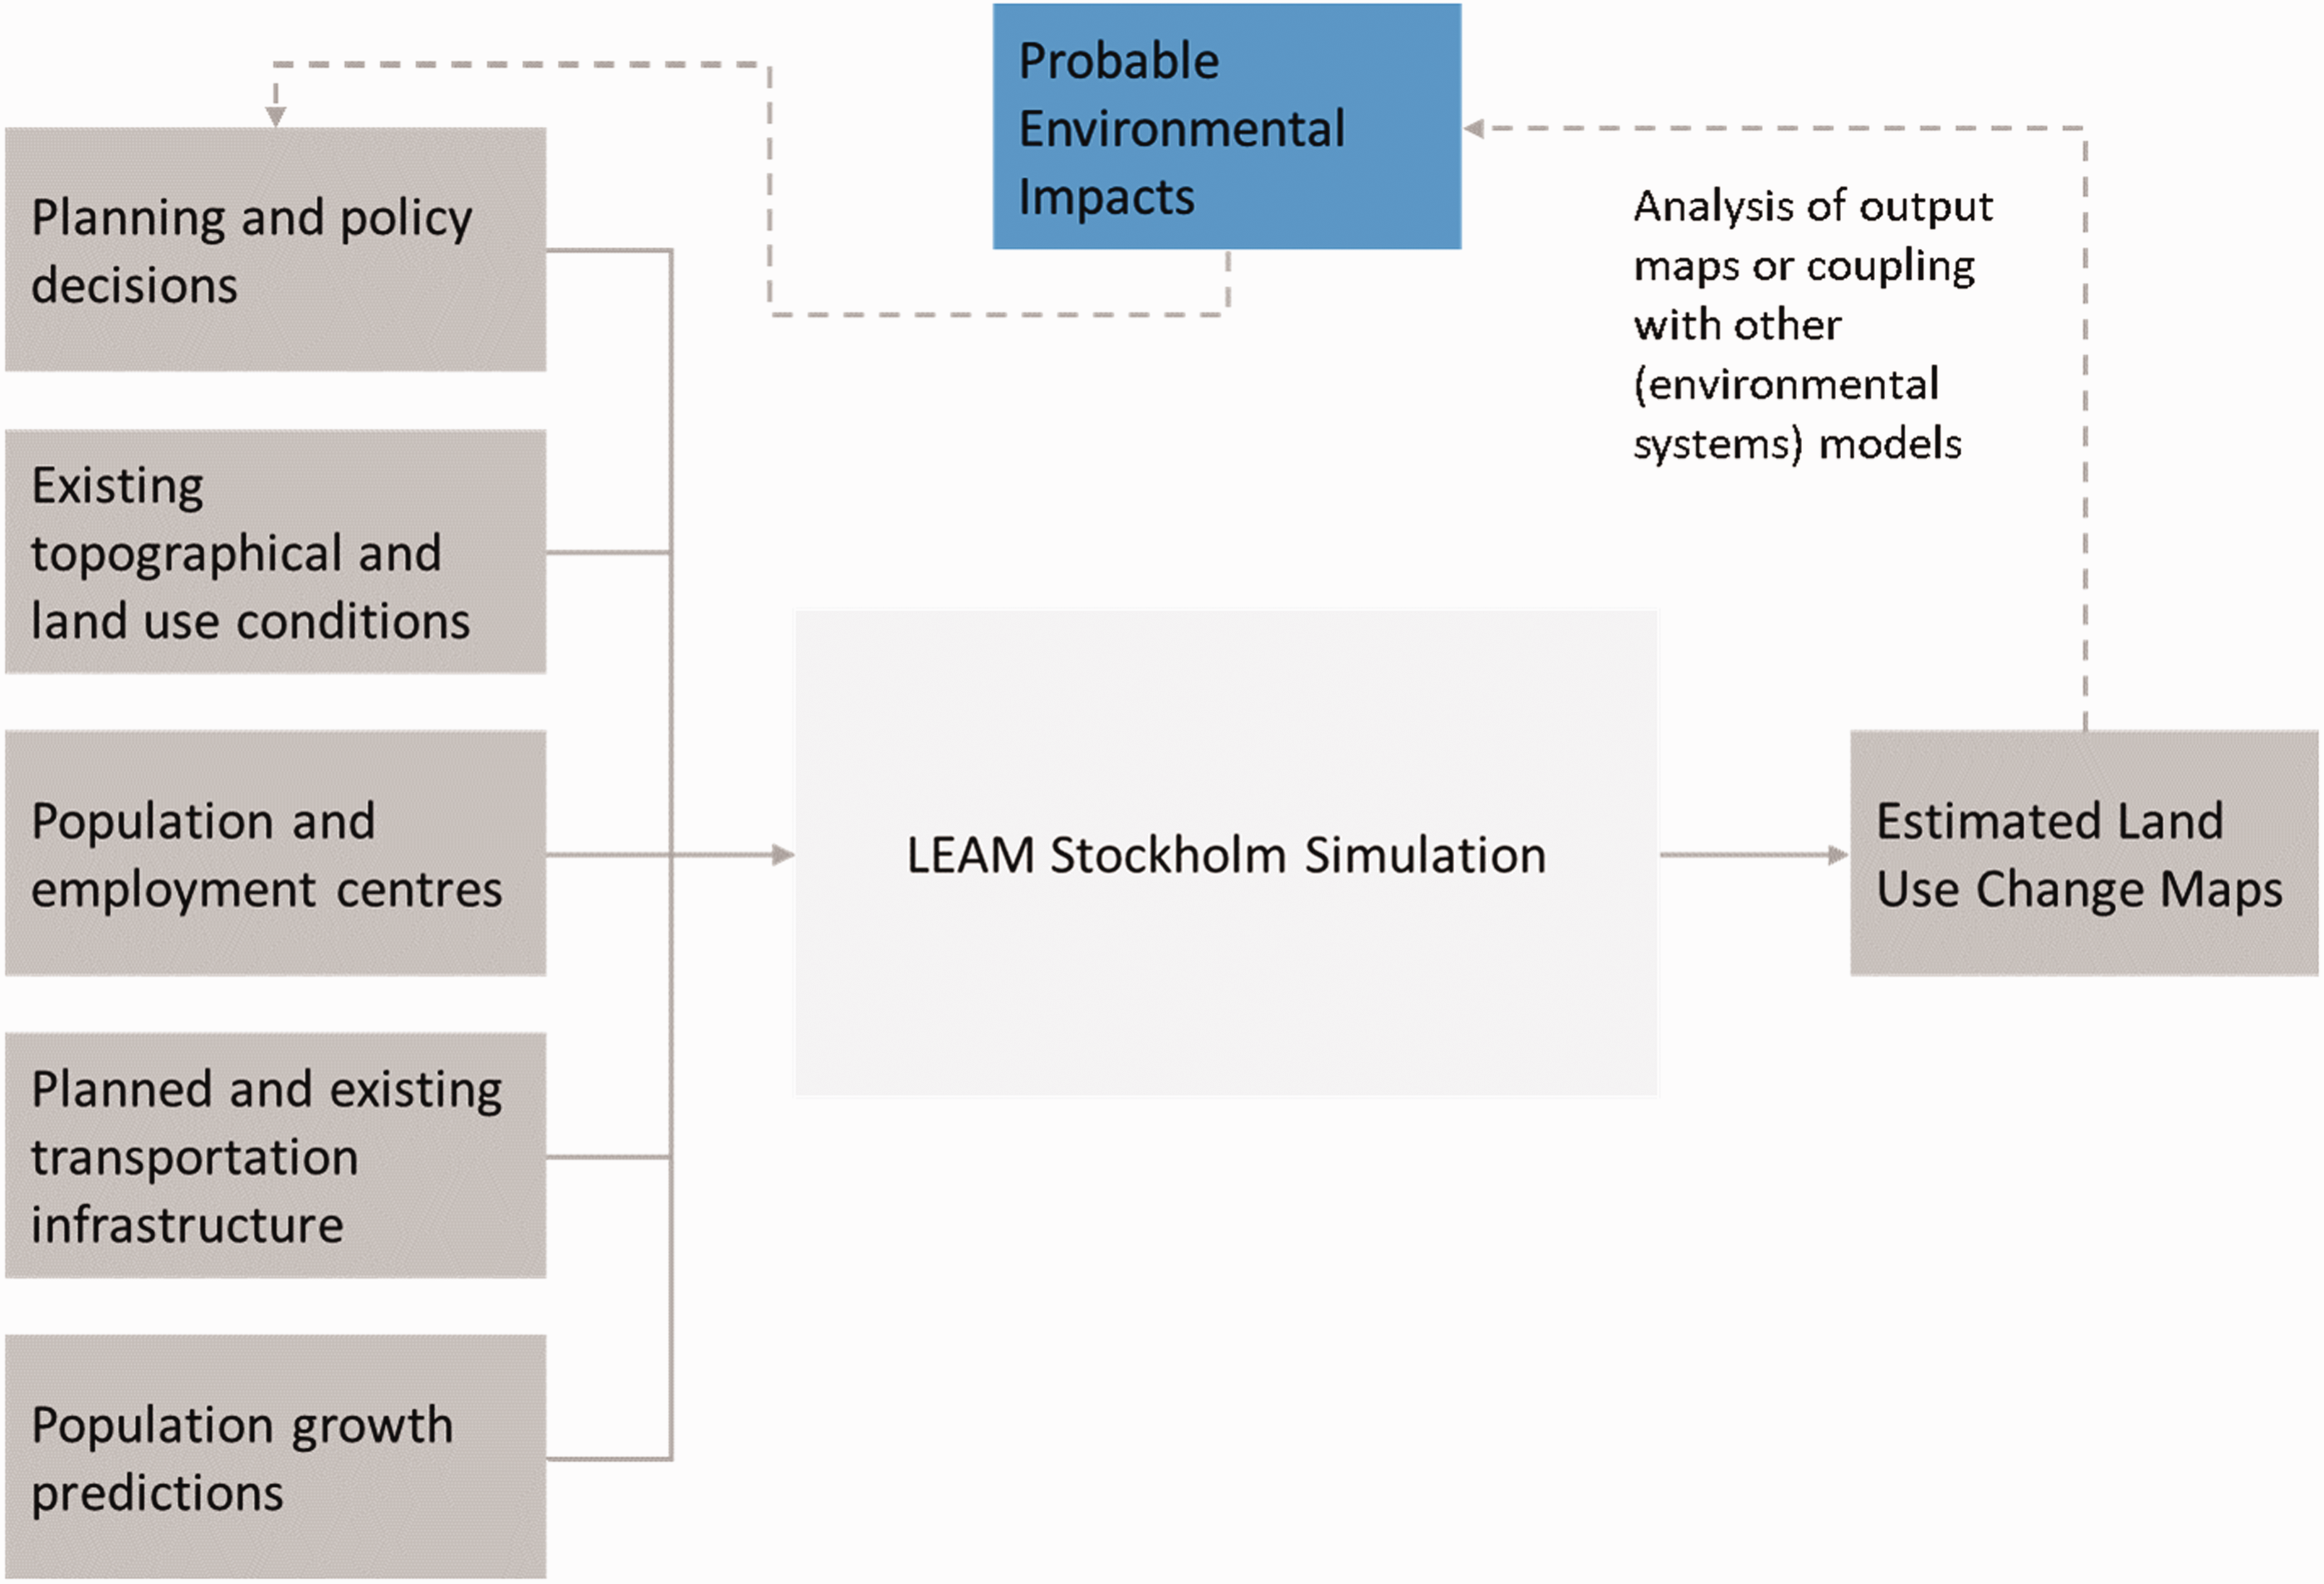
Schematic illustration of LEAM Stockholm, showing how input drivers (left-hand side) are most likely to drive development in a study area, by estimated land use change maps (right-hand side). LEAM: Land use Evolution and impact Assessment Model.
LEAM is thus designed to allow users to test different future development scenarios, given current conditions and certain development drivers. Using current conditions as a baseline, development drivers can be applied to forecast the future, e.g. representing a business-as-usual scenario if current trends continue. The drivers can also be varied, to test the consequences of planning policies and decisions for other future development scenarios. LEAM can be used iteratively by changing the inputs (such as planning and policy decisions influencing zoning) based on the results from the previous run, in order to identify decisions most likely to lead to a desired outcome. This process is referred to as backcasting (Deal et al., 2017b; Haslauer et al., 2012), where a desirable future scenario is determined and many simulations are carried out, each time making changes to the development drivers and conditions, to investigate how that scenario can be reached. The model outputs provide information that can help planners understand the consequences of such development changes, e.g. in terms of urban structure (whether it will become denser or sprawling), accessibility and transportation implications, ecosystem service demand–supply conditions, and other regional aspects (Deal and Chakraborty, 2010; Goldenberg et al., 2017, 2018). In this way, planners can also identify the changes by pushing the modeled outcome closer to the desired future scenario or some undesirable future conditions.
Data input
In adapting LEAM to Stockholm County, we included region-specific topography, land use population and employment centers, road networks, and population projections. Another model input was a no-growth map, created using maps of protected areas, potential flood zones, and other areas unsuitable for urban development. Inputs for model adaptation included a public transport attraction map, created using data on public transport stations, public transport travel data, and a municipal population growth map, created using a municipality border map together with municipal growth predictions (TRF, 2017). The data used for these inputs are detailed in Table S1. In addition, RUFS 2050 was used for comparison with the urban development simulation results of LEAM Stockholm. The base year for the LEAM simulations was set at 2015 and the final year for all modeled scenarios was 2050, for direct comparison with RUFS 2050.
Planner engagement
The adaptation of LEAM Stockholm was conducted with significant input from local planners as target future users of the PSSs, and therefore the main stakeholders. The work is one of several collaborative projects involving academics and students from Stockholm University, KTH Royal Institute of Technology, and the University of Illinois at Urbana-Champaign (referred to here as researchers) and planners working at TRF. TRF involvement in model development and adaptation was continuous and interactive. Figure 3 shows the links between the physical urban system and urban and regional planners (TRF), and the interactions between planners and researchers.
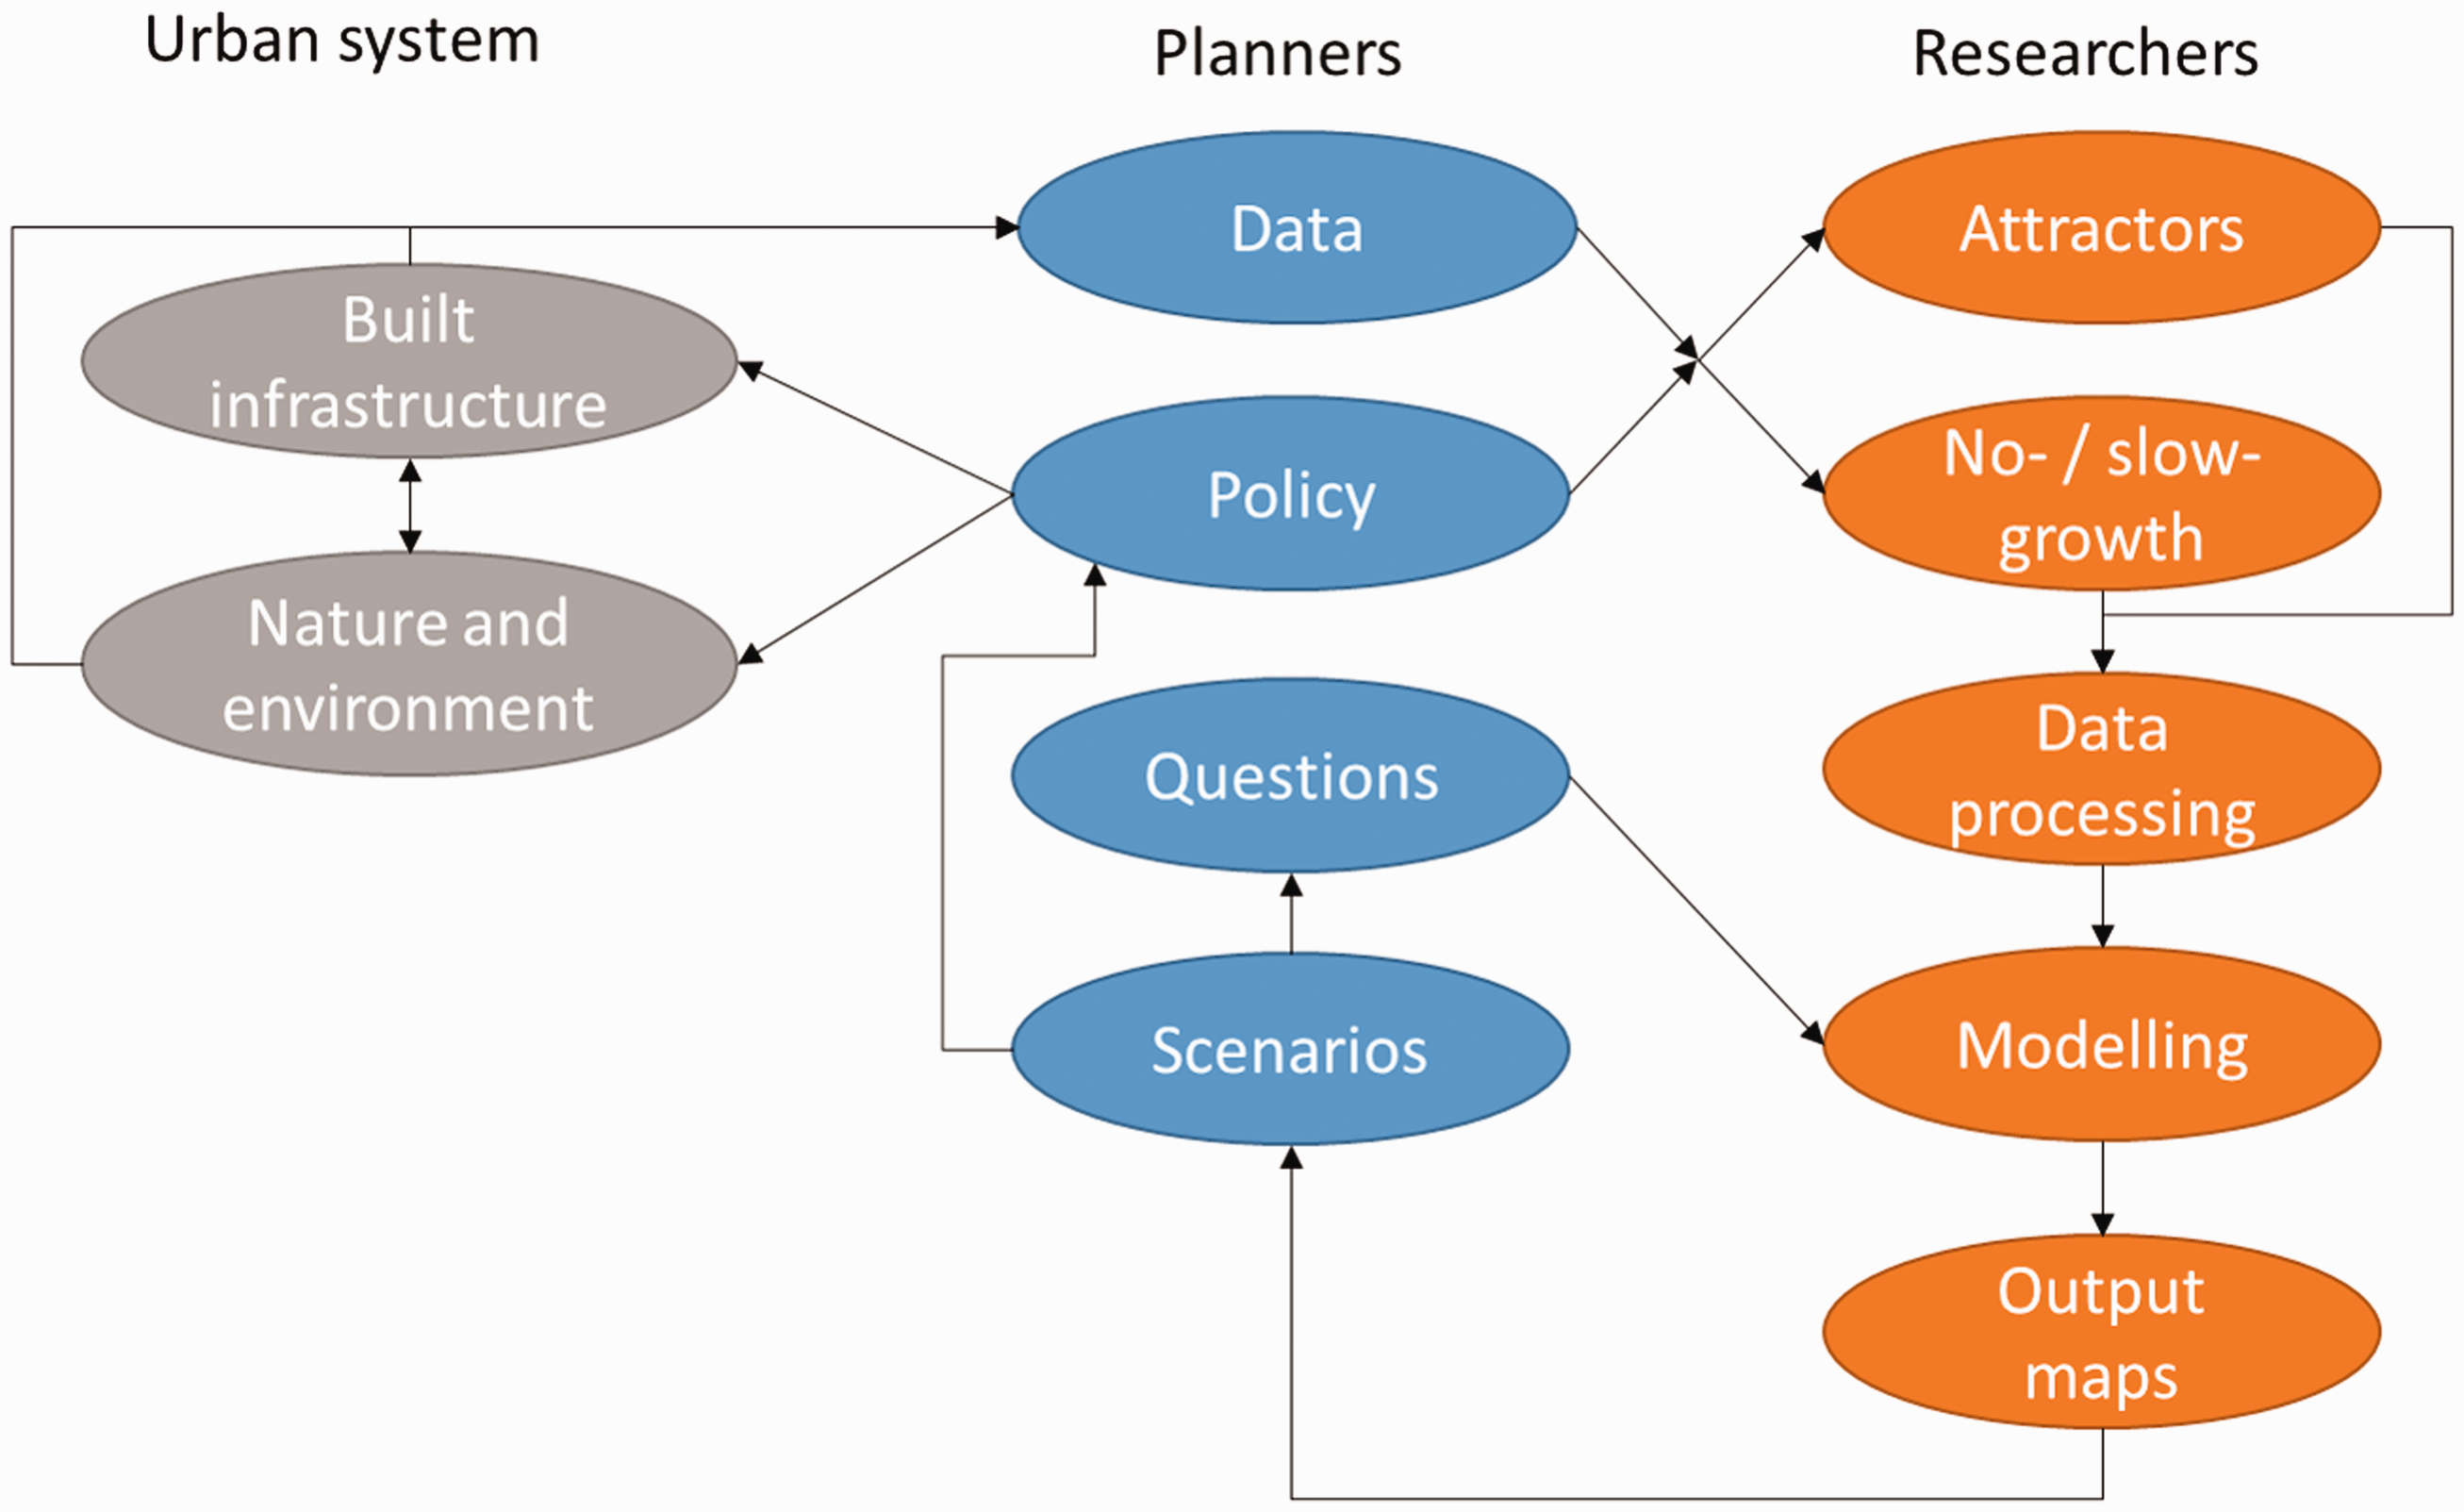
Links and interactions between the urban system, urban and regional planners, and researchers.
The primary planner from TRF involved in this project was Helena Näsström, who also contributed planner perspectives to this paper. Interactions primarily comprised meetings between the researchers, Helena, and often three or more of her colleagues at TRF, according to availability. The planners engaged in this project had varying specialties (including GIS, land use, and sustainable development) and levels of experience (from newly employed graduates to planners with more than 20 years of experience). The initial project meetings took place in February 2018, and involved only two researchers and one planner (Helena). The activities detailed in the first two stages of model adaptation (assessment of the existing model, data collection) were conducted during these initial meetings.
The model adaptation process in subsequent stages was iterative. During quarterly project meetings involving about 3–8 researchers and 1–6 planners, the model in its current form was assessed and planners’ needs and ideas were discussed. Changes were then made to the model and the effects were discussed at the next meeting, which led to further ideas for model expansion/changes, and so forth. All meetings lasted 3–4 hours and roughly comprised: (i) presentations by the researchers, detailing the current project status and demonstrating the latest available outputs; (ii) discussion of the presentations, with researchers answering planners’ questions and vice versa; (iii) discussion of any data needs; and (iv) discussion of plans and ideas. The ideas and adaptations emerging from meetings were processed (investigated for feasibility, etc.) by the researchers after each meeting, with follow-ups by email with the planners to clarify details and data needs.
This participatory process is ongoing and iterative; this paper provides a snapshot of a four-stage phase (see Table 1), which led to some significant changes in LEAM Stockholm. The planners were involved in all stages, which served the dual purpose of ensuring that the model update was as accurate and useful as possible, and helping the planners to understand and use the PSSs.
Stages of planner engagement.
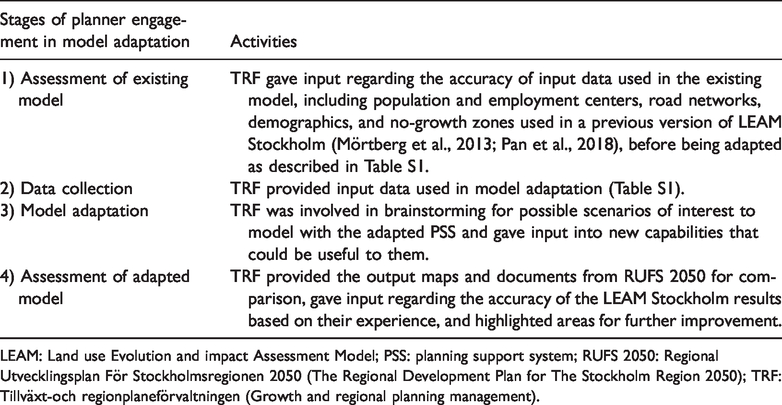
LEAM: Land use Evolution and impact Assessment Model; PSS: planning support system; RUFS 2050: Regional Utvecklingsplan För Stockholmsregionen 2050 (The Regional Development Plan for The Stockholm Region 2050); TRF: Tillväxt-och regionplaneförvaltningen (Growth and regional planning management).
Model adaptation
LEAM Stockholm was adapted in three steps (Table 2). The first step involved updating the input data in the existing model, which encompassed Stages 1 and 2 in Table 1. The second and third steps involved changes to the model for relevant scenario representation and data selection, and assessment of how well the PSS reflects real policies, as interpreted by the planners. These two main model adaptations included addition of public transport to LEAM Stockholm, by including public transport stops as development attractors (Step 2), and municipal borders for representation of individual municipal development goals and demographic projections (Step 3). These last two steps formed the “model adaptation” stage of planner engagement (Stage 3 in Table 1) and were followed by assessment of the adapted model together with planners (Stage 4 in Table 1).
Description of model adaptation steps applied to LEAM Stockholm.
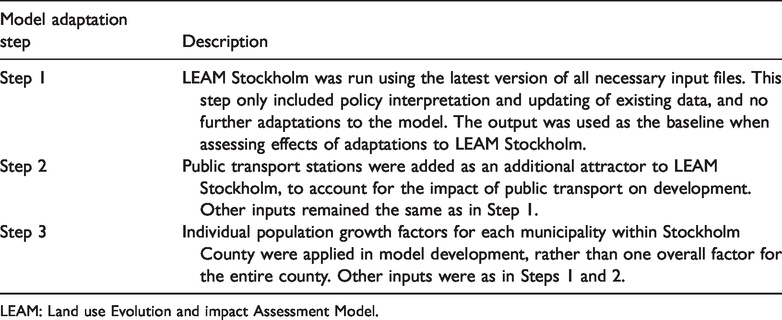
LEAM: Land use Evolution and impact Assessment Model.
Results and discussion
LEAM Stockholm adaptation
The number of additional housing units to be developed was the same in each step, and thus differences in the results showed the location and density of predicted development. The urban development output of LEAM Stockholm using updated data provided by TRF (Step 1, see Figure S1) showed densification in and around existing urban areas and spreading outward from the existing dense urban center of Stockholm City. There was also some urban sprawl development in areas outside Stockholm City and other main urban cores (particularly in the north of the county).
Addition of public transport stations as attractors (Step 2) resulted in a development shift toward the major public transport routes (Figure S2 in SI). This scenario was slightly denser than that in Step 1, with much of the outlying development moving closer to the nearest major public transport connections.
Inclusion of individual municipal development and growth goals for 2050 in LEAM Stockholm (Step 3) led to denser development and less sprawl than in the previous two scenarios, because the municipal goals drove the main development to the inner-city municipalities (Figure S3 in SI). The final resulting urban form (Figure 4) was thus an extension of the dense city structure already present in Stockholm City, with some additional development near other regional cores and some less-dense development spreading out from these cores.
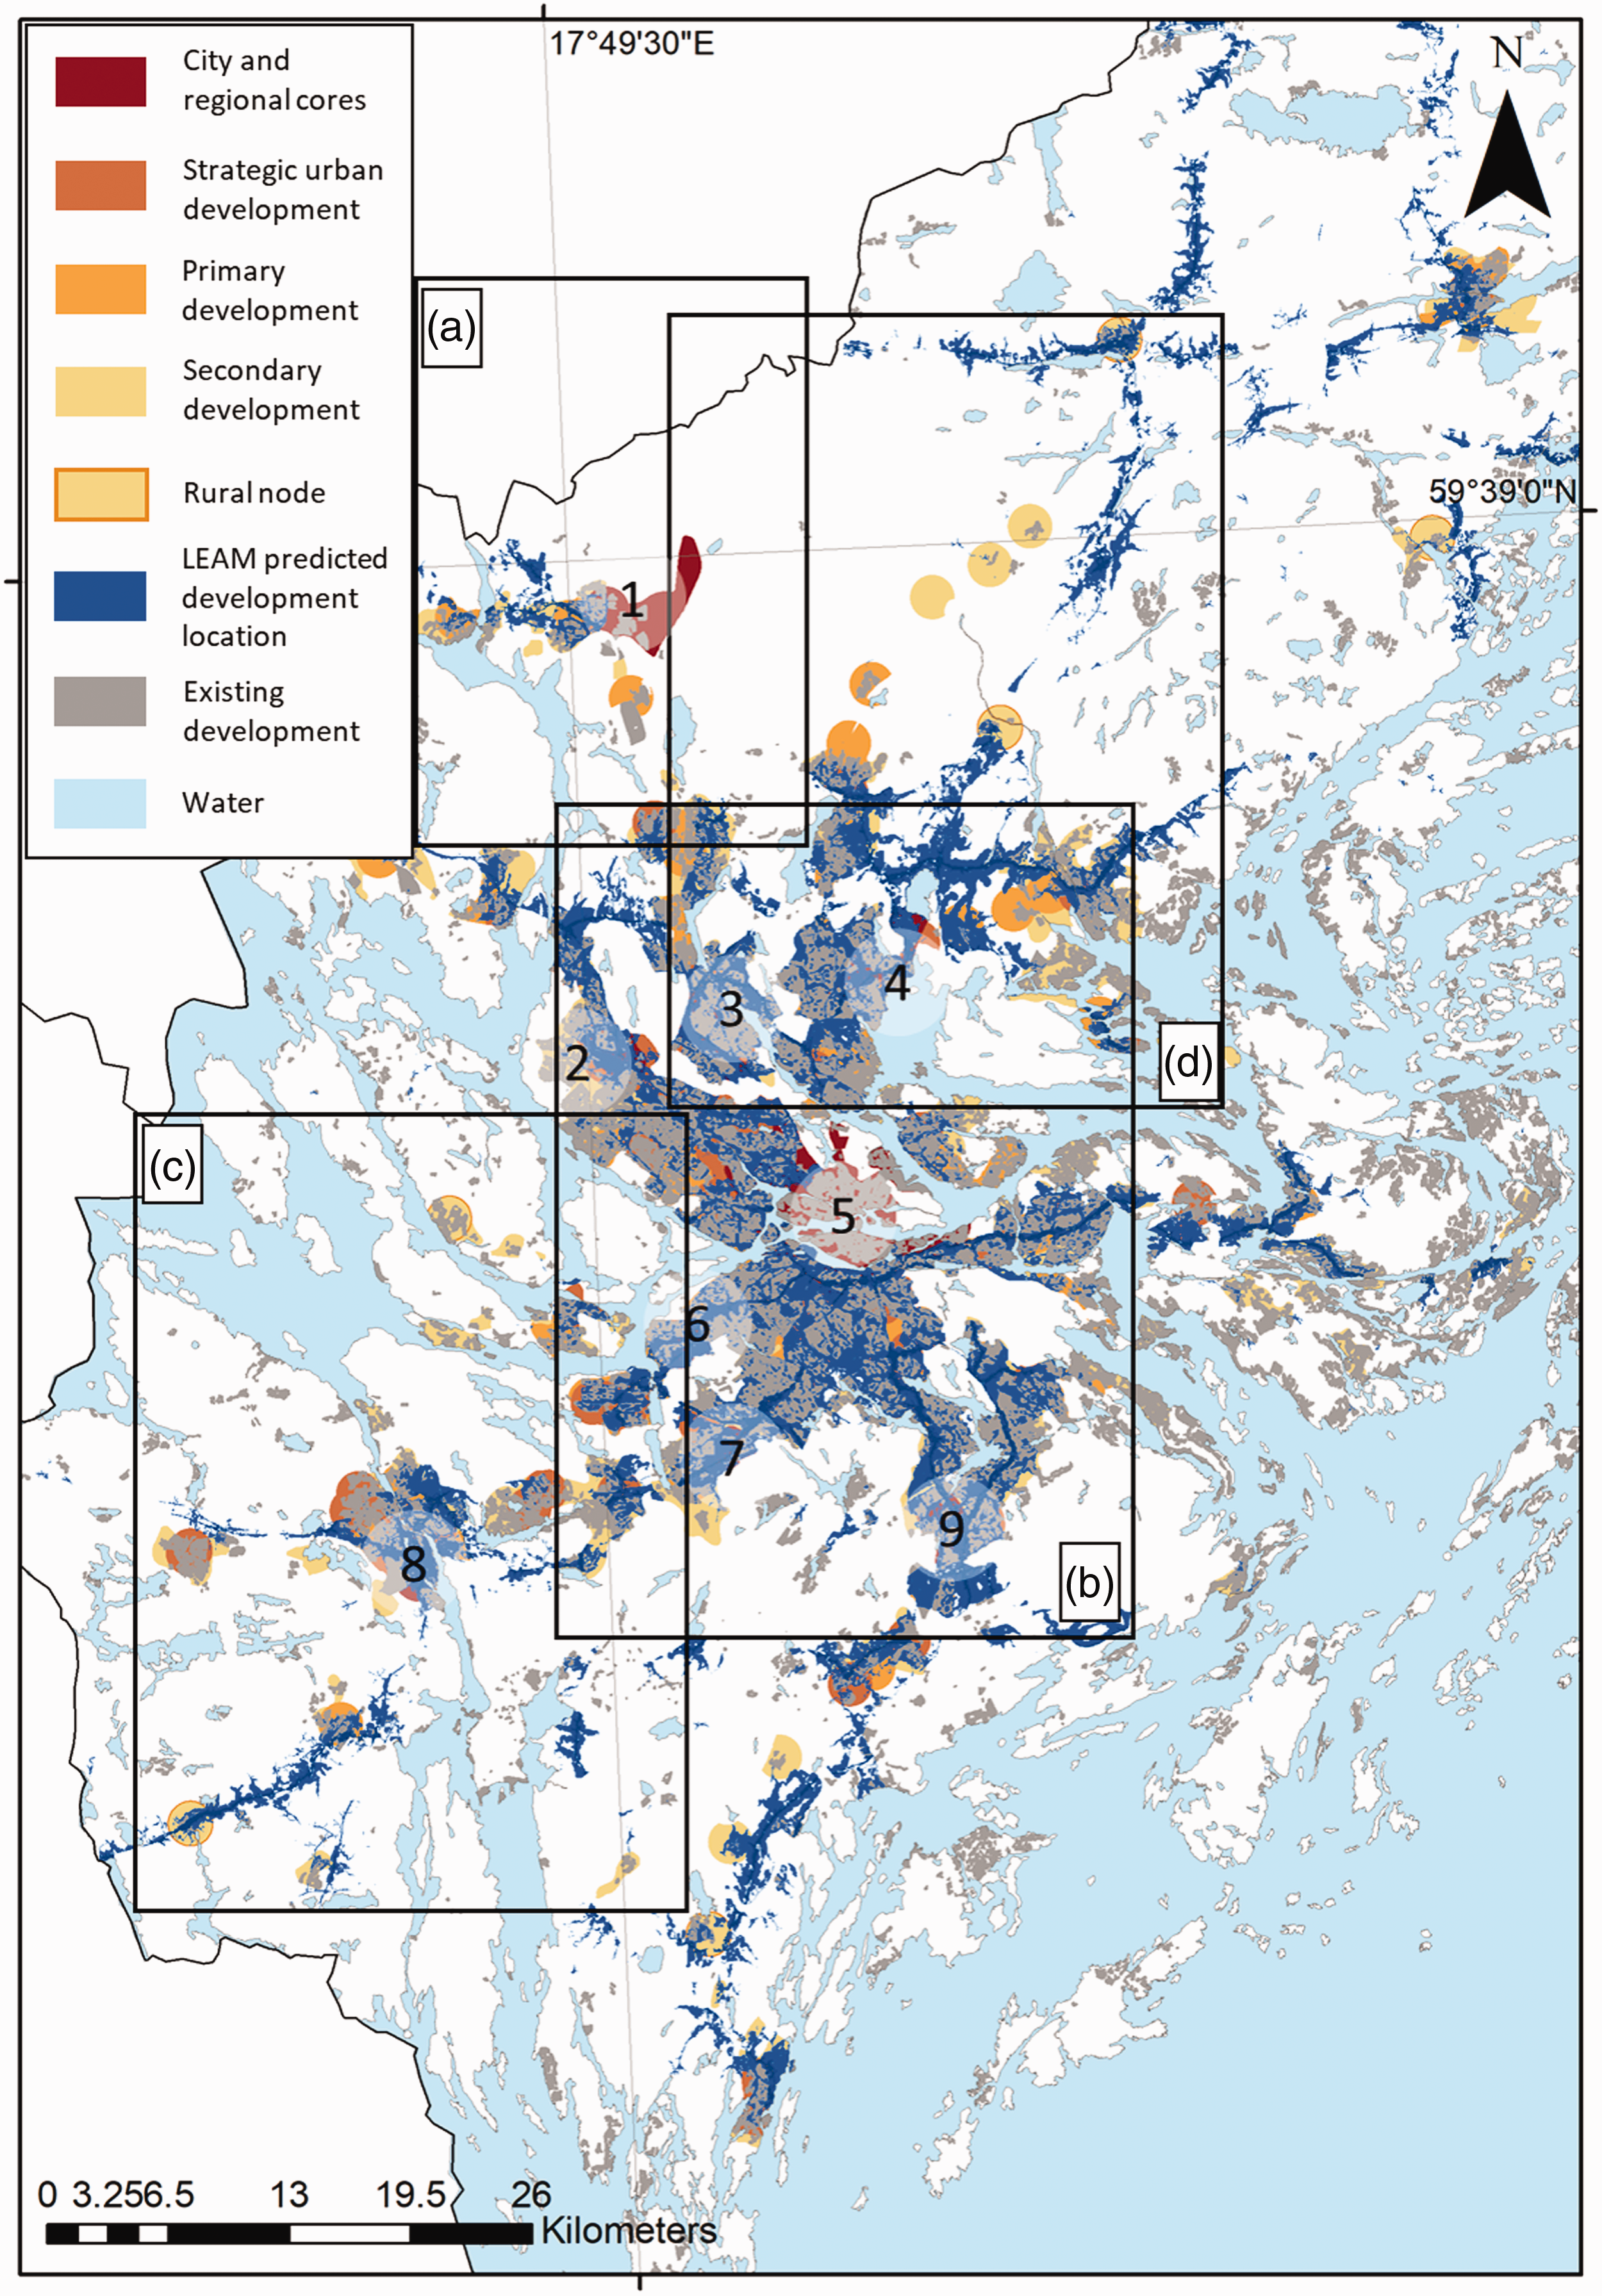
Urban development map from the adapted LEAM Stockholm compared with the regional development plan RUFS 2050. Numbers 1–9 refer to the RUFS 2050 urban cores circled in Figure 1(b), while (a) to (d) refer to the panels in Figure 5. Source: Adapted from TRF (2017). LEAM: Land use Evolution and impact Assessment Model.
Comparison of urban development between LEAM Stockholm and RUFS 2050
Adaptation of LEAM Stockholm in accordance with planners’ information and suggestions led to some urban development differences from RUFS 2050. For direct comparison, in Figure 4 the final results from the adapted LEAM Stockholm (Figure S3) are superimposed on the planned regional development in RUFS 2050 (Figure 1(b)). In both models, the main urban development is expected to occur around Stockholm City, as expansion of the existing dense city core. Both models also show some expected development around other regional urban cores, and outwards from Stockholm City following the main highways and commuter trainlines, as well as some limited development in the islands to the east of the county.
RUFS 2050 includes nine regional cores (circles in Figure 1(b)), which form the backbone of development for 2050. In Figure 4, these are numbered 1–9 for more detailed core-specific comparison and identification of differences between RUFS 2050 and the adapted LEAM Stockholm (see also enlarged view in Figure 5). Urban expansion is widely predicted in Arlanda and Märsta (Core 1 in Figure 4; Figure 5(a)), as Arlanda is Stockholm’s major international airport and significant airport expansion is planned by 2050, along with creation of an “Airport City” as a regional node. This involves development of many workplaces near the airport, and expansion of the existing nearby town of Märsta to provide additional accommodation and other infrastructure within easy commuting distance from the airport (Sigtuna Kommun, 2014). Although LEAM Stockholm predicts some development in this area, it is farther to the west and less dense than in RUFS 2050 (Figure 5(a)). This difference is not surprising, since future development in this area will be directed by strategic planning rather than by organic growth following current city patterns, and thus would not show up in the LEAM Stockholm output unless forced to by the inputs. This reflects a main scenario difference, with the LEAM Stockholm results showing how development would most likely occur based on current drivers and attractors, while RUFS 2050 also includes new strategic planning directions and political will. The latter could be included in an additional scenario in LEAM Stockholm, by increasing the future attractiveness of Arlanda in order to represent the associated strategic planning and policy decisions.
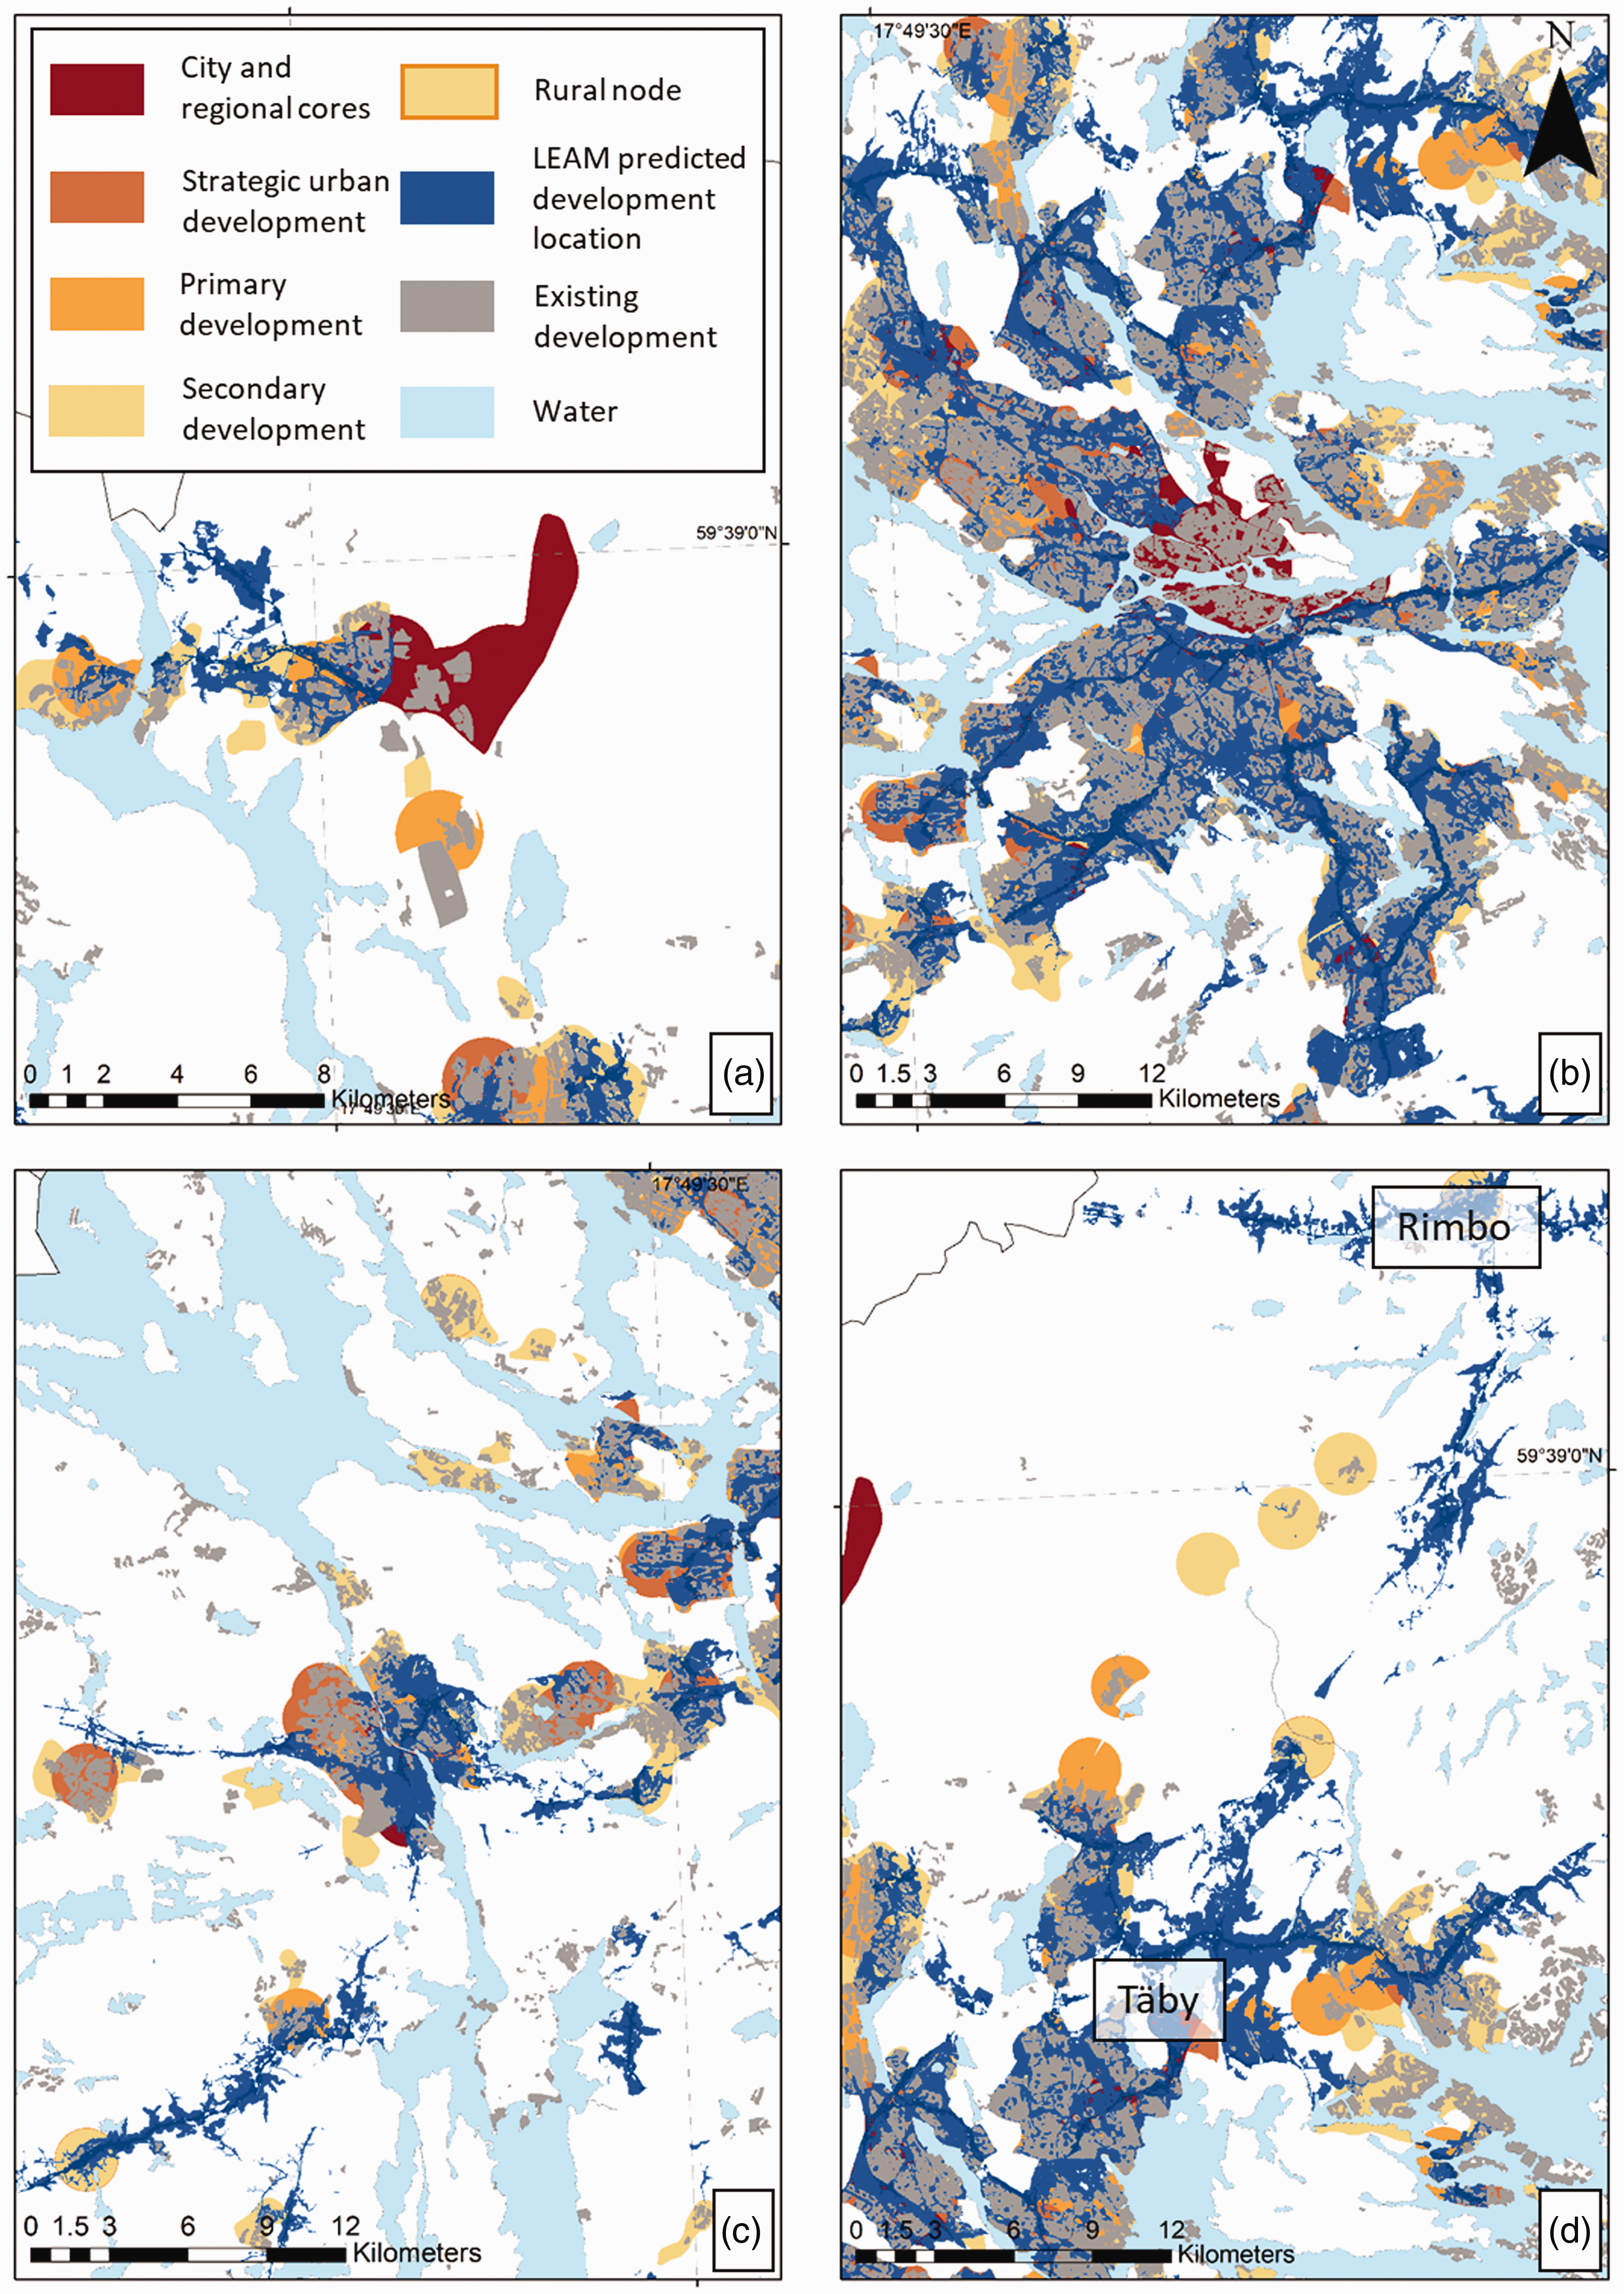
Comparison between LEAM Stockholm and RUFS 2050 for (a) Arlanda–Märsta, (b) Stockholm City and surroundings, (c) Södertälje, and (d) Täby. LEAM: Land use Evolution and impact Assessment Model.
Significant urban development is also likely to take place in the suburbs of Stockholm City by 2050 (Cores 2, 3, 6, 7, and 9 in Figure 4; Figure 5(b)). The LEAM Stockholm results are similar to the strategic urban development locations in RUFS 2050 (Figure 5(b)). The urban development in these cores is primarily in the form of (residential, commercial, and urban service) densification in between and around existing urban areas. Both models also show similar expansion and densification of Södertälje City (Core 8 in Figure 4; Figure 5(c)), the second largest city in Stockholm County and home to a busy port and major industrial activities. Similar model results are apparent for the island of Lidingö (east–north-east of the city center), with largely residential development that is not included in the dense urban cores of RUFS 2050 (Figure 4).
In both models, the main urban growth and densification is expected to occur around Stockholm City’s dense urban center (Core 5 in Figure 4; Figure 5(b)), extending from Solna in the north-west, around the west and south sides of the center, and ending in Sickla in the south-east. However, LEAM Stockholm results differ from those in RUFS 2050 in some instances (Figure 5(b)). For example, LEAM Stockholm does not involve new developments in the very center of Core 5, because parts of the central islands of Stockholm City were included in “restricted areas” data provided by TRF (meaning no new development or densification is allowed in these areas) and thus were classified as “no-growth zones” in scenario modeling. Nevertheless, RUFS 2050 still expects some development in these areas, through densification of the existing built environment. RUFS 2050 also shows some fairly large main development zones within the no-growth zone of the LEAM Stockholm scenario for Core 5, even though these zones are parks or other restricted green areas within the dense urban environment. These green zones are integral to the RUFS 2050 notion of a core, and are therefore shown in their maps as part of the main urban Core 5, leading to a mismatch in the representation of the urban zone between RUFS 2050 and LEAM Stockholm. This disparity also reflects resolution differences, with RUFS 2050 using data on a scale of 100 meters × 100 meters and showing final output maps for planning (used also in this comparison) on a more aggregated scale (entire neighborhoods or larger urban cores), while LEAM Stockholm uses data and shows result maps on the much finer scale of 30 meters × 30 meters. Additionally, RUFS 2050 does not distinguish between existing and new urban zones when mapping entire areas in which development will take place, whereas LEAM Stockholm only shows new developments in its basic output maps.
For the area of Täby (Core 4 in Figure 4; Figure 5(d)), the model results correspond reasonably well near the city center (bottom third of Figure 5(d)), but differ considerably in development locations between Täby center and Rimbo. The LEAM Stockholm developments follow the current highway north from Täby, while RUFS 2050 places urban developments farther to the west, following a railway line. This is one of the few places in Stockholm County where the main railway route differs noticeably from the major road routes, and thus highlights a possible bias in LEAM Stockholm toward roads over public transport routes. This was discussed with TRF during feedback meetings and, in light of the importance of public transport in achieving the region’s climate-action goals, further steps will be taken in future research to include public transport in LEAM Stockholm.
Planner engagement model adaptation
The aim of planner engagement in LEAM Stockholm adaptation was to increase planner contributions, understanding, and willingness to use LEAM Stockholm, in order to overcome instrument quality and acceptance barriers to practical adoption of this PSS (Karlsson et al., 2017; Vonk et al., 2005). Stages 1 and 3 (see Table 1) of planner engagement in model adaptation (identifying shortcomings and potential improvements) resulted in the adapted LEAM Stockholm being better suited to specific planning needs. This helped to overcome the instrument quality barrier to PSS adoption, by improving the tool in ways catering to the needs of the target users (Vonk et al., 2005). Stage 2 of planner engagement (data collection) also helped to improve the PSS quality, by ensuring use of the most relevant, complete, and up-to-date data.
In Stage 4 of planner engagement, the results from LEAM Stockholm and comparisons with RUFS 2050 were discussed with the planners. Despite some differences in approach, and hence differences in results, the planners found it reassuring that both models yielded largely consistent results. They also recognized and appreciated that LEAM Stockholm is flexible and can be modified to test other future scenarios, thereby providing a wider range of results and more rooted decision support than the current planning procedure. Stage 4, together with the overall planner involvement and insight into model development and application, thereby helped to overcome the acceptance barrier to PSS adoption (Vonk et al., 2005).
During the last meeting, it was agreed that planner engagement had been highly relevant for overcoming adoption barriers to LEAM Stockholm. Reflecting on the engagement process, the planners said that the adaptations, and ongoing adaptation work, make LEAM “much more relevant” for them to use, and that one of the “great parts” of collaboration is that “you listen to us and our needs as planners for the Stockholm Region.” In particular, they found incorporation of public transport in the model very helpful in making it more relevant, given the importance of public transport in the region. Based on this feedback, further work to improve public transport modeling in LEAM Stockholm is ongoing. The planners also provided ideas for further improvements, which will be considered and used in future research and development on LEAM Stockholm. Based on experiences in this project, relevant planners and other potential users should be involved in the development of PSS technology. This is likely to yield better and more useful final products and contribute to bridging the PSS availability-implementation gap, thereby improving analysis and assessment of development scenarios for complex urban systems and contributing to sustainable urban and regional planning.
Conclusions
Adaptation of LEAM Stockholm with direct involvement of planners was successful, as regional planners considered this PSS to have high potential for use in future planning for the Stockholm Region. Involving planners in the process, and the similarities between LEAM Stockholm and RUFS 2050 results, helped to overcome instrumental PSS quality and acceptance barriers. More efforts are needed to simplify the LEAM Stockholm interface for future use by planners. The collaborative model adaptation process should be continuous and iterative. Additional improvements will be made to LEAM Stockholm based on planners’ feedback in this and parallel projects. This will allow scientific advances to be integrated with planner engagement and knowledge, improving the complex process of planning for sustainable urban development.
Supplemental Material
sj-pdf-1-epb-10.1177_2399808320919769 - Supplemental material for Open-source planning support system for sustainable regional planning: A case study of Stockholm County, Sweden
Supplemental material, sj-pdf-1-epb-10.1177_2399808320919769 for Open-source planning support system for sustainable regional planning: A case study of Stockholm County, Sweden by Jessica Page, Ulla Mörtberg, Georgia Destouni, Carla Ferreira, Helena Näsström and Zahra Kalantari in Environment and Planning B: Urban Analytics and City Science
Footnotes
Acknowledgements
The authors acknowledge and appreciate the willingness to engage in and support of the work done in this study from TRF.
Declaration of conflicting interests
The author(s) declared no potential conflicts of interest with respect to the research, authorship, and/or publication of this article.
Funding
The author(s) disclosed receipt of the following financial support for the research, authorship, and/or publication of this article: This study has been part of and supported by a research project, the SLL-SU project (LS-2017-0586) as well as the SLL-KTH project LEAM Stockholm (LS 2018-0736), both in Sweden. Carla Ferreira was supported by the Portuguese Science and Technology Foundation, through the post-doctoral grant SFRH/BPD/120093/2016.
Supplemental material
Supplemental material for this article is available online.
References
Supplementary Material
Please find the following supplemental material available below.
For Open Access articles published under a Creative Commons License, all supplemental material carries the same license as the article it is associated with.
For non-Open Access articles published, all supplemental material carries a non-exclusive license, and permission requests for re-use of supplemental material or any part of supplemental material shall be sent directly to the copyright owner as specified in the copyright notice associated with the article.