
Abstract
Measuring the size of a crowd in a specific location can be of crucial importance for crowd management, in particular in emergency situations. Here, using two football stadiums as case studies, we present evidence that data generated through interactions with the social media platform Instagram can be used to generate estimates of the size of a crowd. We present a detailed analysis of the impact of varying the time period and spatial area considered for the collection of Instagram data. Crucially, we demonstrate how to address issues that arise from changes in the usage of a social media platform such as Instagram. Our findings show how social media datasets carrying location-based information may help provide near to real-time measurements of the size of a crowd.
Introduction
Rapid, accurate estimates of the size of a crowd can be of vital importance in a range of situations, in particular the facilitation of emergency operations (Helbing et al., 2000). Traditional techniques for crowd size estimation can be time consuming, may require high resolution images to be available and may lead to inaccurate estimates due to the need for human judgement (Chan et al., 2008; Cruz et al., 2015; Henke, 2016; Kong et al., 2006; Yip et al., 2010).
Recently, a plethora of studies have highlighted the potential to use data generated through our interactions with the Internet to gain unprecedented insights into human collective behaviour (Conte et al., 2012; Giannotti et al., 2012; Giles, 2012; King, 2011; Lazer et al., 2009; Moat et al., 2014; Pentland, 2009; Vespignani, 2009). For example, our online quests for information leave behind traces in the form of search engine query logs (Letchford et al., 2016; Moat et al., 2016; Preis et al., 2013). It has been shown that data on words and topics users have been searching for online can inform rapid estimates of the current state of society, from health-related measurements such as the number of people infected with the flu (Ginsberg et al., 2009; Preis and Moat, 2014) to a range of economic variables (Curme et al., 2014; Goel et al., 2010; Pavlicek and Kristoufek, 2015). Similar footprints are also generated by users when visiting pages of the online encyclopaedia Wikipedia (Moat et al., 2013; Samoilenko and Yasseri, 2014; Yasseri et al., 2012). Volumes of text and images uploaded to social media platforms provide yet another rich source of information on human behaviour and our interactions with the environment we live in (Aiello et al., 2016; Alanyali et al., 2016; Borge-Holthoefer et al., 2011, 2016; Burnap et al., 2014; Ciulla et al., 2012; Quercia et al., 2014, 2015, 2016; Seresinhe et al., 2016, 2018).
A number of studies have sought to use data generated through the usage of the mobile phone network to shine light on the dynamics of people in cities (Aledavood et al., 2015; Blondel et al., 2015; Botta and del Genio, 2017; Calabrese et al., 2011; Ferrari and Mamei, 2011; Furletti et al., 2017; Girardin et al., 2009; Ihler et al., 2007; Neumann et al., 2013; Quercia et al., 2011; Traag et al., 2011; Weppner and Lukowicz, 2013). Indeed, such data have already been shown to offer accurate estimates of the number of people in a restricted area at a given time (Botta et al., 2015; Mamei and Colonna, 2016). However, mobile phone records are usually held by mobile phone providers and are therefore often difficult to access for scientific analyses.
Here, we investigate whether alternative data from social media can be used to infer the size of a crowd in a specific area at a given time. Our aim is to perform a detailed analysis of how data shared on social media can be used to generate rapid and accurate estimates of the size of a crowd. In particular, we focus on the popular photo sharing platform Instagram. We detail two case studies aimed at illustrating the challenges that can arise from different social media usage levels in different locations, and the effects of varying the time period and spatial area considered when collecting Instagram data. Crucially, we demonstrate how the potential effect of changes in the popularity of a service can be managed through dynamic calibration of the model. This is particularly important as it is clear that social media data may not provide a complete and unbiased sample of a crowd.
Materials and methods
In order to calibrate a model to estimate the size of a crowd, we require case studies for which accurate figures for the number of people present in a specific area are available. Due to the difficulty of accurately measuring crowd sizes, there are few situations for which such figures can be obtained. We suggest that football matches are ideal test scenarios, as the stadiums in which they take place can usually only be accessed through turnstiles and with tickets. As a result, for most major football matches, reasonably exact attendance figures are made available after the match.
We therefore consider the San Siro football stadium in Milan and the Stadio Olimpico football stadium in Rome, for which we have official attendance figures for all football matches that took place during the one-year period of analysis from 1 January 2014 to 31 December 2014. Both Italian stadiums are used as primary stadiums for two international football clubs: AC Milan and FC Internazionale Milan play in San Siro, and AS Roma and SS Lazio in Olimpico. This usage of each stadium by two teams is advantageous for our analyses, as it gives us data for a larger number of football matches.
Using the Instagram API, we retrieve data on all photos uploaded to the photo-sharing platform that have been tagged with locations in proximity of the two football stadiums during the period of analysis. Instagram photos are timestamped with the time when they were shared on Instagram. Figures 1(a) and (b) depict the locations of photos uploaded to Instagram within the vicinity of the two stadiums during a time window of four hours beginning one hour before the official starting time of a football match. Initial visual inspection reveals higher Instagram activity within the bounding boxes defined around the two stadiums. Geographical coordinates for the two bounding boxes are defined in online Supplementary Tables 1 and 2.
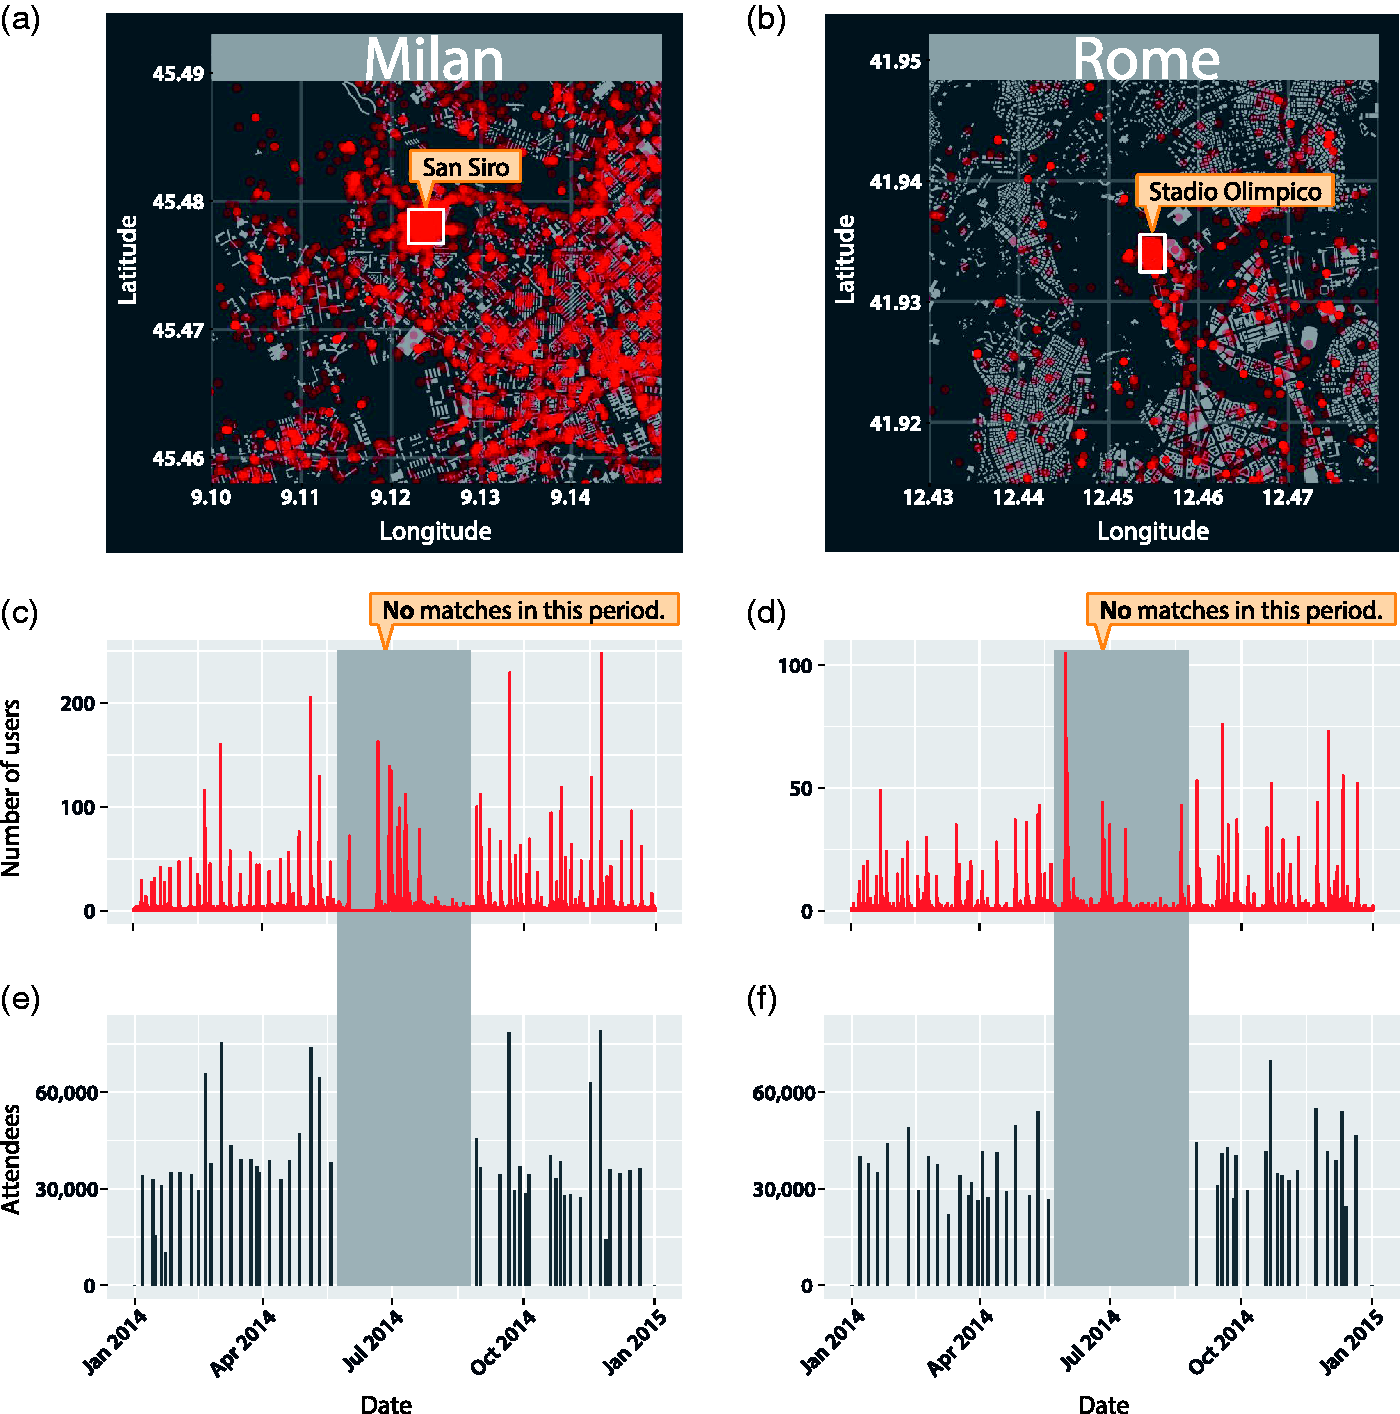
Activity of Instagram users in football stadiums in Milan and Rome. (a,b) We analyse data on geotagged photos uploaded to the photo sharing platform Instagram in the proximity of two Italian football stadiums in Milan and Rome. The dataset covers the period from 1 January 2014 to 31 December 2014. In red, we depict the locations of all photos uploaded to Instagram within the vicinity of the two stadiums during the time interval beginning one hour before the beginning of a football match and ending three hours later. Visual inspection reveals higher activity in the proximity of the stadiums. We aim to determine whether such activity can be used to infer the number of attendees at football matches. In white, we depict the bounding boxes that we use in the subsequent analyses, for which coordinates are given in online Supplementary Tables 1 and 2. These maps were created using map data from OpenStreetMap. (c,d) We depict the time series of unique active users on Instagram recorded within the bounding box around the San Siro football stadium in Milan at hourly granularity. Similarly, we present a time series of hourly Instagram activity within the bounding box around the Stadio Olimpico football stadium in Rome. (e,f) We plot the number of officially recorded attendees at the football matches that took place in the two stadiums. Visual inspection suggests that peaks in the number of Instagram users identified within the stadiums align with dates on which a football match took place. The size of the spikes in number of Instagram users also appears to correspond to the number of attendees. Regions shaded in grey represent the summer months, during which there were no football matches. While other events such as concerts took place in the stadiums, no official attendance figures are available for these events. As such, these events are discarded for the remainder of the analysis.
We note that the Instagram API only provides a timestamp for the time at which a photo was uploaded, and not the time at which it was taken. As a consequence, it is not possible to upload a photo at a later time with a timestamp which falls into the earlier time interval of interest. This means that later downloads of photographs for a given time interval cannot contain new photographs that would not have been accessible immediately after the time interval in question, giving us confidence that our analysis is based on data from photographs which would have been available in real time. However, we do note that users may delete photographs, such that later downloads of Instagram data may not reflect the full set of photographs accessible immediately after the time interval itself.
We also retrieve official attendance figures for all football matches which took place in the two football stadiums during the period of our analyses, using reports available on the website of the Italian sports newspaper La Gazzetta dello Sport (www.gazzetta.it). During 2014, the stadiums San Siro and Stadio Olimpico hosted 45 and 40 football matches respectively.
In online Supplementary Figures 1 and 2, we depict the distributions of the number of photos posted during each match, the number of football match attendees and the number of Instagram users who posted at least one photo on Instagram during a football match, for both stadiums.
Results
We analyse the number of users who uploaded at least one photo to Instagram between 1 January 2014 and 31 December 2014 with a location within the bounding boxes defined around the two football stadiums (as depicted in Figures 1(a) and (b)). Figures 1(c) and (d) show the hourly time series of the number of active users for both stadiums. In both cities, we observe distinct spikes occurring throughout the year. Figures 1(e) and (f) show the number of attendees officially recorded at each football match. Visual inspection reveals similarities between the number of Instagram users and the number of attendees at the football matches. Regions shaded in grey highlight the summer break during which no football match took place. However, we register non-zero Instagram activity in both stadiums for this period. Further investigation of these time periods shows that events such as concerts took place in both stadiums during summer. For these events, no official attendance figures are available. The summer break has thus been excluded from our analyses due to the lack of accurate ground truth data to calibrate our models.
We investigate the relationship between the number of active users on Instagram and the number of attendees at corresponding football matches. In this initial analysis, we consider a user to be active if they uploaded at least one photo on Instagram within a time window of four hours starting one hour before the official starting time of a football match, and within the bounding box defined around the football stadium. The coordinates used to define the bounding boxes around the two stadiums are provided in online Supplementary Tables 1 and 2. We find that a greater number of active Instagram users in a stadium corresponds to a greater number of attendees (San Siro: slope
Accounting for changes in Instagram usage
The analyses we have described so far are based on an implicit assumption that the number of active users on Instagram can be considered constant throughout the whole of 2014. Instagram, however, has become an increasingly popular social media service and the active user base has been steadily growing. We therefore divide the period of analysis into two parts and analyse them separately, to determine whether there is a difference in Instagram usage in these two periods and to evaluate the impact of this difference on our estimates. The period from January 2014 to May 2014 captures the end of the 2013/2014 football season whilst the period from August 2014 to December 2014 captures the beginning of the 2014/2015 season.
We perform parallel analyses for the two time periods separately. Figures 2(a) and (b) depict the results of these analyses. We again observe that a larger number of active users on Instagram corresponds to a larger number of match attendees. This holds across the two time periods and for both football stadiums (all
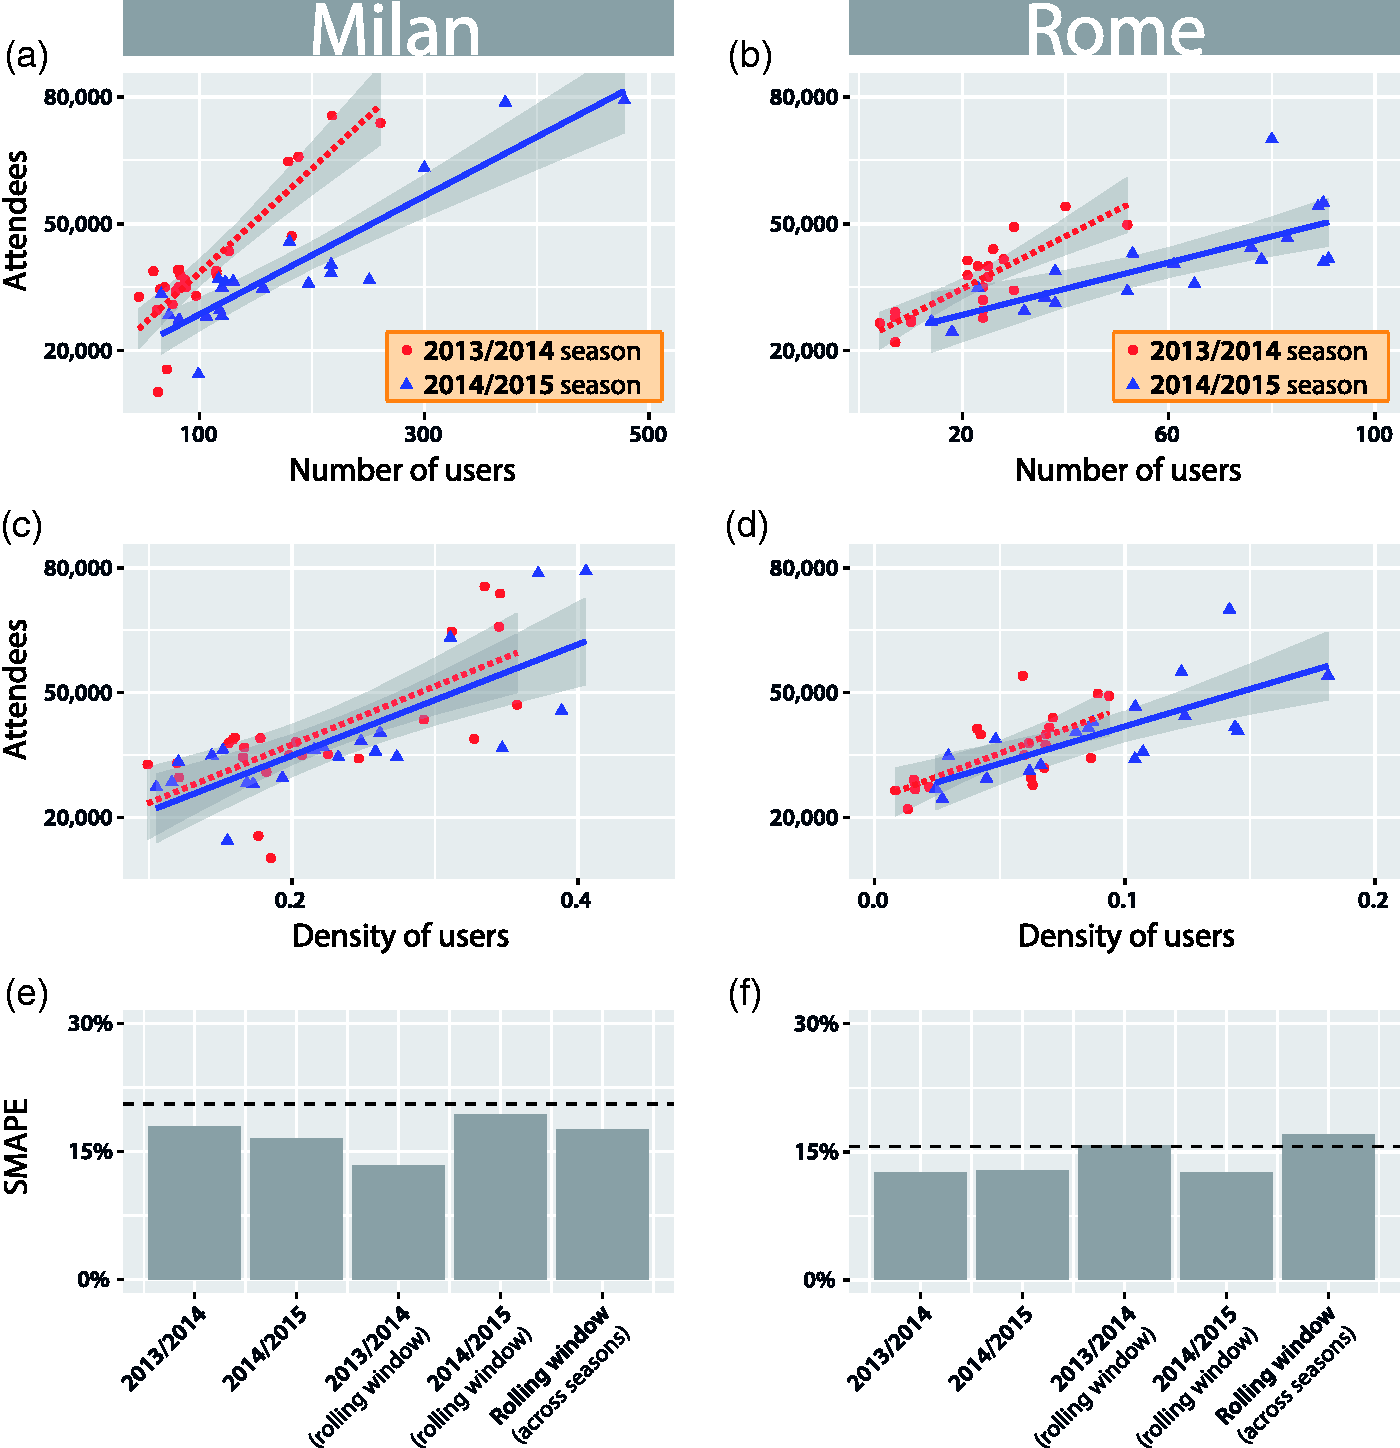
Comparing football match attendance figures to active users on Instagram. We investigate the relationship between the number of people at football matches and the number of users uploading photos to Instagram. We consider users who have uploaded at least one photo from within the stadium in a time window of four hours, starting one hour before the starting time of a football match. (a,b) In both stadiums and across seasons, a larger number of users corresponds to a larger number of attendees (all p < 0.001, all
Relationship between Instagram user activity in a football stadium and the number of match attendees.a
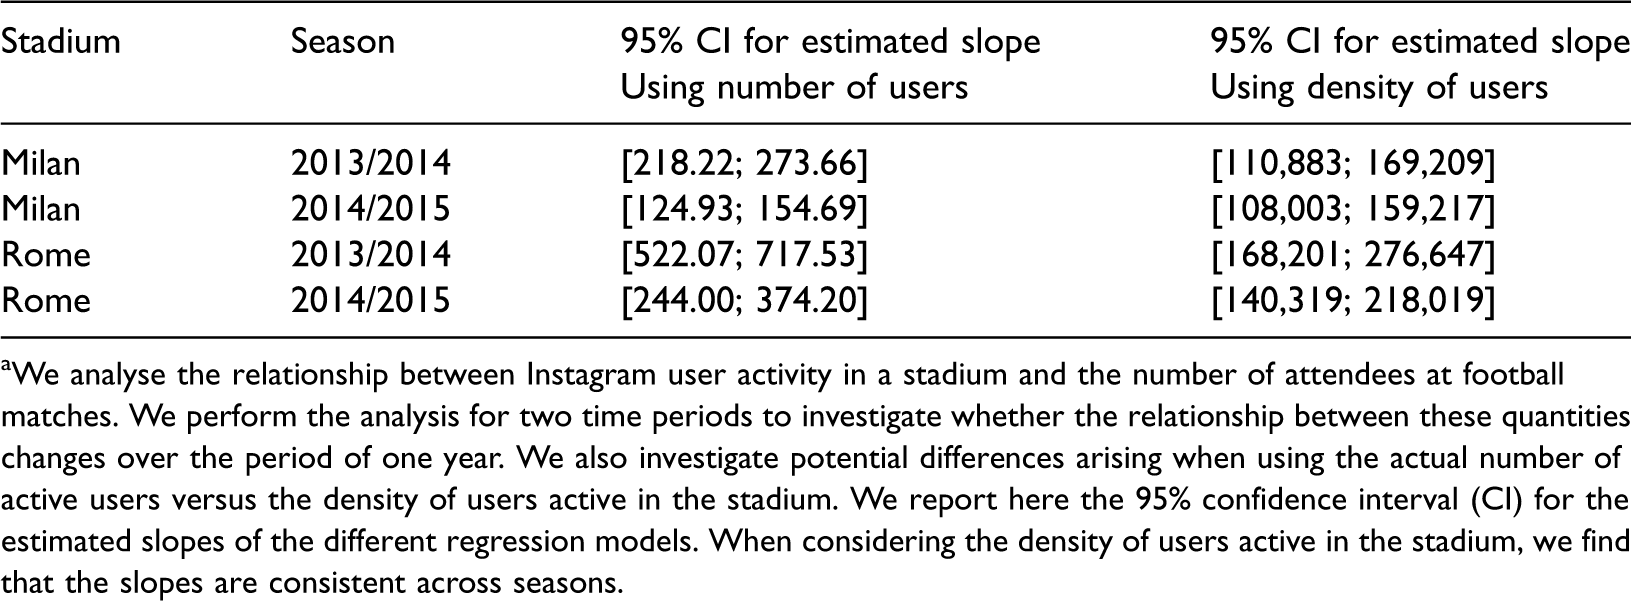
aWe analyse the relationship between Instagram user activity in a stadium and the number of attendees at football matches. We perform the analysis for two time periods to investigate whether the relationship between these quantities changes over the period of one year. We also investigate potential differences arising when using the actual number of active users versus the density of users active in the stadium. We report here the 95% confidence interval (CI) for the estimated slopes of the different regression models. When considering the density of users active in the stadium, we find that the slopes are consistent across seasons.
If the number of Instagram users is increasing, this should also hold for areas other than the football stadium. This suggests that we could normalise our Instagram counts by dividing the number of users that are inside the stadium by the number of users who are active in the same time window in a larger reference area.
We test this hypothesis by defining the density of users during a football match as the number of active users active inside the bounding box of a stadium divided by the number of active users in a much larger urban area around the stadium. We refer to these larger areas as the reference areas in the following. The coordinates for the reference areas in Milan and Rome are provided in online Supplementary Tables 3 and 4. As depicted in Figures 2(c) and (d), we again find that a larger number of attendees corresponds to a larger density of users (all
This analysis suggests that we can account for changes in the number of Instagram users by normalising the number of active users with the number of active users in a wide reference area. However, it is clear that the choice of the size of this area is somewhat arbitrary. In addition, the number of active users in a large area can also be influenced by other events (see, for instance, the spatial distribution of photos in Rome depicted in online Supplementary Figure 3). For this reason, in the following section, we introduce a model which is trained solely on data from within the stadium, but that also takes into account changes in the number of users by only considering data from the recent past.
Training models using historic data
In our previous analyses, we have considered models fitted using all available data, either for the entire year or for individual football seasons. In a practical setting, however, we would only have access to data from matches that have already taken place. Here, we investigate whether we can still infer the number of attendees for the next match when calibrating the model using data from the previous ten football matches. We call this a rolling window analysis. This analysis also automatically takes into account changes in Instagram usage, since only recent data are used to calibrate the model.
For a given stadium and season, we fit a model using data from the last 10 matches, and then estimate the number of attendees for the next match based on the number of Instagram users active during the match.
We measure the estimation or pseudo prediction error using the symmetric mean absolute percentage error (SMAPE). We first define the mean absolute percentage error (MAPE) for the predicted values 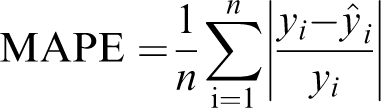
However, the MAPE is not an ideal error measure because it puts a heavier weight on negative errors. For this reason, it is often more useful to use its symmetric counterpart, defined as
We perform the rolling window analysis using data for the entire period of analysis and obtain a SMAPE of 17.5% for Milan and a SMAPE of 17% for Rome. If we carry out the rolling window analysis for each season separately, we obtain SMAPEs of 13.3% and 19.3% for Milan for the first and second season, respectively, and SMAPEs of 15.7% and 12.6% for Rome, as depicted in Figures 2(e) and (f).
In order to assess whether using only ten matches to calibrate the model significantly affects the accuracy of predictions, we compare these results to results from models which use all available data. To generate a comparable error measure for models calibrated using all available data, we carry out a leave-one-out cross-validation analysis as follows. First, we build a linear regression model leaving out one of the matches and considering all others. Then, we use this model to estimate the attendance figure at the match which was left out. We repeat this as many times as there are matches, so that every match is considered exactly once.
We find that models trained in this fashion, using match attendance data from both seasons, exhibit a SMAPE of 20.5% for Milan and a SMAPE of 15.6% for Rome. When performing the analysis for each season separately, we obtain SMAPEs of 17.9% and 16.5% for Milan for the first and second season respectively, whereas for Rome we find SMAPEs of 12.5% and 12.9% (Figures 2(e) and (f)). Comparing the results depicted in Figures 2(e) and (f), we observe that the prediction errors of the rolling window models are in line with those of models built using all data from the same football seasons. This provides evidence that no dramatic drop in performance would be expected when applying this approach in a practical setting.
Our analysis so far has considered the number of active users, i.e. the number of users who posted at least one photo to Instagram during the football match. A user may also decide to post more than one photo during the match. Qualitatively similar results are obtained when we consider the number of photos uploaded on Instagram instead of the number of active users. More details can be found in online Supplementary Figures 8 to 10.
Selecting an appropriate spatial area for analysis
Our analyses so far have considered a bounding box of fixed size around the football stadiums. However, it is not clear how this choice of bounding box may affect the outcome of our analyses. If we consider a larger area, we may be able to capture more match attendees who are active on Instagram in the broader vicinity of the football stadium, but we may also introduce additional noise stemming from users who are not attending the football match. A smaller area may reduce noise by restricting our analysis to users who are inside the stadium, but may mean that we miss some users, especially if errors in location measurements occur. We therefore investigate how the strength of the relationship changes as we vary the size of the area used to count active users on Instagram. For each stadium, we define a circle of a given radius centred around the stadium, as depicted in Figure 3(a) and (b). The coordinates used for the centre of the two stadiums are reported in online Supplementary Tables 5 and 6.
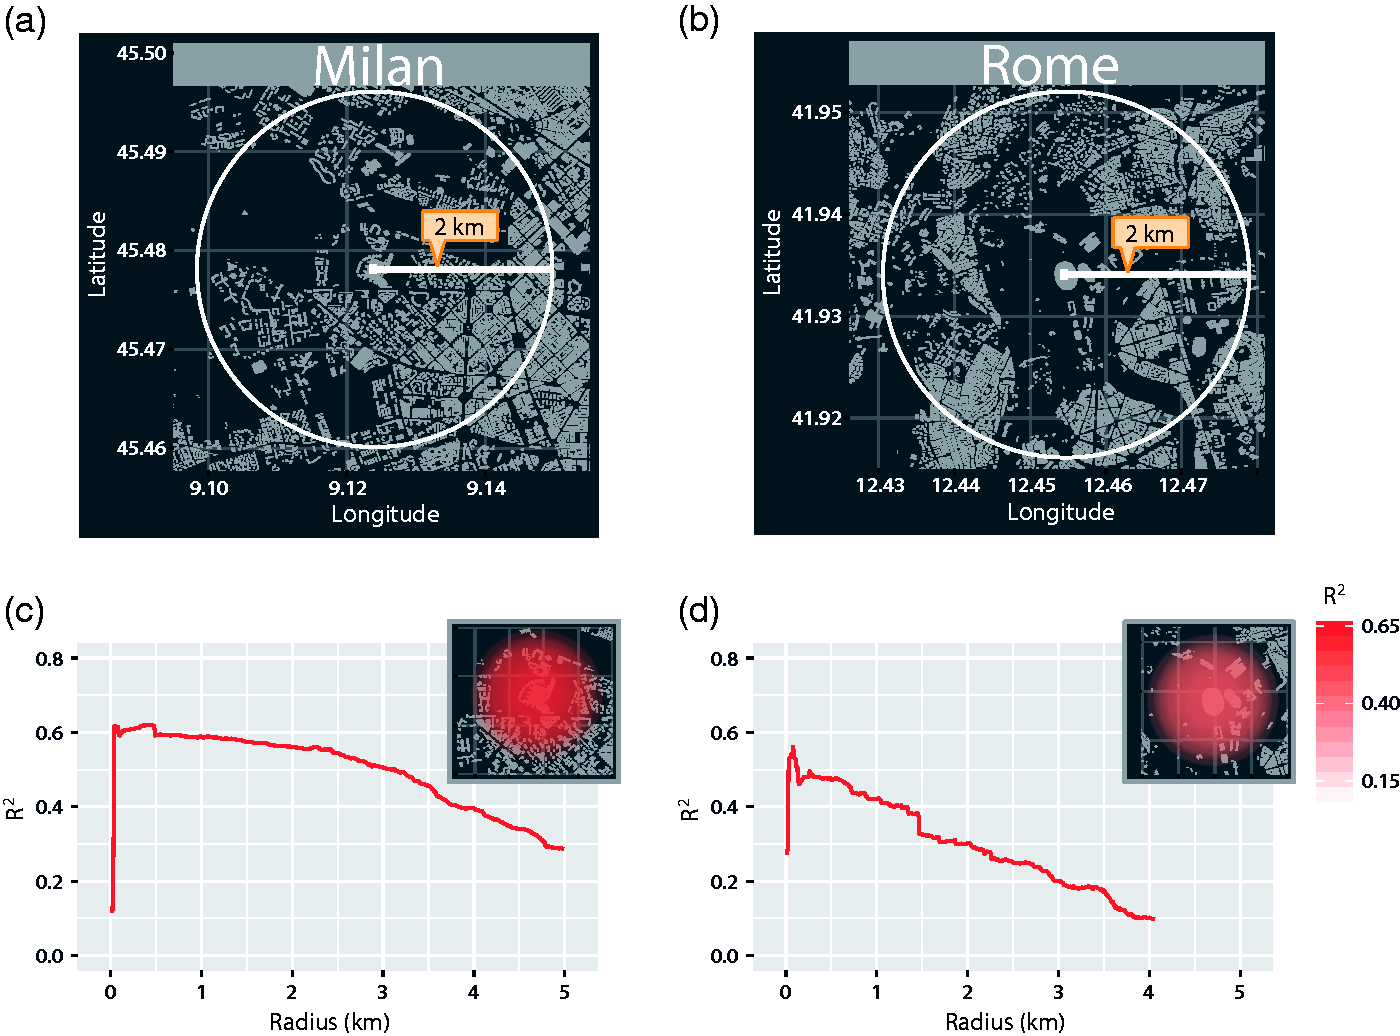
Investigating the role of the bounding box. (a,b) We investigate how the strength of the relationship varies as we change the size of the bounding box around the football stadiums. We consider circles centred on the football stadiums of increasing radius. For each radius, we consider users that have uploaded at least one photo to Instagram inside the corresponding circle and investigate the relationship between the number of users and the number of attendees at football matches. We examine radii varying from 10 metres to 5 kilometres in steps of 10 metres, and we only depict results where the relationship is statistically significant (p < 0.05, ordinary least squares regression). As before, the time window used to count users begins one hour before the football match and ends four hours later. (c,d) We depict here how the coefficient of determination R2 varies when we increase the size of the circle around the two football stadiums. In the two insets, we present a map of how the correlation changes within a 750 metre radius of the two stadiums. We observe some differences in the two case studies: whereas in Milan the correlation decreases smoothly as we consider larger areas, in Rome we find a more fragmented change. This may be due to the different location of the two stadiums inside the city, with Rome’s stadium being close to tourist attractions from which Instagram users commonly upload photos. This analysis underlines the importance of carefully assessing the spatial context of the area in question when calibrating the model. All maps in this figure were created using map data from OpenStreetMap.
We carry out the same analysis as before, counting the number of active users during football matches and comparing it to the number of attendees. For this analysis, we do not separate by season but consider the entire time period of one year. We vary the size of the radius from 10 metres to 5 kilometres in steps of 10 metres. Figure 3 depicts the results of this analysis in both stadiums. In Milan, the R2 values (Figure 3(c)) exhibit a slow and smooth decrease with increasing radius. In Rome, the R2 values exhibit a faster and more jolted decay as the radius increases (Figure 3(d)). This difference may arise from the different contexts in which the two stadiums are located. In particular, the stadium in Rome is close to areas with high concentrations of tourists. A more detailed comparison between the two locations in Rome and Milan can be found in online Supplementary Figure 4. In summary, our results highlight that when trying to infer crowd sizes from social media data alone, the coordinates of a bounding box should be determined in the context of a careful analysis of the nature of the surrounding area.
Selecting an appropriate time window for analysis
Our findings also depend on the time window used to count users who have been active on Instagram during a football match. A longer time window may capture users who are active before and after the match, but may also capture users who are in the proximity of the stadium for other reasons thus introducing additional noise. In all analyses so far, we have counted users who were active at least once in a window of four hours starting one hour before the match. We now consider time windows of varying lengths which start at different times, from up to one hour before the match. We define a starting time and a length, and count the number of users who are active on Instagram during that time interval. We then compare this number to the number of attendees recorded at the corresponding match. Figure 4 depicts the results of this analysis. For each combination of length and starting time analysed, we depict the corresponding R2 value for a model estimating the number of attendees from the number of Instagram users. For Milan, we find that the relationship is strongest when the time window corresponds as closely as possible to the duration of the match. For Rome we observe that considering a period of time both before and during the match increases the strength of the relationship. In online Supplementary Figure 12, we present the same analysis at a finer temporal resolution, and also consider time periods earlier than an hour before the match.
Investigating the effect of the time window. We investigate the impact of changing the size of the time window used to count users active on Instagram during a football match. In the figure, the bars extend from the start of the time window until the end point. For example, the top bar starts at the beginning of the match and extends for 30 minutes. In the corresponding analysis, we count all unique users who have been active on Instagram during the time window and compare this to the official number of attendees for that match. The colour of the bar indicates the R2 value for a model estimating the number of attendees from the number of Instagram users identified as active in the stadium during the selected time period. For this analysis, we consider a football match to be 105 minutes long, including a 15-minute half-time break. Here, we analyse data from up to one hour before the match. For Milan, we find that the strength of the relationship is highest when the time window aligns with the duration of the match. For Rome, we observe that considering Instagram users who are active before as well as during the match increases the strength of the relationship.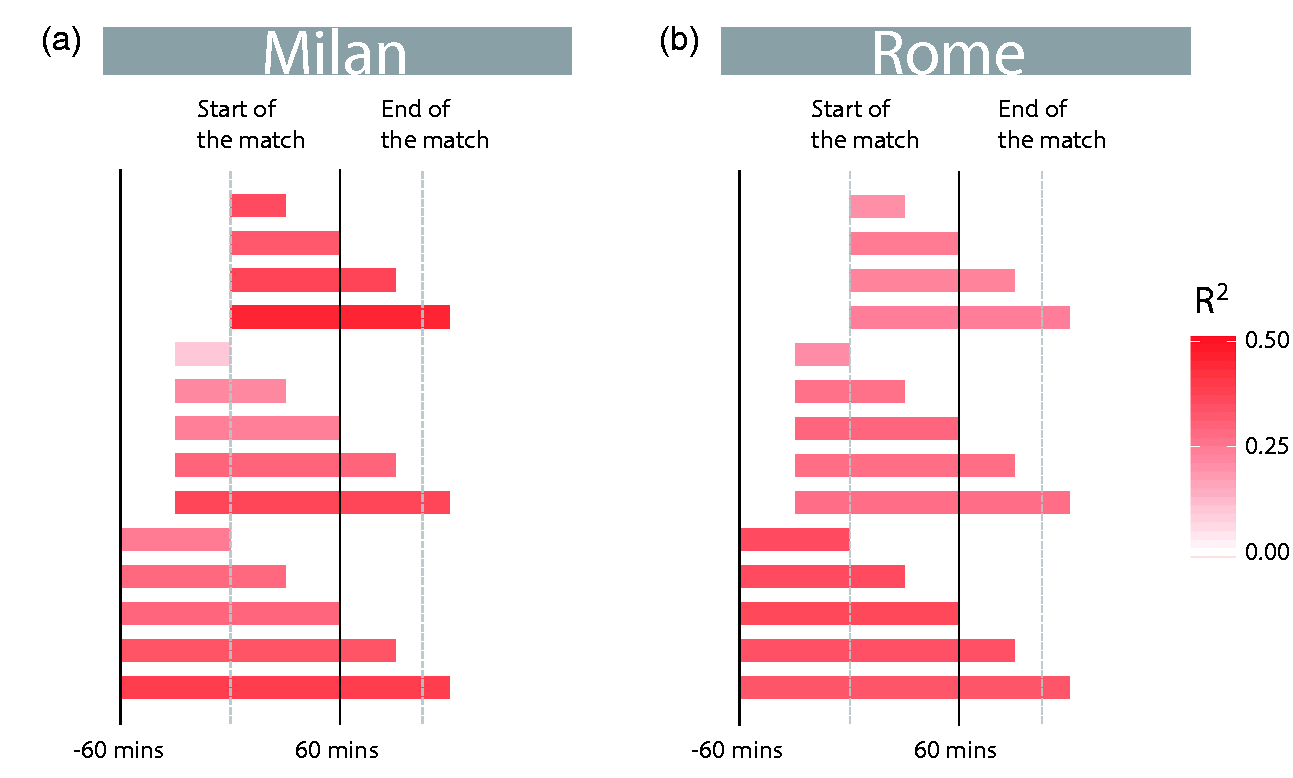
Conclusion
Being able to measure the size of a crowd can be of vital importance in emergency situations. However, crowd size estimation has traditionally been a resource-intensive task, requiring human analysts to count individuals using visual footage of a crowd. The analysis we present here provides evidence that data generated through interactions with the photo sharing platform Instagram can be used to generate estimates of the size of a crowd. In particular, we illustrate how the choice of time period and geographic area analysed can impact the outcome of such an analysis. We also demonstrate how we can account for changes in the usage of a social media platform over time, and how estimates of the size of a crowd can be generated in a practical setting by using historic data only. Additionally, our analysis is based on data from photographs which would have been available in real time at the moment the analysis was carried out, thus allowing for real-time estimates of the size of the crowd. This would be of great importance in providing a timely assessment of emergency situations. More broadly, our analysis provides further evidence that data generated with our everyday interactions with the Internet and social media platforms can be used to generate accurate and rapid estimates of the current state of society. Future work could investigate whether data from social media might also provide insights into how crowds gather, and hence facilitate predictions of crowd sizes before events occur.
The findings we present here have some limitations. Most notably, our analyses relate to football matches only. To determine the relationship between Instagram usage and crowd size in other scenarios would require access to further ground truth data on the number of people present in comparable situations. However, in situations where ground truth data are available to relevant stakeholders but with a delay, the type of model we introduce here could be trained and used to generate rapid estimates of crowd size, and thereby inform decisions that cannot wait for more time consuming estimates to arrive. We also note that overall usage of particular social media platforms such as Instagram is likely to differ between countries. The approach we describe here for calibrating for current usage levels could help address this problem and lead to a more robust approach.
Our findings hold potential value for a range of stakeholders and policy makers who may need to generate quick estimates of the size of a crowd for a wide range of reasons, including the avoidance of crowd disasters and to facilitate emergency evacuations.
Supplemental Material
Supplemental material for Measuring the size of a crowd using Instagram
Supplemental Material for Measuring the size of a crowd using Instagram by Federico Botta, Helen Susannah Moat and Tobias Preis in Environment and Planning B: Urban Analytics and City Science
Footnotes
Declaration of conflicting interests
The author(s) declared no potential conflicts of interest with respect to the research, authorship, and/or publication of this article.
Funding
The author(s) disclosed receipt of the following financial support for the research, authorship, and/or publication of this article: FB acknowledges the support of Research Councils UK via Grant EP/E501311/1. HSM and TP acknowledge the support of the Research Councils UK via Grant EP/K039830/1. FB, HSM and TP also gratefully acknowledge the support of the University of Warwick and the ESRC via Grant ES/M500434/1. HSM and TP were also supported by The Alan Turing Institute under the EPSRC Grant EP/N510129/1 via Turing awards TU/B/000006 (HSM) and TU/B/000008 (TP).
Supplemental material
Supplemental material for this article is available online.
References
Supplementary Material
Please find the following supplemental material available below.
For Open Access articles published under a Creative Commons License, all supplemental material carries the same license as the article it is associated with.
For non-Open Access articles published, all supplemental material carries a non-exclusive license, and permission requests for re-use of supplemental material or any part of supplemental material shall be sent directly to the copyright owner as specified in the copyright notice associated with the article.