
Abstract
Insulin sensitivity, pancreatic β-cell function, fasting glucose, and 2-h post-load glucose were related to cognition in cognitively healthy nondiabetic older adults. Thirty-five adults (⩾65 years) underwent a 2-h oral glucose tolerance test and cognitive testing. Seventeen had normal glucose tolerance and 18 had intermediate hyperglycaemia or prediabetes (World Health Organization criteria). Fasting glucose and 2-h post-load glucose and oral glucose tolerance test–derived measures of β-cell function (oral disposition index) and insulin sensitivity were analysed as predictors of four cognitive domains: verbal episodic memory, verbal fluency, executive function, and working memory. The prediabetes group had significantly worse working memory performance than the normal glucose tolerance group. Controlling for age and education, decreased oral disposition index, and increased 2-h post-load glucose were significantly related to worse working memory performance. Prediabetes may worsen working memory in healthy older adults. Reduced pancreatic β-cell function should be investigated as a contributor to age-related cognitive decline.
Introduction
Prediabetes is a condition of intermediate hyperglycaemia that is highly prevalent in older adulthood (DECODE Study Group, 2005). Characterised by fasting and/or postprandial glucose levels that are higher than normal but lower than levels diagnostic for diabetes, prediabetes may increase risk for cognitive decline. Increased fasting and 2-h post-load glucose have been related to worse cognition in older adults (Convit et al., 2003; Kerti et al., 2013). Normal fasting and postprandial glucose levels are dependent upon peripheral tissues that are sensitive (and not resistant) to the action of insulin and upon the ability of pancreatic β-cells to respond to elevated glucose and produce insulin proportionate to the degree of insulin resistance (Dinneen et al., 1992). The extent to which insulin sensitivity and pancreatic β-cell function contribute to cognitive function in older adults is not well understood.
Decreased insulin sensitivity and reduced pancreatic β-cell function contribute to hyperglycaemia with age (Chang and Halter, 2003; Scheen, 2005). However, decreased insulin sensitivity may not be due to biological ageing per se but lack of physical activity and poor diet, behaviours that can increase abdominal adipose tissue and decrease muscle mass (Ferrannini et al., 1996; Scheen, 2005). In contrast, reduced pancreatic β-cell function may be a consequence of biological ageing. When controlling for measures of adiposity, nondiabetic older relative to younger adults were found to express insulin secretory defects (Basu et al., 2003; Iozzo et al., 1999).
Even though pancreatic β-cell function may be sensitive to the effects of ageing, few studies have investigated β-cell function as a predictor of cognition in older adults. One study reported an association between increased pancreatic β-cell function, assessed using the homeostatic model assessment of β-cell function (HOMA-B), and worse executive control (Laws et al., 2017). Because HOMA-B should be interpreted in the context of insulin resistance (Wallace, Levy, and Matthews, 2004), this finding is difficult to interpret. Healthy pancreatic β-cells produce insulin in proportion to the level of insulin resistance; thus, an increased HOMA-B could be normal or abnormal depending upon the level of insulin resistance. An increased insulin response may be insufficient if insulin resistance is disproportionately higher, and a decreased response may be normal if insulin sensitivity is excellent (Wallace et al., 2004).
Maintaining normal insulin sensitivity may also be important for healthy cognition in older adults. Increased insulin resistance in nondiabetic adults has been related to worse verbal episodic memory (Laws et al., 2017), fluency (Benedict et al., 2012), and executive function (Laws et al., 2017; Tan et al., 2011). Less studied in older adults has been the relationship between insulin resistance and working memory, a cognitive ability known to be affected by ageing (Bopp and Verhaeghen, 2005).
In this study, we examined the relationship of pancreatic β-cell function and insulin sensitivity to cognition in a nondiabetic older adult sample (M = 70.89, range 65–79; n = 35) where 17 participants had normal glucose tolerance (NGT) and 18 had intermediate hyperglycaemia (IH), according to the World Health Organization (WHO) criteria (WHO/International Diabetes Federation (IDF), 2006). We hypothesised that decreased pancreatic β-cell function and decreased insulin sensitivity would be related to worse episodic memory, verbal fluency, executive function, and working memory. We tested the relationship of fasting glucose and 2-h post-load glucose to cognition and anticipated that both would be related to worse cognition consistent with past studies. Because elevated fasting glucose within the prediabetes range is a feature of the metabolic syndrome, a complex of multiple interrelated metabolic risk factors for cardiovascular disease and diabetes (Alberti et al., 2009), we also explored the relationship between a metabolic syndrome score and cognitive performance.
Materials and methods
Participants
Adults ⩾65 years of age were recruited from the metropolitan Atlanta, GA, USA, area through ads placed in local magazines and newspapers and participant databases held by researchers at the School of Psychology at the Georgia Institute of Technology. Individuals were excluded if they reported a history of: (a) diabetes (or taking anti-diabetes medication), (b) hypoglycaemia, (c) myocardial infarction, (d) pulmonary disease, (e) stroke, (f) major neurologic disorder, (g) significant head trauma, (h) history of chemotherapy, or (i) current nicotine use. Adults were screened for cognitive impairment and dementia over the phone using the Short Blessed Test of memory and concentration (Katzman et al., 1983) and in-person using the Mini-Mental State Examination (MMSE) (Folstein et al., 1975). Individuals scoring ⩾7 on the Short Blessed and <25 on the MMSE were excluded. People were also excluded if systolic blood pressure was ⩾150 mm Hg or diastolic blood pressure was ⩾90 mm Hg, suggesting uncontrolled hypertension (James et al., 2014), or if fasting glucose was ⩾126 mg/dL or 2-h post-load glucose was ⩾200 mg/dL, indicating diabetes (American Diabetes Association, 2010; WHO/IDF, 2006).
The initial sample included 41 older adults. Four people were excluded from analyses because their 2-h post-load glucose was later found to be in the diabetic range (i.e. ⩾200 mg/dL). One participant who did not complete 50% of the cognitive tasks and another who failed to report stroke prior to recruitment were also excluded leaving a final sample of 35 participants, where 17 had NGT and 18 had prediabetes, according to WHO criteria (WHO/IDF, 2006) (see Table 1 for demographic and health characteristics). The WHO defines prediabetes as a condition of IH, determined by an individual’s fasting and/or 2-h post-load glucose (i.e. glucose measured 2 h after a 75-g glucose load). NGT is defined as fasting glucose <110 mg/dL and 2-h post-load glucose <140 mg/dL and IH as fasting glucose between 110 and 125 mg/dL and/or 2-h post-load glucose between 140 and 199 mg/dL.
Sample characteristics and differences between normal glucose tolerance (NGT) and intermediate hyperglycaemia (IH) groups. Results stratified by sex. Data presented are mean values (standard deviations) or counts (%).

P-values for significant results (p < .05) are bold and italic.
BMI: body mass index; SBP: systolic blood pressure; DBP: diastolic blood pressure; HDL-C: high-density lipoprotein–cholesterol; GDS: Geriatric Depression Scale; PASE: Physical Activity Scale for the Elderly.
White = 22 (62.9%), Black = 10 (28.6%), Native Hawaiian or other Pacific Islander = 1 (2.9%), Indigenous American = 0, Asian = 0, and Other = 2 (5.7%).
Alcohol consumption (drinks per week): none-slight = 0–6; mod (i.e. moderate) = 7–14; heavy >14. A drink was defined as 12 ounces of beer, 4 ounces of wine, or 1.5 ounces of distilled spirits (US Department of Health and Human Services and US Department of Agriculture, 2015).
Procedure
Individuals fasted for at least 8 h overnight and abstained from caffeine before visiting the Atlanta Clinical and Translational Science Institute’s (ACTSI) Clinical Research Center (CRC) unit at Grady Health System in Atlanta, GA, USA. Clinical research nurses measured blood pressure, height, weight, waist circumference, and capillary blood glucose and administered a 2-h oral glucose tolerance test (OGTT). The OGTT was only initiated in people who had a fasting capillary blood glucose that did not suggest diabetes (i.e. ⩾126 mg/dL). To prevent multiple venipunctures during the OGTT, an intravenous portal kept patent with saline was utilised for blood collection at fasting and 30, 60, 90, and 120 min following ingestion of 75 g glucose. Serum and plasma collected throughout the OGTT were tested for insulin and glucose, respectively, and fasting serum was also tested for high-density lipoprotein and triglycerides. Laboratory testing was conducted at the Laboratory Corporation of America (Birmingham, AL, USA). Insulin was analysed on a Roche E-170 using an electro-chemiluminescence immunoassay (ECLIA), and glucose was measured on a Roche Integra 800 using a hexokinase enzymatic method. Participants completed demographic and health questionnaires and the Physical Activity Scale for the Elderly (PASE) (Washburn et al., 1993). Within 1 week after the OGTT, the majority of participants (91.4%) completed cognitive tests and the Geriatric Depression Scale–Short Form (Yesavage et al., 1983) at the Georgia State/Georgia Tech Center for Advanced Brain Imaging. The remaining participants, who were unable to return within 1 week, were tested within 3 weeks. Study procedures were approved by the Institutional Review Board at the Georgia Institute of Technology and the Research Oversight Committee at Grady Health System. All individuals provided informed consent before participating in the study. Participants received US$100 as compensation for participation in the study.
Measures
Insulin sensitivity
Measures of insulin sensitivity included the updated HOMA-IR model (HOMA2-IR) (Wallace et al., 2004) and the Matsuda index (Matsuda and DeFronzo, 1999). We utilised HOMA2-IR because it has been calibrated to be consistent with more recent insulin assays than the original HOMA-IR method. To obtain HOMA2-IR, fasting insulin and glucose values were entered into the HOMA calculator version 2.2.3 (https://www.dtu.ox.ac.uk/homacalculator/). The Matsuda index utilises glucose and insulin measures collected across the OGTT. It is the reciprocal of the square root of the product of fasting insulin, fasting glucose, total area-under-the-glucose-curve (AUCglu) and total area-under-the-insulin-curve (AUCins): 1000/square root (fasting glucose × fasting insulin × total AUCglu × total AUCins). The Matsuda index was calculated by entering OGTT insulin and glucose values (i.e. fasting and 30, 60, 90, and 120-min post-glucose load) into a Matsuda index calculator (http://mmatsuda.diabetes-smc.jp/english.html). HOMA-IR assesses hepatic insulin resistance (Muniyappa et al., 2008), and the Matsuda index measures whole-body insulin sensitivity (Matsuda and DeFronzo, 1999). Both indices of insulin sensitivity have shown moderate to strong correlations with clamp-derived whole-body insulin sensitivity measures in people with normal and impaired glucose tolerance (Abdul-Ghani et al., 2007; Matsuda and DeFronzo, 1999; Wallace et al., 2004). Higher HOMA2-IR indicates relatively higher insulin resistance, and higher Matsuda index indicates relatively higher insulin sensitivity.
Pancreatic β-cell function
Pancreatic β-cell function was measured using an oral disposition index (DIo) that was calculated by multiplying total AUCins:total AUCglu (AUCins/gluc) (an insulin secretion measure) with the Matsuda index. Recent work has indicated that DIo, which is derived from insulin and glucose collected throughout the OGTT, is a promising measure of pancreatic β-cell function that can be utilised when data from an intravenous glucose tolerance test (IVGTT) are not available (Retnakaran et al., 2008; Santos et al., 2016). Total AUCins/gluc × Matsuda index has been significantly and modestly related to the DI obtained from an IVGTT (Retnakaran et al., 2009; Santos et al., 2016). It has discriminated between NGT, impaired glucose tolerance and type 2 diabetes groups, declining from normal to diabetes, and illustrating a progressive loss of β-cell function and decreased insulin secretion in the context of increasing insulin resistance (Retnakaran et al., 2008; Santos et al., 2016).
According to Kahn et al. (1993), the DI is a valid measure of pancreatic β-cell function if a rectangular hyperbolic relationship between insulin secretion and insulin sensitivity can be established. This is done by regressing insulin secretion on insulin sensitivity and finding a β coefficient for insulin sensitivity that is approximately equal to −1 and a 95% confidence interval (CI) that does not include 0. We used linear regression to estimate the relationship between log-transformed Matsuda index and log-transformed total AUCins/gluc. The β coefficient for Matsuda index was −.73 (95% CI = −.51 to −.95). To further illustrate the validity of the DIo in our sample, we plotted the raw (not log-transformed) data to demonstrate that the two measures approximated a rectangular hyperbola (see Figure 1) and correlated total AUCins/gluc × Matsuda index with measures of insulin sensitivity, fasting glucose, and 2-h post-load glucose. Increased total AUCins/gluc × Matsuda index (representing relatively healthy pancreatic β-cell function) was positively related to insulin sensitivity (Matsuda index: r = .40, p = .02) and negatively related to insulin resistance (HOMA2-IR: r = −.57, p < .001), fasting glucose (r = −.60, p < .001) and 2-h post-load glucose (r = −.46, p = .005) (other than fasting glucose and 2-h post-load glucose, measures were log-transformed prior to performing Pearson’s correlations).

Scatter plot of total-area-under-the-insulin-curve to total-area-under-the-glucose-curve (AUCins/glu) (insulin secretion) versus Matsuda index (insulin sensitivity).
Metabolic syndrome score
Clinical measures used to determine a diagnosis of metabolic syndrome (i.e. waist circumference, triglycerides, high-density lipoprotein–cholesterol (HDL-C), systolic and/or diastolic blood pressure, and fasting glucose) were evaluated according to their categorical cut-points (Alberti et al., 2009). A measure at or over its diagnostic threshold received a score of 1 (e.g. HDL-C <40 mg/dL in males or waist circumference ⩾80 cm in females was scored as 1). Systolic and diastolic blood pressures were considered together: systolic pressure ⩾130 mm Hg and/or diastolic pressure ⩾85 mm Hg received a score of 1. Scores were summed, and the highest possible score was 5.
Cognitive function
The following cognitive domains were analysed as outcome variables: verbal episodic memory, verbal fluency, executive function, and working memory. Verbal episodic memory was measured using Logical Memory I and II and Verbal Paired Associates I and II from the Wechsler Memory Scale–Fourth Edition (WMS-IV) (Wechsler, 2008b). For Logical Memory, participants recalled a story previously read to them. In Verbal Paired Associates, participants heard a list of word pairs (e.g. mirror-truck) and recalled the corresponding word upon hearing the first word in the pair. In both Logical Memory and Verbal Paired Associates, memory was tested immediately and following a delay in the presentation of material (I = immediate recall and II = delayed recall). Verbal fluency, both phonemic and semantic, was measured using the Controlled Oral Word Association Test (COWAT) (Benton and Hamsher, 1976). In the phonemic fluency task, participants stated within a specific time period as many words as possible beginning with a particular letter (C, F, or L). The semantic fluency task was similar, except that participants named as many words as possible from a particular category (e.g. animal). We tested the task-switching and response inhibition components of Executive function, using, respectively, the Trail Making Test Part B (Reitan, 1955) and the Stroop Test (Victoria version) (Strauss et al., 2006). In the Trail Making Test Part B, participants connected 25 numbers and letters in ascending order by alternating numbers and letters (i.e. 1-A-2-B-3-C). For the Stroop Test, participants stated the colour of words (each describing a colour) which were printed in an incongruent colour (e.g. the word ‘green’ printed red). Because executive function tests measured time taken to complete the task, scores were multiplied by −1 to be congruent with other cognitive scores where higher values depicted better performance. Working memory was measured using three memory span tasks: Symbol Span (WMS-IV) (Wechsler, 2008b) and Digit Span (forward and backward) from the Wechsler Adult Intelligence Scale–Fourth Edition (WAIS-IV) (Wechsler, 2008a). For Symbol Span, the participant had to identify the order, from left to right, of an array of abstract symbols previously presented. In Digit Span Forward, participants listened to a series of numbers and recalled them in the same order given. In Digit Span Backward, participants recalled the series in the reverse order.
Because one participant did not complete Verbal Paired Associates I and II or Symbol Span and another did not complete Verbal Paired Associates II, we performed data imputation using the participant’s standardised test scores from the same cognitive domain where data were missing. A participant’s Logical Memory I and II data were used, respectively, to replace missing Verbal Paired Associates I and II scores. Similarly, a participant’s Digit Span Backward score was used to replace a missing Symbol Span score. The missing score (e.g. for Verbal Paired Associates I) was replaced with a raw score that resulted in a standard score that was equivalent to the participant’s standard score on the similar cognitive test (e.g. for Logical Memory I). Measures within each domain from all participants were standardised and summed to produce four composite scores: verbal episodic memory, verbal fluency, executive function, and working memory. Each composite was tested individually as an outcome.
Statistical approach
To characterise the sample, we used two-way analysis of variance (ANOVA) to examine glucose tolerance status (NGT vs IH), sex and glucose tolerance status × sex differences in continuous demographic, health, and behavioural variables. Chi-square was used to determine glucose tolerance status and sex differences in categorical variables (sex, race, smoking, and alcohol consumption). We used one-way ANOVA to detect glucose tolerance status (NGT vs IH) differences in cognitive composites. Power to detect a medium-sized effect (d = 0.5) between two groups in a sample of 35 using one-way ANOVA was 30%. Repeated measures ANOVA was used to determine group differences in glucose and insulin during the OGTT. Power to detect a medium-sized (f = .25) within-between interaction in an analysis of 35 participants with five repeated measures was 97%. Multiple linear regression models were performed to test the linear relationship of pancreatic β-cell function, insulin sensitivity, fasting glucose, 2-h post-load glucose, and metabolic syndrome score to cognitive outcomes. Age and education were controlled in each model. We had 60% power to detect a medium effect (f2 = .15) of a single coefficient in a regression model with three predictors. All previously described estimates of power were determined using G*Power 3.1.9.7 (Faul et al., 2007). As is customary (e.g. Retnakaran et al., 2008; Santos et al., 2016), HOMA2-IR, Matsuda index, and total AUCins/glu × Matsuda (i.e. DIo) were log-transformed due to skewness. Measures of insulin sensitivity, pancreatic β-cell function, fasting glucose, 2-h post-load glucose, and metabolic syndrome were tested independently in separate models. We utilised a p-value < .05 to indicate statistical significance for all tests.
Results
Between-group differences
The NGT and IH groups did not significantly differ on age or education or behavioural characteristics (smoking, alcohol consumption, exercise, and depression) (Table 1). There were no glucose tolerances status differences in sex, χ2(1) = .02 and p = .88. The IH group had significantly greater increases than the NGT group in both glucose and insulin during the OGTT, beginning, respectively, at 60 and 90 min (see Figure 2). As expected, because of how the groups were defined, 2-h post-load glucose was significantly higher in the IH group compared to the NGT group; however, the groups did not significantly differ in level of fasting glucose. In the IH group (n = 18), 17 participants had a 2-h post-load glucose between 140 and 199 mg/dL and only one participant had a fasting glucose between 110 and 125 mg/dL. The groups did not significantly differ in HOMA2-IR or DIo, but there was a trend (p = .09) for the IH group to have relatively lower Matsuda index (or lower whole-body insulin sensitivity). Regarding metabolic syndrome factors, the IH group had a significantly larger waist circumference and higher triglycerides than the NGT group. The metabolic syndrome score was also significantly higher in the IH compared to the NGT group. The IH group had a higher body mass index (BMI) than the NGT group. Group differences in BMI, metabolic syndrome risk factors, and 2-h post-load glucose were not moderated by sex. Most importantly, the IH group had a significantly worse working memory composite score than the NGT group, F(1,33) = 9.85, p = .004, η2 = .23 (Table 2 and Figure 3). When examining group differences in individual test scores, we found that the IH group performed significantly worse in two working memory span tasks: Digit Span Forward, F(1,33) = 4.49, p = .04, η2 = .12 and Digit Span Backward, F(1,33) = 12.31, p = .001, η2 = .27 (Table 2). Partial eta squared

Glucose (a) and insulin (b) differences between the normal glucose tolerance (NGT) and the intermediate hyperglycaemia (IH) groups (error bars represent 95% confidence intervals).
Cognitive performance differences between normal glucose tolerance (NGT) and intermediate hyperglycaemia (IH) groups. Data presented are mean values (standard deviations).

P-values for significant results (p < .05) are bold and italic.
I: immediate recall; II: delayed recall.
Sample size prior to data imputation.

Cognitive composite differences between the normal glucose tolerance (NGT) and intermediate hyperglycaemia (IH) groups. Cognitive composites represent sums of standardised test scores (error bars represent 95% confidence intervals). Results from individual tests within each cognitive domain were standardised and summed to produce composite scores: (a) Working memory: Symbol span and Digit Span (forward and backward). (b) Verbal episodic memory: Logical Memory I and II and Verbal Paired Associates I and II. (c) Verbal Fluency: phonemic and semantic fluency. (d) Executive function: Trail Making Test Part B and Stroop Test.
Pancreatic β-cell function and insulin sensitivity as predictors of cognition
The DIo and 2-h post-load glucose measures were significant predictors of working memory performance, but not other cognitive outcomes when controlling for age and education (Table 3). Decreased DIo and increased 2-h post-load glucose were significantly related to worse working memory composite scores (see Figure 4 for a scatter plot of the bivariate relationship of pancreatic β-cell function and 2-h post-load glucose to the working memory composite). The insulin sensitivity measures (Matsuda index and HOMA2-IR), fasting glucose, and the metabolic syndrome factor score did not significantly predict any of the cognitive measures in the multiple linear regression models (all ps > .05).
Relationship of measures of glucose homeostasis and metabolic syndrome score to the working memory composite controlling for age and education.
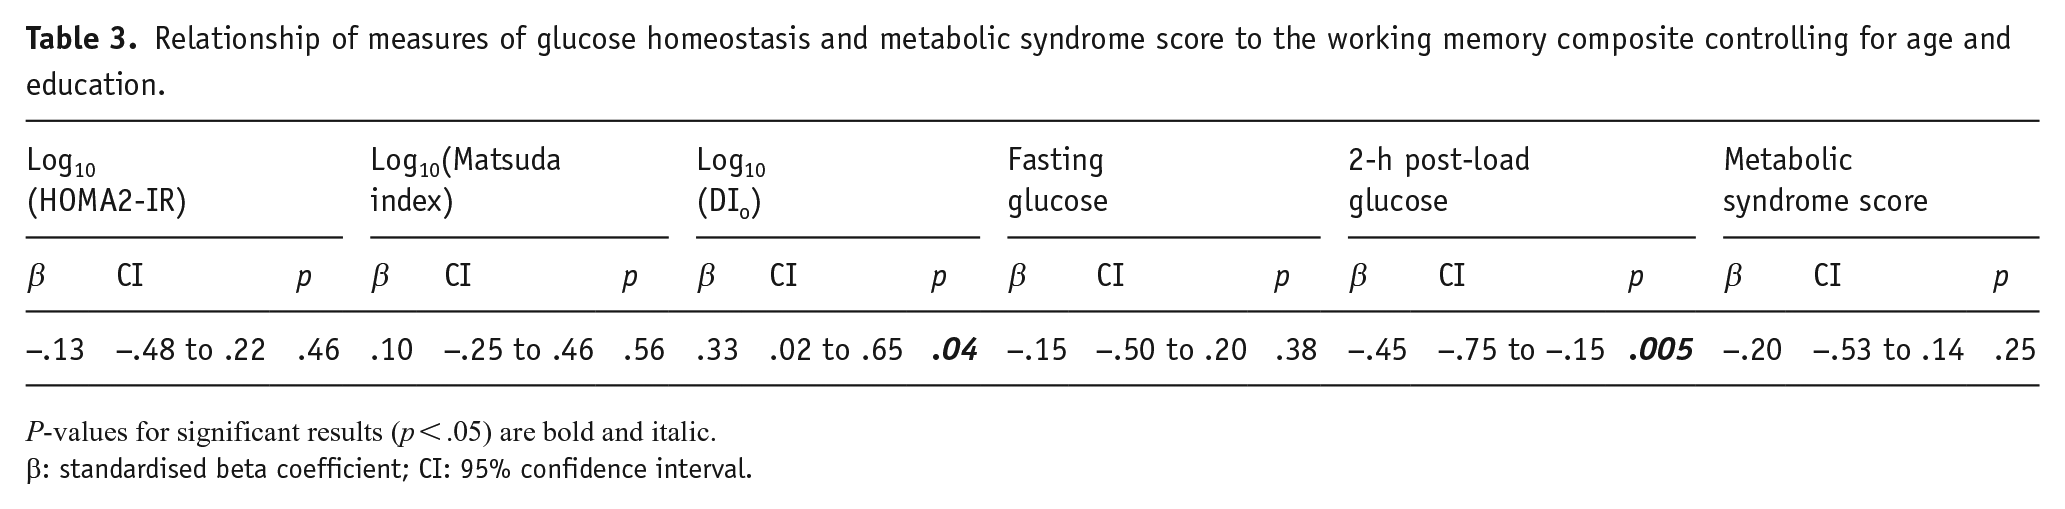
P-values for significant results (p < .05) are bold and italic.
β: standardised beta coefficient; CI: 95% confidence interval.

Bivariate correlation of (a) Log10(oral disposition index) and (b) 2-h post-load glucose (mg/dL) to working memory composite.
Discussion
In this study, we found that the IH group had worse working memory performance than the NGT group. When examining specific measures of glucose homeostasis, we found that higher 2-h post-load glucose and lower DIo were significantly related to worse working memory performance, when controlling for age and education in our nondiabetic older adult sample. These findings add to the accumulating evidence that prediabetes contributes to worse cognition in older adulthood (Convit et al., 2003; Kerti et al., 2013) and extends past research by relating lower DIo, indicative of relatively impaired pancreatic β-cell function, to worse working memory.
Hyperglycaemia, whether due to higher fasting or postprandial glucose, places individuals at risk for cerebral microvascular disease – a condition that has been related to impaired cognition over time (Marcovecchio, 2017; Prins and Scheltens, 2015; Wong et al., 2002). Peripheral and central changes in the microvasculature resulting from hyperglycaemia may be the result of advanced glycation endproducts (AGEs) (Marcovecchio, 2017), formed when glucose (or another simple sugar) reacts with the amino groups of proteins, lipids, or nucleotides (Singh et al., 2001). AGEs can directly damage vessel walls and interact with receptors throughout the body (e.g. receptors for AGEs: RAGEs), including neurons and glia in the brain, to increase oxidative stress and inflammation (Dhananjayan et al., 2018). Thus, AGEs may not only negatively affect the vasculature but also impact neural health, possibly facilitating neuronal degeneration and apoptosis (Juranek et al., 2015). Cross-sectional studies have provided initial evidence of an association of increased peripheral AGEs to cognitive impairment and lower grey matter volume in older adults with diabetes (Dhananjayan et al., 2018). Although type 2 diabetes has been found to increase risk for Alzheimer’s clinical syndrome, the pathological hallmarks of Alzheimer’s disease (i.e. β-amyloid plaques and neurofibrillary tau tangles) identified in post-mortem exam have not been found to differ between diabetic and nondiabetic adults (Pruzin et al., 2018). Type 2 diabetes is a well-recognised risk factor for cerebrovascular disease, including brain infarcts, and may increase risk for dementia, at least partly, through vascular mechanisms (Pruzin et al., 2018).
Relatively worse pancreatic β-cell function assessed using DIo was related to worse working memory performance in our healthy older adult sample. Consistent with the recognised association between impaired pancreatic β-cell function and postprandial hyperglycaemia, we found that lower DIo was related to higher 2-h post-load glucose. Reduced pancreatic β-cell function may facilitate working memory deficits through elevated postprandial glucose. We performed a post hoc analysis to investigate if 2-h post-load glucose mediated the relationship between DIo and the working memory composite. When 2-h post-load glucose was introduced as a predictor in the regression equation with DIo, age, and education as independent variables, DIo was no longer significant (β = .17, p = .32) and 2-h post-load glucose retained a significant negative association with the working memory composite (β = −.37, p = .03). Postprandial hyperglycaemia may mediate the relationship between reduced β-cell function and working memory performance; however, a longitudinal study would be necessary to test that assumption.
Past research indicates that inadequate insulin secretion due to pancreatic β-cell dysfunction may be a consequence of biological ageing (Chang and Halter, 2003; Scheen, 2005). Across several studies, older adults demonstrate reduced pancreatic β-cell responsiveness and less insulin secretion to glucose infusion relative to younger adults when variables that influence insulin secretion, such as BMI, insulin sensitivity, diet, or physical activity level, are controlled (Chang and Halter, 2003; Scheen, 2005). Pancreatic β-cell function may play an important role in cognitive ageing. Age-related insulin dysregulation may not only contribute to peripheral hyperglycaemia and subsequent cognitive dysfunction, but it may also have independent and direct effects upon neuronal function. Peripheral insulin crosses the blood brain barrier (Banks et al., 2012), binds to neuronal insulin receptors (Hopkins and Williams, 1997), and potentially influences synaptic functioning, such as neurite outgrowth, synaptic plasticity, and the development and maintenance of excitatory synapses (Arnold et al., 2018). That insulin may influence neural function is suggested by studies showing that the administration of intranasal insulin improves episodic memory in adults with and without cognitive impairment (Benedict et al., 2007; Claxton et al., 2015; Reger et al., 2008). However, there has been a lack of consistency in findings and some studies do not show an effect of insulin treatment upon cognition (Craft et al., 2020; Rosenbloom et al., 2020); additional research is needed to clarify whether insulin administration is beneficial for cognitive and brain function.
Our study findings should be interpreted in the context of study strengths and limitations. The IH group was found to have worse working memory composite scores than the NGT group even though both were well matched on important characteristics (e.g. age, education, and health factors) known to influence cognitive function. Use of the Short Blessed and MMSE to screen for cognitive impairment and dementia may have resulted in the selection of an IH group that had better cognitive functioning than what is found in the Atlanta GA population; consequently, our ability to detect significant between-group (NGT vs IH) differences in cognitive performance may have been limited. It is also worth noting that the IH group was qualitatively (not significantly) worse than the NGT group in all cognitive domains. In particular, although not statistically significant, average verbal episodic memory in the IH group was 1.84 standard deviation (SD) lower than in NGT participants. This moderate effect size warrants follow-up investigation. Moreover, multiple linear regression, controlling for age and education, indicated that increased 2-h post-load glucose was a significant predictor of poorer working memory performance. However, because our study was cross-sectional, we cannot assert that postprandial hyperglycaemia causes working memory impairment.
We did not find that insulin sensitivity assessed using the Matsuda index or HOMA2-IR predicted cognition. There is evidence that increased insulin resistance is related to worse verbal fluency, verbal memory, and executive function in middle-aged and older adults (Benedict et al., 2012; Laws et al., 2017; Tan et al., 2011). The relationship between insulin resistance and cognition may not have been significant because a minority of participants in our small sample had decreased insulin sensitivity. 22.9% had a Matsuda index less than 3.15, a mean value identified in individuals found to be insulin resistant using a hyperinsulinemic–euglycemic clamp (Lorenzo et al., 2015), and 28.6% had an HOMA2-IR >1.10, indicating increased insulin resistance (Wallace et al., 2004).
Unlike a previous longitudinal study demonstrating that a metabolic syndrome latent variable was related to worsening of fluid intelligence over time (Ghisletta et al., 2019), we did not find that a metabolic syndrome score was a significant predictor of cognition. It is possible that differing results could be due to differences in sample composition and analytical approach. We had a small sample of older adult participants, whereas Ghisletta et al. (2019) analysed a larger sample of adults across the adult lifespan. While multiple metabolic risk factors may combine or interact to amplify risk for cognitive impairment, a large epidemiologic study found that fasting hyperglycaemia – out of the five metabolic syndrome risk factors – was the major contributor to cognitive dysfunction (Dik et al., 2007). In line with that result, we found that hyperglycaemia as assessed using 2-h post-load glucose was related to worse working memory performance. Because the IH group significantly differed from the NGT group in triglycerides and waist circumference, we tested post hoc whether these factors were predictors of the working memory composite score and found that neither was significantly associated (ps > .23).
We did not find a relationship between fasting glucose and cognition. Fasting glucose relative to 2-h post-load glucose may have lower sensitivity to detect glucose intolerance in older adults. Although both fasting and 2-h post-load glucose levels rise with age, the magnitude of increase in 2-h post-load glucose is greater than that of fasting glucose, suggesting that the former may be a more sensitive measure of prediabetes in older adults (DECODE Study Group, 2005; Scheen, 2005).
2-h post-load glucose was significantly related to working memory and not any other cognitive domain. It is not clear why elevations in 2-h post-load glucose were not significantly associated with worse verbal memory and executive function, which have been related in past reports to hyperglycaemia (Kerti et al., 2013; Tan et al., 2011). Even though not significant, the IH group did have numerically worse performance than the NGT group on all verbal episodic memory tests and on the Trail Making Test Part B (see Table 2). Our small sample size may have limited our ability to detect small- to medium-sized effects. Because working memory and executive function are related constructs (Miyake et al., 2000), one might expect similar findings for both. However, to some extent, working memory is independent from (Miyake et al., 2000) and supported by the recruitment of different neural regions than those for executive function (Turner and Spreng, 2012). We speculate that working memory may be more sensitive to the effects of early prediabetes in healthy older adults than other cognitive domains. Prospective longitudinal studies are needed to test this assumption.
Unique to our study was the use of DIo to assess pancreatic β-cell function. We found that DIo was positively related to the working memory composite, suggesting that relatively healthy pancreatic β-cell function may be associated with better working memory in older adults. The DIo has been shown to be a surrogate measure of pancreatic β-cell function in young- and middle-aged adults (Retnakaran et al., 2008; Santos et al., 2016); however, it has not been similarly validated in an older adult sample. Although we demonstrated validity of DIo in our sample, the index should be validated in a large cohort of older adults with varying degrees of glucose tolerance. In contrast to DI derived from an IVGTT, DIo is a more practical means for assessing pancreatic β-cell function in epidemiological studies. Future validation in older adults is important considering that insulin secretion may decline with age (Basu et al., 2003; Iozzo et al., 1999).
Conclusion
We found that decreased pancreatic β-cell function and IH were predictors of worse working memory performance in healthy older adults. Prospective longitudinal studies are needed to study the relationship between declining β-cell function and cognition in nondiabetic older adults. Whether insulin secretion has direct effects on neuronal health in ageing should be investigated. Potential pathophysiological mechanisms, such as cerebral microvascular disease, linking glucose intolerance to age-related cognitive decline deserve further examination.
Footnotes
Acknowledgements
The authors thank Cherita Clendinen, research coordinator, for her contribution to this study.
Declaration of conflicting interests
The author(s) declared the following potential conflicts of interest with respect to the research, authorship, and/or publication of this article: G.E.E., U.S., and S.D.M. have nothing to declare. G.E.U. is partly supported by research grants from the Public Health Service (grants UL1 TR002378 from the Clinical and Translational Science Award program and 1P30DK111024-01 from the National Institutes of Health and National Center for Research Resources). G.E.U. has received unrestricted research support for inpatient studies (to Emory University) from Merck, Novo Nordisk, AstraZeneca, and Sanofi.
Funding
The author(s) disclosed receipt of the following financial support for the research, authorship, and/or publication of this article: This work was supported by the National Institute on Aging, one of the National Institutes of Health (T32 AG000175) and the National Center for Advancing Translational Sciences, also of the National Institutes of Health (UL1TR000454). The content is solely the responsibility of the authors and does not necessarily represent the official views of the National Institutes of Health.